On Musical Onset Detection via the S-Transform
Musical onset detection is a key component in any beat tracking system. Existing onset detection methods are based on temporal/spectral analysis, or methods that integrate temporal and spectral information together with statistical estimation and mac…
Authors: Nishal Silva, Chathuranga Weeraddana, Carlo Fischione
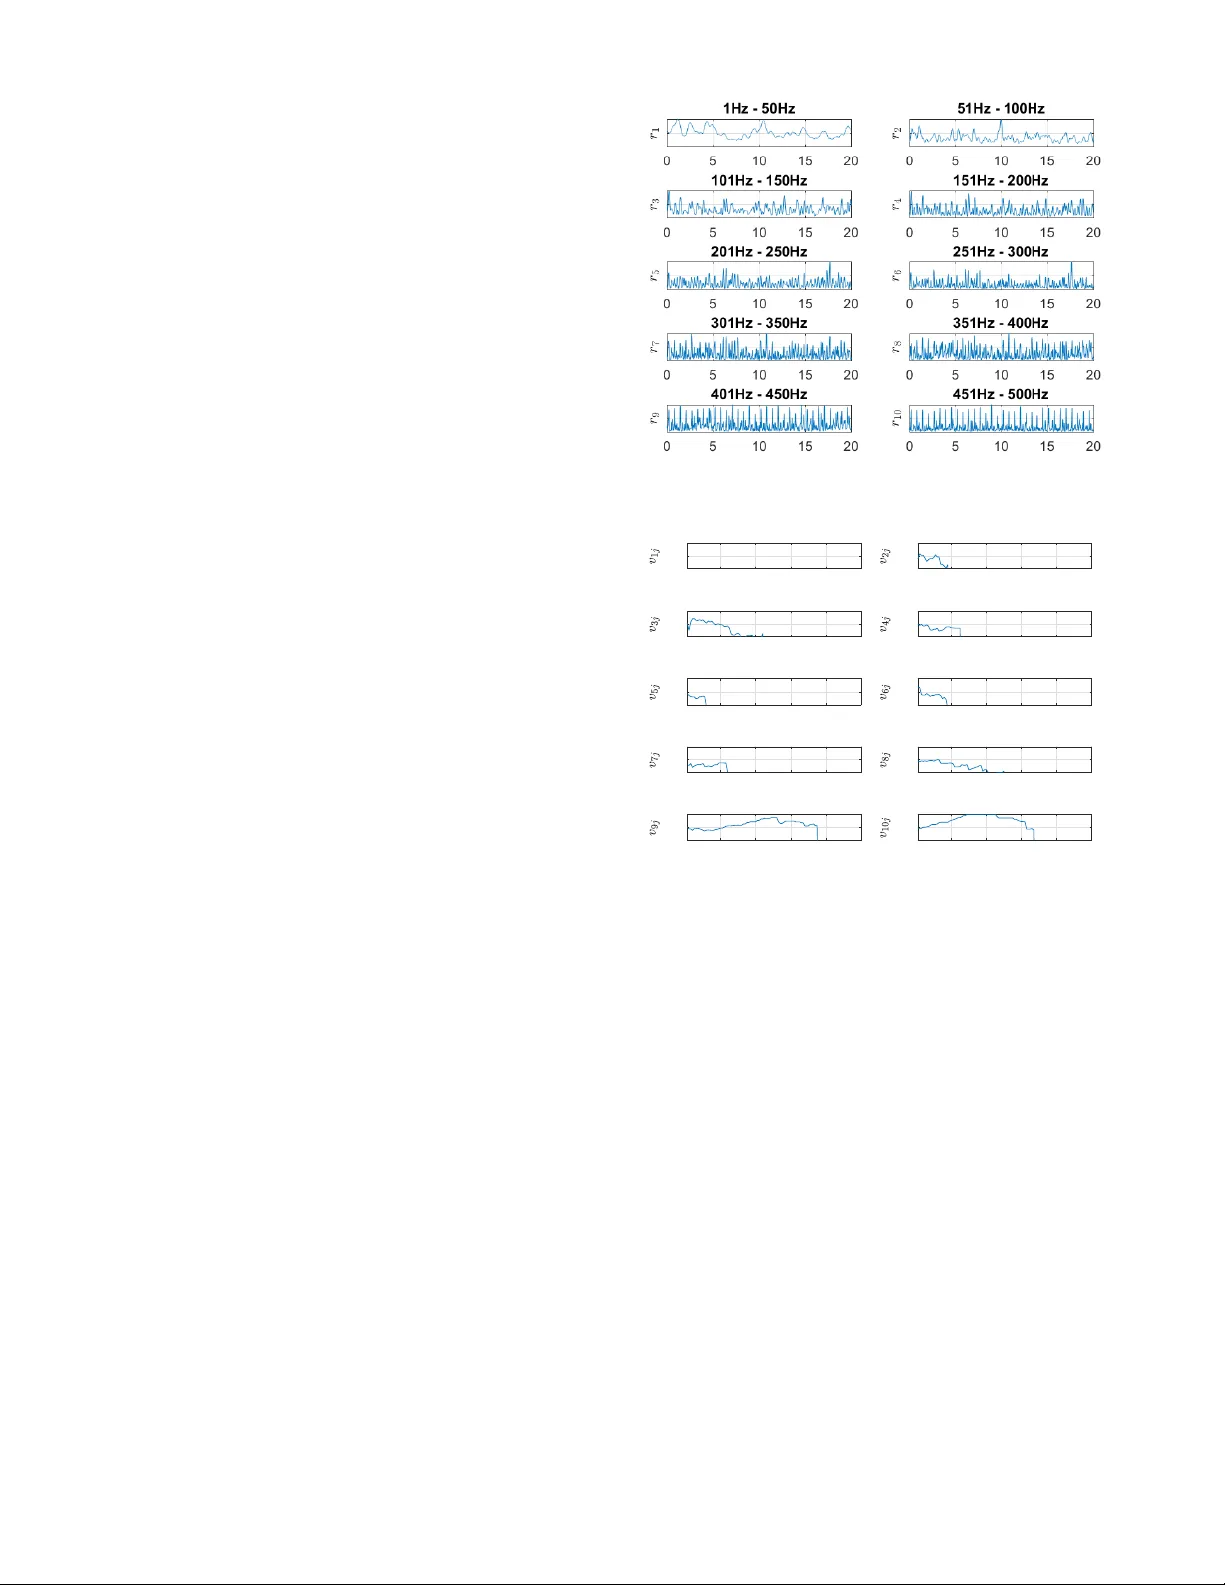
On Musical Onset Detection via the S-T ransform Nishal Silv a Dept. of Eng. and Mathematics Sheffield Hallam Univer sity Sheffield, UK b3047941@my .shu.ac.uk Chathuranga W eeraddana Dept. of Electr onic and T elecomm. Eng. University of Moratuwa Moratuwa, Sri Lanka chathurangaw@uom.lk Carlo Fiscione Dept. of Networks and Systems Eng. KTH Royal Institute of T echnology Stockholm, Sweden carlofi@kth.se Abstract —Musical onset detection is a key component in any beat tracking system. Existing onset detection methods are based on temporal/spectral analysis, or methods that integrate temporal and spectral information together with statistical estimation and machine learning models. In this paper , we propose a method to localize onset components in music by using the S-transf orm, and thus, the method is purely based on temporal/spectral data. Unlike the other methods based on temporal/spectral data, which usually rely short time Fourier transf orm (STFT), our method enables effective isolation of crucial frequency subbands due to the frequency dependent r esolution of S-transf orm. Moreo ver , numerical results show , even with less computationally intensive steps, the proposed method can closely r esemble the perf or - mance of more resource intensive statistical estimation based approaches. Index T erms —Onset detection, beat tracking, music, S- transform, time frequency representation I . I N T R O D U C T I O N When a human hears music, an action which is almost subconscious is the rhythmic tapping of the foot. These taps are consistent with the beat of the music and is measured in beats-per-minute (bpm). The process of detecting beat locations in a music is called beat tracking . Beat tracking is a vital step in man y studio and liv e music applications: for example, when a DJ should perform beat matching to play two songs successivel y . Beat matching is the adjustment of the tempo of one or multiple songs so that their beat locations ov erlap each other when played simultaneously . The same applies for an audio engineer whenev er two instrument tracks are to be played in unison. In this case the audio engineer needs to know the beat locations in both tracks to create a smooth playthrough. Beat of a music is maintained by a rhythm instrument. A beat usually corresponds to a rapid and unpredictable change in the underlying music signal. Therefore, a primary step in any beat tracking algorithm is to represent such changes, which is referred to as the beat causing onsets (BCO). Howe ver , isolating BCOs among others can be challenging. Existing onset isolation (detection) algorithms, based on temporal and spectral analysis, do not usually yield good results when the beat of a music is not prominent. A primary cause of this is the masking of f of important BCO components. Therefore, e xploring generalized mechanisms for BCO detec- tion in music, is important in theory , as well as in practice, and therefore deserve inv estigation. Blending the existing temporal and spectral analysis methods with statistical estimation tech- niques yields more promising results, ho we ver , at the expense of significant computational complexity . Integrating temporal and spectral data of music with machine learning techniques (e.g., neural networks) is apparently the best among others. Such algorithms always rely on a substantial training phase in advance, in order to yield promising results. In this paper , we propose a method which relies on the S- transform [1] for BCO detection. Unlike the e xisting methods based on statistical estimation techniques, our method does not rely on any a priori information of the underlying mu- sic. Moreover , unlike the state-of-the art machine learning algorithms, the proposed method does not require a training dataset. The proposed algorithm can be considered as a grace- ful trade-off between the performance and the computational complexity and resources required. The choice of the S-transform, among other time-frequency representations (TFR), is motiv ated by the following: 1) The beat causing onsets are usually created by instru- ments with relativ ely lower frequencies [2], 2) S-transform provides a good concentration at lower frequencies [1]. 3) S-T ransform uses a frequency-dependent window dila- tion, which results a frequency-dependent resolution [1]. The first two points enable one to extract the po wer of rhythm instruments ef fecti vely . The last point plays a ke y role in the sense that, unlike the STFT , S-transform is not required to know the window size a priori. This facilitates, irrespecti ve of the underlying frequencies of the rhythm instruments, a general implementation of proposed algorithms. The rest of the paper is organized as follo ws. In Section II, we gi ve a literature overvie w . Section III discusses our pro- posed algorithms for BCO detection. In Section VII, numerical results are presented. Section VIII concludes the paper . I I . L I T E R AT U R E Sev eral works hav e been in vestigated on BCO detection in music [3]–[23]. These can be split into methods based on temporal/spectral analysis, and more sophisticated methods which blend temporal/spectral data together with statistical estimation techniques and machine learning techniques. T em- poral and spectral analysis methods generate a time series , usually called the onset en velope function (OEF), which con- tains information of the locations of BCOs. The OEF is then used to compute the underlying bpm [5]. Methods based on statistical estimation and machine learning techniques rely on more resources, in addition to the pure temporal and spectral data, for locating BCOs, e.g., a priori information of the underlying music, training data sets [16, § 4]. T emporal analysis methods split the signal into frequency bands, for which amplitude env elopes are calculated and summed to obtain an OEF [3], [4]. Spectral analysis meth- ods tak e into account, the change in spectral ener gy . These methods usually compute some form of a time-frequency representation (TFR), where the STFT is most common [3], [5], [10], [21], [22]. Different scaling methods such as the Mel [5], [6] and the squar e r oot [7] are used to av oid lo w amplitude components from being masked off. Either the summation [5], [7], the median [6], or the mean [8] is computed of the first order difference for each time bin to obtain an OEF . A common limitation of the spectral analysis methods men- tioned abo ve is the poor detection of BCOs if the rhythm is less pronounced. This is due to masking off of BCO components of interest, or because spectral changes constituting to BCOs hav e not been identified accurately . This is the case in most classical, opera, soft pop and instrumental music [23]. In addition, the designs can be very sensitive to the algorithm parameters, e.g., window length [24]. The authors of [25] presents a comparison between se veral onset detection methods which were submitted to the ISMIR 2006 competition [26]. The methods discussed include the works presented by [4], [8], [20], [21] and sev eral others. The authors show that the method proposed by [20], which maneuvers temporal/spectral data, together with statistical estimation techniques, outperforms other methods by a con- siderable margin. Methods such as [16]–[19] uses a machine learning based approach where there is no computation of an OEF . Based on recent results of ISMIR [26], the research conducted in [17]–[19] appears to be the best among others. Ho we ver , for machine learning algorithms, usually the existence of a reasonable training data set is necessary to achie ve better accuracies. I I I . P R O P O S E D M E T H O D , A N O V E RV I E W The proposed method is based on the discrete S- transform [1, § III]. Moreover , the overall method is divided into two sections; 1) Onset en velopes by band spitting. 2) Onset en velope isolation. Recall that the existing methods rely on a single STFT -TFR followed by an associated onset env elope for beat detection. Intuitiv ely , to get the benefits of frequency dependent reso- lution of S-transform, it is suggestive to split the TFR into sev eral bands and to process different subbands separately [3], [4], [20]. Such a splitting and a processing can avoid or at least minimize the masking off and suppression of desired BCO information from undesired spectral information. Thus, we first consider a band splitting follo wed by an onset env elope computation for each band (Figure 1). Note that, of the STransform TFR Onsetenvelope creationband 1 Onsetenvelopeisolation Musicexcerpt TFRband 1 Onsetenvelope creationband 2 TFRband 2 Onsetenvelope creationband Q TFRband Q Beatdetection bpm Fig. 1. Black diagrams of Proposed Method. sev eral onset env elopes present, the beat information may be encoded in some, depending on the rhythm instrument used. The challenge is then to pick the ‘best’ one that encodes the BCOs of the underlying music. This is the second stage of our proposed method, in particular the onset en velope isolation, see Figure 1. In the sequel, we discuss in more detail, the computation of onset en velopes by band splitting [ cf. § IV] and onset env elope isolation [ cf. § V]. I V . O N S E T E N V E L O P E S B Y B A N D S P I T T I N G Let us first outline the proposed algorithm for onset en- velope computation. W e assume that the musical excerpt is provided in mono format. Algorithm 1 Input: • Mono audio file, { x [ n ] } N − 1 n =0 . • Do wnsamling factor D , a positi ve e ven integer . • Subband size, K such that b ( N − 1) /D c = 2 QK − 1 for some positiv e integer Q . Steps: 1) Do wnsamling: y [ n ] = x [ nD ] , n = 0 , . . . , M − 1 , where M = 1 + b ( N − 1) /D c . 2) Compute M -Discrete Fourier Transform { Y [ k ] } M − 1 k =0 of { y [ n ] } M − 1 n =0 , where Y [ k ] = 1 M M − 1 X n =0 y [ n ] exp − j 2 π nk M . 3) Compute Discrete S-Transform matrix F ∈ C ( M / 2) × M , whose ( p, n ) -th element is given by: F [ p, n ] = M − 1 X m =0 Y [ m + n ] exp j 2 π mp N − 2 π 2 m 2 n 2 , if n 6 = 0 1 M M − 1 X m =0 y [ m ] , otherwise , where n = 0 , . . . , M − 1 and p = 0 , . . . , M / 2 − 1 . Define S ∈ R ( M / 2) × M + as follows: S ( p, n ) = | F ( p, n ) | , ∀ p, n. 4) Split S by rows, S = [ S T 1 S T 2 · · · S T Q ] T , with S i ∈ R K × M representing i -th block of S . 5) For each block S i , compute the mean (ov er rows) r i ∈ R M , i.e., r i = K − 1 S T i 1 , where 1 ∈ R K is a K -vecor with all ones. Output: • Onset env elopes: return r i ∈ R M associated with sub- band i , i = 1 , . . . , Q . Algorithm starts with a sampled musical excerpt denoted by the sequence { x [ n ] } N − 1 n =0 . Note that, the smaller N or the duration T of the musical excerpt is, the lesser the computational burden of the algorithm. Therefore, the duration T can be chosen intelligently for efficient implementation of the algorithm. Note that, the tempo of a music can usually range from 60 bpm to 240 bpm [27]. Therefore, T can be on the order of few seconds to extract useful beat information. For example, e ven in the worst-case, i.e., when the musical excerpt is of 60 bpm, a T = 4 second musical excerpt can be used to capture 4 beats for further processing. The do wnsampling factor D also plays a k ey role for efficient implementation of the algorithm [ cf. step (1)]. In other words, the larger D is, the smaller M , and therefore, the lesser computational b urden of the algorithm [ cf . step (2), (3)]. A better choice for D can be ar gued by considering the frequencies of rhythm instruments. Note that the frequencies of rhythm instruments’ typically range from 32 Hz to 512 Hz [28]. Thus, sampling is to be done at a rate no smaller than 1024 Hz to a void aliasing. Therefore, for a musical e xcerpt sampled at a rate f s = 44100 Hz [28], D = 40 corresponds to a sampling frequency 1102 . 5 Hz ( ≥ 1024 Hz) and M = 4410 samples in a T = 4 s period. The idea of band splitting is essentially to e xtract the potentials of S-transform in a frequency dependent resolution. Thus, the choice of K is to be such that it is lar ge enough to hold a sufficient spectral energy concentration to emphasize BCO s (if any). On the other hand, K should be small enough to minimize the masking off of important BCO information (if any) from spectral contents within the subband itself. Numer- ical experiences suggest that a K on the order of 200 for a S T Q . . . S T 2 S T 1 f = 0 Hz 551 . 25 Hz p = 0 M / 2 t = 0 T n = 0 M Fig. 2. Splitting of discrete S-transform matrix S ∈ R ( M / 2) × M T = 4 s period, or in other words, a subband width on the order of 50 Hz is a good choice. Note that the subbands are index ed by 1 , . . . , Q for simplicity . A concise depiction of our considered TFR, in particular , the absolute discrete S-transform matrix S ∈ R ( M / 2) × M is shown in Figure 2, together with the considered splitting. Note that the TFR is plotted only for the range 0 Hz ≤ f ≤ 551 . 25 Hz and 0 s ≤ t ≤ T s, because the upper frequency band 551 . 25 Hz < f ≤ 1102 . 5 Hz is just a repetition of S . After having determined S and its splitting [ cf. step (3), (4) ], step (5) computes the onset en velopes of each subband. The output of the algorithm is the onset env elopes for each subband, which is used by the onset en velope isolation stage. V . O N S E T E N V E L O P I S O L AT I O N Giv en onset en velopes r i ∈ R M , i = 1 , . . . , Q , the task of the isolation stage is to choose one en velope that can potentially encode the BCO information. T o this end, the key idea is to associate each r i , with a real number b i , so that, the bigger b i is, the higher the likeliness of r i carrying BCO information. Let us first outline the algorithm. Algorithm 2 Input: • Onset en velopes: r i ∈ R M , i = 1 , . . . , Q . • Local maxima (peak) separation n p . • Threshold steps H . • Isolation accuracy level > 0 . Steps: For each i ∈ { 1 , . . . , Q } , 1) Normalization: compute ˜ r i as ˜ r i = r i / || r i || ∞ , where || · || ∞ is the ` ∞ norm. 2) Upper en velope computation: Determine the upper en ve- lope u i ∈ R M by using cubic spline interpolation over local maxima of ˜ r i separated by at least n p samples [29, § IV]. 3) Centering: Compute ˆ r i as ˆ r i = [ ˜ r i − (1 T u i / M )1] + , where 1 ∈ R M is a M -vector with all ones and [ x ] + , is the projection of x onto R M + 1 . 1 That is the vector obtained by taking the nonnegativ e part of each component of x and replacing each negati ve component with 0 . 4) Thresholding and clustering: Divide equally , the range H i = [0 , max( ˆ r i )] into H segments inde xed by { 1 , . . . , H } . For each se gment j ∈ { 1 , . . . , H } a) Let threshold h = l j , the lo wer le vel of segment j . b) Let I = { k | ( ˆ r i ) k ≥ h } , the set of index es whose associated components are larger than or equal to the threshold h . c) Determine the set partition {I m } M i m =1 of I such that, I m ∩ I ¯ m = ∅ ∀ m, ¯ m and the elements of an y set are consecative . d) Let { ¯ I m } M i m =1 be the ordered sequence, where I m is of mean of the elements of I m . e) Define c ij ∈ R M i − 1 as follows: c ij = [ I 12 , I 23 , . . . , I ( M i − 2)( M i − 1) , I ( M i − 1)( M i ) ] T , where I mn = I n − I m and let v ij = (1 T c ij ) / || c ij || 2 . 5) Define b i ∈ R as follows: b i = max j ∈{ 1 ,...,H } v ij . Output: • Onset en velope isolation: I ? = { i | | 1 − b i | ≤ , i ∈ { 1 , . . . , Q }} . • If I ? = ∅ , return an exception Isolation Failure , Otherwise return r i ? , where the partition index i ? ∈ I ? . The first step is a preconditioning step, where r i is nor- malized to yield ˜ r i . For an illustration, see Figure 3-(a). It is reasonable to assume that most of the relati vely lower level amplitudes of ˜ r i do not carry BCO information. Therefore, we consider only the amplitudes of ˜ r i abov e some lev el. More specifically , the lev el is chosen to be the mean [Figure 3-(b), dotted curve] of the upper en velope u i [Figure 3-(b), solid curve] determined at step (2). Step (3) remov es the mean aforementioned from ˜ r i to yield ˆ r i , cf. Figure 3-(c). Note that the upper en velope u i in step (2), computed by using cubic spline interpolation corresponds to some local maxima 2 of ˜ r i whose separation is at least n p ∈ Z samples. For example, Figure 3-(b) sho ws u i of ˜ r i in Figure 3-(a) for n p = 1 . Step (1), (2), as well as (3) of the algorithm correspond to preconditioning of the input r i . In contrast, step (4) is the key for en velope isolation, which capitalizes on a clustering of components of ˆ r i by using a thresholding mechanism. T o see this, first suppose the range of frequencies of the underlying rhythm instrument overlaps with subband i ∈ { 1 , . . . , Q } . Thus, there is a high potential that ˆ r i contains nonzero components, which correspond to the BCOs. In addition, their neighboring components can also be nonzeros due to the spectral leakage caused by windowing. As a result, ˆ r i can 2 W e say k ∈ Z is a local maximum of x ∈ R M whenev er ( x ) k − 1 < ( x ) k < ( x ) k +1 , where ( x ) k represents the k -th component of x . resemble a sequence as sho wn in Figure 3-(c), where there are clusters of nonzero components ( nonzer o clusters ) that are separated by clusters of zero components (zero clusters). For example, ˆ r i in Figure 3-(c) has 3 nonzero clusters. Because of the periodicity of BCOs, the ‘distance’ between consecutive pairs of nonzero clusters should be the same. Howe ver , for any subband ¯ i 6 = i , the characteristics of the nonzero clusters mentioned above, do not apply . This is indeed the key to isolate subband i from others. 0 0.5 1 (a) 5 10 15 20 25 30 35 0 0.5 1 (b) 5 10 15 20 25 30 35 0 0.2 0.4 (c) 5 10 15 20 25 30 35 0 0.2 0.4 (d) Fig. 3. Signatures of split frequency bands Steps (4)-a to (4)-e, correspond to clustering and the distance computation between consecutiv e pairs of nonzero clusters of ˆ r i . First, a threshold h is gi ven, cf. step (4)-a and Figure 3-(c). Then components of ˆ r i which are greater than or equal to h is isolated into I , cf. step (4)-b. For example, Figure 3-(c) sho ws that I = { 8 , 9 , 10 , 11 , 19 , 20 , 28 , 29 , 30 } . Step (4)-c partitions I into subsets {I m } M i m =1 , where each subset corresponds to a nonzero cluster . For example, from Figure 3-(d), we hav e M i = 3 subsets (one for each nonzero cluster), denoted I 1 , I 2 , and I 3 , where I 1 = { 8 , 9 , 10 , 11 } , I 2 = { 19 , 20 } , and I 3 = { 28 , 29 , 30 } . Step (4)-d computes the center of gravity of each subset, denoted { I m } M i m =1 . Particularized to our example, we have I 1 = 9 . 5 , I 2 = 19 . 5 , and I 3 = 29 , cf. Figure 3-(d). The distance between con- secutiv e pairs of nonzero clusters are simply giv en by the ( M i − 1) -vector [ I 12 , I 23 , . . . , I ( M i − 2)( M i − 1) , I ( M i − 1)( M i ) ] T , cf. step (4)-e. This is illustrated in Figure 3-(d), where the distance between nonzero cluster 1 and 2 is I 12 and that of nonzero cluster 2 and 3 is I 23 . Finally , recall that the ‘distance’ between consecuti ve pairs of nonzero clusters should be the same if r i contains BCOs. Mathematically , this corresponds to a larger inner product of vectors c ij and 1 ∈ R M i − 1 . Therefore, step (4)-e computes such inner products denoted { v ij } D j =1 and step (5) chooses the best. At the end of step (5), associated with each subband, we hav e a real number b i which characterizes the likeliness of r i containing BCOs. Finally , for the specified isolation accuracy , isolated subband inde xes are returned. Finally , a potential BPM value is computed as BPM = d (1 T c ij ) c / length ( c ij ) (1) for some i ∈ I ? , where d x c represents the rounding of x to the nearest integer and length ( y ) represents the length of vector y . V I . C O M P U TA T I O N A L C O M P L E X I T Y A vast majority of the e xisting methods use the STFT to obtain a TFR. The asymptotic complexity for the STFT is O ( N log N ) , where N is the samples used in the underlying FFT operations 3 [30]. The discrete S-transform, on the other hand, has an asymp- totic complexity of O ( N 3 ) [31]. Ho we ver , by exploiting struc- tural properties, variants of discrete S-transforms, such as fast discrete orthonormal Stockwell transform can be computed, still in O ( N log N ) [31, Theorem 6.1]. V I I . R E S U LT S This section compares the performance of the proposed method with the algorithms documented in [5] and [20], which we consider as benchmarks A and B , respectiv ely . Algorithm in [5] can be considered to be superior among the methods based on pure temporal/spectral analysis methods [26]. On the other hand, the work by [20] is the best among methods that rely on temporal/spectral data, together with statistical estimation. In our simulations, we consider two publicly av ailable datasets - the Ballroom dataset, and the Songs dataset, which comprise of 698 and 465 song excerpts, respecti vely [25, § III- B]. The tempo, genre, and style distribution of the datasets are giv en by [25, § III]. Note that the sampling rate of each song excerpt is 44 . 1 kHz. A downsampling factor of D = 40 , a subband size K = 1103 , and Q = 10 subbands are used as inputs to Algorithm 1. In the case of Algorithm 2, we use n p = 40 , H = 100 , and = 10 − 3 . T o e xemplify the outputs of the proposed algorithms, we fist consider an arbitrarily chosen classical music e xcerpt in the Songs dataset. Figure 4 shows the output r i , i = 1 , . . . , 10 for the considered music excerpt. Results show that r 9 and r 10 can apparently isolate the BCOs. Figure 5 shows v ij versus j for each subband i, i = 1 , . . . , Q . Results indicate that v 10 j yields values almost close to 1 for some thresholds l j [ cf. step (4)-a]. More specifi- cally , Algorithm 2 returns I ? = { 10 } , which corresponds to b 10 = 0 . 999895 [ cf . step (5)]. The resulting BPM is 88 [ cf. (1)], which is identical to the ground-truth tempo. T o see the performance of the proposed algorithms on av erage, we ran the algorithms separately for each data set. As discussed in [25], we considered the same two metrics to measure the accuracy of the system. In particular , we have 3 e.g., the STFT window length. Fig. 4. Split frequency bands r i for i = 1 , . . . , 10 20 40 60 80 100 0.8 0.9 1 1Hz - 50Hz 20 40 60 80 100 0.8 0.9 1 51Hz - 100Hz 20 40 60 80 100 0.8 0.9 1 101Hz - 150Hz 20 40 60 80 100 0.8 0.9 1 151Hz - 200Hz 20 40 60 80 100 0.8 0.9 1 201Hz - 250Hz 20 40 60 80 100 0.8 0.9 1 251Hz - 300Hz 20 40 60 80 100 0.8 0.9 1 301Hz - 350Hz 20 40 60 80 100 0.8 0.9 1 351Hz - 400Hz 20 40 60 80 100 0.8 0.9 1 401Hz - 450Hz 20 40 60 80 100 0.8 0.9 1 451Hz - 500Hz Fig. 5. v ij versus j for each subband i, i = 1 , . . . , Q • Accuracy 1 : The percentage of tempo estimates within 4% of the ground-truth tempo. • Accuracy 2 : The percentage of tempo estimates within 4% of either the ground-truth tempo, or half, double, three times, or one third of the ground-truth tempo. Figure 6 depicts the results of percentage accuracies of the proposed algorithm compared with the two benchmarks. Re- sults show that the proposed method has a better performance than [5]. Note that, this gain can be accomplished with the same computational complexity , cf. § VI. Results further show that the method proposed in [20] is superior to the proposed method. This is not surprising, because, unlike the proposed method, the algorithm in [20] relies on many computationally intensiv e operations, e.g., filtering, comb filter operations, discrete power spectral estimations, statistical estimation of period and phase of underlying time series within a hidden Markov model, among others. Therefore, results suggest that the proposed method holds an advantage in that it is less computationally intensive than the benchmark [20], yet with a comparable performance. Fig. 6. Comparison of Accuracy 1 and Accuracy 2 values for both datasets V I I I . C O N C L U S I O N S In this paper, a beat causing onset (BCO) detection method based on the S-transform has been proposed. The method provided an advantage over the approaches that are purely based on classic temporal/spectral analysis. The frequency dependent windo w dilation used in S-transform has been the key to yield such performances by exploiting better frequency resolution at lower frequencies, where BCOs generally occur . Compared to state-of-the-art algorithms, the proposed method is less resource intensiv e. For example, our method does not require any a priori information of the underlying music, unlike the statistical estimation based approaches. Moreover , the method does not require training datasets like in the methods based on state-of-the-art machine learning techniques. The result is a graceful trade-off between the performance and the required computational burden and the resources. R E F E R E N C E S [1] R. Stockwell, L. Mansinha, and R. P . Lowe, “Localization of the complex spectrum: the S-transform, ” IEEE Tr ansactions on Signal Pr ocessing , vol. 44, pp. 998–1001, Apr . 1996. [2] R. Marxer and J. Janer, “Low-latency bass separation using harmonic- percussion decomposition, ” in International Conference on Digital Au- dio Ef fects Confer ence (D AFx-13) , (Maynooth, Ireland), pp. 290–294, Sept. 2013. [3] A. Klapuri, “Sound onset detection by applying psychoacoustic knowl- edge, ” in IEEE International Confer ence on Acoustics, Speech, and Signal Pr ocessing , vol. 6, (Phoenix, AZ, USA), pp. 3089–3092, Mar . 1999. [4] E. Scheirer , “T empo and beat analysis of acoustic musical signals, ” The Journal of the Acoustical Society of America , vol. 103, pp. 588–601, Apr . 1998. [5] D. Ellis, “Beat tracking by dynamic programming, ” Journal of New Music Researc h , vol. 36, no. 1, pp. 51–60, 2007. [6] B. McFee and D. P . W . Ellis, “Better beat tracking through robust onset aggregation, ” in IEEE International Confer ence on Acoustics, Speech and Signal Pr ocessing (ICASSP) , (Florence, Italy), pp. 2154–2158, May 2014. [7] J. Laroche, “Ef ficient tempo and beat tracking in audio recordings, ” Journal of the Audio Engineering Society (J AES) , v ol. 51, pp. 226–233, Apr . 2003. [8] M. Alonso, B. David, and G. Richard, “T empo and beat estimation of musical signals, ” in Pr oceedings of the 5th International Conference on Music Information Retrieval , (Barcelona, Spain), pp. 158–164, Oct. 2004. [9] A. Stark, M. Davies, and M. Plumbley , “Real-time beat-synchronous analysis of musical audio, ” in Pr oceedings of the 12th International Confer ence on Digital Audio Effects (DAFx-09) , (Como, Italy), Sept. 2009. [10] F . W u, T .Lee, J. Jang, K. Chang, C. Lu, and W . W ang, “ A two-fold dynamic programming approach to beat tracking for audio music with time-varying tempo, ” in Pr oceedings of the 12th International Society for Music Information Retrieval Conference , ISMIR 2011 , (Miami, FL, USA), pp. 191–196, Jan. 2011. [11] M. Goto and Y . Muraoka, “Beat tracking based on multiple-agent architecture a real-time beat tracking system for audio signals, ” in Pr oceedings of the Second International Conference on Multiagent Systems , (Kyoto, Japan), pp. 103–110, Dec. 1996. [12] Y . Shiu, P . C. Cho, and C. J. Kuo, “Robust online beat tracking with kalman filtering and probabilistic data association, ” IEEE T ransactions on Consumer Electronics , vol. 54, pp. 1369 – 1377, Oct. 2008. [13] A. Cemgil, B.Kappen, P . esain, and H.Honing, “On tempo tracking: T empogram representation and kalman filtering, ” J ournal of New Music Resear ch , vol. 29, pp. 259–273, May 2000. [14] J. R. Zapata, E. P . Da vies, and E. Gomez, “Multi-feature beat tracking, ” IEEE/ACM T ransactions on Audio, Speech and Language Processing (T ASLP) , vol. 22, p. 816825, Apr . 2014. [15] N. Degara, E. A. Rua, A. Pena, S. T orres-Guijarro, M. Davies, and M. D. Plumbley , “Reliability-informed beat tracking of musical signals, ” IEEE T ransactions on Audio, Speech, and Language Pr ocessing , vol. 20, p. 290301, Jan. 2013. [16] D. Fiocchi, “Beat tracking using recurrent neural network: a transfer learning approach, ” Master’ s thesis, Politecnico di Milano, Milan, Italy , 2017. [17] S. Bock and M. Schedl, “Enhanced beat tracking with context-aware neural networks, ” in Proceedings of the 14th International Conference on Digital Audio Effects (DAFx-11) , (Paris, France), p. 135139, Sept. 2011. [18] S. Bock, F . Krebs, and G. W idmer , “ Accurate tempo estimation based on recurrent neural networks and resonating comb filters, ” in Proceed- ings of the 16th International Society for Music Information Retrieval Confer ence (ISMIR 2015) , (Malaga, Spain), p. 625631, Oct. 2015. [19] S. Bock, A.Arzt, F . Krebs, and M. Schedl, “Online real-time onset detection with recurrent neural networks, ” in Proceedings of the 15th In- ternational on Digital Audio Effects (D AFx-12) , (Y ork, UK), p. 301304, Sept. 2012. [20] A. P . Klapuri, A. J. Eronen, and J. T . Astola, “ Analysis of the meter of acoustic musical signals, ” IEEE T ransactions on Audio, Speech, and Language Pr ocessing , vol. 14, pp. 1832 – 1844, Sept. 2006. [21] S. Dixon, “ Automatic extraction of tempo and beat from expressiv e performances, ” Journal of New Music Resear ch , vol. 30, pp. 39–58, Aug. 2001. [22] M. Davies and M. Plumbley , “Context-dependent beat tracking of musical audio, ” IEEE T ransactions on Audio, Speech, and Language Pr ocessing , vol. 15, pp. 1009–1020, Mar . 2007. [23] C. Duxbury , M. Sandler , and M. Davies, “ A hybrid approach to musical note onset detection, ” in Pr oceedings of the 5th Digital Audio Ef fects (D AFx-02) Conference , (Hambur g, Germany), pp. 33–38, Nov . 2002. [24] J. Scargle, “Studies in astronomical time series analysis. ii - statistical aspects of spectral analysis of une venly spaced data, ” Astr ophysical Journal , vol. 263, pp. 835–853, Dec. 1982. [25] F . Gouyon, A. Klapuri, S. Dixon, M. Alonso, G. Tzanetakis, C. Uhle, and P . Cano, “ An experimental comparison of audio tempo induction algorithms, ” IEEE T ransactions on Audio, Speech, and Language Pr o- cessing , vol. 14, pp. 1832–1844, Sept. 2006. [26] “The international society of music information retriev al. ” [Online]. A vailable:https://www .ismir .net/. [27] W . Apel, Harvard Dictionary of Music . Cambridge, MA, USA: Harvard Univ ersity Press, 1950. [28] J. W atkinson, The Art of Digital A udio . Oxford, UK: F ocal Press, 2001. [29] C. de Boor , A Practical Guide to Spline , vol. 27, pp. 40–48. Boston, NY , USA: Springer , Jan. 1978. [30] J. Cooley and J. Tucke y , “ An algorithm for the machine calculation of complex fourier series, ” Mathematics of Computation , vol. 19, pp. 297– 301, Jan. 1965. [31] Y . W ang and J. Orchard, “Fast discrete orthonormal stockwell trans- form, ” SIAM J ournal on Scientific Computing , vol. 31, pp. 4000–4012, Jan. 2009.
Original Paper
Loading high-quality paper...
Comments & Academic Discussion
Loading comments...
Leave a Comment