SDR - half-baked or well done?
In speech enhancement and source separation, signal-to-noise ratio is a ubiquitous objective measure of denoising/separation quality. A decade ago, the BSS_eval toolkit was developed to give researchers worldwide a way to evaluate the quality of thei…
Authors: Jonathan Le Roux, Scott Wisdom, Hakan Erdogan
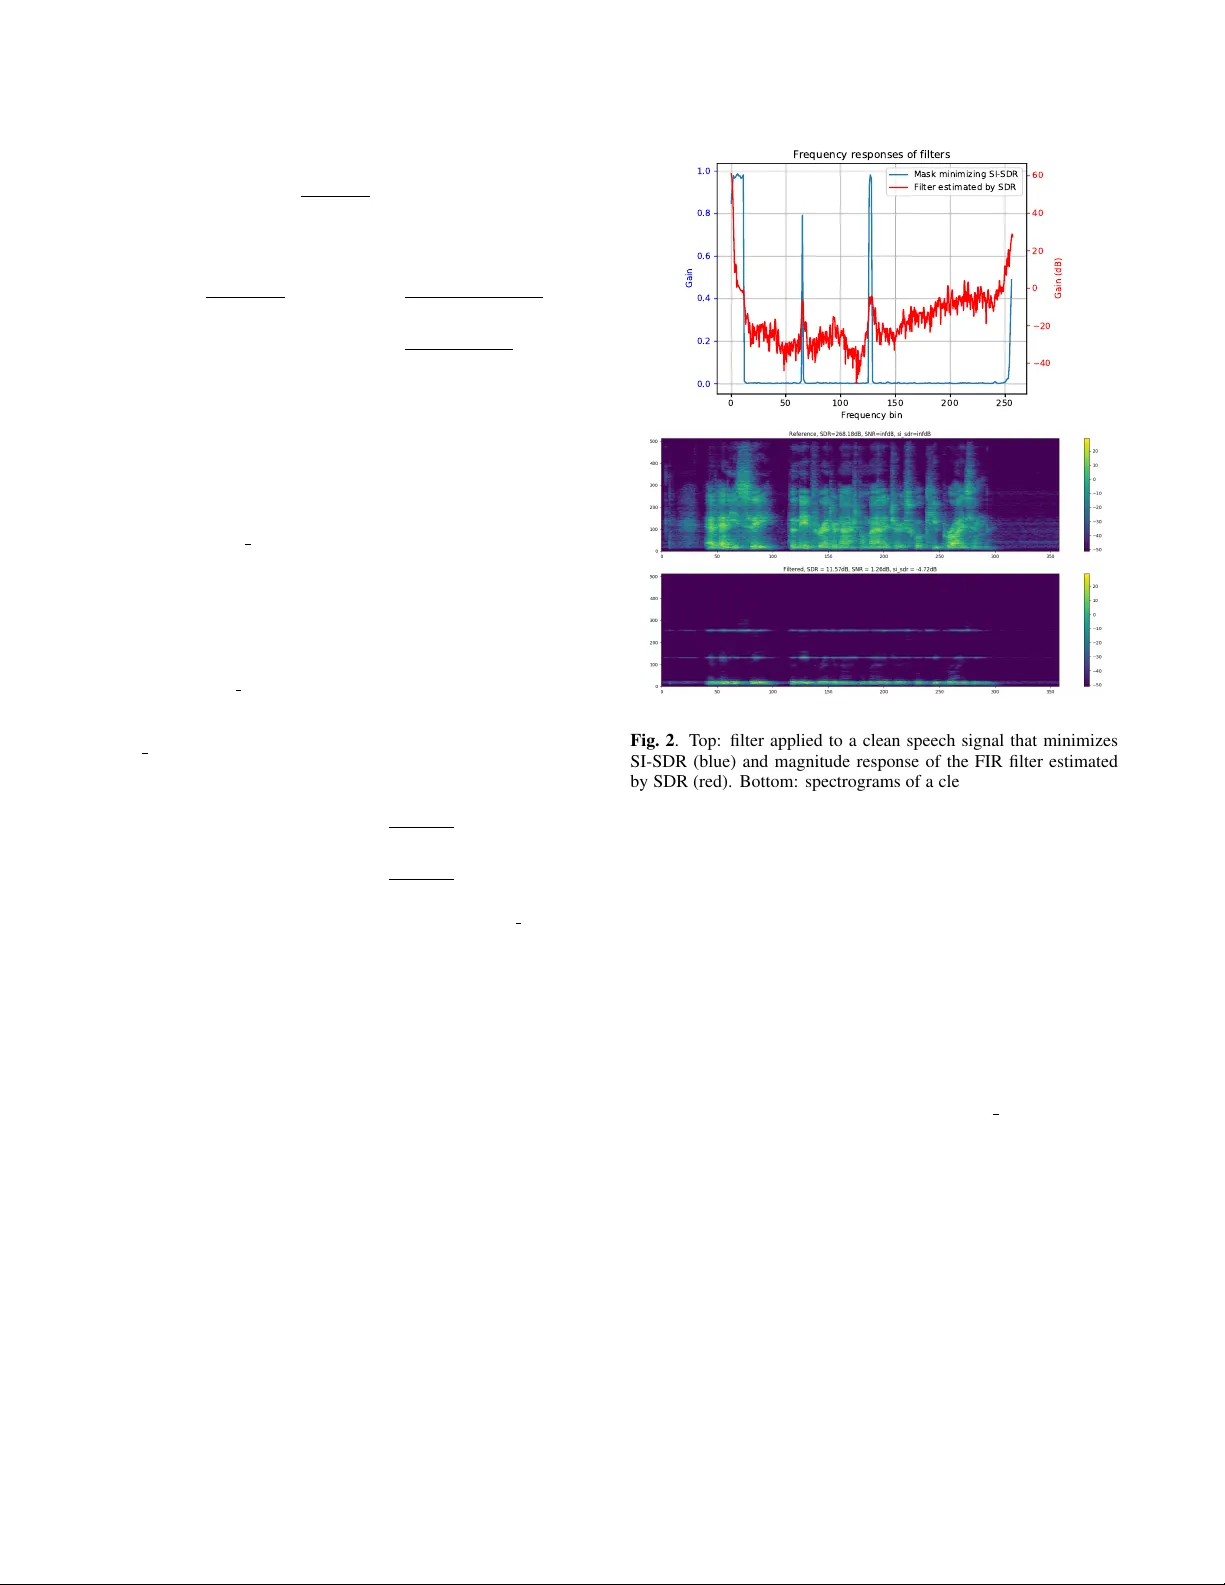
SDR – HALF-B AKED OR WELL DONE? J onathan Le Roux 1 , Scott W isdom 2 , Hakan Er dogan 3 , J ohn R. Hershe y 2 1 Mitsubishi Electric Research Laboratories (MERL), Cambridge, MA, USA 2 Google AI Perception, Cambridge, MA 3 Microsoft Research, Redmond, W A ABSTRA CT In speech enhancement and source separation, signal-to-noise ratio is a ubiquitous objectiv e measure of denoising/separation quality . A decade ago, the BSS eval toolkit was de veloped to gi ve researchers worldwide a way to ev aluate the quality of their algorithms in a simple, fair , and hopefully insightful way: it attempted to account for channel variations, and to not only ev aluate the total distortion in the estimated signal but also split it in terms of various factors such as remaining interference, newly added artifacts, and channel errors. In recent years, hundreds of papers have been relying on this toolkit to ev aluate their proposed methods and compare them to pre- vious works, often arguing that differences on the order of 0.1 dB prov ed the effecti veness of a method over others. W e argue here that the signal-to-distortion ratio (SDR) implemented in the BSS eval toolkit has generally been improperly used and abused, especially in the case of single-channel separation, resulting in misleading results. W e propose to use a slightly modified definition, resulting in a sim- pler , more robust measure, called scale-in variant SDR (SI-SDR). W e present various examples of critical failure of the original SDR that SI-SDR ov ercomes. Index T erms — speech enhancement, source separation, signal-to- noise-ratio, objectiv e measure 1. INTR ODUCTION Source separation and speech enhancement have been an intense focus of research in the signal processing community for sev eral decades, and interest has gotten ev en stronger with the recent ad- vent of po werful new techniques based on deep learning [1–11]. An important area of research has focused on single-channel methods, which can denoise speech or separate one or more sources from a mixture recorded using a single microphone. Many new methods are proposed, and their relev ance is generally justified by their out- performing some pre vious method according to some objecti ve mea- sure. While the merits of various objectiv e measures such as PESQ [12], Loizou’ s composite measure [13], PEMO-Q [14], PEASS [15], or STOI [16], could be debated and compared, we are concerned here with an issue with the way the widely relied upon BSS eval tool- box [17] has been used. W e focus here on the single-channel setting. The BSS eval toolbox reports objective measures related to the signal-to-noise ratio (SNR), attempting to account for channel varia- tions, and to report a decomposition of the ov erall error , referred to as signal-to-distortion ratio (SDR), into components indicating the type of error: source image to spatial distortion ratio (ISR), signal to in- terference ratio (SIR), and signal to artifacts ratio (SAR). In version 3.0, BSS eval featured two main functions, bss eval images and bss eval sources . • bss eval sources completely forgi ves channel errors that can be accounted for by a time-in v ariant 512-tap filter , modifying the reference to best fit each estimate. This includes very strong modifications of the signal, including low-pass or high-pass fil- ters. Thus, obliterating some frequencies of a signal by setting them to 0 could absurdly still result in near infinite SDR. • bss eval images reports channel errors (including gain er- rors) as errors in the ISR measure, but its SDR is nothing else than vanilla SNR. While not as fatal as the modification of the reference in bss eval sources , bss eval images suf fers from some issues. First, it does not ev en allo w for a global rescal- ing factor , which may occur when one tries to avoid clipping in the reconstructed signal. Second, as does SNR, it takes the scal- ing of the estimate at face v alue, a loophole that algorithms could (potentially unwittingly) exploit, as e xplained in section 2.2. An earlier version (2.1) of the toolbox does provide, among other functions, a decomposition which only allo ws a constant gain via the function bss decomp gain . Performance criteria such as SDR can then be computed from this decomposition, but most papers on single-channel separation appear to be using bss eval sources . The BSS eval website 1 actually displays a warning about which version should be used. V ersion 3.0 “ is recommended for mixtures of r everber ated or diffuse sour ces (aka con volutive mixtures), due to longer decomposition filters enabling better corr elation with subjec- tive ratings. It [is] also r ecommended for instantaneous mixtur es when the results are to be compared with SiSEC. ” On the other hand, version 2.1 “ is practically restricted to instantaneous mix- tur es of point sources. It is recommended for such mixtur es, except when the r esults ar e to be compared with SiSEC. ” It appears that this warning has not been understood, and most papers use V ersion 3.0 without further consideration. The desire to compare results to (early editions of) SiSEC should also not be a justification for using a flawed measure. The same issues apply to an early Python ver- sion of BSS eval , bss eval 2 [18]. Recently , BSS eval v4 was released as a Python implementation 3 [19]: the authors of V ersion 4 acknowledged the issue with the original bss eval sources , and recommended using bss eval images instead. This how- ev er does not address the scaling issue. These problems shed doubt on many results, including some in our own older papers, especially in cases where algorithms differ by a few tenths of a dB in SDR. This paper is intended both to il- lustrate and propagate this message more broadly , and also to en- courage the use, for single-channel separation ev aluation, of sim- pler , scale-aware, versions of SDR: scale-inv ariant SDR (SI-SDR) and scale-dependent SDR (SD-SDR). W e also propose a definition 1 http://bass- db.gforge.inria.fr/bss_eval/ 2 http://github.com/craffel/mir_eval/ 3 https://sigsep.github.io/sigsep- mus- eval/ museval.metrics.html of SIR and SAR in which there is a direct relationship between SDR, SIR, and SAR, which we believ e is more intuitive than that in BSS eval . The scale-in variant SDR (SI-SDR) measure was used in [6, 7, 11, 20–23]. Comparisons in [21] showed that there is a sig- nificant dif ference between SI-SDR and the SDR as implemented in BSS eval ’ s bss eval sources function. W e revie w the pro- posed measures, sho w some critical failure cases of SDR, and give a numerical comparison on a speech separation task. 2. PR OPOSED MEASURES 2.1. The problem with changing the r eference A critical assumption in bss eval sources , as it is imple- mented in the publicly released toolkit up to V ersion 3.0, is that time-in variant filters are considered allo wed deformations of the tar- get/reference. One potential justification for this is that a reference may be available for a source signal instead of the spatial image at the microphone which recorded the noisy mixture, and that spatial image is likely to be close to the result of the con volution of the source signal with a short FIR filter , as an approximation to its con- volution with the actual room impulse response (RIR). This ho wev er leads to a major problem, because the space of signals achie vable by con volving the source signal with any short FIR filter is extremely large and includes perceptually widely different signals from the spatial image. Note that the original BSS eval paper [17] also considered time-varying gains and time-v arying filters as allowed deformations. T aken to an extreme, this creates the situation where the target can be deformed to match pretty much an y estimate. Modifying the target/reference when comparing algorithms is deeply problematic when the modification depends on the outputs of each algorithm. In effect, bss eval sources chooses a different fre- quency weighting of the error function depending on the spectrum of the estimated signal: frequencies that match the reference are em- phasized, and those that do not are discarded. Since this weighting is different for each algorithm, bss eval sources cannot provide a fair comparison between algorithms. 2.2. The problem with not changing anything Let us consider a mixture x = s + n ∈ R L of a target signal s and an interference signal n . Let ˆ s denote an estimate of the target obtained by some algorithm. The classical SNR (which is equal to bss eval images ’ s SDR) considers ˆ s as the estimate and s as the target: SNR = 10 log 10 || s || 2 || s − ˆ s || 2 . (1) As is illustrated in Fig. 1, where for simplicity we consider the case where the estimate is in the subspace spanned by speech and noise (i.e., no artifact), what is considered as the noise in such a context is the residual s − ˆ s , which is not guaranteed to be orthogonal to the target s . A tempting mistake is to artificially boost the SNR value without changing anything perceptually by rescaling the estimate, for example to the orthogonal projection of s on the line spanned by ˆ s : this leads to a right triangle whose hypotenuse is s , so SNR could al ways be made positi ve. In particular , starting from a mixture x where s and n are orthogonal signals with equal po wer , so with an SNR of 0 dB, projecting s orthogonally onto the line spanned by x corresponds to rescaling the mixture to x/ 2 : this “improves” SNR by 3 dB. Interestingly , bss eval images ’ s ISR is sensiti ve to the rescaling, so the ISR of x will be higher than that of x/ 2 , while its SDR (equal to SNR for bss eval images ) is lower . Fig. 1 . Illustration of the definitions of SNR and SI-SDR. 2.3. Scale-aware SDR T o ensure that the residual is indeed orthogonal to the target, we can either rescale the target or rescale the estimate. Rescaling the target such that the residual is orthogonal to it corresponds to finding the orthogonal projection of the estimate ˆ s on the line spanned by the target s , or equiv alently finding the closest point to ˆ s along that line. This leads to two equiv alent definitions for what we call the scale- in variant signal-to-distortion ratio (SDR): SI-SDR = | s | 2 | s − β ˆ s | 2 for β s.t. s ⊥ s − β ˆ s (2) = | αs | 2 | αs − ˆ s | 2 for α = argmin α | αs − ˆ s | 2 . (3) The optimal scaling factor for the target is obtained as α = ˆ s T s/ || s || 2 , and the scaled reference is defined as e target = αs . W e then decompose the estimate ˆ s as ˆ s = e target + e res , leading to the expanded formula: SI-SDR = 10 log 10 || e target || 2 || e res || 2 (4) = 10 log 10 || ˆ s T s || s || 2 s || 2 || ˆ s T s || s || 2 s − ˆ s || 2 . (5) Instead of a full 512-tap FIR filter as in BSS eval , SI-SDR uses a single coefficient to account for scaling discrepancies. As an ex- tra advantage, computation of SI-SDR is thus straightforward and much faster than that of SDR. Note that SI-SDR corresponds to the SDR obtained from bss decomp gain in BSS eval V ersion 2.1. SI-SDR has recently been used as an objective measure in the time domain to train deep learning models for source separation, outper- forming least-squares on some tasks [23, 24] (it is referred to as SDR in [24] and as SI-SNR in [23]). A potential drawback of SI-SDR is that it does not consider scaling as an error . In situations where this is not desirable, one may be inter- ested in designing a measure that does penalize rescaling. Doing so turns out not to be straightforward. As we sa w in the example in Sec- tion 2.2 of a mixture x of two orthogonal signals s and n with equal power , considering the rescaled mixture ˆ s = µx as the estimate, SNR does not peak at µ = 1 b ut instead encourages a down-scaling of µ = 1 / 2 . It does howe ver properly discourage large up-scaling factors. As an alternativ e measure that properly discourages down- scalings, we propose a scale-dependent SDR (SD-SDR), where we consider the rescaled s as the target e target = αs , but consider the total error as the sum of two terms, || αs − ˆ s || 2 accounting for the residual energy , and || s − αs || 2 accounting for the rescaling error . Because of orthogonality , || αs − ˆ s || 2 + || s − αs || 2 = || s − ˆ s || 2 , and we obtain: SD-SDR = 10 log 10 || αs || 2 || s − ˆ s || 2 = SNR + 10 log 10 α 2 (6) Going back to the example in Section 2.2, SI-SDR is independent of the rescaling of x , while SD-SDR for ˆ s = µx is equal to 10 log 10 k µs k 2 k s − µx k 2 = 10 log 10 µ 2 k s k 2 k (1 − µ ) s − µn k 2 (7) = 10 log 10 µ 2 (1 − µ ) 2 + µ 2 , (8) which does peak at µ = 1 . While this measure properly accounts for do wn-scaling errors where µ < 1 , it only decreases to − 3 dB for large up-scaling factors µ 1 . For those applications where both down-scaling and up-scaling are critical, one could consider the minimum of SNR and SD-SDR as a relev ant measure. 2.4. SI-SIR and SI-SAR In the original BSS eval toolkit, the split of SDR into SIR and SAR is done in a mathematically non intuitive way: in the original paper , the SAR is defined as the “sources to artifacts ratio, ” not the “source to artifacts ratio, ” where “sources” refers to all sources, including the noise. That is, if the estimate contains more noise, yet ev erything else stays the same, then the SAR actually goes up. There is also no simple relationship between SDR, SIR, and SAR. Similarly to BSS eval , we can further decompose e res as e res = e interf + e artif , where e interf is defined as the orthogonal projection of e res onto the subspace spanned by both s and n . But dif ferently from BSS eval , we define the scale-in variant signal to interference ratio (SI-SIR) and the scale-inv ariant signal to artifacts ratio (SI-SAR) as follows: SI-SIR = 10 log 10 || e target || 2 || e interf || 2 , (9) SI-SAR = 10 log 10 || e target || 2 || e artif || 2 . (10) These definitions have the advantage over those of BSS eval that they v erify 10 − SI-SDR / 10 = 10 − SI-SIR / 10 + 10 − SI-SAR / 10 , (11) because the orthogonal decomposition leads to || e res || 2 = || e interf || 2 + || e artif || 2 . There is thus a direct relationship between the three mea- sures. Scale-dependent versions can be defined similarly . That being said, we feel compelled to note that, whether it is still rel- ev ant to split SDR into SIR and SAR is a matter of debate: machine- learning based methods tend to perform a highly non-stationary type of processing, and using a global projection on the whole signal may thus not be guaranteed to provide the proper insight. 3. EXAMPLES OF EXTREME F AILURE CASES W e present some failure modes of SDR that SI-SDR overcomes. 3.1. Optimizing a filter to minimize SI-SDR For this example, we optimize an STFT -domain, time-inv ariant filter to minimize SI-SDR. W e will show that despite SI-SDR being min- imized by the filter, SDR performance remains relatively high since it is allowed to apply filtering to the reference signal. Optimization of the filter that minimizes SI-SDR is implemented in Keras with a T ensorflow backend, where the trainable weights are an F -dimensional vector w . A sigmoid nonlinearity is applied to this vector to ensure the filter has values between 0 and 1, and the final 0 50 100 150 200 250 Frequency bin 0.0 0.2 0.4 0.6 0.8 1.0 Gain Frequency responses of filters 40 20 0 20 40 60 Gain (dB) Mask minimizing SI-SDR Filter estimated by SDR Fig. 2 . T op: filter applied to a clean speech signal that minimizes SI-SDR (blue) and magnitude response of the FIR filter estimated by SDR (red). Bottom: spectrograms of a clean speech signal (top) and the same signal processed by the optimized filter in blue abov e. filter m is obtained by renormalizing v = sigm( w ) to have unit ` ∞ -norm: m = v / k v k ∞ . The filter is optimized on a single speech example using gradient descent, where the loss function being min- imized is SI-SDR. Application of the masking filter is implemented end-to-end, where gradients are backpropagated through an inv erse STFT layer . An example of a learned filter and resulting spectrograms for a single male utterance from CHiME2 is shown in Fig. 2. T o minimize SI- SDR, the filter learns to remove most of the signal’ s spectrum, only passing a couple of narrow bands. This filter achie ves -4.7 dB SI- SDR, removing much of the speech content. Ho wev er , despite this destructiv e filtering, we have the paradoxical result that the SDR of this signal is still high at 11.6 dB, since BSS eval is able to find a filter to be applied to the reference signal that remo ves similar frequency regions. This filter is shown in red in the top part of Fig. 2, somewhat matching the filter minimizing SI-SDR in blue. 3.2. Progr essive deletion of fr equency bins The pre vious example illustrated that SDR can yield high scores de- spite large regions of a signal’ s spectrum being deleted. Now we examine ho w various metrics perform when frequency bins are pro- gressiv ely deleted from a signal. W e add white noise at 15 dB SNR to the same speech signal used in Section 3.1. Then time-in variant STFT -domain masking is used to remove varying proportions of frequency bins, where the mask is bandpass with a center frequency at the location of median spec- tral energy of the speech signal av eraged across STFT frames. W e measure four metrics: SDR, SNR, SI-SDR, and SD-SDR. The re- 0.0 0.2 0.4 0.6 0.8 1.0 Proportion of bins masked 15 10 5 0 5 10 15 dB SDR SNR SI-SDR SD-SDR Fig. 3 . V arious metrics plotted versus proportion of frequency bins deleted for a speech signal plus white noise at 15dB SNR. sults are shown in Fig. 3. Despite more and more frequency bins being deleted, SDR (blue) remains between 10 dB and 15 dB, un- til nearly all frequencies are remov ed. In fact, SDR even incr eases for a masking proportion of 0.4. In contrast, the other metrics more appropriately measure signal degradation since they monotonically decrease. An important practical scenario in which such behavior would be fatal is that of bandwidth extension: it is not possible to properly as- sess the baseline performance, where upper frequency bins are silent, using SDR. 3.3. V arying band-stop filter gain for speech corrupted with band-pass noise In this example, we consider adding bandpass noise to a speech sig- nal, then applying a mask that filters the noisy signal in this band with varying gains, as a crude representation of a speech enhance- ment task. W e mix the speech signal with a bandpass noise signal, where the local SNR within the band is 0 dB, and the band is 1600 Hz wide (20% of the total bandwidth for a sampling frequenc y of 16 kHz), centered at the maximum average spectral magnitude across STFT frames of the speech signal. In this case, the optimal time- in variant Wiener filter should be bandstop, with a gain of 1 outside the band and a gain of about 0.5 within the band, since the speech and noise have approximately equal power , and the Wiener filter is P speech / ( P speech + P noise ). W e consider the performance of such filters when varying the band- stop gain from 0 to 1 in steps of 0.025, again for SDR, SNR, SI-SDR, and SD-SDR. The results are shown in Fig. 4. Notice that SNR, SI- SDR have a peak around a gain of 0.5 as expected. Howe ver , SDR monotonically increases as gain decreases. This is an undesirable behavior , as SDR becomes more and more optimistic about signal quality as more of the signal’ s spectrum is suppressed, because it is all too happy to see the noisy part of the spectrum being suppressed and modify the reference to focus only on the remaining regions. SD-SDR peaks slightly above 0.5, because it penalizes the down- scaling of the speech signal within the noisy band. 4. COMP ARISON ON A SPEECH SEP ARA TION T ASK Both SI-SDR and BSS eval ’ s SDR ha ve recently been used by var - ious studies [6–9, 11, 21–23, 25, 26] in the context of single-channel speaker -independent speech separation on the wsj0-2mix dataset [6], some of these studies reporting both figures [21–23, 25]. W e gather 0.0 0.2 0.4 0.6 0.8 1.0 Noise band gain 4 2 0 2 4 6 8 10 dB SDR (global) SNR (global) SI-SDR (global) SD-SDR (global) Fig. 4 . V arious metrics plotted versus bandstop filter gain for a speech signal plus bandpass white noise with 0dB SNR in the band. T able 1 . Comparison of improvements in SI-SDR and SDR for var - ious speech separation systems on the wsj0-2mix dataset test set [6]. Approaches SI-SDR [dB] SDR [dB] Deep Clustering [6, 7] 10.8 - Deep Attractor Networks [22, 25] 10.4 10.8 PIT [8, 9] - 10.0 T asNet [26] 10.2 10.5 Chimera++ Networks [11] 11.2 11.7 + MISI-5 [11] 11.5 12.0 W A [21] 11.8 12.3 W A-MISI-5 [21] 12.6 13.1 Con v-T asNet-gLN [23] 14.6 15.0 Oracle Masks: Magnitude Ratio Mask 12.7 13.2 + MISI-5 13.7 14.3 Ideal Binary Mask 13.5 14.0 + MISI-5 13.4 13.8 PSM 16.4 16.9 + MISI-5 18.3 18.8 Ideal Amplitude Mask 12.8 13.2 + MISI-5 26.6 27.1 in T able 1 various SI-SDR and BSS eval SDR improvements (in dB) on the test set of the wsj0-2mix dataset mainly from [11], to which we add the recent state-of-the-art score of [23]. The differ - ence between the SI-SDR and the SDR scores for the algorithms considered are around 0.5 dB, but vary from 0.3 dB to 0.6 dB. Note furthermore that the algorithms considered here all result in signals that can be considered of good perceptual quality: much more var - ied results could be obtained with algorithms that gi ve worse results. If the targets and interferences in the dataset were more stationary , such as in some speech enhancement scenarios, it is also lik ely there could be loopholes for SDR to exploit, where a drastic distortion that can be well approximated by a short FIR filter happens to lead to similar results on the mixture and the reference signals. 5. CONCLUSION W e discussed issues that pertain to the way BSS eval ’ s SDR mea- sure has been used, in particular in single-channel scenarios, and pre- sented a simpler scale-in variant alternativ e called SI-SDR. W e also showed multiple f ailure cases for SDR that SI-SDR overcomes. Acknowledgements: The authors would like to thank Dr . Shinji W atanabe (JHU) and Dr . Antoine Liutkus and Dr . Fabian St ¨ oter (In- ria) for fruitful discussions. 6. REFERENCES [1] X. Lu, Y . Tsao, S. Matsuda, and C. Hori, “Speech enhance- ment based on deep denoising autoencoder , ” in Pr oc. ISCA In- terspeech , 2013. [2] F . J. W eninger, J. R. Hershey , J. Le Roux, and B. Schuller, “Discriminativ ely trained recurrent neural networks for single- channel speech separation, ” in Pr oc. GlobalSIP Machine Learning Applications in Speech Pr ocessing Symposium , 2014. [3] Y . Xu, J. Du, L.-R. Dai, and C.-H. Lee, “ An e xperimental study on speech enhancement based on deep neural networks, ” IEEE Signal Pr ocessing Letters , v ol. 21, no. 1, 2014. [4] H. Erdogan, J. R. Hershey , S. W atanabe, and J. Le Roux, “Phase-sensitiv e and recognition-boosted speech separation using deep recurrent neural networks, ” in Proc. IEEE Interna- tional Conference on Acoustics, Speech, and Signal Pr ocessing (ICASSP) , Apr . 2015. [5] F . W eninger, H. Erdogan, S. W atanabe, E. V incent, J. Le Roux, J. R. Hershey , and B. Schuller, “Speech enhancement with LSTM recurrent neural networks and its application to noise- robust ASR, ” in Pr oc. International Conference on Latent V ari- able Analysis and Signal Separation (L V A) , 2015. [6] J. R. Hershey , Z. Chen, J. Le Roux, and S. W atanabe, “Deep clustering: Discriminativ e embeddings for segmentation and separation, ” in Pr oc. IEEE International Confer ence on Acous- tics, Speech, and Signal Pr ocessing (ICASSP) , Mar . 2016. [7] Y . Isik, J. Le Roux, Z. Chen, S. W atanabe, and J. R. Hershey , “Single-channel multi-speaker separation using deep cluster- ing, ” in Pr oc. ISCA Interspeech , Sep. 2016. [8] D. Y u, M. Kolbæk, Z.-H. T an, and J. Jensen, “Permutation in- variant training of deep models for speaker -independent multi- talker speech separation, ” in Pr oc. IEEE International Confer- ence on Acoustics, Speech, and Signal Pr ocessing (ICASSP) , Mar . 2017. [9] M. Kolbæk, D. Y u, Z.-H. T an, and J. Jensen, “Multitalker Speech Separation With Utterance-Lev el Permutation In vari- ant T raining of Deep Recurrent Neural Networks, ” IEEE/ACM T ransactions on Audio, Speech, and Language Processing , vol. 25, no. 10, 2017. [10] D. W ang and J. Chen, “Supervised Speech Separation Based on Deep Learning: An Overvie w, ” in arXiv preprint arXiv:1708.07524 , 2017. [11] Z.-Q. W ang, J. Le Roux, and J. R. Hershey , “ Alternativ e ob- jectiv e functions for deep clustering, ” in Pr oc. IEEE Interna- tional Conference on Acoustics, Speech, and Signal Pr ocessing (ICASSP) , Apr . 2018. [12] A. W . Rix, J. G. Beerends, M. P . Hollier , and A. P . Hek- stra, “Perceptual evaluation of speech quality (PESQ)-a new method for speech quality assessment of telephone networks and codecs, ” in Pr oc. IEEE International Confer ence on Acoustics, Speech, and Signal Pr ocessing (ICASSP) , 2001. [13] P . C. Loizou, Speec h Enhancement: Theory and Practice . CRC Press, 2007. [14] R. Huber and B. K ollmeier , “Pemo-q – a new method for ob- jectiv e audio quality assessment using a model of auditory per- ception, ” IEEE T ransactions on Audio, Speech, and Language Pr ocessing , vol. 14, no. 6, 2006. [15] V . Emiya, E. V incent, N. Harlander , and V . Hohmann, “Sub- jectiv e and objecti ve quality assessment of audio source sep- aration, ” IEEE T ransactions on Audio, Speech, and Language Pr ocessing , vol. 19, no. 7, 2011. [16] C. H. T aal, R. C. Hendriks, R. Heusdens, and J. Jensen, “ A short-time objectiv e intelligibility measure for time-frequency weighted noisy speech, ” in Pr oc. IEEE International Confer- ence on Acoustics, Speech, and Signal Pr ocessing (ICASSP) , 2010. [17] E. V incent, R. Gribon val, and C. F ´ evotte, “Performance mea- surement in blind audio source separation, ” IEEE T ransactions on Audio, Speec h and Language Pr ocessing , v ol. 14, no. 4, Jul. 2006. [18] C. Raffel, B. McFee, E. J. Humphrey , J. Salamon, O. Nieto, D. Liang, D. P . Ellis, and C. C. Raffel, “mir eval: A transpar- ent implementation of common mir metrics, ” in Pr oc. Inter- national Society for Music Information Retrieval Confer ence (ISMIR) , 2014. [19] F .-R. St ¨ oter , A. Liutkus, and N. Ito, “The 2018 signal sep- aration ev aluation campaign, ” in Proc. International Confer- ence on Latent V ariable Analysis and Signal Separation (L V A) , 2018. [20] Y . Luo, Z. Chen, J. R. Hershey , J. Le Roux, and N. Mesgarani, “Deep clustering and conventional netw orks for music separa- tion: Stronger together, ” in Pr oc. IEEE International Confer- ence on Acoustics, Speech, and Signal Pr ocessing (ICASSP) , 2017. [21] Z.-Q. W ang, J. Le Roux, D. W ang, and J. R. Hershey , “End- to-end speech separation with unfolded iterative phase recon- struction, ” in Pr oc. ISCA Interspeech , Sep. 2018. [22] Z. Chen, Y . Luo, and N. Mesgarani, “Deep Attractor Network for Single-Microphone Speaker Separation, ” in Pr oc. IEEE International Confer ence on Acoustics, Speech, and Signal Pr ocessing (ICASSP) , 2017. [23] Y . Luo and N. Mesgarani, “T asNet: Surpassing ideal time- frequency masking for speech separation, ” arXiv pr eprint arXiv:1809.07454 , Sep. 2018. [24] S. V enkataramani, R. Higa, and P . Smaragdis, “Performance based cost functions for end-to-end speech separation, ” arXiv pr eprint arXiv:1806.00511 , 2018. [25] Y . Luo, Z. Chen, and N. Mesgarani, “Speaker-independent speech separation with deep attractor network, ” IEEE/ACM T ransactions on Audio, Speech, and Language Processing , 2018. [26] Y . Luo and N. Mesgarani, “T asNet: Time-Domain Audio Separation Network for Real-Time, Single-Channel Speech Separation, ” in arXiv pr eprint arXiv:1711.00541 , 2017.
Original Paper
Loading high-quality paper...
Comments & Academic Discussion
Loading comments...
Leave a Comment