Neural Music Synthesis for Flexible Timbre Control
The recent success of raw audio waveform synthesis models like WaveNet motivates a new approach for music synthesis, in which the entire process --- creating audio samples from a score and instrument information --- is modeled using generative neural…
Authors: Jong Wook Kim, Rachel Bittner, Aparna Kumar
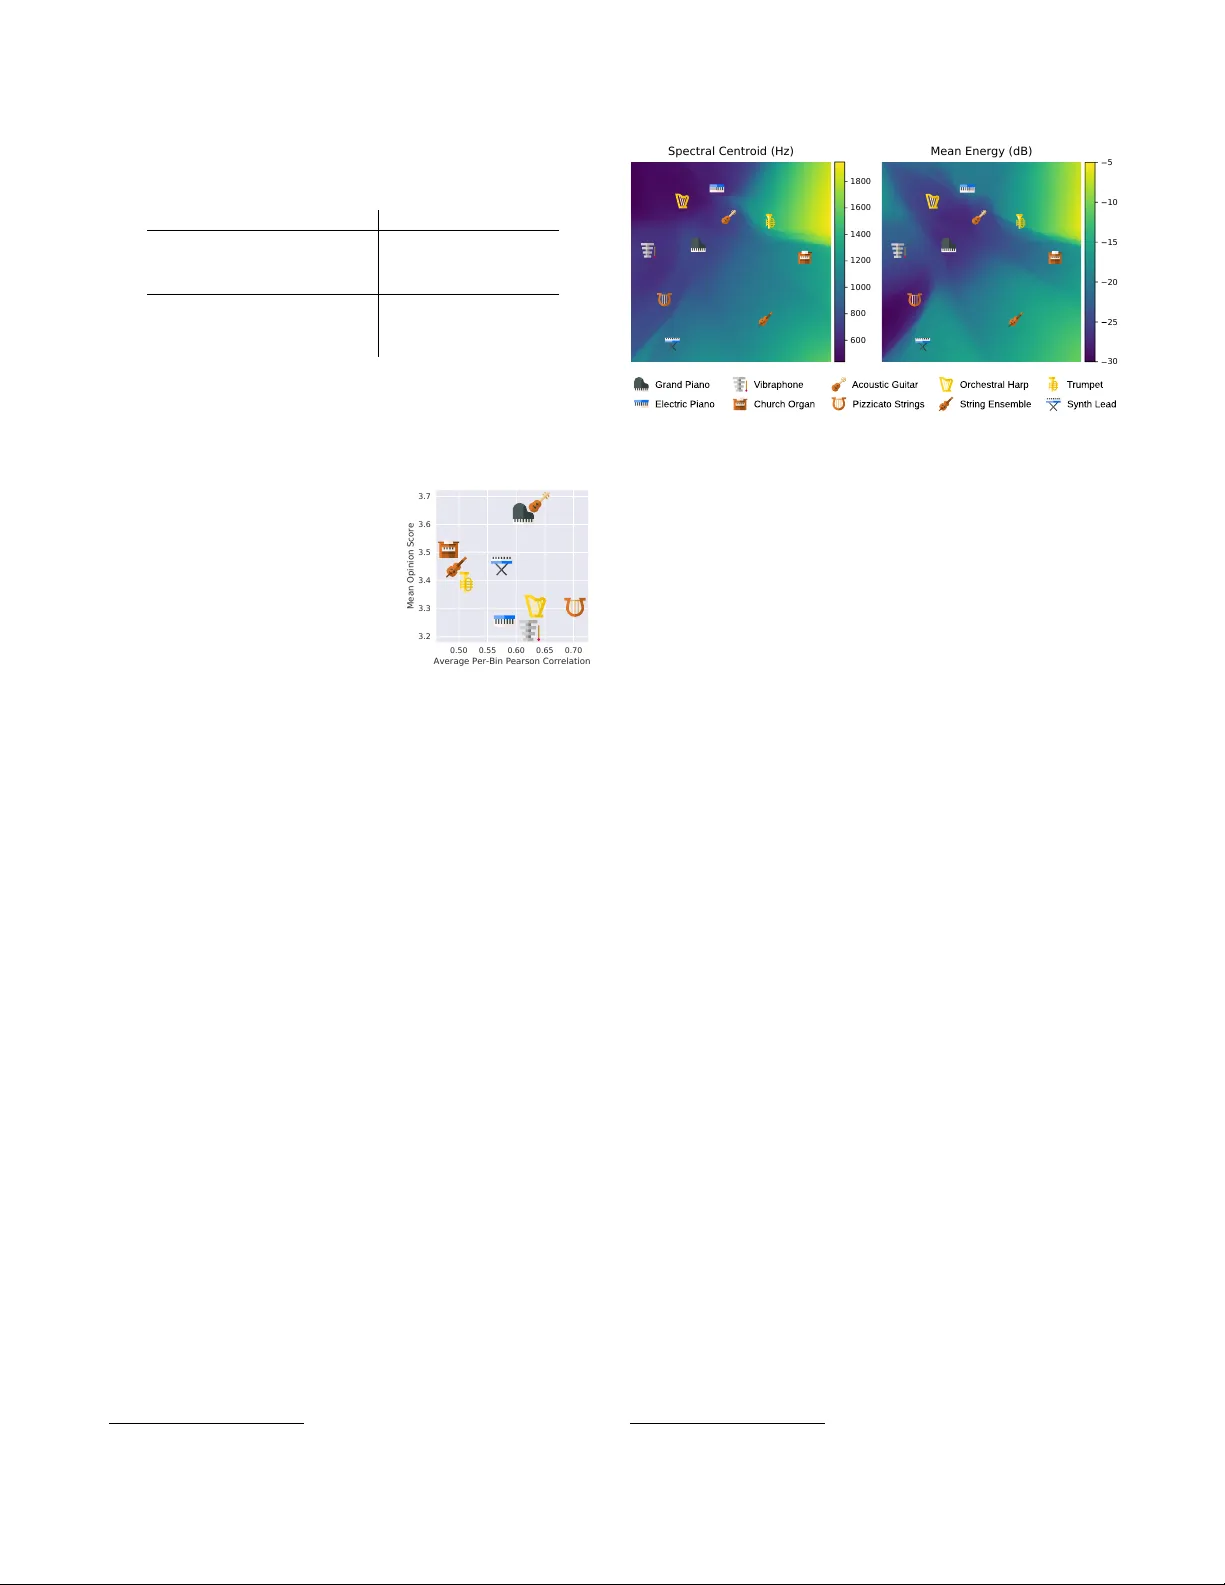
NEURAL MUSIC SYNTHESIS FOR FLEXIBLE TIMBRE CONTR OL J ong W ook Kim 1 , 2 , Rachel Bittner 2 , Aparna K umar 2 , J uan P ablo Bello 1 1 Music and Audio Research Laboratory , Ne w Y ork Uni v ersity , 2 Spotify ABSTRA CT The recent success of raw audio wa veform synthesis models lik e W av eNet motiv ates a new approach for music synthesis, in which the entire process — creating audio samples from a score and instru- ment information — is modeled using generati ve neural networks. This paper describes a neural music synthesis model with flexible timbre controls, which consists of a recurrent neural network condi- tioned on a learned instrument embedding followed by a W a veNet vocoder . The learned embedding space successfully captures the di- verse v ariations in timbres within a large dataset and enables timbre control and morphing by interpolating between instruments in the embedding space. The synthesis quality is e valuated both numeri- cally and perceptually , and an interactive web demo is presented. Index T erms — Music Synthesis, T imbre Embedding, W aveNet 1. INTR ODUCTION Musical synthesis, most commonly , is the process of generating mu- sical audio with given control parameters such as instrument type and note sequences over time. The primary difference between syn- thesis engines is the way in which timbr e is modeled and controlled. In general, it is difficult to design a synthesizer that both has dy- namic and intuiti ve timbre control and is able to span a wide range of timbres; most synthesizers change timbres by ha ving presets for different instrument classes or have a very limited space of timbre transformations av ailable for a single instrument type. In this paper , we present a flexible music synthesizer named Mel2Mel, which uses a learned, non-linear instrument embedding as timbre control parameters in conjunction with a learned synthe- sis engine based on W av eNet. Because the model has to learn the timbre – any information not specified in the note sequence – to suc- cessfully reconstruct the audio, the embedding space spans over the various aspects of timbre such as spectral and temporal en velopes of notes. This learned synthesis engine allows for flexible timbre control, and in particular , timbre morphing between instruments, as demonstrated in our interactiv e web demo. 1 1.1. Timbr e Control in Musical Synthesis Methods for music synthesis are based on a variety of techniques such as FM synthesis, subtracti ve synthesis, physical modeling, sample-based synthesis, and granular synthesis [1]. The method of controlling timbre and the lev el of flexibility depends on the param- eters of the exact method used, but in general, there is a trade-off between flexible timbre control ov er synthetic sounds (e.g. FM or subtractiv e synthesis) and a limited timbre control in more “realis- tic” sounds (e.g. sample-based or granular synthesis). Our w ork is aimed at achie ving the best of both worlds: fle xibly controlling a variety of realistic-sounding timbres. 1 https://neural- music- synthesis.github.io 1.2. Timbr e Morphing ‘Morphing’ of a sound can be generally described as making a per- ceptually gradual transition between two or more sounds [2]. A com- mon approach is to use a synthesis model and define sound morph- ing as a numerical interpolation of the model parameters. Sinusoidal models can directly interpolate between the energy proportions of the partials [3, 4]. Other models use parameters characterizing the spectral env elope [5, 6] or psychoacoustic features for perceptually linear transition [7]. A limitation of these approaches is that mor - phing can only be applied among the range of timbres cov ered by a certain synthesis model, whose expressiv eness or parameter set may be limited. T o overcome this, we employ a data-dri ven approach for music synthesis that is generalizable to all timbres in the dataset. 1.3. Timbr e Spaces and Embeddings T imbre is often modeled using a timbre space [8], in which similar timbres lie closer than dissimilar timbres. In psychoacoustics, mul- tidimensional scaling (MDS) is used to obtain a timbre space which preserves the timbral dissimilarities measured in perceptual experi- ments [9, 10]. Meanwhile, in music content analysis, timbre similar - ity is measured using computed features such as the Mel-frequency cepstral coefficients (MFCCs) [11], descriptors of the spectral en- velope [12], or hidden-layer weights of a neural network trained to distinguish dif ferent timbres [13]. A recent method [14] used a v ari- ational autoencoder [15] to obtain a timbre space, and unlike the abov e embeddings, the method is able to generate monophonic audio for a particular timbre embedding but does not consider the temporal ev olution of notes such as attacks and decays. In our work, we gen- erate a timbre embedding as a byproduct of polyphonic synthesis, which can utilize both spectral and temporal aspects of timbres. 1.4. Neural A udio Synthesis using W aveNet W av eNet [16] is a generati ve audio synthesis model that is able to produce realistic human speech. W aveNet achiev es this by learning an autoregressiv e distribution which predicts the next audio sample from the previous samples in its receptive field using a series of di- lated con volutions. T acotron [17] and Deep V oice [18] are W aveNet- based text-to-speech models which first predict a Mel spectrogram from text and use it to condition a W aveNet v ocoder . There are also a few notable applications of W aveNet on mu- sic, including NSynth [19], an autoencoder architecture which sepa- rately encodes monophonic pitch with learned timbral features, and the univ ersal music translation network [20] which uses a denoising autoencoder architecture that can extract and translate between mu- sical styles while preserving the melody . In [21], a W aveNet is used for music synthesis conditioned directly on note sequences, while only supporting piano sounds. Our model is similarly b uilt around W av eNet for its synthesis capability , while using a learned embed- ding space to flexibly control the timbre of polyphonic music. 2. METHOD The neural network shown in Figure 1, dubbed Mel2Mel, con- cerns the task of synthesizing music corresponding to given note sequences and timbre. The note sequences are supplied as a MIDI file and con verted to a piano roll representation, which contains the note timings and the corresponding note velocities for each of the 88 piano keys. W e use a fixed step size in time, and the piano roll representation is encoded as a matrix by quantizing the note timings to the nearest time step. The input to the neural network is a concatenation of two 88-dimensional piano roll representations, one for onsets and one for frames, comprising 176 dimensions in total: X = [ X onset ; X frame ] X onset p,t = v the active note · 1 a note at pitch p is first active at time t X frame p,t = v the active note · 1 a note at pitch p is activ e at time t where 1 is the indicator function, and v denotes the MIDI velocity scaled to [0 , 1] . This input representation is inspired by [22] which showed that jointly training on onsets and frames performs better than using frame information only; similarly , we want the network to maximally utilize the onsets which have the most relev ant informa- tion on the attack sounds, while still receiving the frame information. Another reason for using both onsets and frames is that, because of the time quantization, repeated notes become indistinguishable only using X frame when an offset is too close to the subsequent onset. The input goes through a linear 1x1 conv olution layer , which is essentially a time-distributed fully connected layer, follo wed by a FiLM layer , to be described in the follo wing subsection, which tak es the timbre embedding vector and transforms the features accord- ingly . After a bidirectional LSTM layer and another FiLM layer for timbre conditioning, another linear 1x1 con volution layer produces the Mel spectrogram prediction. The resulting Mel spectrogram is then fed to a W av eNet v ocoder to produce the music; Mel spectro- grams compactly con v ey suf ficient information for audio synthesis and hav e been successfully used for conditioning W av eNet [17, 18]. The use of bidirectional LSTM is justified because Mel spectrograms are constructed using a lar ger window than the step size, making it non-causal. The only nonlinearities in the network are in the LSTM, and there are no time-domain con volutions e xcept in W aveNet. 2.1. Timbr e Conditioning using FiLM Layers W e can think of this architecture as a multi-step process that shapes a piano roll into its Mel spectrogram, by applying appropriate tim- bre gi ven as side information. A FiLM layer [23] is a suitable choice for this task, because it can represent such action of shaping using an affine transformation of intermediate-layer features. For each in- strument to model, its timbre is represented in an embedding vector t , implemented as a learned matrix multiplication on one-hot en- coded instrument labels. A FiLM layer learns functions f and h , which are simply linear layers mapping the timbre embedding t to γ = f ( t ) and β = h ( t ) . The af fine transformation, or FiLM-ing, of intermediate-layer features F is then applied using feature-wise operations: FiLM( F | γ , β ) = γ F + β = f ( t ) F + h ( t ) . At a higher le vel, the affine transformations learned by the FiLM layers are nonlinearly transformed by the recurrent and conv olu- tional layers to respectively form temporal and spectral en velopes, which are two important aspects that characterize instrumental tim- bre. Using the first FiLM layer is essential because the recurrent layer needs to tak e timbre-dependent input to apply the temporal dy- namics according to the timbre, and the second FiLM layer can apply additional spectral en velope on the recurrent layer’ s output. conditioning FiLM FiLM Onsets and Frames Mel spectrogram 1x1 Conv 1x1 Conv Bi-LSTM WaveNet V ocoder Generated Audio Instrument Embedding Fig. 1 : The ov erall architecture of the proposed Mel2Mel model. The note sequences and instrument embeddings are combined to pre- dict the Mel spectrogram, which is then fed to the W aveNet vocoder . 2.2. Model Details The sampling rate of 16 kHz and µ -law encoding with 256 quanti- zation lev els are used for all audio as in the original W aveNet pa- per [16]. The predicted Mel spectrograms are defined using 80 area- normalized triangular filters distributed e venly between zero and the Nyquist frequency in the Mel scale. The STFT window length of 1,024 samples and the step size of 128 samples are used, which translate to 64 milliseconds and 8 milliseconds, respectiv ely . Un- less specified otherwise, we use 256 channels in all hidden layers and a two-dimensional embedding space for timbre conditioning. For Mel spectrogram prediction, an Adam optimizer with the initial learning rate of 0.002 is used, and the learning rate is halv ed ev ery 40,000 iterations. The model is trained for 100,000 iterations, where each iteration takes a mini-batch of 128 sequences of length 65,536, or 4.096 seconds. Three dif ferent loss functions are used and compared; for linear-scale Mel spectrograms S true and S pred : abs MSE = E ( S true − S pred ) 2 (1) log-abs MSE = E (log S true − log S pred ) 2 (2) tanh-log-abs MSE = E h tanh 1 4 log S true − tanh 1 4 log S pred 2 i (3) All logarithms above are natural, and the spectrogram magnitudes are clipped at -100 dB. Prepending tanh giv es a soft-thresholding effect where the errors in the lo w-energy ranges are penalized less than the errors close to 0 dB. For the W av eNet vocoder , we used n v-wav enet 2 , a real-time open-source implementation of autoregressi ve W aveNet by NVIDIA. This implementation limits the recurrent channel size at 64 and the skip channels at 256, because of the GPU memory capacity . A 20-layer W aveNet model was trained with the maximum dilation of 512, and the Mel spectrogram input is upsampled using two trans- posed con volution layers of window sizes 16 and 32 with strides of 8 and 16, respectiv ely . An Adam optimizer with the initial learning rate of 0.001 is used, and the learning rate is halved e very 100,000 iterations, for one million iterations in total. Each iteration takes a mini-batch of 4 sequences of length 16,384, i.e. 1.024 seconds. 2 https://github.com/NVIDIA/nv- wavenet 3. EXPERIMENTS 3.1. Datasets While it is ideal to use recorded audio of real instruments as the train- ing dataset, the largest multi-instrument polyphonic datasets av ail- able such as MusicNet [24] is highly ske wed, contains a limited va- riety of solo instrument recordings, and is expected to have a certain degree of labeling errors. So we resorted to using synthesized audio for training and collected MIDI files from www.piano-midi.de , which are also used in the MAPS Database [25]; these MIDI files are recorded from actual performances and contain expressiv e timing and v elocity information. W e ha ve selected 10 General MIDI instru- ments sho wn in Figure 4 co vering a wide variety of timbres, and 334 piano tracks are synthesized for each instrument using FluidSynth with the default SoundFont from MuseScore 3. The 334 tracks are randomly split into 320 for training and 14 for validation. The total size of the synthesized dataset is 3,340 tracks and 221 hours. For later experiments, we also generate a similar dataset using 100 manually selected instrument classes using a high-quality col- lection of SoundFonts, which contains a wide v ariety of timbres. 3.2. Ablation Study on Model Design In this series of experiments, we examine how slight variations in the model architecture af fect the performance and sho w that the pro- posed model achiev es the best performance in accurately predicting Mel spectrograms. The first two variations use either the frame data or the onset data only as the input. The next three omit an archi- tectural component: one of the two FiLM layers or the backward LSTM. The last four increase the network’ s capacity by adding the ReLU nonlinearity after the first con volution, using kernel sizes of 3 or 5 time steps in con volutions, or adding another LSTM layer . V ariations T rain loss ( × 10 3 ) V alidation loss ( × 10 3 ) Proposed 4.09 ± 0.30 4.75 ± 0.05 Frame input only 5.58 ± 0.32 5.92 ± 0.08 Onset input only 5.88 ± 0.37 6.97 ± 0.06 First FiLM only 4.55 ± 0.32 4.99 ± 0.06 Second FiLM only 7.65 ± 0.34 8.76 ± 0.08 Forward LSTM only 5.70 ± 0.43 5.56 ± 0.09 ReLU activ ation 3.97 ± 0.35 5.04 ± 0.06 3x1 con volutions 3.66 ± 0.28 5.12 ± 0.08 5x1 con volutions 3.49 ± 0.30 5.06 ± 0.08 2-layer LSTM 2.98 ± 0.20 4.96 ± 0.12 The train and validation losses as defined in Equation 3 are shown 3 in the table abo ve for each variation. Using both onsets and frames is indeed more effectiv e than using only one of them in the input. The first FiLM layer plays a more crucial role than the second, because only the first can help learn a timbre-dependent recurrent layer . As expected, remo ving the backward LSTM also hurt the performance. On the other hand, any v ariations increasing the model capacity make the model o verfit and fail to generalize to v alidation data. This implies that the proposed model has the optimal architecture among the tested variations, and more specifically , having the nonlinearity only in the single recurrent layer helps the model better generalize in predicting Mel spectrograms from unseen note sequences. A pos- sible interpretation is that the increased capacity is being used for memorizing the note sequences in the training dataset, as opposed to learning to model the timbral features independent of specific notes. 3 The means and standard deviations over the model checkpoints in 90k- 100k iterations are reported, to minimize the variability due to SGD. 55 110 220 440 880 1760 3520 Frequen cy (Hz) 0.2 0.4 0.6 0.8 1.0 Pearso n Co rrelati on w .r.t. Origi nal µ-la w on ly WN: groun d-tru th WN: tanh- log- abs WN: log- abs WN: abs a 1 2 3 4 5 6 7 Octav e (as in A4 = 440Hz) 0.4 0.5 0.6 0.7 0.8 Pearso n Co rrelati on w .r.t. Orig inal Gran d Pia no Elec tric Pi ano Vibra phon e Churc h Orga n Acous tic Gui tar Pizz icato Strin gs Orches tral Harp Strin g En sembl e Trump et Synth Lead b Fig. 2 : Pearson correlations between the reconstructed and original audio. (a) each stage of degradation. (b) per-instrument breakdown of the green curve on the left. The curves are smoothed and drawn with respect to each octav e for readability . 3.3. Synthesis Quality 3.3.1. Numerical Analysis of Audio De gradation The model goes through se veral stages of prediction, and each stage incurs a degradation of audio quality . There necessarily exists some degradation caused by the µ -law quantization, and W av eNet adds ad- ditional degradation due to its limited model capacity . The generated audio is further degraded when imperfect Mel spectrogram predic- tions are given. As an objectiv e measure of audio quality degradation at each stage and for each instrument, we plot the Pearson corre- lations between the synthesized and original audio in Figure 2. T o calculate and visualize the correlations with respect to e venly spaced octav es, we use 84-bin log-magnitude constant-Q transforms with 12 bins per octav e starting from C1 ( ≈ 32 . 70 Hz) and 512-sample steps. For ideal synthesis, the Pearson correlation should be close to 1 , and lower correlations indicate lar ger degradation from the original. Figure 2a sho ws the correlations for each stage of degradation and for different loss functions used for training the model. The degradations are more se vere in lo w frequencies in general, where the W a veNet model sees less number of periods of a note within its fixed receptive field length. The orange curve showing the corre- lations for W aveNet synthesis using ground-truth Mel spectrograms already e xhibits a significant drop from the top curv e; this defines an upper bound of Mel2Mel’ s synthesis quality . The lower three curves correspond to the loss functions in Equations 1-3, among which the abs MSE loss clearly performs the worse than the other two which hav e almost identical Pearson correlation curv e, indicating that the MSE loss is more effecti ve in the log-magnitude scale. Figure 2b shows the breakdo wn of the curve corresponding to Equation 3 into each of the 10 instruments. There are rather drastic differences among instruments, and most instruments have low Pear- son correlations in low pitches e xcept pizzicato strings. The reasons and implications of these trends are discussed in the following sub- section, in comparison with the subjectiv e audio quality test. 3.3.2. Subjective Audio Quality T est W e performed a cro wd-sourced test asking the listeners to rate the quality of 20-second audio segments using a 5-point mean opinion score (MOS) scale with 0.5-point steps. MOS allo ws a simple inter- face that is more suitable for non-e xpert listeners in a crowdsourcing setup than e.g. MUSHRA [26] and is used as a standard approach for assessing the perceptual quality of W a veNet syntheses [16, 27]. For each of the six configurations corresponding to the curves in Figure 2a in addition to the original audio, the first 20 seconds of the 140 validation tracks are ev aluated. The listeners are provided with a randomly selected segment at a time, and each segment is ev aluated by three listeners, comprising 420 samples in each configuration. Condition Mean Opinion Scores Original audio 4.301 ± 0.080 µ -law encode-decoded audio 3.876 ± 0.097 W av eNet: ground-truth Mel 3.383 ± 0.100 W av eNet: tanh-log-abs MSE 3.183 ± 0.106 W av eNet: log-abs MSE 3.019 ± 0.109 W av eNet: abs MSE 2.751 ± 0.110 This table shows the mean opinion scores (MOS) and the 95% confidence intervals, which generally follow the tendency similar to Figure 2. Using the soft-thresholding loss in Equation 3 results in the best subjecti ve quality among the three loss functions compared, more significantly so than the numerical comparison in Figure 2. 0.50 0.55 0.60 0.65 0.70 Average Per-Bin Pearson Correlation 3.2 3.3 3.4 3.5 3.6 3.7 Mean Opinion Score Fig. 3 : Per-instrument plot of synthesis quality , using the same icons as in Fig. 4. In Figure 3, we compare the nu- merically and perceptually evaluated quality for each instrument. The horizontal coordinates are the aver - age values for each curve in Fig- ure 2b . Pearson correlations between CQT are not necessarily indicati ve of the subjectiv e synthesis quality , be- cause a large contrast in the tempo- ral env elope can contribute to high Pearson correlations, notwithstanding a low perceptual quality . Reflecting this, more transient instruments in the lower right such as pizzicato strings achiev e higher Pearson correlations compared to the MOS, while more sustained instruments on the left side have relativ ely lower Pearson correlations but ha ve higher perceptual quality . 3.4. The Timbre Embedding Space T o make sense of how the learned embedding space conv eys timbre information, we construct a 320-by-320 grid that encloses all instru- ment embeddings and predict the Mel spectrogram conditioned on ev ery pix el in the grid. The spectral centroid and the mean energy corresponding to each pixel are plotted in Figure 4, which are in- dicativ e of the tw o main aspects of instrumental timbres: the spectral and temporal en velopes. A higher spectral centroid signifies stronger harmonic partials in high frequency , while a lower spectral centroid indicates that it is closer to a pure sine tone. Similarly , higher mean energy implies a more sustained tone, and low mean ener gy means that the note is transient and decays rather quickly . The points corre- sponding to the 10 instruments are annotated with instrument icons. 4 These plots show that the learned embedding space forms a continu- ous span over the timbres expressed by all instruments in the training data. This allo ws us to use the timbre embedding as a flexible con- trol space for the synthesizer, and timbre morphing is possible by interpolating along curves within the embedding space. T o illustrate how the model scales with more diverse timbre, we train the Mel2Mel model with 100 instruments using a 10- dimensional embedding, and we refer the readers to the web demo 5 for an interactiv e t -SNE visualization [28] of the embedding space. The 10-dimensional embedding space also contains a locally contin- uous timbre distribution of instruments, as in Figure 4, implying that the Mel2Mel model is capable of scaling to hundreds of instruments and to a higher-dimensional embedding space. 4 The icons are made by Freepik and licensed by CC 3.0 BY . 30 25 20 15 10 5 Mean E ner gy (dB) Spectra l Centr oid (Hz) 600 800 1000 1200 1400 1600 1800 Fig. 4 : V isualization of the embedding space trained in 2 dimen- sions, using spectral centroids and mean energy . The continuous colors are obtained for each pixel in the 320-by-320 grid and are related to the spectral and temporal en velopes of the timbres. In addition to the audio samples used in the experiments, our in- teractiv e web demo 5 showcases the capability of flexible timbre con- trol, where the Mel2Mel model runs on browser to con v ert preloaded or user-provided MIDI files into Mel spectrograms using a user- selected point in the embedding space. 4. CONCLUSIONS AND FUTURE DIRECTIONS W e showed that it is possible to build a music synthesis model by combining a recurrent neural network and FiLM conditioning lay- ers, followed by a W a veNet vocoder . It successfully learns to syn- thesize musical notes according to the giv en note sequence and tim- bre embedding in a continuous timbre space, providing the ability of flexible timbre control for music synthesizers. The capacity of the W av eNet, such as the number of residual channels and the number of layers, is limited due to the memory requirements of the nv-w av enet implementation, and the degrada- tion from µ -law quantization is also apparent in the experiments. These limitations can be o vercome by P arallel W aveNet [27], which does not require a special CUD A kernel for fast synthesis and uses a continuous probability distribution for generation, thereby a voiding the quantization noise. Our earlier e xperiments on continuous emis- sion failed to stably perform autoregressiv e sampling due to teacher forcing, and the future work includes inv estigating this phenomenon comparing with [21], which used a mixture of logistics distrib utions to produce high-quality piano sounds. A notable observation is that the W a veNet vocoder is able to syn- thesize polyphonic music from Mel spectrograms containing only 80 frequency bins, which are not even aligned to the tuning of the au- dio files. While more information av ailable from the increased bins should help synthesize more accurate audio, predicting the higher - dimensional representation becomes more compute-intensive and in- accurate, making 80 bins a sweet spot for use with W a veNet. In- troducing an adversarial loss function for predicting high-resolution images [29] can be a viable direction for predicting more accurate and realistic Mel spectrograms for conditioning W av eNet. Overall, we have demonstrated that a MIDI-to-audio synthesizer can be learned directly from audio, and that this learning allows for flexible timbre control. Once extended with an improved v ocoder and trained on real audio data, we believe the model can result in a powerful and quite realistic music synthesis model. 5 https://neural- music- synthesis.github.io 5. REFERENCES [1] Andrea Pejrolo and Scott B Metcalfe, Cr eating Sounds fr om Scratc h: A Practical Guide to Music Synthesis for Producer s and Composers , Oxford University Press, 2017. [2] Marcelo Freitas Caetano and Xavier Rodet, “ Automatic T im- bral Morphing of Musical Instrument Sounds by High-Le vel descriptors, ” in Proceedings of the International Computer Music Confer ence , 2010. [3] Naotoshi Osaka, “Timbre Interpolation of Sounds Using a Si- nusoidal Model, ” in Pr oceedings of the International Com- puter Music Confer ence , 1995. [4] Federico Boccardi and Carlo Drioli, “Sound Morphing with Gaussian Mixture Models, ” in Pr oceedings of D AFx , 2001. [5] Malcolm Slaney , Michele Cov ell, and Bud Lassiter , “ Auto- matic Audio Morphing, ” in Pr oceedings of the IEEE Interna- tional Confer ence on Acoustics, Speec h, and Signal Pr ocessing (ICASSP) , 1996, vol. 2. [6] T ony Ezzat, Ethan Meyers, James Glass, and T omaso Poggio, “Morphing Spectral Env elopes using Audio Flow, ” in Eur o- pean Confer ence on Speec h Communication and T echnology , 2005. [7] Marcelo Caetano and Xavier Rodet, “Musical Instrument Sound Morphing Guided by Perceptually Motiv ated Features, ” IEEE T ransactions on Audio, Speech, and Langua ge Pr ocess- ing , vol. 21, no. 8, 2013. [8] Geoffro y Peeters, Bruno L Giordano, Patrick Susini, Nicolas Misdariis, and Stephen McAdams, “The timbre T oolbox: Ex- tracting Audio Descriptors from Musical Signals, ” the J ournal of the Acoustical Society of America , vol. 130, no. 5, 2011. [9] John M Grey , “Multidimensional Perceptual Scaling of Musi- cal Timbres, ” the J ournal of the Acoustical Society of America , vol. 61, no. 5, 1977. [10] David L W essel, “T imbre Space as a Musical Control Struc- ture, ” Computer Music Journal , 1979. [11] Beth Logan, “Mel Frequency Cepstral Coefficients for Mu- sic Modeling, ” in Proceedings of the International Society for Music Information Retrieval (ISMIR) Confer ence , 2000. [12] Giulio Agostini, Maurizio Longari, and Emanuele Pollastri, “Musical instrument timbres classification with spectral fea- tures, ” EURASIP J ournal on Advances in Signal Pr ocessing , vol. 2003, no. 1, 2003. [13] Eric J Humphrey , Aron P Glennon, and Juan Pablo Bello, “Non-Linear Semantic Embedding for Organizing Large In- strument Sample Libraries, ” in Proceedings of the In- ternational Conference on Machine Learning Applications (ICMLA) , 2011, vol. 2. [14] Philippe Esling, Axel ChemlaRomeu-Santos, and Adrien Bit- ton, “Generativ e T imbre Spaces with V ariational Audio Syn- thesis, ” in Pr oceedings of the International Conference on Dig- ital Audio Ef fects (D AFx) , 2018. [15] Diederik P . Kingma and Max W elling, “Auto-Encoding V aria- tional Bayes, ” in Pr oceedings of the International Conference on Learning Repr esentations (ICLR) , 2014. [16] Aaron van den Oord, Sander Dieleman, Heig a Zen, Karen Si- monyan, Oriol V inyals, Alex Graves, Nal Kalchbrenner, An- drew Senior , and Koray Kavukcuoglu, “W a veNet: A Genera- tiv e Model for Raw Audio, ” , 2016. [17] Jonathan Shen, Ruoming Pang, Ron J W eiss, Mike Schuster, Navdeep Jaitly , Zongheng Y ang, Zhifeng Chen, Y u Zhang, Y uxuan W ang, Rj Skerrv-Ryan, et al., “Natural TTS Synthesis by Conditioning W aveNet on Mel Spectrogram Predictions, ” in Pr oceedings of the IEEE International Conference on Acous- tics, Speech, and Signal Pr ocessing (ICASSP) , 2018. [18] W ei Ping, Kainan Peng, Andrew Gibiansky , Sercan O. Arik, Ajay Kannan, Sharan Narang, Jonathan Raiman, and John Miller , “Deep V oice 3: 2000-Speak er Neural T ext-to-Speech, ” in Proceedings of the International Conference on Learning Repr esentations (ICLR) , 2018. [19] Jesse Engel, Cinjon Resnick, Adam Roberts, Sander Dieleman, Mohammad Norouzi, Douglas Eck, and Karen Simonyan, “Neural Audio Synthesis of Musical Notes with W aveNet Au- toencoders, ” in Pr oceedings of the International Conference on Machine Learning (ICML) , 2017, v ol. 70. [20] Noam Mor, Lior W olf, Adam Polyak, and Y aniv T aigman, “A Uni versal Music T ranslation Network, ” , 2018. [21] Anonymous, “Enabling Factorized Piano Music Modeling and Generation with the MAESTRO Dataset, ” Submitted to the International Conference on Learning Representations (ICLR) , 2019, under review . [22] Curtis Hawthorne, Erich Elsen, Jialin Song, Adam Roberts, Ian Simon, Colin Raf fel, Jesse Engel, Sageev Oore, and Douglas Eck, “Onsets and frames: Dual-Objective Piano Transcrip- tion, ” in Pr oceedings of the International Society for Music Information Retrieval (ISMIR) Confer ence , 2018. [23] Ethan Perez, Florian Strub, Harm De Vries, V incent Dumoulin, and Aaron Courville, “Film: V isual Reasoning with a General Conditioning Layer, ” in Pr oceedings of the Association for the Advancement of Artificial Intelligence (AAAI) Confer ence , 2018. [24] John Thickstun, Zaid Harchaoui, and Sham Kakade, “Learn- ing Features of Music from Scratch, ” in Pr oceedings of the In- ternational Conference on Learning Representations (ICLR) , 2017. [25] V alentin Emiya, Roland Badeau, and Bertrand David, “Mul- tipitch Estimation of Piano Sounds using a New Probabilistic Spectral Smoothness Principle, ” IEEE T ransactions on Audio, Speech, and Languag e Pr ocessing , vol. 18, no. 6, 2010. [26] “Method for the Subjectiv e Assessment of Intermediate Qual- ity Level of Coding Systems, ” in ITU-R Recommendation BS.1534-1 , 2001. [27] Aaron van den Oord, Y azhe Li, Igor Babuschkin, Karen Si- monyan, Oriol V inyals, K oray Kavukcuoglu, George van den Driessche, Edward Lockhart, Luis C Cobo, Florian Stimberg, et al., “Parallel W aveNet: Fast High-Fidelity Speech Synthe- sis, ” , 2017. [28] Laurens van der Maaten and Geoffrey Hinton, “V isualizing Data Using t-SNE, ” J ournal of Machine Learning Resear ch , vol. 9, no. No v , 2008. [29] Christian Ledig, Lucas Theis, Ferenc Husz ´ ar , Jose Caballero, Andrew Cunningham, Alejandro Acosta, Andrew P Aitken, Alykhan T ejani, Johannes T otz, Zehan W ang, et al., “Photo- Realistic Single Image Super-Resolution Using a Generative Adversarial Network., ” in Pr oceedings of the Confer ence on Computer V ision and P attern Recognition (CVPR) , 2017, vol. 2.
Original Paper
Loading high-quality paper...
Comments & Academic Discussion
Loading comments...
Leave a Comment