A study on speech enhancement using exponent-only floating point quantized neural network (EOFP-QNN)
Numerous studies have investigated the effectiveness of neural network quantization on pattern classification tasks. The present study, for the first time, investigated the performance of speech enhancement (a regression task in speech processing) us…
Authors: Yi-Te Hsu, Yu-Chen Lin, Szu-Wei Fu
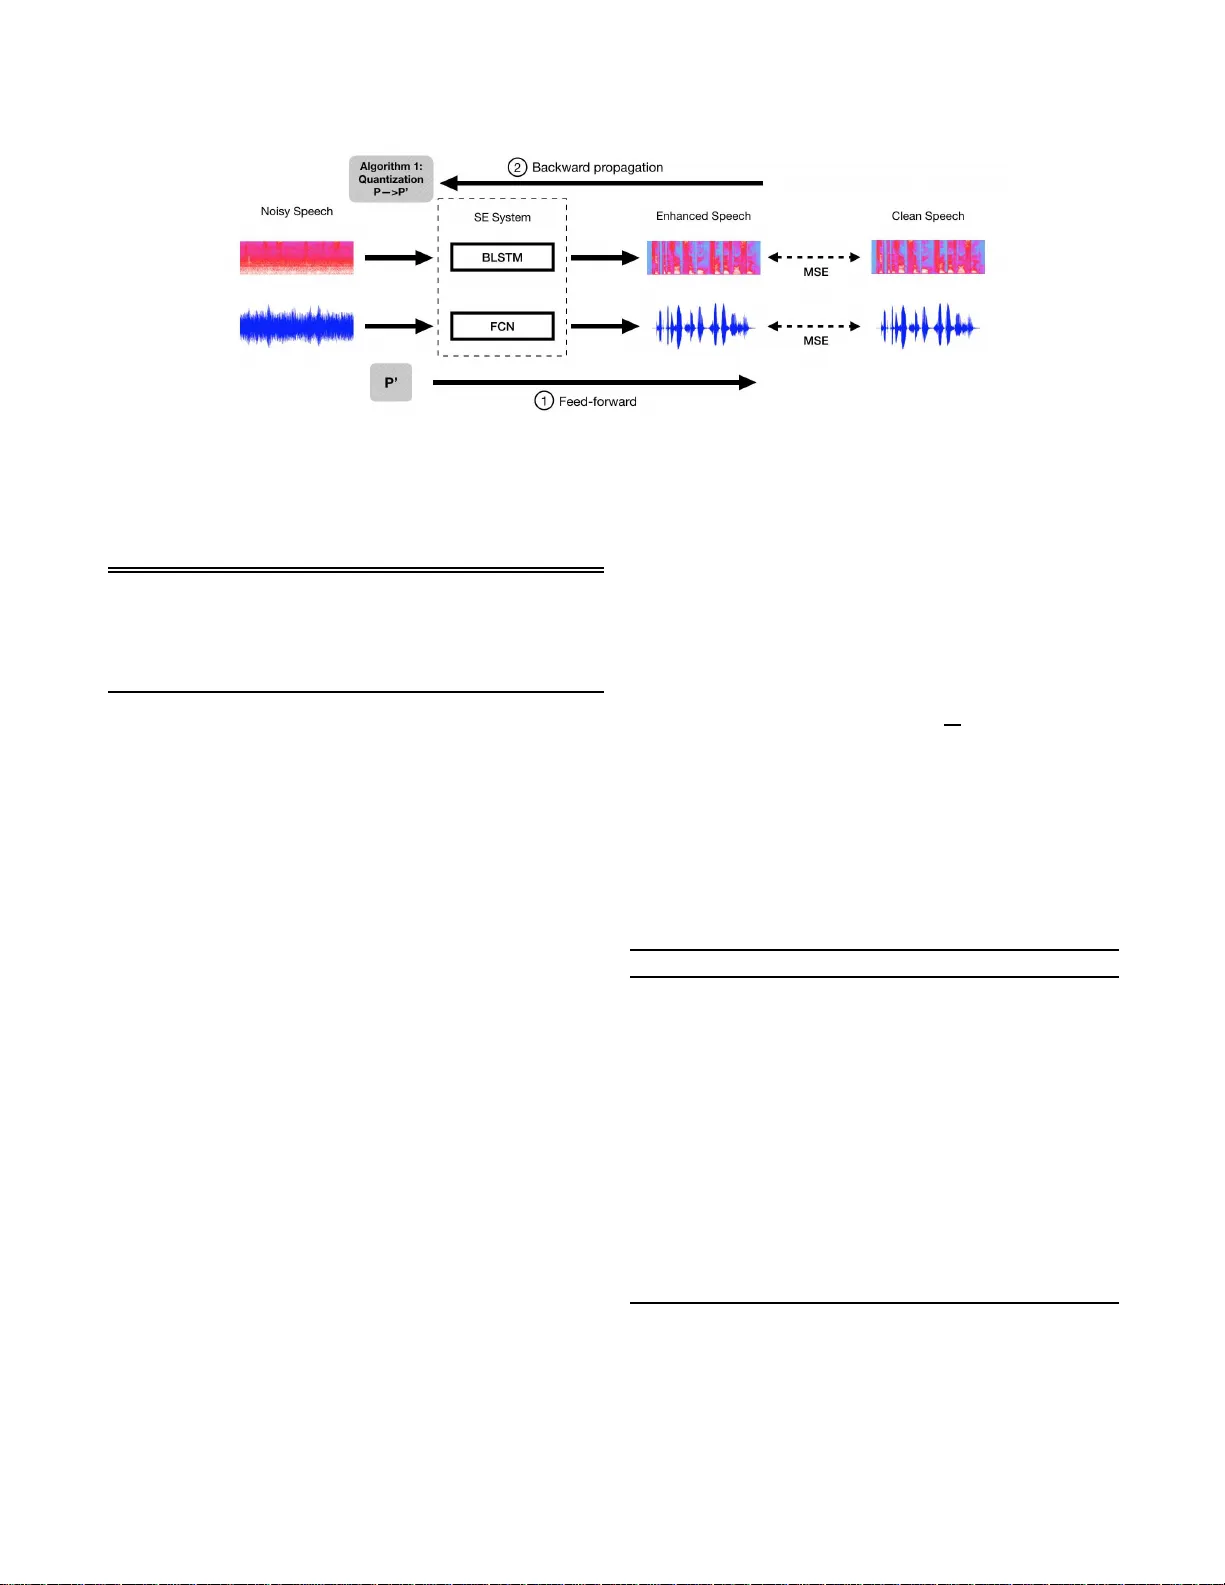
A STUD Y ON SPEECH ENHANCEMENT USING EXPONENT -ONL Y FLO A TING POINT QU ANT IZED NEURAL NETW O RK (EOFP-QNN) Y i-T e Hsu 1 , Y u-Chen Lin 2 , Szu-W ei Fu 1 , 2 , Y u Tsao 1 , T ei-W ei K uo 1 , 2 1 Research Center for Information T echnolog y Innovation, Ac ademia Sinica, T aiwan 2 Department of Computer Science and Information Engineering, National T aiwan Univ ersit y b01901 112@ntu.edu.tw , f0492207 7@csie.ntu.edu.tw , d0492 2007@ntu.edu .tw , yu.tsao@citi.si nica.edu.tw , ktw@csie.ntu.edu.tw ABSTRA CT Numerou s studies have in vestigated the effecti veness of neural network quantization on pattern classification tasks. The p resent study , for the first time, in vestigated the perfo r- mance of speech en hancemen t (a re g ression task in speech processing) using a novel exponent-o nly floating-po int qua n- tized neural network (EOFP-QNN). The pr oposed EOFP- QNN consists of two stages: mantissa-quan tization and exponent-q uantization. In the mantissa-quan tization stage, EOFP-QNN learns how to quantize the mantissa bits o f the model para meters while pre ser ving the regression accuracy in the least mantissa precision. I n the exponent-qu a ntization stage, the expon e nt part of the par ameters is further q uantized without any additio nal per forman c e degrad ation. W e e valu- ated the pro posed EOFP q u antization technique on two types of neu ral networks, namely , bidirectional long short-term memory (BLSTM) and fu lly conv o lu tional neural network (FCN), on a speech enh ancement task. Experimen tal results showed that the model sizes can be significan tly red uced (the m odel sizes of th e quantized BLSTM and FCN mo dels were only 1 8.75% an d 21.8 9%, respectively , comp ared to those o f the original models) while main taining a satisfactory speech-enh ancement p erforma nce. Index T erms — Spe e ch Enhancement, Quantized Neural Networks, Floatin g Po int, Emb edded Devices 1. INTRODUCTION In the past few y e ars, de ep learnin g (DL)-based models have been widely used in many d ifferent application s. Because of their deep structures, DL -based models can ef fectively ex- tract representative features when perfo r ming classification and regression tasks. It has b een con firmed that DL-based approa c h es o utperfo r m traditional methods in image recog- nition [1, 2], speech recognition [3–5], o bject detection [6– 8], and natural lang uage processing [9 – 11]. On the other hand, also b ecause of their deep stru ctures, DL -based ap- proach e s generally require larger storage and hig her computa- tional c o sts than trad itio nal meth ods. T o meet these dem ands, many physical h a rdware devices, such as graphic s p r ocessing units an d ten sor processing units [12], hav e been d e veloped. Furthermo re, to facilitate re a l-time pre dictions in an Intern et- of-Thin gs (IoT) [13] system, researcher s also seek solutio n s to install DL-b ased mo dels in embedd ed systems. One p oten- tial solution to this go al is to comp r ess DL -based mo dels by using so me quantization techniq ue. Numerou s model quan tization techn iques have been pr o- posed. Courb ariaux et al. [14] propo sed the BinaryCo nnect algorithm , which uses only 1 bit for all the weights in the model. E xperimen tal results showed that the q uantized mo del still yielded state-of-th e-art classification r esults. Gong et al. [15] used a clustering techniq ue to find the respec tive floating- point cen troid values to r e place the origin al weights. Experi- mental results showed th at the com pressed model can still ob- tain 1% lo ss in the top-5 reco gnition rate. Zho u et al. [16] pro- posed an incremen tal network qu antization (INQ) tech nique to convert a pre- tr ained full-precision conv o lutional neural network (CNN) mode l in to a low-precision one. Based on this techniqu e, all the weigh ts are con stra in ed to be p owers of 2 and 0. In the end, I NQ uses 5 bit-width to reach slightly better r esults in terms of top-1 and top- 5 erro rs. Based on our literature survey , mo st compre ssion techniqu es are p roposed to b e ap plied to DL - based mo dels fo r classification tasks, such as image and speech r ecognition [15 – 23]. Un like the outpu t of a classification task, which classifies the data into a set of categories, the o utput of a regression task will b e continu ous variables. Owing to the different outpu t formats, the effect of m odel co mpression on regression tasks should be very d if- ferent from that on c lassification tasks [24]. I n th is study , we focus our attention on d eriving a n e w model qu antization al- gorithm fo r the speec h enhance ment ( SE ) task, which is an importan t regre ssion task in speech sig n al p rocessing. The go al o f DL-based SE is to map a no isy speech sig- nal into an enhanced on e with improved intelligibility and quality [25]. One class of DL- based SE m ethods perform s spectral mappin g that aim s to transform no isy spectral fea- tures to clean on es. Effecti ve m odels used to char acterize the m a p ping functio n include deep d enoising au to encoder (DD AE ) [26, 27], deep neura l network (DNN) [28, 29], CNN [30, 31], an d b idirectional lo ng shor t-term memory (BLSTM) [3 2, 33]. An other class of approac hes aims to map a no ise speech wav eform to a clean o ne directly to address possible distortions cau sed by imperfect phase info rmation in th e spectra l mapping -based approach es, an d the fully con - volutional n etwork (FCN) is usually used to characte r ize the mapping fun ction [34 – 37]. Clearly , the storage a nd com- putational cost are imp o rtant factors to be co nsidered when implementin g SE mo dels in pr actical application s. Howe ver , based on o u r literature survey , only few studies have inv esti- gated potential appro aches to r educe the mo del complexity o f SE mo dels. I n [3 8], a weights sh aring an d quan tization tech- nique is used to compr ess a DNN-b ased SE mo del. The re- sults showed that although the model size can b e redu c e d, the enhanced speech qua lity was no tably redu ced as compared to the o ne gen erated by the origin al model. Meanwhile, K o et al. inv estigates the r elation of precision scalin g pro cess and SE pe r formanc e [24]. The results showed that removin g too many bits can c a use notable perform ance degradation . For practical application s, the storage requir ement and achievable perfor mance need to be considered simultaneo usly . T o strike a go od balance of storage requ irement and per f ormance, this study pr oposes a novel expon ent-only floatin g-point (EOFP) neural n etwork quan tization techniqu e for th e SE task. W e selected one spectral mapping approach, namely , BLSTM, and one waveform mappin g appro ach, n amely , FCN, to test the EOFP-QNN on an SE task. The rem ainder of this paper is organized a s follows. Sec- tion 2 introdu ces the re lated works an d the motiv ation for the study . Section 3 details th e pr o posed EOFP- QN N . Section 4 presents th e experim e ntal setup and results. Fina lly , Section 5 provides the con c luding rem arks. 2. BA CKGR OUND AND M O TIV A TION 2.1. Speech enhancement Generally speakin g, a DL-based SE includes two phases: of - fline and online. In the offline phase, th e noisy spe e ch is first fed into the SE system to generate the enhance d speech . A criterion is used to ev aluate the difference of th e en hanced speech and th e clean ref erences, such as the mea n squ are er- ror (MSE) [2 6, 28, 30, 32], L1 norm [36], or short-time objec- ti ve intelligib ility measu re (STOI) [35]. Then, the difference is used to upd a te the param eters in the DL-b a sed mo dels. In the online phase, the n o isy signal is fe d in to the trained SE system to obtain the enhan ced speech. Con ventionally , SE is ap p lied on noisy speech with tim e- frequen cy repre sen tation (e.g., mag nitude spectrum ). Th u s, an additio n al signal analy sis process is needed to convert speech wa veform s to spectr al f eatures b efore denoising. T o reconstruc t the waveform d omain, most of spectral map ping- based methods simply borrow the phase from the n oisy speech. Recently , wa vefo rm mapping-b ased m ethods [35] are also propo sed, wh ich direc tly enhan ce the noisy wa ve- form. I n this study , we selected BLSTM an d FCN fo r the spectral mapp ing and wa vefor m m a p ping, r espectiv ely , as two repr esentativ e s to the regression tasks. The p arameters in the BLSTM and FCN models before compression were 32-bit floating-p oint values, and their p erforma nces were in vestigated after quantizin g to the propo sed EOFP-QNNs. 2.2. Floa ting-Point Representatio n in a DL-based Model A DL-based mo del gene r ally has a large numb er of param- eters, an d most of these param eters are stored in a floating- point d ata format. Th e single-pr ecision floating-p o int format of I E EE 75 4 [39] is th e most common f ormat to repr esent the parameters, and its binary f ormat is shown in Fig. 1 . I n the figure, a single-prec ision floating-p oint value, bits con sists o f three p arts: bits [0] indicates th e sign , b its [1 : 8 ] rep resent the exponent (an unsign ed integer) , and b its [9 : 31] stand fo r the mantissa (or sign ifica n d or fraction) . Except for th e sign, the exponent, and the mantissa are no t repr esented direc tly . Be- cause the expon e nt is an un sig n ed integer, the smallest rep re- sentable exponent mu st b e shifted to 1 by an additiona l bias . Thus, the d e c imal value of single-p recision data ca n be calc u - lated by the following equatio n : ( v al ue ) 10 = ( − 1) sign ∗ ( mantissa ) 10 ∗ 2 ( exponent ) 10 − bias (1) where the bias is 127 ( 2 7 − 1 ); the d e cimal man tissa value is ( mantissa ) 10 = 1 + 23 X i =1 b 8+ i ∗ 2 − i (2) T ak ing Fig. 1 for example, we o btain the d ecimal value of the single-prec isio n data as 0.01 2 33999 9. . . . Fig. 1 : Single pre c ision floating p oint fo rmat. Now we can see that sign and exponent determ ine the range, wher eas man tissa determin es the p recision. So me ap - plications may need high -precision floating p o ints, while such floating po ints ar e not always n ecessary . T able 1 shows a pre- liminary experiment b a sed on a BLSTM SE model. For all the p arameters in a neu ral ne twork model, we masked a se- quence of bits to zero fr om the end. As a result, the d ecimal values of pa r ameters were changed , yet the enhanced sp eech presented similar qu alities. The pr eliminary experimen t r e- sult in T able 1 inspired us to qua ntize the floatin g-point data parameters and thus comp ress the SE mo d els. Nev ertheless, two setup s n eed to be d etermined in the pro- posed algorithm . Th e fir st on e is to d ecide wh en the qu a n tiza- tion shou ld be executed. The secon d one is to de ter mine the Fig. 2 : T he training procedu re of the mantissa-qu antization. T able 1 : A prelimin ary experime n ts on speech qu ality an d intelligibility under different precisions. Mask Binary Decimal PESQ Bits 0 0. . . 11011 01101 10 0.012 33999 9 . . . 2.144 6 0. . . 11011 0 0000 00 0.012 33994 9 . . . 2.135 12 0. . . 00000 00000 00 0.012 33673 0 . . . 2.141 approp riate number o f b its to quantize, to ensu r e that the e n - hanced speech have similar qua lities to that with th e original single-prec isio n value. 3. EOFP-QNN This section p resents the pro posed EOFP quan tization tech- nique for SE m odels. First, we introd uce the overall pr oce- dure of the EOFP-Q NN . Th en, we detail th e ph ilosophies of the mantissa-quan tization an d exponent-q uantization. 3.1. Overall Procedure of the Model Quantizatio n An intuitive quantization meth od is to load out the mod el ( the parameters are sav ed in a single-pr ecision forma t) after train- ing and d irectly quan tize the parameters in th e model fo r test- ing. Because the p arameters are trained b a sed on the origi- nal single-p recision form a t, this d irect quan tization approa c h may cau se perf ormance d egradations. T o overcome this is- sue, we intend to make the model learn h ow to quantize the parameters d uring th e train ing phase. Fig. 2 shows the pro- cedure of the SE neu ral network model with our q uantization and p arameter update, in two gray boxes. As shown in Fi g. 2, we execute the quantization at the end of each ep och. Mor e spe c ifically , we allo w th e model to tr a in , to lear n the precise w e ig hts in single-pr ecision pa- rameters within one ep och. After one epoch is co mpleted, we quan tize all the par ameters a n d forc e them to be less b it- width p arameters. Note that the b it-width deno tes the nu mber of rem aining bits after quantization . Then , th e mo del must use the quantize d p arameters in the fee d-forward p art in the following epo ch. At the end o f tr aining, we get the qu antized SE mo del. In shor t, we adop t a straightfor ward solution that directly quantizes the param eters P in each epoch . The q u an- tized parameter s P’ will be fed in the next training epoch . 3.2. Mantissa-quant ization The per centage of the man tissa p art is 23 32 , wh ic h appr o aches 72% in the single-pr ecision floating poin t. Therefo re, we choose to quantize the param eters with less-pre c ision man- tissa as our first step. Before qu antization, we first d efine th e target numb er n of bits to qu antize becau se different appli- cations may be tolerant to dif fere nt precision. The natural limitation of n is in the r ange [0:23] since on ly 23 bits are used in th e mantissa par t. It is no ted th a t n = 0 means tha t n o quantization process is applied . Algorithm 1 Mantissa-quan tization Input: Th e target nu mber of bits n to q uantize, for a model with l lay e r s, { L i | i = 1 , 2 , . . . , l } 1: mas k ← [1 0 1 1 . . . 1 31 − n 0 31 − n +1 0 31 − n +2 . . . 0 31 ] 2: for each lay er L i do 3: for each floating poin t pa r ameter p in L i do 4: Con vert p to 32 -bit bin a ry bits [0 : 31 ] 5: if 23 > n > 0 t hen 6: bits [31 − n ] = bits [31 − n ] || b its [31 − n + 1 ] 7: else if n = 23 then 8: bits [1 : 8] = bits [1 : 8] + bits [9] , wher e + is the binary addition oper ator 9: bits [0 : 31 ] = bits [0 : 31 ] & mask [0 : 31] 10: Con vert bits back to p Algorithm 1 pre sents the mantissa-q uantization, which is executed after the backward-p ropagatio n. More specifically , after the backward prop agation, Algo rithm 1 first defines a 32-bit-len gth binar y mask , wher e the hea d 32 − n bits are 1s and the latter n bits are 0s. For each par ameter p in the layer of the model, a co nditional rou nding arithm etic is used to quan tize the value of the man tissa part. W e first con vert the d ata ty pe of p fr om floating point to binary format b its . If the target nu mber n is gre ater than 0 and less than 23 ( i.e., 23 − n bits ar e remain in g in th e mantissa part), then the value of bits [3 1 − n ] is obtain ed b y p e rforming the OR oper a tion o n original bits [31 − n ] a n d b its [32 − n ] . If n is 23 , meaning there is no b it left in the mantissa p a rt, then the whole exponent par- tition, bits [1 : 8] , is add ed to the value of bits [9] , the first bit of th e man tissa. The m ain rea so n that we divided our algo- rithm into two cases, 2 3 > n > 0 an d n = 2 3 , was to av o id an overflo w pr o blem in th e m antissa part. As mention ed in Section 2.2, the exponent represen ts an unsigned integer, an d thus it is not po ssible that bits [1 : 8 ] are all 1s. Thus, we ca n directly use the round ing arithmetic to quantize . Howe ver, it is possible that bi ts [9 : 3 1 − n ] are all 1s in the man tissa part of all param eters that m ay cause an overflow pro blem. Ac- cording ly , we pr opose our con ditional roundin g arith m etic to calculate the value o f the last bit only . The last n bits ar e re- moved by tak in g the inter section with the binar y mask , an d the bin ary b its is converted back to the floa tin g po int p . After all the parameter s are updated (q u antized), th e feed - forward process is th en perfor m ed using the qua n tized model. 3.3. Exponent- quantization According to th e format of the sing le-precision floating point, it is o bvious that ther e are at mo st 2 3 bits th a t we c a n q uan- tize in the mantissa-qu antization, where there are 9 b its r e- maining. As mention ed in Section 2 .2, the single- precision floating-p o int fo rmat provides a bias by helping the exponent part r epresent th e r ange from 2 − 127 to 2 128 , where 2 − 127 and 2 128 are defined as 0 and ∞ , respectively . T aking the sign b it into consid eration, we have the exact rang e of th e remaining 9 bits as ± 0 , ± 2 − 126 to ± 2 127 , and ±∞ , which is a gr eat range to represent values in gener al. Howe ver, the normalizatio n p rocess, which is often exe- cuted d u ring the DL- based mo d el tr aining, r estricts the value of the param eter in a certain ran ge, and , thus, there ar e on ly marginal d ifferences am ong the values of the param e ters in each la y er . I n other words, after the normalizatio n , it is not necessary to rep resent the parameters using a wide range of flo ating point format. Ther efore, we prop ose the statisti- cal expon ent-quan tization to further compress the DL-b ased model by analyzing the distribution of the par ameter values. Algorithm 2 p resents the exp o nent-qu antization for each parameter . Th e o utput of the quantized par a meter includ es three attributes. Before q uantizing, we need to calculate the least numb er of bits l en th at can represent the ran ge o f all parameters. W e first determine the max imum and minimum log 2 values, except for the ze ro value, among all p a rameters in the m odel Λ . Th en, w e calculate the least length l en by applying the ceiling f u nction to log 2 [( max − min + 1) + 1] . The la st 1 in the eq uation is to rep resent one more value, zero, Algorithm 2 Expon ent-quan tization Input: Th e n e u ral network mod e l Λ Output: the leng th l en , min imum expon ent log 2 value min , a quan tized model Λ ′ 1: Find the max imum and minim um exp onent log 2 value, max and min of all param eters, except for zero value 2: l en = C eil { log 2 [( max − min + 1 ) + 1] } 3: for each p arameter p in Λ do 4: Fetch the expone nt ( e ) 10 of p 5: if p = 0 t hen 6: ( e ′ ) 10 = 0 7: else 8: ( e ′ ) 10 = ( e ) 10 − min + 1 9: p ′ with ( e ′ ) 10 as exponent is r eplaced in Λ ′ 10: return len, mi n, Λ ′ which cannot be written in the power o f 2. In the expon ent- quantization , we first fetch the expon ent pa rt ( e ) 10 of p for ev ery p arameter in Λ . If the value of p equals 0, ( e ′ ) 10 is still assigned with 0 . O th erwise, the value of th e new exponen t ( e ′ ) 10 is th e difference betwee n ( e ) 10 and min , represen ting the offset by the mi n . Because 0 already indicates a 0 value, ( e ′ ) 10 must add 1 to shift th e offset by 1 and is then stored in p ′ . The qu a n tized p ′ with ( e ′ ) 10 as the new exponent is fi- nally stored in the qu antized mod el Λ ′ . T aking the ran ge [ ± 0 , ± 2 − 29 , . . . , ± 2 0 ] fo r example, we have max of 0 and min of − 29 . T hus, we o nly need 6 ( = 1+ ⌈ log 2 [0 − ( − 29) + 2] ⌉ ) bits, whose 1 is the sign bit, to rep resent all o f the p ossible values. The quantized expo nents ( e ′ ) 10 of ± 0 , ± 2 − 29 and ± 2 0 are 0 , 1 and 3 0 respectively . It is clear that there is no perfor- mance d egradation when app lying the expo nent-qu a n tization since we on ly reduce the number of b its to re p resent a param- eter value instead of chang ing the value. 4. EXPERIMENTS This section presen ts the experimental resu lts o f the EOFP- QNN on the SE task. W e used two stand ardized ev aluation metrics: p erceptual evaluation of sp e e ch qu ality (PESQ) [40], and short-time ob jecti ve in telligibility measur e (STOI) [41], to test the p erforma nce. PESQ was design ed to e valuate the quality of pro cessed speech , and the score ran ges from -0.5 to 4.5. A high er PESQ score de notes that the enh a nced speech has better speech quality . STOI was designed to comp u te th e speech in te llig ibility , and the score ranges f r om 0 to 1. A higher STOI value in dicates better speech in telligibility . 4.1. Experimenta l Setup The TIMI T co rpus [42] was used to p repare the tr a in ing and test sets. For the trainin g set, all of th e 4 6 20 tr aining utter- ances from the T IMIT corpus wer e used a nd furth er co rrupted with 100 different noise type s at eight signal- to-noise (SNR) lev els (f rom -10 dB to 25 dB with a step of 5 d B) in a rand om manner . For the test set, we selected another 10 0 u tter ances (different from those used in the training s et) from TIMIT and corru pted these utteran ces u sing a nother three noise sig- nals (en gine, street, a nd two talkers) a t fo ur SNR le vels (- 6, 0, 6, an d 12 dB). Note that we in tentionally d esigned both noise types and SNR levels of the train ing a n d test sets to be different to make th e expe rimental cond itions mo re realistic. For the BLST M spec tr al mapp ing system , th e speech was parametrize d into a sequence of 25 7-dimen sional log-p ower spectral (LPS) featu res, an d the mappin g was perfor med in a frame-b y-frame man ner . The BLSTM m odel has two b idirec- tional LSTM layers, each with 25 7 n odes; one f ully con nected layer, with 300 n o des; and a fully connected output lay e r . W e used the similar mod e l structur e as tha t used in [ 3 2]. For th e FCN wa vefo rm m apping system, the mapp ing was d ir ectly perfor med in the ra w-wa vefo rm domain , and, thus, no ad- ditional analysis a nd restoratio n pr ocess were r equired. Th e FCM mod el used here share d the similar struc ture as that used in [35], and an en d-to-en d u tter ance en hancemen t was ca rried out. The FCN mode l has ten convolutional layers with zero padding to pre ser ve th e same size as the input. Th e first ten layers consist of 30 filters, with a filter size of 5 5. Ther e is one filter with a size of 5 5 in the last layer . I n the exper iments, we applied th e pro posed EOFP-QNN to bo th the BLSTM and the FCN models. For a fair comparison , the stru cture of the mod- els and the n umber of the ep ochs for train ing we r e the same for the origin al full-precisio n model and th e quan tized m odel. 4.2. Experimenta l Result 4.2.1. Pr op osed meth od versus dir ectly chopping in the mantissa-qu antization As presented earlier , the EOFP technique applies a condi- tional ro unding proce ss to rem ove unnecessary bits in the mantissa-quan tization. Ano ther way to remove bits is directly chopp in g, n amely , keep in g th e first (32 − n ) target bits and directly ch opping the o ther n b its. Here, we com pared the perfor mance of the conditiona l ro unding and directly cho p- ping p rocesses for mantissa-qu antization. W e tested the per- forman ce usin g seven different bit-width s (bit-wid th = 26, 20, 14, 12, 11, 10 and 9) to com p are with the non - quantized model (bit- w id th = 32) . Th e results are listed in T able 2. Each value in T able 2 is a n average PESQ score over th ree noise types and four SNR le vels. Fr o m th e tab le, we first note tha t, when the proposed method w as used, the PESQ suffered only marginal red uctions. For example, wh en the bit number was redu c ed from 32 to 9, the PESQ re d uctions w e re 1.49% (2.14 4 to 2.11 2) an d -0.58 % (f rom 2.064 to 2.076 ) , re- spectiv ely , f o r BLSTM and FCN, respe cti vely . Note that th e negativ e sign means that the perfo r mance e ven be c omes b et- ter than the no n-quan tized m odel. The results sug gest that we may quantize all the mantissa bits and keep o nly 1 sign bit and 8 exponen t bits to rep lace the origina l 32- bit data wh ile main- taining similar enha n cement perform ance. Howe ver, wh en we rep laced our method with the d irectly chop ping proce ss, the PESQ scores were notab ly decre a sed. When r e ducing the bit number fro m 32 to 9 b its, we n oted clear PESQ reduc- tions of 2.1 5% (from 2.1 44 to 2 .098) and 9.8 8 % ( f rom 2.06 4 to 1.860) , respectively , for BLSTM and FCN mo dels. T able 2 : PESQ sco res of qu antized BLSTM and FCN u sing the p roposed con ditional roun ding and d irectly choppin g for mantissa-quan tization with different bit-width s. Bit- BLSTM FCN width Proposed Chopping Proposed Chopping 32 2.144 2.144 2.064 2.064 26 2.136 2.135 2.074 2.064 20 2.125 2.141 2.081 2.074 14 2.135 2.136 2.093 2.086 12 2.157 2.147 2.088 2.064 11 2.131 2.144 2.070 2.078 10 2.154 2.146 2.054 2.035 9 2.112 2.098 2.076 1.860 4.2.2. BLSTM an d FCN with mantissa-quantizatio n From T able 2, we can o bserve that the bit-width can be re- duced from 32 to 9 with only a margin al PESQ pe rforman ce drop for the BLSTM an d FCN m odel. In T ab le 3, we listed the d etailed PESQ and STOI scores unde r specific SNR levels for both th e BLSTM and the FCN system. Each value is an av erage scor e of th ree n o ise ty pes. Th e score s o f the unpro- cessed noisy speech are also shown f o r com parison. From T a ble 3, we first no te that, when the EOFP quan ti- zation techniqu e was applied, there was o nly a 1.49% (fro m 2.144 to 2.11 2) P ESQ score redu ction and a 0.13% (from 0.753 to 0.752) STOI sco re redu ction f or the BLSTM sys- tem. Similarly fo r the FCN system, we note a - 0.54% ( 2.064 to 2.076) PESQ red uction and a 2.91% (from 0.75 5 to 0 .733) STOI red u ction. Note that in this set of experiments, we quan- tized e very parameter in the model from a 3 2-bit floating point to a 9 -bit exponent. Th e total com pression ra tio w as 3.56 . The results in T able 3 confirm tha t, alth o ugh th e mod el size had b een notably c ompressed, the objective qua lity an d intel- ligibility scores were on ly marginally red uced. W e also noted that FCN suffered mo re STOI red uctions than BLSTM after quantization . A possible reason is that FCN includ e s comp ar- ativ e ly fewer param e te r s than BLSTM. Th erefore, each pa- rameter in FCN play s a m o re importan t role than BLSTM, and th us model quantiza tio n induces a bit stron ger influen c e. 4.2.3. BLSTM an d FCN with e xpo nent-qu antization Next, we apply the exponent-q uantization to f urther re - duce the mode l size. The overall quan tization is te r med T able 3 : Detailed PESQ and STOI scores for the origin a l an d q uantized mo dels u nder specific SNR cond itions. Th e q uantized models w e re q uantized by the mantissa-qu antization (with 9 bit-width) . Noisy BLSTM (LPS) FCN (Raw waveform) Original Quantized Original Quantized SNR(dB) PESQ STOI PESQ STOI PESQ STOI PESQ STOI PESQ STOI -6dB 1.223 0.509 1.4 99 0.568 1.488 0.569 1.38 1 0.548 1. 4 44 0.538 0dB 1.622 0.659 1.9 83 0.728 1.962 0.725 1.84 3 0.719 1. 8 77 0.700 6dB 2.016 0.800 2.3 93 0.832 2.361 0.831 2.30 4 0.840 2. 2 81 0.814 12dB 2.439 0.901 2.6 99 0.885 2.638 0.884 2.72 9 0.911 2. 7 00 0.878 A verage 1.825 0.717 2.1 44 0.753 2.112 0.752 2.06 4 0.755 2. 0 76 0.733 ”mantissa+exponen t-quantizatio n” in th e fo llowing d iscu s- sion. As mentioned in Section 3.3, we first n eed to identify the optimal bit-width befo r e quantization . T o this end, we ex- amined the d istribution o f the log 2 value of a ll the parame ter s in BLSTM and FCN. Th e resu lts ar e shown in Fig. 3. From the fig ure, mo st p arameters in the two mod els are distributed in a nar row region, suggesting that we are allowed to fur ther reduce the b it-width. Next, we calculated the maxim um and the m inimum lo g 2 value of e a c h mo del a n d the b it- width from Algor ithm 2 . Then, we o btained th e { max , min , l en } as { 0, -23, 5 } and as { 10, -26 , 6 } fo r the BLSTM and FCN models, respectively . On the basis of the co mputed { max , min , le n } , we can furthe r pe r form expo nent-qu antization on the BLSTM and FCN mo dels. T h e quantization results of the two mo dels usin g the m a ntissa-quantization , an d the mantissa+exponen t-quantizatio n ar e listed in the f o urth an d fifth raws, resp ecti vely , in T able 4. -126 127 BLSTM FCN # of parameters 0 1×10 5 2×10 5 3×10 5 4×10 5 # of parameters 0 5×10 5 10×10 5 15×10 5 log 2 value of parameters −100 −50 0 50 100 Fig. 3 : Distrib ution of th e model log 2 parameter values for BLSTM (top) and FCN (bottom ). From T ables 3 and 4 , we can see th at the model sizes of th e ”m antissa-quantizatio n” an d ”man tissa+exponent- quantization ” quantized BLSTM mod els were only 28.1 3 % (3,162 /11,24 2 ) and 18.7 5% (2,1 08/11,2 42), respectively , when compare d to the o riginal (non- q uantized) BLSTM model. Please n ote that the expon ent-quan tization only further reduced the mo del size but did n ot cause extra T able 4 : Nu mber o f parame ter s and the correspo nding bytes used in the BLSTM and FCN bef ore and after qu antization. BLSTM FCN Number of param eters 2,877 ,929 450,3 01 Single-pre c ision size (KB) 11 ,242 1,759 Mantissa-quan tization (KB) 3,162 495 + Expo nent-qu antization (KB) 2,1 08 385 PESQ and STOI reduc tions. W e observed similar trends for the FCN m odels. The mod el sizes o f the ”mantissa- quantization ” and ”mantissa+exponen t-quantizatio n” quan- tized FCN models were only 28.1 4 % (4 95/1,75 9) and 21 .89% (385/1 ,759), respectiv ely , when comparing to the origin al (non- quantized) FCN model. On the basis of the above observations, we can conclude th at, by using the proposed EOFP-QNN (man tissa+exponent-qu antization), we can sig- nificantly redu c e the mod el sizes of BLSTM and FCN while maintaining satisfactory q uality and intelligibility scores a s compare d to the original non-q uantized models. 5. CONC LUSIONS In this work, we proposed a novel EOFP-QNN a n d e valu- ated its effect on SE p erforman ce. T o the b est of o ur knowl- edge, this is the first stud y that investigates the effect of mo d el compression based on the floa ting-poin t qu a ntization tech- nique on th e SE task. The r e sults showed that, by ap plying the EOFP , the model sizes of the quantized m odels were on ly 18.75 % and 21.89 % for BLSTM and FCN, respec tively , com- pared to the original models. W ith such significant mod el size reduction s, the quality and intellig ib ility scores were o nly marginally degraded . For example, the PESQ an d STOI score reduction s were 1 .49% and 0. 1 3% f or the BLSTM SE system . The results sugg est that, by using the proposed EOFP quan- tization technique, we may b e able to install an SE system with a comp ressed DL-based mo del in embedded d evices to operate in an IoT environment. 6. REFERENCES [1] K. Simonyan and A. Zisserma n , “V ery deep conv o lu- tional networks for large-scale im age r ecognition , ” in Pr oc. ICLR , 20 15. [2] K. He, X. Zh a n g, S. Ren, and J. Sun, “Deep residu al learning for image r ecognition , ” in Pr o c. CVPR , 20 16, pp. 770 – 778. [3] A. Graves, A. M o hamed, and G. Hinton, “Spe ech r ecog- nition with deep r e current n eural networks, ” in Pr oc. ICASSP , 2013 , pp. 6645 –6649 . [4] G. Hinton, L. Den g, D. Y u, G. Dah l, A. Mo- hamed, N. Jaitly , A . Senior, V . V an houcke, P . N g uyen, T . Sainath, et al., “ De ep neur al networks for aco ustic modeling in speech recog nition: The shared vie ws of four research g roups, ” I EEE Signal pr o cessing maga- zine , vol. 2 9, n o . 6, pp. 8 2–97, 2 012. [5] L. Deng, J. Li, J.-T . Huang, K. Y ao, D. Y u, F . Seide, M. Seltzer , G. Zweig, X. He, J. Williams, et al., “Re- cent adv an ces in de ep lea r ning for speech research at microsoft, ” in P r oc. ICASSP , 2013 , p p. 8604 – 8608. [6] P . L u o, Y . Tian, X. W ang, an d X. T an g, “ Switchable deep network for p edestrian d etection, ” in Pr oc. CVPR , 2014, pp. 899– 906. [7] X. Z eng, W . Ouyang , and X. W ang, “Multi-stage con- textual deep learn ing fo r p edestrian detection , ” in Pr oc. ICCV , 2013 , pp . 121 –128. [8] P . Sermanet, K. Kavukcu oglu, S. Chintala, and Y . Le- Cun, “Pedestrian detection with unsuperv ised m u lti- stage featu re learn ing, ” in Pr o c. CVPR , 201 3, pp . 36 26– 3633. [9] R. Collob ert and J. W eston, “ A unified architectur e fo r natural lan g uage processing : Deep n eural network s with multitask learning , ” in Pr oc. ICML , 2008 , pp. 160– 167. [10] T . Mikolov , I. Sutskever , K . Chen, G. Corrado , and J. Dean , “Distributed rep r esentations o f words and phrases and the ir com p ositionality , ” in Pr oc. NIPS , 2013, pp. 3111 –3119 . [11] T . Mikolov , M. Karafi ´ at, L. Burget, J. ˇ Cernock ` y, an d S. Khudanpur, “Recur rent neu ral network based lan- guage model, ” in Pr oc. Interspeech , 2010, pp. 1045 – 1048. [12] N. P . Joup pi, C. Y oun g, N. Patil, D. Patterson, G. Agrawal, R. Bajwa, S. Bates, S. Bhatia, N. Bo den, A. Borchers, et al., “I n-datacenter perfo r mance analysis of a tensor processing unit, ” in Pr oc. ISCA , 201 7, pp. 1–12. [13] Y . K. Chen, “Cha llen ges and opp ortunities of inter net of things, ” in Pr o c. ASPD AC , 20 1 2, pp. 38 3–388 . [14] M . Courbariaux, Y . Bengio, and J.-P . Da v id , “Bina- ryconn ect: T raining deep neu r al networks with binary weights du r ing propa gations, ” in Pr o c. NIPS , 2 015, pp. 3105– 3113. [15] Y . Go n g, L. Liu , M . Y ang, and L. Bour d ev , “Compre ss- ing deep conv o lutional networks u sing vector quan tiza- tion, ” arXiv preprint arXiv:1412.61 15 , 2014. [16] A . Zhou, A. Y ao, Y . Gu o, L. Xu, and Y . Che n , “In- cremental n etwork quan tization: T o wards lossless cnns with low-precision weights, ” in Pr o c. ICLR , 2017. [17] P . H. Hung , C. H. Lee, S. W . Y ang , V . S. Somayazulu, Y . K. Chen, and S. Y . Chien, “Bridge deep learn ing to the ph ysical world: An efficient m ethod to qu antize network, ” in Pr oc. SiPS , 201 5 , pp . 1–6 . [18] K . Hwang and W . Sung, “Fixed-poin t f eedforward deep neural n e twork design using weights +1, 0, and 1, ” in Pr oc. SiPS , 2014 , pp. 1–6 . [19] F . Seide, H. Fu, J. Droppo , G. Li, and D. Y u, “1 -bit stochastic grad ient descent and its application to data- parallel distributed trainin g of speech dnns, ” in Pr oc . Interspeech , 2014, pp. 1058 – 1062. [20] R. Prab hav alkar, O. Alshar if , A. Brug u ier , an d L. Mc- Graw , “On the co m pression of recurrent neural net- works with an app lication to lv csr acou stic m odeling for embedd e d speech recog nition, ” in Pr o c. ICASSP , 2 016, pp. 5970– 5 974. [21] S. Han , J. Kang, H. Mao , Y . Hu , X. Li, Y . Li, D. Xie, H. L u o, S. Y ao, Y . W ang, H. Y an g, a n d W . J. Dally , “Ese: Efficient sp eech r ecognition engin e with sparse lstm on fpga, ” in Pr oc. FPGA , 2 017, pp . 7 5–84. [22] Y . Lin , S. Han, H. Mao, Y . W a n g, and W . Dally , “Deep gradient compr ession: Reducin g the comm unication bandwidth for distributed training, ” in Pr oc. ICLR , 2018. [23] Y . W ang, J. L i, and Y . Gong, “Small-f ootprint high- perfor mance deep n eural network-based speech recog- nition using split-v q, ” in Pr o c. ICASS P , 2 015, p p. 4984 – 4988. [24] J. H. K o , J. Fro mm, M. Philipo se, I. T ashe v , and S. Zar ar , “Precision scaling of neural networks for efficient audio processing, ” arXiv pr eprint arXiv:171 2.0134 0 , 2017. [25] D . W ang and J. Chen , “Super vised speech separation based on deep learning: An overview , ” IEEE /A CM T ransactions on A udio, Speech, and Language Pr ocess- ing , vol. 26, no . 10, p p . 17 0 2–172 6, Oct 20 18. [26] X. Lu, Y . Tsao, S. Matsuda, and C. Hori, “Speech en - hancemen t based o n deep deno ising au toencode r, ” in Pr oc. In terspeech , 20 1 3, p p . 43 6 –440. [27] B. Xia and C. Bao, “W ien e r filtering based speech en- hancemen t with weighted deno ising auto- encoder and noise classification, ” Speech Commun ication , vol. 60 , pp. 13– 2 9, 201 4 . [28] Y . Xu, J. Du , L. R. Dai, and C. H. Lee, “ A regression approa c h to speech enhan cement based on deep neu ral networks, ” IEEE/ACM T ransactions on Audio, S peech, and Lang uage Pr ocessing , vol. 23, no. 1 , pp. 7–1 9, Jan 2015. [29] M. K o lbk, Z.-H. T an, J. Jen sen , M. Kolbk, Z.-H. T an, and J. Jensen, “Speech intelligibility poten tial of gen - eral and specialized deep neural network based speech enhancem ent sy stems, ” IEEE/ACM T ransactions on A u- dio, Speech, an d Language Pr ocessing , vol. 25, n o. 1, pp. 153 – 167, Nov 20 17. [30] S.-W . Fu, Y . Tsao, an d X. Lu, “SNR-aw are conv o- lutional neur al network modeling for speech enhan ce- ment, ” in Pr o c. Interspeech , 2016, pp. 3768 –3772 . [31] S.-W . Fu, T .-Y H u , Y . Tsao, and X. Lu, “Complex spec- trogram enhan cement by conv o lu tional neural network with multi-m etrics learnin g, ” in MLSP , 2 017, pp. 1–6. [32] H. Erdo gan, S. W atanabe J. R. Hershey , an d J. L e Roux, “Phase-sensitive and recognition -boosted speech sepa- ration using d eep r e current n e ural n etworks, ” in Pr o c. ICASSP , 2015 , pp. 708– 712. [33] Z. Chen, S. W atanabe, H. Erdoga n , and J. R. Hershey , “Speech en hancemen t and recogn ition u sing multi-task learning o f lon g sho r t-term memo ry recurren t neural networks, ” in Pr oc. In terspeech , 2 015, pp . 1–5. [34] S.-W . Fu, Y . Tsao, X. Lu, and H. Kawai, “Raw wa vefo rm-based s peech enh a n cement b y fully con vo- lutional n etworks, ” arXiv preprint arXiv:1703 .0220 5 , 2017. [35] S.-W . Fu, T .-W . W ang , Y . Tsao , X. Lu, an d H. Kawai, “End-to - end wa veform u tterance en hancement fo r d irect ev aluatio n me tr ics o ptimization by fully conv o lutional neural networks, ” IEEE /AC M T ransactions on Audio, Speech, a nd Langu age Pr ocessing , vol. 26 , n o . 9, pp. 1570– 1584, Sept 201 8. [36] S. Pascual, A . Bona f onte, and J. Serr, “Segan: Spee c h enhancem ent g enerative adversarial network, ” in Pr oc. Interspeech , 201 7, pp . 364 2–364 6. [37] A. V an Den Oord, S. Diele m an, H. Zen, K. Simonyan, O. V inyals, A. Graves, N. Kalchb renner, A. Sen io r , and K. Kavukcuoglu , “W avenet: A gener ati ve model f o r r aw audio, ” arXiv pr eprint arXiv:160 9.0349 9 , 2016. [38] H . Sun and S. L i, “ An optim iza tion m ethod for speech enhancem ent based on d eep neural network, ” in IOP Confer en ce S eries: Earth a nd E n vir o nmental S cience . IOP Publishing, 2017 , vol. 69, p. 0 1 2139. [39] I nstitute of Electrical and E lectronics En gineers, “Ieee standard fo r binary floatin g-point arithmetic, ” ANSI/IEEE Std 754-198 5 , 1 985. [40] I TU-T Recomm endation, “Percep tual ev alu ation of speech quality (p esq): An o bjectiv e method for en d- to-end speech quality assessment of n arrow-band tele- phone networks an d speech codecs, ” Rec. ITU-T P . 862 , Jan 2001. [41] C. H. T aal, R. C. Hend riks, R. Heusd ens, and J. Jensen , “ An algo rithm fo r in telligibility prediction o f time– frequen cy weighte d n o isy speech, ” IE EE T ransactions on Audio, Speech, and La nguage Pr ocessing , v ol. 1 9, no. 7, pp. 2125 –2136 , Sept 2011. [42] J. S. Garofo lo, L. L amel, W . M. Fisher, J. G. Fiscus, and D. S. Pallett, “Dar p a timit acoustic-p honetic c o ntinous speech corpus cd -rom. nist spe e ch d isc 1 -1.1, ” NASA STI/Recon technical r eport n , vol. 93, 19 93.
Original Paper
Loading high-quality paper...
Comments & Academic Discussion
Loading comments...
Leave a Comment