The Sound of Pixels
We introduce PixelPlayer, a system that, by leveraging large amounts of unlabeled videos, learns to locate image regions which produce sounds and separate the input sounds into a set of components that represents the sound from each pixel. Our approa…
Authors: Hang Zhao, Chuang Gan, Andrew Rouditchenko
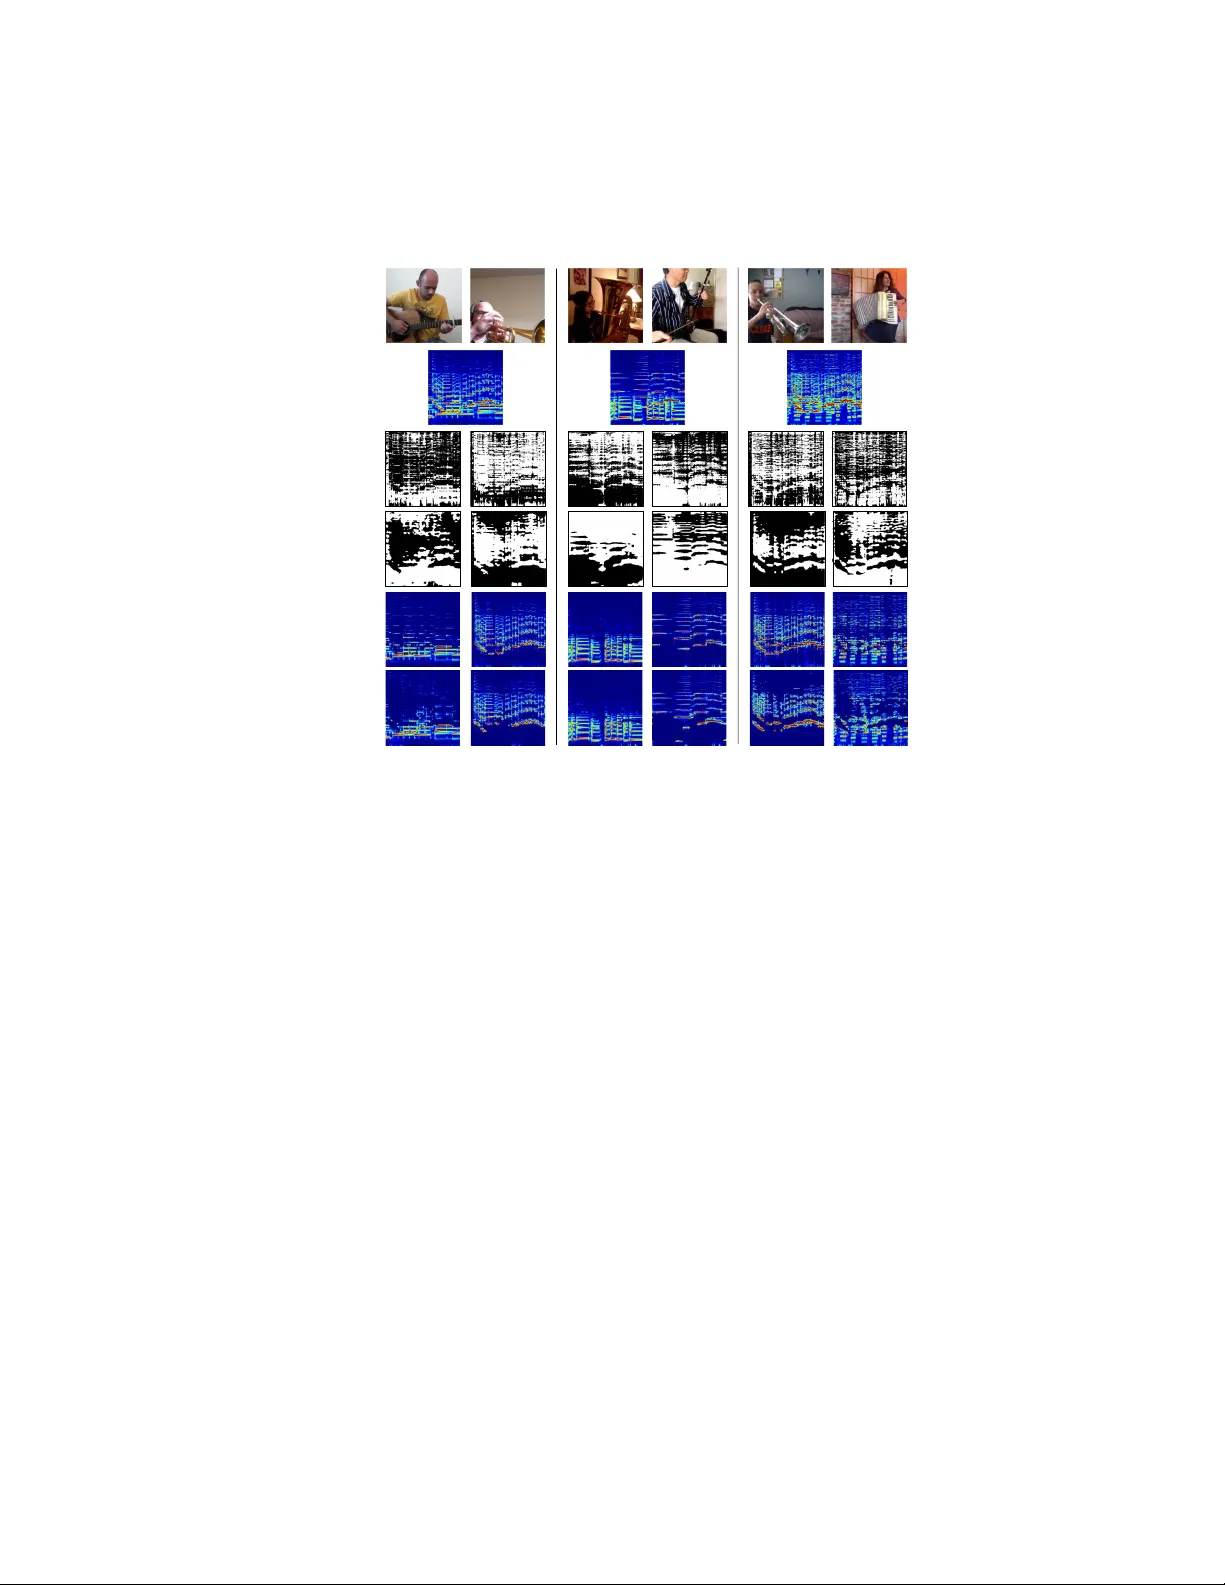
The Sound of Pixels Hang Zhao 1 , Ch uang Gan 1 , 2 , Andrew Rouditc henk o 1 , Carl V ondric k 1 , 3 , Josh McDermott 1 , and An tonio T orralba 1 1 Massac husetts Institute of T echnology 2 MIT-IBM W atson AI Lab 3 Colum bia Univ ersity { hangzhao,roudi,jhm,torralba } @mit.edu { ganchuang1990,cvondrick } @gmail.com Abstract. W e introduce PixelPlay er, a system that, b y leveraging large amoun ts of unlab eled videos, learns to lo cate image regions which pro- duce sounds and separate the input sounds in to a set of comp onents that represen ts the sound from eac h pixel. Our approach capitalizes on the natural synchronization of the visual and audio mo dalities to learn mo d- els that join tly parse sounds and images, without requiring additional man ual sup ervision. Exp erimental results on a newly collected MUSIC dataset sho w that our prop osed Mix-and-Separate framew ork outp er- forms se veral baselines on source separation. Qualitativ e results suggest our model learns to ground sounds in vision, enabling app lications suc h as independen tly adjusting the v olume of sound sources. Keyw ords: cross-modal learning, sound separation and localization 1 In tro duction The w orld generates a rich source of visual and auditory signals. Our visual and auditory systems are able to recognize ob jects in the w orld, segment im- age regions cov ered b y the ob jects, and isolate sounds pro duced b y ob jects. While auditory scene analysis [5] is widely studied in the fields of environmen tal sound recognition [26,18] and source separation [4,6,52,41,42,9], the natural syn- c hronization b etw een vision and sound can provide a rich supervisory signal for grounding sounds in vision [17,21,28]. T raining systems to recognize ob jects from vision or sound typically requires large amounts of sup ervision. In this pap er, ho wev er, we lev erage joint audio-visual learning to disco ver ob jects that pro duce sound in the w orld without man ual sup ervision [36,30,1]. W e show that by working with b oth auditory and visual information, w e can learn in an unsup ervised wa y to recognize ob jects from their visual app earance or the sound they mak e, to lo calize ob jects in images, and to separate the audio comp onen t coming from eac h ob ject. W e introduce a new system called Pix- elPla yer. Given an input video, PixelPlay er jointly separates the accompan ying 2 Hang Zhao et al. Fig. 1. PixelPla yer lo calizes sound sources in a video and separates the audio into its comp onen ts without supervision. The figure sho ws: a) The input video frames I ( x, y , t ), and the video mono sound signal S ( t ). b) The system estimates the output sound signals S out ( x, y, t ) b y separating the input sound. Each output comp onent corresponds to the sound coming from a spatial location ( x, y ) in the video. c) Component audio w av eforms at 11 example lo cations; straight lines indicate silence. d) The system’s estimation of the sound energy (or volume) of each pixel. e) Clustering of sound comp onents in the pixel space. The same color is assigned to pixels with similar sounds. As an example application of clustering, PixelPla yer would enable the independent volume control of differen t sound sources in videos. audio into comp onents and spatially lo calizes them in the video. PixelPlay er enables us to listen to the sound originating from each pixel in the video. Fig. 1 shows a working example of PixelPla yer (chec k the pro ject w ebsite 4 for sample videos and in teractive demos). In this example, the system has b een trained with a large n um b er of videos containing p eople playing instrumen ts in differen t combinations, including solos and duets. No lab el is pro vided on what instrumen ts are presen t in eac h video, where they are lo cated, and how they sound. During test time, the input (Fig. 1.a) is a video of several instruments pla yed together containing the visual frames I ( x, y , t ), and the mono audio S ( t ). PixelPla yer p erforms audio-visual source separation and lo calization, splitting the input sound signal to estimate output sound comp onents S out ( x, y , t ), each one corresp onding to the sound coming from a spatial lo cation ( x, y ) in the video frame. As an illustration, Fig. 1.c sho ws the recov ered audio signals for 11 example pixels. The flat blue lines correspond to pixels that are considered as silen t b y the system. The non-silent signals corresp ond to the sounds coming from each individual instrument. Fig. 1.d shows the estimated sound energy , or v olume of the audio signal from each pixel. Note that the system correctly detects that the sounds are coming from the tw o instruments and not from the bac kground. Fig. 1.e sho ws how pixels are clustered according to their component sound signals. The same color is assigned to pixels that generate very similar sounds. The capability to incorp orate sound in to vision will ha v e a large impact on a range of applications inv olving the recognition and manipulation of video. Pix- 4 h ttp://sound-of-pixels.csail.mit.edu The Sound of Pixels 3 elPla yer’s abilit y to separate and lo cate sounds sources will allow more isolated pro cessing of the sound coming from eac h ob ject and will aid auditory recog- nition. Our system could also facilitate sound editing in videos, enabling, for instance, volume adjustments for sp ecific ob jects or remo v al of the audio from particular sources. Concurren t to this work, there are papers [11,29] at the same conference that also show the pow er of com bining vision and audio to decomp ose sounds in to comp onen ts. [11] shows ho w person appearance could help solving the co cktail part y problem in speech domain. [29] demonstrates an audio-visual system that separates on-screen sound vs. bac kground sounds not visible in the video. This paper is presen ted as follo ws. In Section 2, w e first review related work in b oth the vision and sound communities. In Section 3, w e present our sys- tem that leverages cross-mo dal context as a sup ervisory signal. In Section 4, w e describe a new dataset for visual-audio grounding. In Section 5, w e present sev eral exp eriments to analyze our mo del. Sub jective ev aluations are presented in Section 6. 2 Related W ork Our w ork relates mainly to the fields of sound source separation, visual-audio cross-mo dal learning, and self-supervised learning, whic h will b e briefly discussed in this section. Sound source separation. Sound source separation, also kno wn as the “co c ktail part y problem” [25,14], is a classic problem in engineering and p er- ception. Classical approac hes include signal pro cessing metho ds suc h as Non- negativ e Matrix F actorization (NMF) [42,8,40]. More recently , deep learning metho ds hav e gained popularity [45,7]. Sound source separation methods enable applications ranging from music/v o cal separation [39], to sp eech s eparation and enhancemen t [16,12,27]. Our problem differs from classic sound source separa- tion problems b ecause w e w an t to separate sounds into visually and spatially grounded comp onen ts. Learning visual-audio corresp ondence. Recent w ork in computer vision has explored the relationship b etw een vision and sound. One line of work has dev elop ed models for generating sound from silen t videos [30,51]. The corresp on- dence b etw een vision and sound has also b een leveraged for learning represen- tations. F or example, [31] used audio to sup ervise visual representations, [3,18] used vision to sup ervise audio represen tations, and [1] used sound and vision to join tly sup ervise eac h other. In w ork related to our pap er, people studied how to lo calize sounds in vision according to motion [19] or seman tic cues [2,37], ho wev er they do not separate multiple sounds from a mixed signal. Self-sup ervised learning. Our w ork builds off efforts to learn perceptual mo dels that are “self-sup ervised” by lev eraging natural con textual signals in images [10,22,33,38,24], videos [46,32,43,44,13,20], and even radio signals [48]. These approaches utilize the p ow er of sup ervised learning while not requiring man ual annotations, instead deriving sup ervisory signals from the structure in 4 Hang Zhao et al. Dilated ResNet Input&audio&(S) S ound of the pixels Input&video&frames&(I) … ! 𝛼 # 𝑖 # % (𝑥, 𝑦)𝑠 # + 𝛽 . / #01 Audio Synt hesi zer5 Netwo rk STFT 𝑖 𝑘 (𝑥, 𝑦 ) iSTFT 𝑀 % 4 % S ound spectrogram Audio U- Net … … Dilated ResNet Dilated ResNet Te m p o r a l & m a x pooling K& image channels y x k s 1 s 2 s K Estimat ed&audio& masks (one&per& x , y location) Video5 Analysis5Network Audio5Analysis5Network K&audio& channels Fig. 2. Pro cedure to generate the sound of a pixel: pixel-level visual features are ex- tracted by temp oral max-p o oling ov er the output of a dilated ResNet applied to T frames. The input audio sp ectrogram is passed through a U-Net whose output is K au- dio c hannels. The sound of eac h pixel is computed b y an audio synthesizer netw ork. The audio synthesizer netw ork outputs a mask to b e applied to the input sp ectrogram that will select the sp ectral comp onents asso ciated with the pixel. Finally , in verse STFT is applied to the spectrogram computed for eac h pixel to produce the final sound. natural data. Our model is similarly self-supervised, but uses self-supervision to learn to separate and ground sound in vision. 3 Audio-Visual Source Separation and Lo calization In this section, we introduce the mo del architectures of PixelPlay er, and the prop osed Mix-and-Separate training framework that learns to separate sound according to vision. 3.1 Mo del arc hitectures Our mo del is comp osed of a video analysis netw ork, an audio analysis netw ork, and an audio syn thesizer net w ork, as s ho wn in Fig. 2. Video analysis netw ork. The video analysis netw ork extracts visual features from video frames. Its choice can b e an arbitrary arc hitecture used for visual classification tasks. Here w e use a dilated v ariation of the ResNet-18 model [15] whic h will b e describ ed in detail in the experiment section. F or an input video of size T × H × W × 3, the ResNet mo del extracts p er-frame features with size T × (H/16) × (W/16) × K. After temporal pooling and sigmoid activ ation, w e obtain a visual feature i k ( x, y ) for eac h pixel with size K. Audio analysis netw ork. The audio analysis net work takes the form of a U-Net [35] architecture, which splits the input sound into K comp onen ts s k , k = (1 , ..., K ). W e empirically found that w orking with audio sp ectrograms giv es The Sound of Pixels 5 video 1 frames vi d e o 1 so u n d video 2 frames vi de o so u n d 2 S " + S $ S " I " I $ Spatial3 max3 pooling K3audio3 channels K3 image channels K3 image channels K3 channels K3 channels Video&Analysis&Network Video&Analysis&Network Audio&Analysis&Network Audio Synthesizer&Network Audio Synthesizer&Network Spatial3 max3 pooling Estimat ed3sound 1 𝑆 " ' ( Estimat ed3sound 2 𝑆 $ ) ( loss( S 1 ,3 S 2 ,3 ,33 ) 𝑆 $ ) ( 𝑆 " ' ( … Fig. 3. T raining pip eline of our prop osed Mix-and-Separate framework in the case of mixing tw o videos ( N = 2). The dashed b oxes represen t the mo dules detailed in Fig. 2. The audio signals from the tw o videos are added together to generate an input mixture with known constituent source signals. The netw ork is trained to separate the audio source signals conditioned on corresponding video frames; its output is an estimate of b oth sound signals. Note that w e do not assume that each video contains a single source of sound. Moreov er, no annotations are pro vided. The system th us learns to separate individual sources without traditional sup ervision. b etter p erformance than using raw w av eforms, so the netw ork describ ed in this pap er uses the Time-F requency (T-F) represen tation of sound. First, a Short- Time F ourier T ransform (STFT) is applied on the input mixture sound to obtain its spectrogram. Then the magnitude of sp ectrogram is transformed in to log- frequency scale (analyzed in Sec. 5), and fed into the U-Net which yields K feature maps con taining features of differen t comp onen ts of the input sound. Audio syn thesizer net work. The syn thesizer net w ork finally predicts the pre- dicted sound b y taking pixel-level visual feature i k ( x, y ) and audio feature s k . The output sound sp ectrogram is generated by vision-based sp ectrogram mask- ing tec hnique. Specifically , a mask M ( x, y ) that could separate the sound of the pixel from the input is estimated, and multiplied with the input sp ectrogram. Finally , to get the w av eform of the prediction, we combine the predicted magni- tude of sp ectrogram with the phase of input sp ectrogram, and use inv erse STFT for reco v ery . 3.2 Mix-and-Separate framework for Self-sup ervised T raining The idea of the Mix-and-Separate training pro cedure is to artificially create a complex auditory scene and then solve the auditory scene analysis problem of 6 Hang Zhao et al. separating and grounding sounds. Lev eraging the fact that audio signals are ap- pro ximately additive, w e mix sounds from differen t videos to generate a complex audio input signal. The learning ob jective of the mo del is to separate a sound source of in terest conditioned on the visual input asso ciated with it. Concretely , to generate a complex audio input, we randomly sample N videos { I n , S n } from the training dataset, where n = (1 , ..., N ). I n and S n represen t the visual frames and audio of the n -th video, respectively . The input sound mixture is created through linear combinations of the audio inputs as S mix = P N n =1 S n . The model f learns to estimate the sounds in each video ˆ S n giv en the audio mixture and the visual of the corresp onding video ˆ S n = f ( S mix , I n ). Fig. 3 shows the training framework in the case of N = 2. The training phase differs from the testing phase in that 1) we sample m ultiple videos ran- domly from the training set, mix the sample audios and target to recov er each of them given their corresponding visual input; 2) video-lev el visual features are ob- tained by spatial-temporal max pooling instead of pixel-level features. Note that although we hav e clear targets to learn in the training process, it is still unsup ervised as we do not use the data lab e ls and do not make assumptions ab out the sampled data. The learning target in our system are the sp ectrogram masks, they can b e binary or ratios. In the case of binary masks, the v alue of the ground truth mask of the n -th video is calculated by observing whether the target sound is the dominan t com p onen t in the mixed sound in each T-F unit, M n ( u, v ) = J S n ( u, v ) ≥ S m ( u, v ) K , ∀ m = (1 , ..., N ) , (1) where ( u, v ) represen ts the co ordinates in the T-F represen tation and S repre- sen ts the sp ectrogram. Per-pixel sigmoid cross en tropy loss is used for learning. F or ratio masks, the ground truth mask of a video is calculated as the ratio of the magnitudes of the target sound and the mixed sound, M n ( u, v ) = S n ( u, v ) S mix ( u, v ) . (2) In this case, p er-pixel L 1 loss [47] is used for training. Note that the v alues of the ground truth mask do not necessarily sta y within [0 , 1] because of interference. 4 MUSIC Dataset The most commonly used videos with audio-visual correspondence are musical recordings, so w e in tro duce a musical instrumen t video dataset for the prop osed task, called MUSIC (Multimo dal Sources of Instrumen t Combinations) dataset. W e retriev ed the MUSIC videos from Y ouT ub e b y k eyword query . During the search, w e added k eywords suc h as “co ver” to find more videos that were not p ost-pro cessed or edited. MUSIC dataset has 685 untrimmed videos of m usical solos and duets, some sample videos are shown in Fig. 4. The dataset spans 11 instrument categories: The Sound of Pixels 7 Fig. 4. Example frames and asso ciated sounds from our video dataset. The top row sho ws videos of solos and the b ottom row shows videos of duets. The sounds are displa yed in the time-frequency domain as spectrograms, with frequency on a log scale. Accordion Acoustic Guitar Cello Clarinet Erhu Flute Saxophone T rumpet T uba Violin Xylophone Duets Guitar & Xylophone Guitar & Violin Flute & Xylophone Flute & Violin Clarinet & Guitar Cello & Guitar Flute & T rum pet T rumpet & T uba Saxophone & Guitar Video Duration (seconds) Count a) b) Fig. 5. Dataset Statistics: a) Shows the distribution of video categories. There are 536 videos of solos and 149 videos of duets. b) Sho ws the distribution of the solo video durations. The a verage duration is ab out 2 min utes. accordion, acoustic guitar, cello, clarinet, erhu, flute, saxophone, trumpet, tuba, violin and xylophone. Fig. 5 sho ws the dataset statistics. Statistics reveal that due to the natural distribution of videos, duet perfor- mances are less balanced than the solo p erformances. F or example, there are almost no videos of tuba and violin duets, while there are many videos of guitar and violin duets. 5 Exp erimen ts 5.1 Audio data pro cessing There are sev eral steps we tak e b efore feeding the audio data into our model. T o sp eed up computation, we sub-sampled the audio signals to 11kHz, suc h that the highest signal frequency preserv ed is 5.5kHz. This preserves the most per- ceptually imp ortant frequencies of instrumen ts and only slightly degrades the o verall audio quality . Each audio sample is approximately 6 seconds, randomly cropp ed from the un trimmed videos during training. An STFT with a window size of 1022 and a hop length of 256 is computed on the audio samples, resulting in a 512 × 256 Time-F requency (T-F) represen tation of the sound. W e further re-sample this signal on a log-frequency scale to obtain a 256 × 256 T-F repre- sen tation. This step is similar to the common practice of using a Mel-F requency 8 Hang Zhao et al. scale, e.g. in sp eech recognition [23]. The log-frequency scale has the dual ad- v an tages of (1) similarit y to the frequency decomposition of the h uman auditory system (frequency discrimination is better in absolute terms at lo w frequencies) and (2) translation in v ariance for harmonic sounds such as m usical instrumen ts (whose fundamen tal frequency and higher order harmonics translate on the log- frequency scale as the pitch changes), fitting w ell to a ConvNet framework. The log magnitude v alues of T-F units are used as the input to the audio analysis net work. After obtaining the output mask from our mo del, w e use an inv erse sam- pling step to con vert our mask bac k to linear frequency scale with size 512 × 256, whic h can b e applied on the input sp ectrogram. W e finally p erform an in verse STFT to obtain the reco v ered signal. 5.2 Mo del configurations In all the exp erimen ts, we use a v ariant of the ResNet-18 mo del for the video analysis netw ork, with the following mo difications made: (1) removing the last average pooling la yer and fc la yer; (2) removing the stride of the last residual blo c k, and making the con volution lay ers in this blo ck to ha ve a dilation of 2; (3) adding a last 3 × 3 conv olution la yer with K output channels. F or each video sample, it tak es T frames with size 224 × 224 × 3 as input, and outputs a feature of size K after spatiotemporal max pooling . The audio analysis netw ork is mo dified from U-Net. It has 7 conv olutions (or do wn-conv olutions) and 7 de-conv olutions (or up-conv olution) with skip connec- tions in b etw een. It takes an audio sp ectrogram with size 256 × 256 × 1, and outputs K feature maps of size 256 × 256 × K . The audio synthesizer tak es the outputs from video and audio analysis net- w orks, fuses them with a w eighted summation, and outputs a mask that will b e applied on the sp ectrogram. The audio synthesizer is a linear lay er which has v ery few trainable parameters (K weigh ts + 1 bias). It could b e designed to hav e more complex computations, but we choose the simple op eration in this w ork to sho w in terpretable in termediate representations, which will b e shown in Sec 5.6. Our b est model tak es 3 frames as visual input, and uses the num b er of feature c hannels K = 16. 5.3 Implemen tation details Our goal in the model training is to learn on natural videos (with both solos and duets), ev aluate quantitativ ely on the v alidation set, and finally solv e the source separation and lo calization problem on the natural videos with mixtures. Therefore, we split our MUSIC dataset into 500 videos for training, 130 videos for v alidation, and 84 videos for testing. Among them, 500 training videos contain b oth solos and duets, the v alidation set only contains solos, and the test set only con tains duets. During training, w e randomly sample N = 2 videos from our MUSIC dataset, whic h can b e solos, duets, or silent background. Silent videos are made by pairing silen t audio wa veforms randomly with images from the ADE dataset [50] which The Sound of Pixels 9 NMF DeepConvSep Sp ectral Ratio M ask Binary Mask [42] [7] Regression Linear scale Log scale Linear scale Log scale NSDR 3.14 6.12 5.12 6.67 8.56 6.94 8.87 SIR 6.70 8.38 7.72 12.85 13.75 12.87 15.02 SAR 10.10 11.02 10.43 13.87 14.19 11.12 12.28 T able 1. Model p erformances of baselines and different v ariations of our prop osed mo del, ev aluated in NSDR/SIR/SAR. Binary masking in log frequency scale p erforms b est in most metrics. con tains images of natural en vironments. This technique regularizes the mo del b etter in lo calizing ob jects that sound by introducing more silen t videos. T o recap, the input audio mixture could con tain 0 to 4 instrumen ts. W e also exp er- imen ted with com bining more sounds, but that made the task more challenging and the mo del did not learn b etter. In the optimization pro cess, we use a SGD optimizer with momentum 0 . 9. W e set the learning rate of the audio analysis netw ork and the audio synthesizer b oth as 0 . 001, and the learning rate of the video analysis net work as 0 . 0001 since w e adopt a pre-trained CNN mo del on ImageNet. 5.4 Sound Separation Performance T o ev aluate the performance of our model, we also use the Mix-and-Separate pro cess to mak e a v alidation set of syn thetic mixture audios and the separation is ev aluated. Fig. 6 shows qualitative results of our b est mo del, which predicts binary masks that apply on the mixture sp ectrogram. The first row shows one frame p er sampled videos that we mix together, the second ro w shows the sp ectrogram (in log frequency scale) of the audio mixture, whic h is the actual input to the audio analysis net work. The third and fourth ro ws sho w ground truth masks and the predicted masks, whic h are the targets and output of our model. The fifth and sixth rows sho w the ground truth sp ectrogram and predicted spectrogram after applying masks on the input sp ectrogram. W e could observ e that ev en with the complex patterns in the mixed sp ectrogram, our model can “segment” the target instrumen t comp onen ts out successfully . T o quantify the p erformance of the prop osed model, we use the following met- rics: the Normalized Signal-to-Distortion Ratio (NSDR), Signal-to-In terference Ratio (SIR), and Signal-to-Artifact Ratio (SAR) on the v alidation set of our syn thetic videos. The NSDR is defined as the difference in SDR of the separated signals compared with the ground truth signals and the SDR of the mixture signals compared with the ground truth signals. This represen ts the impro ve- men t of using the separated signal compared with using the mixture as each separated source. The results rep orted in this pap er w ere obtained b y using the op en-source mir eval [34] library . 10 Hang Zhao et al. Video Frames Mixtur e pair 1 Mix ed Spectrog ram Predict ed Mask Ground truth Mask Predict ed Spectrog ram Ground truth Spectrog ram Mixtur e pair 2 Mixtur e pair 3 Fig. 6. Qualitativ e results on vision-guided source separation on syn thetic audio mix- tures. This exp erimen t is p erformed only for quan titative mo del ev aluation. Results are shown in T able 1. Among all the mo dels, baseline approac hes NMF [42] and DeepCon vSep [7] use audio and ground-truth lab els to do source separation. All v arian ts of our model use the same arc hitecture w e describ ed, and take b oth visual and sound input for learning. Spectral Regression refers to the mo del that directly regresses output sp ectrogram v alues giv en an input mixture spectrogram, instead of outputting spectrogram mask v alues. F rom the n umbers in the table, we can conclude that (1) masking based approaches are generally b etter than direct regression; (2) working in the log frequency scale p erforms b etter than in the linear frequency scale; (3) binary masking based metho d ac hiev es similar p erformance as ratio masking. Mean while, w e found that the NSDR/SIR/SAR metrics are not the best met- rics for ev aluating p erceptual separation qualit y , so in Sec 6 we further conduct user studies on the audio separation qualit y . 5.5 Visual Grounding of Sounds As the title of pap er indicates, we are fundamentally solving tw o problems: lo calization and separation of sounds. Sound localization. The first prob lem is related to the spatial grounding ques- tion, “which pixels are making sounds?” This is answ ered in Fig. 7: for natural The Sound of Pixels 11 Fig. 7. “Which pixels are making sounds?” Energy distribution of sound in pixel space. Ov erlaid heatmaps show the v olumes from each pixel. Fig. 8. “What sounds do these pixels make?” Clustering of sound in space. Overlaid colormap shows different audio features with differen t colors. videos in the dataset, we calculate the sound energy (or v olume) of eac h pixel in the image, and plot their distributions in heatmaps. As can b e seen, the mo del accurately lo calizes the sounding instruments. Clustering of sounds. The second problem is related to a further question: “what sounds do these pixels make?” In order to answ er this, we visualize the sound eac h pixel mak es in image s in the following wa y: for eac h pixel in a video frame, we take the feature of its sound, namely the vectorized log sp ectrogram magnitudes, and pro ject them onto 3D R GB space using PCA for visualization purp oses. Results are sho wn in Fig. 8, differen t instruments and the bac kground in the same video frame hav e differen t color em b eddings, indicating different sounds that they mak e. Discriminativ e c hannel activ ations. Giv en our model could separate sounds of different instruments, we explore its channel activ ations for different cate- gories. F or v alidation samples of eac h category , w e find the strongest activ ated c hannel, and then sort them to generate a confusion matrix. Fig. 9 sho ws the (a) visual and (b) audio confusion matrices from our b est mo del. If we simply ev aluate classification b y assigning one category to one channel, the accuracy is 46 . 2% for vision and 68 . 9% for audio. Note that no learning is inv olved here, w e expect muc h higher performance b y using a linear classifier. This experiment demonstrates that the mo del has implicitly learned to discriminate instrumen ts visually and auditorily . In a s imilar fashion, we ev aluate ob ject localization p erformance of the video analysis net work based on the c hannel activ ations. T o generate a b ounding b ox from the channel activ ation map, we follow [49] to threshold the map. W e first 12 Hang Zhao et al. (a) (b) Fig. 9. (a) Visual and (b) audio confusion matrices b y sorting channel activ ations with resp ect to ground truth category labels. IoU Threshold 0.3 0.4 0.5 Accuracy(%) 66.10 47.92 32.43 T able 2. Ob ject localization performance of the learned video analysis netw ork. segmen t the regions of whic h the v alue is abov e 20% of the max v alue of the ac- tiv ation map, and then tak e the b ounding box that co v ers the largest connected comp onen t in the segmentation map. Lo calization accuracy under differen t in- tersection o v er union (IoU) criterion are sho wn in T able 2. 5.6 Visual-audio corresp onding activ ations As our proposed model is a form of self-sup ervised learning and is designed suc h that b oth visual and audio net w orks learn to activ ate simultaneously on the same channel, w e further explore the representations learned b y the mo del. Sp ecifically , we lo ok at the K channel activ ations of the video analysis netw ork b efore max pooling , and their corresp onding channel activ ations of the audio analysis netw ork. The mo del has learned to detect important features of sp e- cific ob jects across the individual c hannels. In Fig. 10 we show the top activ ated videos of c hannel 6, 11 and 14. These c hannels hav e emerged as violin, guitar and xylophone detectors resp ectively , in b oth visual and audio domains. Chan- nel 6 resp onds strongly to the visual app earance of violin and to the higher order harmonics in violin sounds. Channel 11 responds to guitars and the low frequency region in sounds. And channel 14 responds to the visual app earance of xylophone and to the brief, pulse-like patterns in the sp ectrogram domain. F or other channels, some of them also detect sp ecific instruments while others just detect sp ecific features of instruments. 6 Sub jective Ev aluations The ob jective and quan titativ e ev aluations in Sec. 5.4 are mainly p erformed on the synthetic mixture videos, the performance on the natural videos needs to b e further inv estigated. On the other hand, the p opular NSDR/SIR/SAR met- rics used are not closely related to perceptual qualit y . Therefore we conducted The Sound of Pixels 13 channel 6 channel 14 Video frame Visual acti vations Audio activatio ns channel 11 Fig. 10. Visualizations of corresp onding channel activ ations. Channel 6 has emerged as a violin detector, responding strongly to the presence of violins in the video frames and to the high order harmonics in the sp ectrogram, whic h are colored brighter in the sp ectrogram of the figure. Likewise, c hannel 11 and 14 seems to detect the visual and auditory characteristics of guitars and xylophones. cro wd-sourced sub jective ev aluations as a complemen tary ev aluation. Two stud- ies are conducted on Amazon Mechanical T urk (AMT) b y h uman raters, a sound separation qualit y ev aluation and a visual-audio correspondence ev aluation. 6.1 Sound separation quality F or the sound separation ev aluation, we used a subset of the solos from the dataset as ground truth. W e prepared the outputs of the baseline NMF mo del and the outputs of our mo dels, including spectral regression, ratio masking and binary masking, all in log frequency scale. F or eac h mo del, we tak e 256 audio outputs from the same set for ev aluation and each audio is ev aluated b y 3 inde- p enden t AMT work ers. Audio samples are randomly presented to the work ers, and the following question is asked: “ Which sound do you hear? 1. A, 2. B, 3. Both, or 4. None of them ”. Here A and B are replaced b y their mixture sources, e.g. A =clarinet, B =flute. Sub jective ev aluation results are shown in T able 3. W e sho w the p ercentages of w orkers who heard only the correct solo instrumen t ( Correct ), who heard only the incorrect solo instrument ( Wrong ), who heard b oth of the instruments ( Both ), and who heard neither of the instruments ( None ). First, w e observ e that although the NMF baseline did not hav e go o d NSDR num b ers in the quan tita- tiv e ev aluation, it has comp etitiv e results in our h uman study . Second, among our mo dels, the binary masking mo del outp erforms all other mo dels by a mar- gin, showing its adv antage in separation as a classification mo del. The binary masking model gives the highest correct rate, low est error rate, and lo west con- fusion (p ercen tage of Both ), indicating that the binary mo del p erforms source separation p erceptively b etter than the other models. It is w orth noticing that ev en the ground truth solos do not give 100% correct rate, which represen ts the upp er b ound of p erformance. 14 Hang Zhao et al. Mo del Correct (%) W rong (%) Both (%) None (%) NMF 45.70 15.23 21.35 17.71 Sp ectral Regression 18.23 15.36 64.45 1.95 Ratio Mask 39.19 19.53 27.73 13.54 Binary Mask 59.11 11.59 18.10 11.20 Ground T ruth Solo 70.31 16.02 7.68 5.99 T able 3. Sub jective ev aluation of sound separation p erformance. Binary masking- based mo del outp erforms other mo dels in sound separation. Mo del Y es (%) Sp ectral Regression 39.06 Ratio M ask 54.68 Binary Mask 67.58 T able 4. Sub jective ev aluation of visual-sound corresp ondence. Binary masking-based mo del best relates vision and sound. 6.2 Visual-sound corresp ondence ev aluations The second study fo cuses on the ev aluation of the visual-sound corresp ondence problem. F or a pixel-sound pair, we ask the binary question: “ Is the sound coming from this pixel? ” F or this task, we only ev aluate our mo dels for comparison as the task requires visual input, so audio-only baselines are not applicable. W e select 256 pixel positions (50% on instrumen ts and 50% on back- ground ob jects) to generate corresponding sounds with different models, and get the percentage of Yes responses from the w orkers, whic h tells the percentage of pixels with go o d source separation and lo calization, results are sho wn in T able 4. This ev aluation also demonstrates that the binary masking-based model giv es the b est p erformance in the vision-related source separation problem. 7 Conclusions In this pap er, we introduced PixelPla yer, a system that learns from unlab eled videos to separate input sounds and also lo cate them in the visual input. Quan- titativ e results, qualitative results, and sub jectiv e user studies demonstrate the effectiv eness of our cross-mo dal learning system. W e exp ect our work can op en up new research av enues for understanding the problem of sound source separa- tion using b oth visual and auditory signals. Ac knowledgemen t: This work was supported by NSF grant I IS-1524817. W e thank Adria Recasens, Y u Zhang and Xue F eng for insigh tful discussions. The Sound of Pixels 15 References 1. Arandjelo vic, R., Zisserman, A.: Lo ok, listen and learn. In: 2017 IEEE In ternational Conference on Computer Vision (ICCV). pp. 609–617. IEEE (2017) 2. Arandjelo vi´ c, R., Zisserman, A.: Ob jects that sound. arXiv preprin t arXiv:1712.06651 (2017) 3. Aytar, Y., V ondrick, C., T orralba, A.: Soundnet: Learning sound representations from unlab eled video. In: Adv ances in Neural Information Pro cessing Systems. pp. 892–900 (2016) 4. Belouc hrani, A., Ab ed-Meraim, K., Cardoso, J.F., Moulines, E.: A blind source separation technique using second-order statistics. IEEE T ransactions on signal pro cessing 45 (2), 434–444 (1997) 5. Bregman, A.S.: Auditory scene analysis: The p erceptual organization of sound. MIT pre ss (1994) 6. Cardoso, J.F.: Infomax and maximum likelihoo d for blind source separation. IEEE Signal processing letters 4 (4), 112–114 (1997) 7. Chandna, P ., Miron, M., Janer, J., G´ omez, E.: Monoaural audio source separation using de ep con volutional neural net works. In: ICL V ASS. pp. 258–266 (2017) 8. Cic ho cki, A., Zdunek, R., Phan, A.H., Amari, S.i.: Nonnegative matrix and tensor factorizations: applications to exploratory m ulti-wa y data analysis and blind source separation. John Wiley & Sons (2009) 9. Comon, P ., Jutten, C.: Handb o ok of Blind Source Separation: Indep enden t com- p onen t analysis and applications. Academic press (2010) 10. Do ersc h, C., Gupta, A., Efros, A.A.: Unsup ervised visual representation learning b y con text prediction. In: Proceedings of the IEEE In ternational Conference on Computer Vision. pp. 1 422–1430 (2015) 11. Ephrat, A., Mosseri, I., Lang, O., Dekel, T., Wilson, K., Hassidim, A., F reeman, W.T., Rubinstein, M.: Lo oking to listen at the cocktail party: A sp eak er-indep endent audio-visual mo del for sp eech separation. arXiv preprin t arXiv:1804.03619 (2018) 12. Gabba y , A., Ephrat, A., Halperin, T., P eleg, S.: Seeing through noise: Speaker separation and enhancement using visually-derived sp eech. arXiv preprint arXiv:1708.06767 (2017) 13. Gan, C., Gong, B., Liu, K., Su, H., Guibas, L.J.: Geometry-guided CNN for self- sup ervised video represen tation learning (2018) 14. Ha ykin, S., Chen, Z.: The co cktail party problem. Neural computation 17 (9), 1875– 1902 (20 05) 15. He, K., Zhang, X., Ren, S., Sun, J.: Deep residual learning for image recognition. In: Pro ceedings of the IEEE conference on computer vision and pattern recognition. pp. 770– 778 (2016) 16. Hershey , J.R., Chen, Z., Le Roux, J., W atanab e, S.: Deep clustering: Discriminativ e em b eddings for segmentation and separation. In: Acoustics, Speech and Signal Pro cessing (ICASSP), 2016 IEEE International Conference on. pp. 31–35. IEEE (2016) 17. Hershey , J.R., Mov ellan, J.R.: Audio vision: Using audio-visual syn- c hrony to lo cate sounds. In: Solla, S.A., Leen, T.K., M¨ uller, K. (eds.) Adv ances in Neural Information Processing Systems 12, pp. 813–819. MIT Press (2000), http://papers.nips.cc/paper/ 1686- audio- vision- using- audio- visual- synchrony- to- locate- sounds.pdf 16 Hang Zhao et al. 18. Hershey , S., Chaudhuri, S., Ellis, D.P ., Gemmeke, J.F., Jansen, A., Mo ore, R.C., Plak al, M., Platt, D., Saurous, R.A., Seybold, B., et al.: Cnn architectures for large- scale audio classification. In: Acoustics, Sp eech and Signal Pro cessing (ICASSP), 2017 IEE E In ternational Conference on. pp. 131–135. IEEE (2017) 19. Izadinia, H., Saleemi, I., Shah, M.: Multimo dal analysis for identification and seg- men tation of mo ving-sounding ob jects. IEEE T ransactions on Multimedia 15 (2), 378–390 (2013) 20. Ja yaraman, D., Grauman, K.: Learning image represen tations tied to ego-motion. In: Pro ceedings of the IEEE International Conference on Computer Vision. pp. 1413–1421 (2015) 21. Kidron, E., Schec hner, Y.Y., Elad, M.: Pixels that sound. In: Pro ceedings of the 2005 IEEE Computer So ciet y Conference on Computer Vision and P attern Recog- nition (CVPR’05) - V olume 1 - V olume 01. pp. 88–95. CVPR ’05, IEEE Computer So ciet y , W ashington, DC, USA (2005). https://doi.org/10.1109/CVPR.2005.274, http://dx.doi.org/10.1109/CVPR.2005.274 22. Larsson, G., Maire, M., Shakhnarovic h, G.: Colorization as a proxy task for visual understanding. In: CVPR. vol. 2, p. 8 (2017) 23. Logan, B., et al.: Mel frequency cepstral co efficien ts for music mo deling. In: ISMIR. v ol. 270, pp. 1–11 (2000) 24. Ma, W.C., Ch u, H., Zhou, B., Urtasun, R., T orralba, A.: Single image in trinsic decomp osition without a single in trinsic image. In: ECCV (2018) 25. McDermott, J.H.: The cocktail party problem. Curren t Biology 19 (22), R1024– R1027 (2 009) 26. Mesaros, A., Heittola, T., Diment, A., Elizalde, B., Ankit Shah, e.a.: Dcase 2017 c hallenge setup: T asks, datasets and baseline system. In: DCASE 2017 - W orkshop on Detecti on and Classification of Acoustic Scenes and Ev ents (2017) 27. Nagrani, A., Albanie, S., Zisserman, A.: Seeing voices and hearing faces: Cross- mo dal biometric matc hing. arXiv preprint arXiv:1804.00326 (2018) 28. Ngiam, J., Khosla, A., Kim, M., Nam, J., Lee, H., Ng, A.Y.: Multimo dal deep learning. In: Pro ceedings of the 28th International Conference on International Conference on Mac hine Learning. pp. 689–696. ICML’11 (2011) 29. Ow ens, A., Efros, A.A.: Audio-visual scene analysis with self-supervised multisen- sory features. arXiv preprin t arXiv:1804.03641 (2018) 30. Ow ens, A., Isola, P ., McDermott, J., T orralba, A., Adelson, E.H., F reeman, W.T.: Visually indicated sounds. In: Pro ceedings of the IEEE Conference on Computer Vision an d P attern Recognition. pp. 2405–2413 (2016) 31. Ow ens, A., W u, J., McDermott, J.H., F reeman, W.T., T orralba, A.: Ambien t sound pro vides sup ervision for visual learning. In: Europ ean Conference on Computer Vision. p p. 801–816. Springer (2016) 32. P athak, D., Girshic k, R., Doll´ ar, P ., Darrell, T., Hariharan, B.: Learning features b y w atching ob jects mo ve. In: Proc. CVPR. vol. 2 (2017) 33. P athak, D., Krahen buhl, P ., Donahue, J., Darrell, T., Efros, A.A.: Con text en- co ders: F eature learning by inpain ting. In: Pro ceedings of the IEEE Conference on Computer Vision and P attern Recognition. pp. 2536–2544 (2016) 34. Raffel, C., McF ee, B., Humphrey , E.J., Salamon, J., Nieto, O., Liang, D., Ellis, D.P ., Raffel, C.C.: mir ev al: A transparent implemen tation of common mir metrics. In: In Pro ceedings of the 15th International So ciet y for Music Information Retriev al Conference, ISMIR. Citeseer (2014) 35. Ronneb erger, O., Fisc her, P ., Bro x, T.: U-net: Con volutional netw orks for biomedi- cal image segmentation. In: International Conference on Medical image computing and comp uter-assisted in terven tion. pp. 234–241. Springer (2015) The Sound of Pixels 17 36. R. de Sa, V.: Learning classification with unlabeled data. In: Adv ances In Neural Information P ro cessing Systems. pp. 112–119 (1993) 37. Seno cak, A., Oh, T.H., Kim, J., Y ang, M.H., Kweon, I.S.: Learning to lo calize sound sourc e in visual scenes. arXiv preprin t arXiv:1803.03849 (2018) 38. Sh u, Z., Y umer, E., Hadap, S., Sunk av alli, K., Shech tman, E., Samaras, D.: Neural face editing with intrinsic image disentangling. arXiv preprin t (2017) 39. Simpson, A.J., Roma, G., Plumbley , M.D.: Deep k araok e: Extracting v o cals from m usical mixtures using a con volutional deep neural netw ork. In: In ternational Con- ference on Latent V ariable Analysis and Signal Separation. pp. 429–436. Springer (2015) 40. Smaragdis, P ., Brown, J.C.: Non-negative matrix factorization for p olyphonic mu- sic transcription. In: Applications of Signal Processing to Audio and Acoustics, 2003 IEE E W orkshop on. pp. 177–180. IEEE (2003) 41. Vincen t, E., Grib onv al, R., F´ evotte, C.: Performance measurement in blind audio source separation. IEEE transactions on audio, speech, and language pro cessing 14 (4), 1462– 1469 (2006) 42. Virtanen, T.: Monaural sound source separation by nonnegative matrix factoriza- tion with temp oral contin uity and sparseness criteria. IEEE transactions on audio, sp eec h, and language processing 15 (3), 1066–1074 (2007) 43. V ondrick, C., Pirsia v ash, H., T orralba, A.: Generating videos with scene dynamics. In: Adv ances In Neural Information Pro cessing Systems. pp. 613–621 (2016) 44. V ondrick, C., Shriv astav a, A., F athi, A., Guadarrama, S., Murphy , K.: T racking emerges by colorizing videos. arXiv preprin t arXiv:1806.09594 (2018) 45. W ang, D., Chen, J.: Supervised sp eech separation based on deep learning: an o verview. arXiv preprin t arXiv:1708.07524 (2017) 46. W ang, X., Gupta, A.: Unsup ervised learning of visual represen tations using videos. In: ICC V. pp. 2794–2802 (2015) 47. Zhao, H., Gallo, O., F rosio, I., Kautz, J.: Loss functions for image restoration with neural net works. IEEE T ransactions on Computational Imaging 3 (1), 47–57 (2017) 48. Zhao, M., Li, T., Abu Alsheikh, M., Tian, Y., Zhao, H., T orralba, A., Katabi, D.: Through-w all human p ose estimation using radio signals. In: Pro ceedings of the IEEE Conference on Computer Vision and Pattern Recognition. pp. 7356–7365 (2018) 49. Zhou, B., Khosla, A., Lap edriza, A., Oliv a, A., T orralba, A.: Learning deep fea- tures for discriminativ e lo calization. In: Pro ceedings of the IEEE Conference on Computer Vision and P attern Recognition. pp. 2921–2929 (2016) 50. Zhou, B., Zhao, H., Puig, X., Fidler, S., Barriuso, A., T orralba, A.: Scene parsing through A DE20K dataset. In: Proc. CVPR (2017) 51. Zhou, Y., W ang, Z., F ang, C., Bui, T., Berg, T.L.: Visual to sound: Generating natural sou nd for videos in the wild. arXiv preprin t arXiv:1712.01393 (2017) 52. Zibulevsky , M., Pearlm utter, B.A.: Blind source separation by sparse decomposi- tion in a signal dictionary . Neural computation 13 (4), 863–882 (2001)
Original Paper
Loading high-quality paper...
Comments & Academic Discussion
Loading comments...
Leave a Comment