Looking to Listen at the Cocktail Party: A Speaker-Independent Audio-Visual Model for Speech Separation
We present a joint audio-visual model for isolating a single speech signal from a mixture of sounds such as other speakers and background noise. Solving this task using only audio as input is extremely challenging and does not provide an association …
Authors: Ariel Ephrat, Inbar Mosseri, Oran Lang
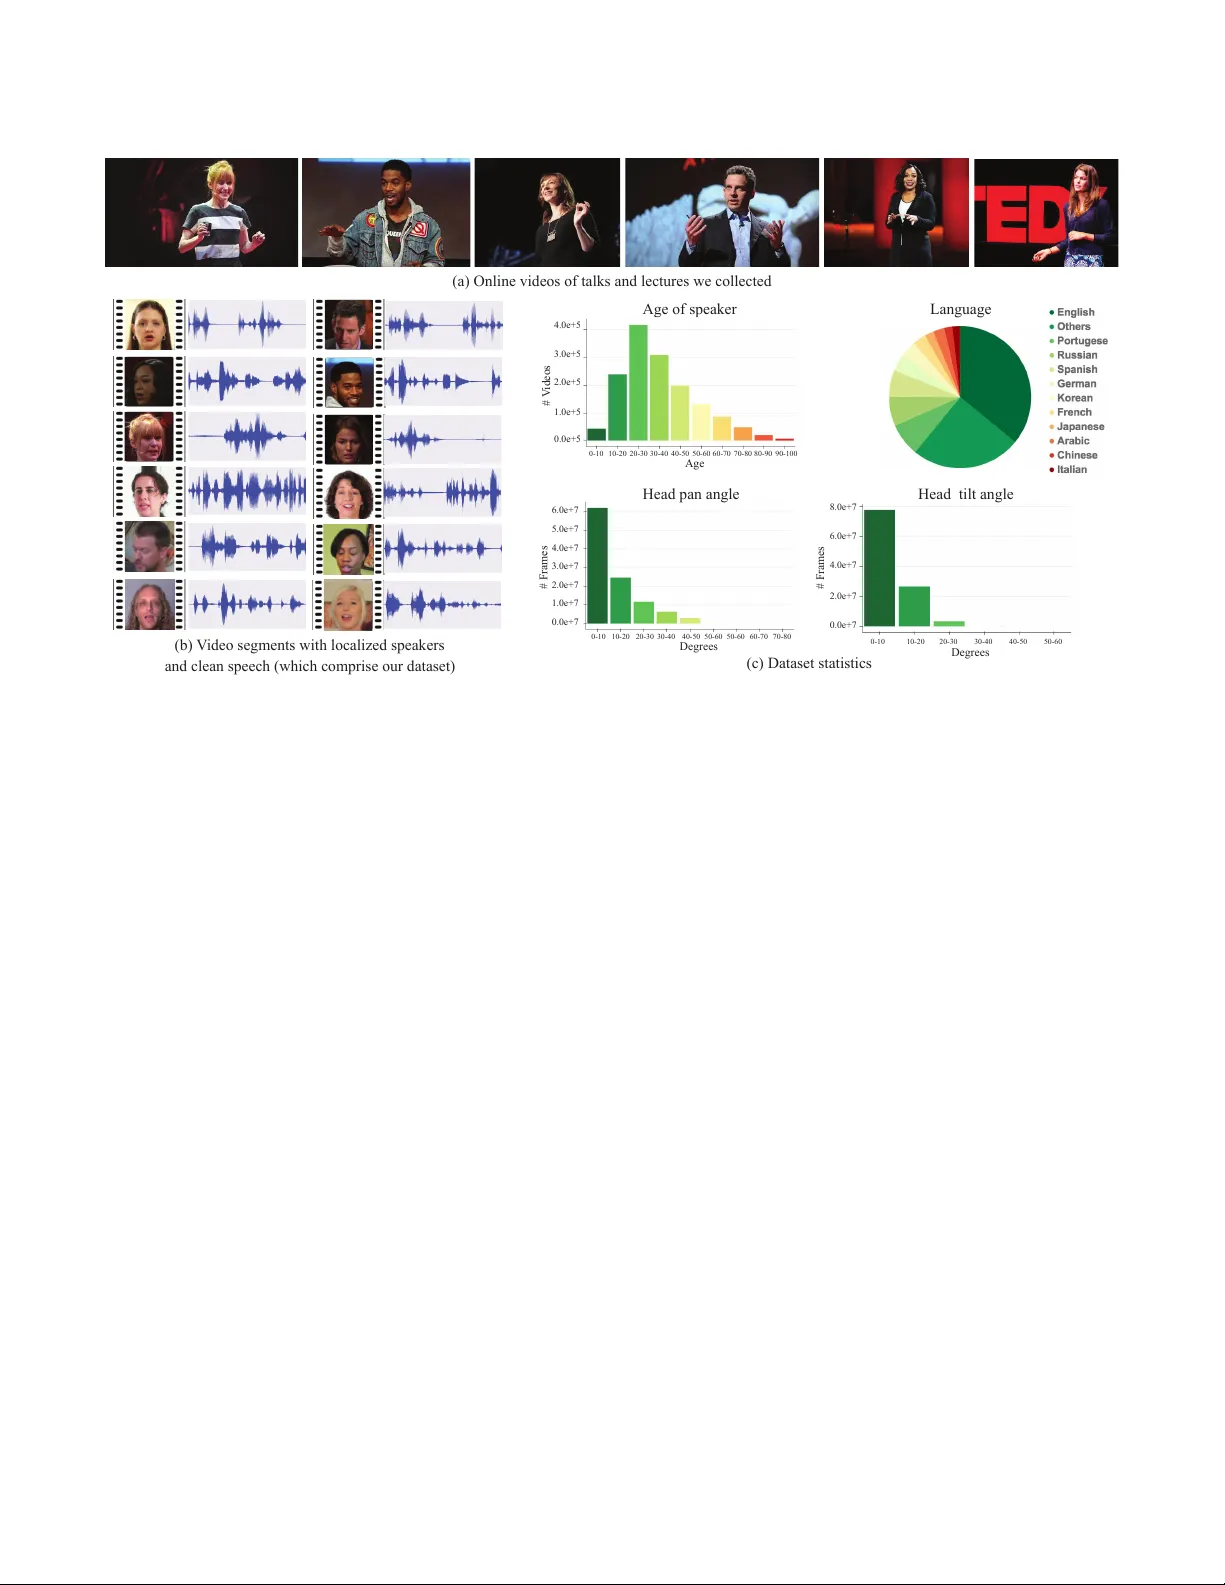
Looking to Listen at the Cocktail Party: A Speaker-Independent A udio- Visual Model for Spe ech Separation ARIEL EPHRA T, Google Research and The Hebrew University of Jerusalem, Israel INBAR MOSSERI, Google Research ORAN LANG, Google Research T ALI DEKEL, Google Resear ch KEVIN WILSON, Google Research A VINA T AN HASSIDIM, Google Research WILLIAM T . FREEMAN, Google Research MICHAEL RUBINSTEIN, Google Research Fig. 1. W e present a model for isolating and enhancing the spe ech of desired speakers in a video. (a) The input is a video (frames + audio track) with one or more people speaking, where the spee ch of interest is interfered by other speakers and/or background noise. (b) Both audio and visual features are extracted and fed into a joint audio-visual speech separation model. The output is a decomposition of the input audio track into clean speech tracks, one for each person detected in the video (c). This allows us to then compose videos where speech of spe cific people is enhanced while all other sound is suppressed. Our model was trained using thousands of hours of video segments from our new dataset, A VSpeech . The “Stand-Up” video (a) is courtesy of T eam Coco. W e present a joint audio-visual model for isolating a single speech signal from a mixture of sounds such as other speakers and background noise. Solving this task using only audio as input is extr emely challenging and does not provide an association of the separated spee ch signals with speakers in the video. In this pap er , we present a deep network-based model that incorporates both visual and auditor y signals to solve this task. The visual features are use d to “fo cus” the audio on desired speakers in a scene and to improv e the sp eech separation quality. T o train our joint audio-visual model, we introduce A VSpeech , a new dataset comprised of thousands of hours of video segments from the W eb. W e demonstrate the applicability of our method to classic speech separation tasks, as well as real-world scenarios involving heated interviews, noisy bars, and screaming children, only requiring the user to specify the face of the person in the video whose speech they want to isolate. Our method shows clear advantage over state- of-the-art audio-only speech separation in cases of mixed speech. In addition, our model, which is speaker-independent (trained once, applicable to any speaker), produces better results than recent audio-visual sp eech separation Permission to make digital or hard copies of part or all of this work for p ersonal or classroom use is granted without fee provided that copies are not made or distributed for prot or commercial advantage and that copies bear this notice and the full citation on the rst page. Cop yrights for third-party components of this w ork must be honored. For all other uses, contact the owner /author(s). © 2018 Copyright held by the owner/author(s). 0730-0301/2018/8- ART112 https://doi.org/10.1145/3197517.3201357 methods that are speaker-dependent (require training a separate model for each speaker of interest). Additional K ey W ords and Phrases: A udio- Visual, Source Separation, Speech Enhancement, Deep Learning, CNN, BLSTM A CM Reference Format: Ariel Ephrat, Inbar Mosseri, Oran Lang, Tali Dekel, K evin Wilson, A vinatan Hassidim, William T . Freeman, and Michael Rubinstein. 2018. Lo oking to Listen at the Cocktail Party: A Speaker-Indep endent Audio- Visual Model for Speech Separation. ACM Trans. Graph. 37, 4, Article 112 (A ugust 2018), 11 pages. https://doi.org/10.1145/3197517.3201357 1 IN TRODUCTION Humans are remarkably capable of focusing their auditory attention on a single sound source within a noisy environment, while de- emphasizing (“muting”) all other v oices and sounds. The way neural systems achiev e this feat, which is known as the cocktail party ee ct [Cherry 1953], remains unclear . Howe ver , resear ch has shown that viewing a speaker’s face enhances a p erson’s capacity to resolve perceptual ambiguity in a noisy environment [Golumbic et al . 2013; Ma et al . 2009]. In this paper we achieve this ability computationally . The rst author performed this work as an intern at Google. ACM T rans. Graph., V ol. 37, No. 4, Article 112. Publication date: August 2018. 112:2 • Ephrat, A. et al A utomatic speech separation—separating an input audio signal into its individual spee ch sources—is well-studied in the audio pro- cessing literature. Since this pr oblem is inherently ill-posed, it re- quires prior knowledge or special microphone congurations in order to obtain a reasonable solution [McDermott 2009]. In addition, a fundamental problem with audio-only spee ch separation is the label permutation problem [Hershey et al . 2016]: there is no easy way to associate each separated audio sour ce with its corresponding speaker in the video [Hershey et al. 2016; Y u et al. 2017]. In this work, we pr esent a joint audio-visual method for “focus- ing” audio on a desired speaker in a video. The input video can then be recomposed such that the audio corresponding to specic people is enhanced while all other sound is suppr essed (Fig. 1). Mor e specically , we design and train a neural network-based model that takes the recorded sound mixtur e, along with tight crops of detected faces in each frame in the video as input, and splits the mixture into separate audio streams for each detected speaker . The model uses visual information both as a means to impr ove the source separation quality (compared to audio-only results), as well as to associate the separated spee ch tracks with visible speakers in the video. All that is required from the user is to specify which faces of the people in the video they want to hear the speech from. T o train our model, we collected 290,000 high-quality lectures, TED talks and how-to videos from Y ouT ube, then automatically extracted from these videos roughly 4700 hours of video clips with visible speakers and clean speech with no interfering sounds (Fig. 2). W e call our new dataset A VSpeech . With this dataset in hand, we then generate d a training set of “synthetic co cktail parties” —mixtures of face videos with clean speech, and other sp eech audio tracks and background noise. W e demonstrate the b enets of our approach over r ecent spe ech separation metho ds in two ways. First, we show sup erior results compared to a state-of-the-art audio-only method on pure speech mixtures. Second, we demonstrate our mo del’s capability of pro- ducing enhanced sound streams from mixtures containing both overlapping speech and background noise in real-world scenarios. T o summarize , our paper makes two main contributions: (a) An audio-visual speech separation mo del that outperforms audio-only and audio-visual models on classic speech separation tasks, and is applicable in challenging, natural scenes. T o our knowledge, our paper is the rst to propose a speaker-indep endent audio-visual model for spe ech separation. (b) A new , large-scale audio-visual dataset, A VSpeech , carefully collected and processed, comprised of video segments where the audible sound b elongs to a single per- son, visible in the video, and no audio background interference. This dataset allows us to achieve state-of-the-art r esults on speech separation and may be useful for the research community for fur- ther studies. Our dataset, input and output videos, and additional supplementary materials are all available on the project web page: http://looking- to- listen.github.io/ . 2 RELA TED WORK W e briey review related work in the areas of speech separation and audio-visual signal processing. Speech separation. Speech separation is one of the fundamental problems in audio processing and has b een the subject of extensive study over the last decades. W ang and Chen [2017] give a com- prehensive ov erview of recent audio-only methods based on deep learning that tackle b oth spee ch denoising [Erdogan et al . 2015; W eninger et al. 2015] and spe ech separation tasks. T wo recent works have emerged which solve the aforementioned label permutation problem to perform sp eaker-independent, multi- speaker separation in the single-channel case. Hershey et al . [2016] propose a method called deep clustering in which discriminatively- trained speech embeddings are used to cluster and separate the dierent sources. Hershey et al . [2016] also introduced the idea of a permutation-free or p ermutation invariant loss function, but they did not nd that it worked well. Isik et al . [2016] and Y u et al . [2017] subsequently introduced methods which successfully use a permutation invariant loss function to train a DNN. The advantages of our approach o ver such audio-only methods are threefold: First, we show that the separation results of our audio- visual model are of higher quality than those of a state-of-the-art- inspired audio-only model. Second, our approach performs well in the setting of multiple speakers mixed with background noise, which, to our knowledge, no audio-only method has satisfactorily solved. Third, we jointly solve two spe ech processing problems: speech separation, and assignment of a spee ch signal to its corre- sponding face, which, thus far , have been tackled separately [Ho over et al. 2017; Hu et al. 2015; Monaci 2011]. Vision and speech. There is increased interest in using neural networks for multi-modal fusion of auditory and visual signals to solve various speech-related problems. These include audio-visual speech recognition [Feng et al . 2017; Mroueh et al . 2015; Ngiam et al . 2011], predicting speech or text from silent video (lipreading) [Chung et al . 2016; Ephrat et al . 2017], and unsupervised learning of language from visual and speech signals [Har wath et al . 2016]. These methods leverage natural synchrony between simultaneously recorded visual and auditory signals. A udio-visual (A V) methods have also been use d for speech sepa- ration and enhancement [Hershey et al . 2004; Hershey and Casey 2002; Khan 2016; Rivet et al . 2014]. Casanovas et al . [2010] perform A V source separation using sparse representations, which is limited due to dependence on active-alone regions to learn source char- acteristics, and the assumption that all the audio sources are se en on-screen. Recent methods have used neural networks to perform the task. Hou et al . [2018] propose a multi-task CNN-based model which outputs a denoised spe ech spectrogram as well a reconstruc- tion of the input mouth region. Gabbay et al . [2017] train a speech enhancement model on videos where other speech samples of the target speaker are used as background noise, in a scheme they call “noise-invariant training” . In concurrent work, Gabbay et al . [2018] use a video-to-sound synthesis method to lter noisy audio. The main limitation of these A V speech separation approaches is that they are speaker-dependent , meaning a de dicated model must b e trained for each speaker separately . While these works make spe cic design choices that limit their applicability only to the speaker-dependent case, we spe culate that the main reason a speaker-independent A V model hasn’t been pursued widely so far is the lack of a suciently large and diverse dataset for training such models — a dataset like the one we construct and provide in this work. T o the best of our knowledge, our pap er is the rst to address the problem of speaker-independent A V speech separation. ACM T rans. Graph., V ol. 37, No. 4, Article 112. Publication date: August 2018. Looking to Listen at the Cocktail Party • 112:3 (a) Online videos of talks and lect u res we collected (c) Dataset statistics (b) V ideo segments with local i zed speakers and clean speech (which comprise our dataset) # V ideos Age Age of speaker 4.0e+5 3.0e+5 2.0e+5 1.0e+5 0.0e+5 0-10 10-20 20-30 30-40 40-50 50-60 60-70 70-80 80-90 90-100 Degrees # Frames 4.0e+7 3.0e+7 2.0e+7 1.0e+7 0.0e+7 0-10 10-20 20-30 30-40 40-50 50-60 50-60 60-70 70-80 Degrees 8.0e+7 6.0e+7 4.0e+7 2.0e+7 0.0e+7 0-10 10-20 20-30 30-40 40-50 50-60 # Frames Language Head pan angle Head tilt angle 5.0e+7 6.0e+7 Fig. 2. A VSpeech dataset: W e first gathered a large collection of 290,000 high-quality , online public videos of talks and lectures (a). From these videos we extracted segments with clean speech (e.g. no mixed music, audience sounds or other sp eakers), and with the speaker visible in the frame (see Section 3 and Figure 3, for details of the processing). This resulted in 4700 hours of video clips, each of a single person talking with no background interference (b). This data spans a wide variety of p eople, languages, and face poses, with distributions shown in (c) (age and head angles estimated with automatic classifiers; language based on Y ouT ube metadata). For a detailed list of video sources in our dataset please refer to the project web page. Our model is capable of separating and enhancing speakers it has never seen before, speaking in languages that wer e not part of the training set. In addition, our work is unique in that we show high quality speech separation on real world examples, in settings that previous audio-only and audio-visual speech separation work did not address. A number of independent and concurrent works have recently emerged which address the problem of audio-visual sound source separation using de ep neural networks. [O wens and Efros 2018] train a netw ork to predict whether audio and visual streams ar e tem- porally aligne d. Learned featur es extracted from this self-supervised model are then used to condition an on/o screen speakers source separation model. Afouras et al . [2018] perform speech enhance- ment by using a network to predict both magnitude and phase of denoised speech spe ctrograms. Zhao et al . [2018] and Gao et al . [2018] addressed the closely related problem of separating the sound of multiple on-screen objects (e.g. musical instruments). A udio-visual datasets. Most existing A V datasets comprise videos with only a small number of subjects, speaking wor ds from a lim- ited vocabulary . For example, the CU A VE dataset [Patterson et al . 2002] contains 36 subjects saying each digit from 0 to 9 ve times each, with a total of 180 examples per digit. Another example is the Mandarin sentences dataset, introduced by Hou et al . [2018], which contains video recordings of 320 utterances of Mandarin sentences spoken by a native speaker . Each sentence contains 10 Chinese characters with e qually distributed phonemes. The TCD- TIMI T dataset [Harte and Gillen 2015] consists of 60 volunteer speakers with around 200 videos each. The sp eakers recite various sentences from the TIMIT dataset [S Garofolo et al . 1992], and are recorded using b oth front-facing and 30 -degree cameras. W e evaluate our results on these three datasets in order to compar e to previous work. Recently , the large-scale Lip Reading Sentences (LRS) dataset was introduced by Chung et al . [2016], which includes both a wide variety of speakers and words from a larger v ocabulary . However , not only is that dataset not publicly available, but the spe ech in LRS videos is not guaranteed to be clean, which is crucial for training a model for spee ch separation and enhancement. 3 A VSPEECH D A T ASET W e introduce a new , large-scale audio-visual dataset comprising speech clips with no interfering background signals. The segments are of varying length, between 3 and 10 se conds long, and in each clip the only visible face in the video and audible sound in the soundtrack belong to a single speaking p erson. In total, the dataset contains roughly 4700 hours of video segments with approximately 150,000 distinct speakers, spanning a wide variety of pe ople, languages and face poses. Representative frames, audio waveforms and some dataset statistics are shown in Figure 2. W e collected the dataset automatically , since for assembling a corpus of this magnitude it was important not to rely on substantial human feedback. Our dataset creation pipeline collecte d clips from roughly 290,000 Y ouT ube videos of lectures (e.g. TED talks) and how-to videos. For such channels, most of the videos comprise a ACM T rans. Graph., V ol. 37, No. 4, Article 112. Publication date: August 2018. 112:4 • Ephrat, A. et al a) Extracting speech segment candidates by tracki ng speakers’ faces b) Predicted vs. t rue speech SNR, using our speech SNR estimator 0 10 20 10 20 30 40 0 Keep Reject Speech Segments Predicted speech SNR (dB) Ground-truth speech SNR (dB) Fig. 3. Video and audio processing for dataset creation: (a) W e use face detection and tracking to extract speech segment candidates from videos and reject frames in which faces ar e blurred or not suiciently frontal-facing. (b) W e discar d segments with noisy spee ch by estimating speech SNR (see Section 3). The plot is intended to show the accuracy of our speech SNR estimator (and thus the quality of the dataset). W e compare true speech SNR with our predicted SNR for synthetic mixtures of clean sp eech and non- speech noise at kno wn SNR levels. Predicted SNR values (in dB) are averaged over 60 generate d mixtures per SNR bin, with error bars representing 1 std. W e discard segments for which the predicted speech SNR is below 17 dB (marked by the gray doed line in the plot). single speaker , and both the video and audio are generally of high quality . Dataset creation pipeline. Our dataset collection process has two main stages, as illustrate d in Figure 3. First, we used the speaker tracking method of Hoover et al . [2017] to detect video segments of a person actively speaking with their face visible. Face frames that were blurred, insuciently illuminated or had e xtreme pose were discarded from the segments. If more than 15% of a segment’s face frames were missing, it was discarded altogether . W e used Google Cloud Vision API 1 for the classiers in this stage, and to compute the statistics in Figure 2. The second step in building the dataset is rening the speech segments to include only clean, non-interfered sp eech. This is a crucial comp onent be cause such segments ser ve as ground truth during training. W e perform this renement step automatically by estimating the speech SNR (the log ratio of the main spee ch signal to the rest of the audio signal) of each segment as follows. W e used a pre-trained audio-only speech denoising network to predict the SNR of a given segment using the denoise d output as an estimation of the clean signal. The architecture of this network is the same as the one implemented for the audio-only speech en- hancement baseline in Section 5, and it was trained on spee ch from the LibriV o x collection of public domain audio books. Segments for which the estimated SNR is below a threshold were rejecte d. The threshold was set empirically using synthetic mixtures of clean speech and non-spee ch interfering noise at dierent, known SNR 1 https://cloud.google.com/vision/ levels. 2 These synthetic mixtures wer e fed into the denoising net- work and the estimated (denoised) SNR was compar ed to the gr ound truth SNR (see Figure. 3(b)). W e found that at low SNRs, on average, the estimated SNR is v ery accurate, thus can be considered a go od predictor of the original noise level. At higher SNRs (i.e. segments with little-to-no interfer- ence of the original speech signal), the accuracy of this estimator diminishes because the noise signal is faint. The threshold at which this o ccurs is at around 17 dB, as can b e seen in Figure 3(b). W e listened to a random sample of 100 clips which passe d this ltering, and found that none of them contained noticeable background noise. W e provide sample video clips from our dataset in the supplemen- tary material. 4 AUDIO- VISU AL SPEECH SEP ARA TION MODEL At a high-level, our model is comprised of a multi-stream architec- ture which takes visual str eams of detected faces and noisy audio as input, and outputs complex sp ectrogram masks, one for each detected face in the vide o (Figure 4). The noisy input spectrograms are then multiplied by the masks to obtain an isolated speech signal for each speaker , while suppressing all other interfering signals. 4.1 Video and A udio Representation Input features. Our model takes both visual and auditory features as input. Given a video clip containing multiple speakers, we use an o-the-shelf face detector (e.g. Google Cloud Vision API) to nd faces in each frame (75 face thumbnails altogether per speaker , assuming 3-second clips at 25 FPS). W e use a pretrained face recog- nition model to e xtract one face embedding per frame for each of the detected face thumbnails. W e use the lowest lay er in the network that is not spatially varying, similar to the one use d by Cole et al . [2016] for synthesizing faces. The rationale for this is that these embeddings retain information necessary for recognizing millions of faces, while discar ding irrelevant variation b etween images, such as illumination. In fact, recent work also demonstrated that it is possible to recover facial expressions from such embeddings [Rudd et al . 2016]. W e also experimente d with raw pixels of the face images, which did not lead to improved performance. As for the audio features, we compute the short-time Fourier transform (STFT) of 3-second audio segments. Each time-frequency (TF) bin contains the real and imaginary parts of a complex number , both of which w e use as input. W e perform p ower-law compression to prevent loud audio fr om overwhelming soft audio. The same processing is applied to both the noisy signal and the clean r eference signal. At inference time, our separation model can be applied to arbi- trarily long segments of video. When more than one speaking face is detected in a frame, our model can accept multiple face streams as input, as we will discuss shortly . Output. The output of our model is a multiplicative spectrogram mask, which describ es the time-frequency relationships of clean speech to background interference. In previous work [W ang and Chen 2017; W ang et al . 2014], multiplicative masks have been ob- served to work better than alternatives such as direct prediction 2 Such mixtures simulate well the type of interference in our dataset, which typically involves a single speaker interfered by non-speech sounds like audience clapping or intro music. ACM T rans. Graph., V ol. 37, No. 4, Article 112. Publication date: August 2018. Looking to Listen at the Cocktail Party • 112:5 Face Embedding STFT 256 298 1024 11 75 1 256 256 257 257 257 257 298 96 96 8 8*257 1 1 298 298 400 111 298 600 ISTFT ISTFT 256 1 Dilated convolution network 1 256 Bidirectional LSTM Audio-visual fusion FC layers Complex masks Output waveforms V isual streams Audio stream A V fused 2 2 2 257 298 257 298 75 frames Face #1 3 seconds Input audio 256 298 1024 11 75 1 256 1 256 75 frames Face #N shared weights Face Embedding Input video Separated speech spectrograms Fig. 4. Our model’s multi-stream neural network-based architecture: The visual streams take as input thumbnails of dete cted faces in each frame in the video, and the audio stream takes as input the video’s soundtrack, containing a mixture of speech and background noise. The visual streams extract face embeddings for each thumbnail using a pretrained face recognition model, then learn a visual feature using a dilated convolutional NN. The audio stream first computes the STFT of the input signal to obtain a spectrogram, and then learns an audio representation using a similar dilated convolutional NN. A joint, audio-visual representation is then created by concatenating the learned visual and audio features, and is subsequently further processed using a bidirectional LSTM and three fully connected layers. The network outputs a complex spectrogram mask for each speaker , which is multiplied by the noisy input, and converted back to waveforms to obtain an isolated speech signal for each speaker . T able 1. Dilate d convolutional layers comprising our model’s audio stream. conv1 conv2 conv3 conv4 conv5 conv6 conv7 conv8 conv9 conv10 conv11 conv12 conv13 conv14 conv15 Num Filters 96 96 96 96 96 96 96 96 96 96 96 96 96 96 8 Filter Size 1 × 7 7 × 1 5 × 5 5 × 5 5 × 5 5 × 5 5 × 5 5 × 5 5 × 5 5 × 5 5 × 5 5 × 5 5 × 5 5 × 5 1 × 1 Dilation 1 × 1 1 × 1 1 × 1 2 × 1 4 × 1 8 × 1 16 × 1 32 × 1 1 × 1 2 × 2 4 × 4 8 × 8 16 × 16 32 × 32 1 × 1 Context 1 × 7 7 × 7 9 × 9 13 × 11 21 × 13 37 × 15 69 × 17 133 × 19 135 × 21 139 × 25 147 × 33 163 × 49 195 × 81 259 × 145 259 × 145 T able 2. Dilated convolutional layers comprising our model’s visual streams. conv1 conv2 conv3 conv4 conv5 conv6 Num Filters 256 256 256 256 256 256 Filter Size 7 × 1 5 × 1 5 × 1 5 × 1 5 × 1 5 × 1 Dilation 1 × 1 1 × 1 2 × 1 4 × 1 8 × 1 16 × 1 Context 7 × 1 9 × 1 13 × 1 21 × 1 37 × 1 69 × 1 of spectrogram magnitudes or direct prediction of time-domain waveforms. Many types of masking-based training targets exist in the source separation literature [W ang and Chen 2017], of which we experiment with two: ratio mask (RM) and complex ratio mask (cRM). The ideal ratio mask is dened as the ratio between the magni- tudes of the clean and noisy sp ectrograms, and is assumed to lie between 0 and 1 . The complex ideal ratio mask is dened as the ratio of the complex clean and noisy spe ctrograms. The cRM has a real component and an imaginary component, which are sepa- rately estimate d in the real domain. Real and imaginary parts of the complex mask will typically lie between -1 and 1, howev er , we use sigmoidal compression to bound these complex mask values between 0 and 1 [W ang et al. 2016]. When masking with cRM, denoised waveforms are obtained by performing inverse STFT (ISTFT) on the complex multiplication of the predicted cRM and noisy spectrogram. When using RM, we perform ISTFT on the point-wise multiplication of the predicted RM and noisy sp ectrogram magnitude, combined with the noisy original phase [W ang and Chen 2017]. Given multiple detected speakers’ face streams as input, the net- work outputs a separate mask for each speaker , and one for back- ground interference. W e perform most of our experiments using cRM, as we found that output spe ech quality using it was signi- cantly better than RM. Se e T able 6 for a quantitative comparison of the two methods. 4.2 Network architecture Fig. 4 provides a high-level ov erview of the various modules in our network, which we will now describe in detail. ACM T rans. Graph., V ol. 37, No. 4, Article 112. Publication date: August 2018. 112:6 • Ephrat, A. et al A udio and visual streams. The audio stream part of our model consists of dilated convolutional layers, the parameters of which are specied in T able 1. The visual stream of our model is used to process the input face embeddings (see Section 4.1), and consists of dilated convolutions as detailed in T able 2. Note that “spatial” convolutions and dilations in the visual stream are performed over the temporal axis (not over the 1024-D face embedding channel). T o compensate for the sampling rate discrepancy b etween the audio and video signals, we upsample the output of the visual stream to match the sp ectrogram sampling rate ( 100 Hz). This is done using simple nearest neighbor interpolation in the temp oral dimension of each visual feature. A V fusion. The audio and visual streams are combined by concate- nating the feature maps of each stream, which are subsequently fed into a BLSTM followed by three FC lay ers. The nal output consists of a complex mask (tw o-channels, real and imaginary) for each of the input speakers. The corresponding spe ctrograms are computed by complex multiplication of the noisy input spectrogram and the output masks. The squared error (L2) between the power-law com- pressed clean spectrogram and the enhanced spectrogram is used as a loss function to train the network. The nal output waveforms are obtained using ISTFT , as described in Section 4.1. Multiple sp eakers. Our model supports isolation of multiple vis- ible speakers in a video, each repr esented by a visual stream, as illustrated in Fig. 4. A separate, dedicate d model is trained for each number of visible sp eakers, e.g. a model with one visual stream for one visible speaker , double visual stream model for two , etc. All the visual streams share the same weights across convolutional layers. In this case, the learned features fr om each visual stream are concatenated with the learned audio features before continuing on to the BLSTM. It should b e noted that in practice, a mo del which takes a single visual stream as input can be used in the general case in which either the number of sp eakers is unknown, or a dedicated multi-speaker model is unavailable. 4.3 Implementation details Our network is implemented in T ensorFlow , and its included opera- tions are used for performing waveform and STFT transformations. ReLU activations follow all network layers except for last (mask), where a sigmoid is applied. Batch normalization [Ioe and Szegedy 2015] is performed after all convolutional layers. Dropout is not used, as we train on a large amount of data and do not suer from overtting. W e use a batch size of 6 samples and train with A dam optimizer for 5 million steps ( batches) with a learning rate of 3 · 10 − 5 which is reduced by half every 1.8 million steps. All audio is resampled to 16kHz, and stereo audio is converted to mono by taking only the left channel. STFT is compute d using a Hann window of length 25ms, hop length of 10ms, and FFT size of 512, resulting in an input audio featur e of 257 × 298 × 2 scalars. Power-law compression is p erformed with p = 0 . 3 ( A 0 . 3 , where A is the input/output audio spectrogram). W e resample the face embeddings from all videos to 25 frames- per-second (FPS) b efore training and inference by either removing or replicating embeddings. This results in an input visual stream of 75 face embeddings. Face detection, alignment and quality assessment is performed using the tools describe d by Cole et al . [2016]. When missing frames are encountered in a particular sample, we use a vector of zeros in lieu of a face embedding. 5 EXPERIMEN TS AND RESULTS W e tested our method in a variety of conditions and also compared our results to state-of-the-art audio-only (A O) and audio-visual (A V) spee ch separation and enhancement, both quantitatively and qualitatively . Comparison with Audio-Only . There are no publicly available state-of-the-art audio-only sp eech enhancement/separation sys- tems, and relatively few publicly available datasets for training and evaluating audio-only spee ch enhancement. And although there is extensive literatur e on “blind source separation” for audio-only speech enhancement and separation [Comon and Jutten 2010], most of these techniques require multiple audio channels (multiple mi- crophones), and are therefor e not applicable to our task. For these reasons, we implemented an A O baseline for speech enhancement which has a similar ar chitecture to the audio stream in our audio- visual model (Fig. 4, when stripping out the visual streams). When trained and evaluated on the CHiME-2 dataset [Vincent et al . 2013], which is widely used for speech enhancement work, our A O base- line achieved a signal-to-distortion ratio of 14.6 dB, nearly as good as the state-of-the-art single channel result of 14.75 dB reported by Erdogan et al . [2015]. Our A O enhancement model is therefore deemed a near state-of-the-art baseline. In order to compare our separation results to those of a state- of-the-art AO model, we implemented the permutation-invariant training introduce d by Y u et al . [2017]. Note that spee ch separation using this method requires a priori knowledge of the number of sources present in the r ecording, and also requires manual assign- ment of each output channel to the face of its corresponding speaker in the video (which our A V metho d does automatically). W e use these AO methods in all our synthetic experiments in Section 5.1, and also show qualitative comparisons to it on real videos in Section 5.2. Comparison with Recent A udio- Visual Metho ds. Since existing A V speech separation and enhancement metho ds are speaker depen- dent, we could not easily compar e to them in our experiments on synthetic mixtures (Section 5.1), or run them on our natural videos (Section 5.2). How ever , we show quantitative comparisons with those methods on existing datasets by running our model on videos from those papers. W e discuss this comparison in more detail in Section 5.3. In addition, we show qualitative comparisons in our supplementary material. 5.1 antitative Analysis on Synthetic Mixtures W e generated data for several dierent single-channel speech sep- aration tasks. Each task requires its own unique conguration of mixtures of speech and non-spe ech background noise. W e describe below the generation procedure for each variant of training data, as well as the relevant models for each task, which were trained from scratch. In all cases, clean spe ech clips and corresponding faces are taken from our A VSpeech (A VS) dataset. Non-spee ch background noise is obtained fr om A udioSet [Gemmeke et al . 2017], a large-scale dataset ACM T rans. Graph., V ol. 37, No. 4, Article 112. Publication date: August 2018. Looking to Listen at the Cocktail Party • 112:7 T able 3. Quantitative analysis and comparison with audio-only speech separation and enhancement: ality improvement (in SDR, see Section A in the Appendix) as function of the number of input visual streams using dier ent network configurations. First row (audio-only) is our implementation of a state-of-the-art speech separation model, and shown as a baseline. 1S+Noise 2S clean 2S+Noise 3S clean A O [Yu et al. 2017] 16.0 8.6 10.0 8.6 A V - 1 face 16.0 9.9 10.1 9.1 A V - 2 faces - 10.3 10.6 9.1 A V - 3 faces - - - 10.0 of manually-annotated segments from Y ouTube videos. Separated speech quality is evaluated using signal-to-distortion ratio (SDR) improvement from the BSS Eval toolbox [Vincent et al . 2006], a commonly used metric for e valuating speech separation quality (see Section A in the Appendix). W e extracted 3-se cond non-overlapping segments from the varying- length segments in our dataset (e.g. a 10-sec segment would con- tribute 3 3-second segments). W e generate d 1.5 million synthetic mixtures for all the models and experiments. For each experiment, 90% of the generated data was taken to be the training set, and the remaining 10% was used as the test set. W e did not use any validation set as no parameter tuning or early stopping were performed. One speaker + noise (1S+Noise). This is a classic speech enhance- ment task, for which the training data was generated by a linear combination of unnormalized clean sp eech and AudioSet noise: M i x i = A V S j + 0 . 3 ∗ A u d i oS e t k where A V S j is one utterance from A VS, A u di oS e t k is one segment from A udioSet with its amplitude multiplied by 0.3, and M i x i is a sample in the generated dataset of synthetic mixtures. Our audio only model performs quite well in this case, because the characteristic frequencies of noise are typically well separated from the characteristic frequencies of spe ech. Our audio-visual (A V) model p erforms as well as the audio-only (A O) baseline with SDR of 16 dB (rst column of T able 3). T wo clean speakers (2S clean). The dataset for this two-speaker separation scenario was generated by mixing clean speech of two dierent sp eakers from our A VS dataset: M i x i = A V S j + A V S k , where A V S j and A V S k are clean speech samples from dierent source videos in our dataset, and M i x i is a sample in the generate d dataset of synthetic mixtures. W e trained two dierent A V mo dels on this task, in addition to our A O baseline: ( i ) A model which takes only one visual stream as input, and outputs only its corresponding denoised signal. In this case, at infer- ence, the denoised signal of each sp eaker is obtained by two forward passes in the network (one for each speaker). A veraging the SDR results of this model gives an impr ovement of 1.3 dB ov er our A O baseline (second column of T able 3). ( i i ) A model which takes visual information from both speakers as input, in two separate streams (as explained in Section 4). In this case, the output consists of two masks, one for each speaker , and inference is done with a single forward pass. An additional boost of 0.4 dB is obtained using this mo del, resulting in a 10.3 dB total SDR improvement. Intuitively , jointly processing two visual streams -15 -10 -5 0 5 10 15 20 Input SDR (dB) -5 0 5 10 15 20 25 SDR improvement (dB) Audio-visual (ours), 2-speaker model Audio-only Fig. 5. Input SDR vs. output SDR improvement: A scaer plot showing separation performance (SDR improvement) as a function of original (noisy) SDR for the task of separating two clean speakers ( 2S clean ). Each point corresponds to a single, 3-second audio-visual sample from the test set. (a) Input (2 speakers + noise) (b) Ground truth (c) Ground truth (e) Our result (f) Our result Speaker I Speaker II (d) Est. Mask: speaker I speaker II Fig. 6. Example of input and output audio: The top r ow shows the audio spectrogram for one segment in our training data, involving two speakers and background noise (a), together with the ground truth, separate spec- trograms of each speaker (b, c). In the boom row we show our results: the masks our method estimates for that segment, superimp osed on one spec- trogram with a dierent color for each speaker (d), and the corr esponding output spectrograms for each speaker (e, f ). provides the network with more information and imposes more constraints on the separation task, hence improving the results. Fig. 5 shows the SDR improvement as a function of input SDR for this task, for both the audio-only baseline and our two-speaker audio-visual model. T wo speakers + noise (2S+Noise). Here, we consider the task of isolating one speaker’s voice from a mixtur e of two speakers and non-speech background noise. T o the best of our knowledge, this audio-visual task has not been addressed b efore. The training data was generated by mixing clean speech of two dierent speakers (as generate d for the 2S clean task) with background noise from A udioSet: M i x i = A V S j + A V S k + 0 . 3 ∗ A ud ioS e t l . In this case we trained the AO network with three outputs, one for each speaker and one for background noise. In addition, we trained two dierent congurations of our model, with one and two visual streams received as input. The conguration of the one-stream A V model is the same as in model ( i ) in the previous experiment. The two-stream A V outputs three signals, one for each speaker and one ACM T rans. Graph., V ol. 37, No. 4, Article 112. Publication date: August 2018. 112:8 • Ephrat, A. et al T able 4. Same-gender separation. The results in this table, from the 2S clean experiment, show that our method is robust to separation of speech from same-gender mixtures. SDR Male-Male 9.7 Female-Female 10.6 Male-Female 10.5 for background noise. As can be seen in T able 3 (third column), the SDR gain of our one-stream A V model over the audio only baseline is 0.1 dB, and 0.5 dB for two streams, bringing the total SDR improvement to 10.6 dB. Fig. 6 shows the inferred masks and output spectrograms for a sample segment from this task, along with its noisy input and ground truth spectrograms. Three clean speakers (3S clean). The dataset for this task is cre- ated by mixing clean spe ech from three dierent speakers: M i x i = A V S j + A V S k + A V S l . In a similar manner to the previous tasks, we trained our A V model with one, two and three visual streams as input, which output one, two and three signals, respectively . W e found that even when using a single visual stream, the A V model performs better than the AO model, with a 0.5 dB improv e- ment over it. The two visual str eam conguration gives the same improvement o ver the A O model, while using three visual streams leads to a gain of 1.4 dB, attaining a total 10 dB SDR improv ement (fourth column of T able 3). Same-gender separation. Many previous spee ch separation meth- ods show a drop in p erformance when attempting to separate spe ech mixtures containing same-gender speech [Delfarah and W ang 2017; Hershey et al . 2016]. T able 4 shows a breakdown of our separa- tion quality by the dierent gender combinations. Interestingly , our model performs best (by a small margin) on female-female mixtures, but performs well on the other combinations as well, demonstrating its gender robustness. 5.2 Real- W orld Speech Separation In order to demonstrate our model’s speech separation capabilities in real-world scenarios, we tested it on an assortment of videos containing heated debates and interviews, noisy bars and scr eaming children (Fig. 7). In each scenario we use a trained model whose number of visual input streams matches the numb er of visible sp eak- ers in the video. For example, for a video with two visible speakers, a two-speaker model was used. W e performed separation using a single forward pass per video, which our mo del supports, since our network architecture ne ver enforces a specic temporal duration. This allows us to avoid the need to post-process and consolidate results on shorter chunks of the vide o. Because there is no clean reference audio for these examples, these results and their compari- son to other methods ar e evaluated qualitatively; they are presented in our supplementary material. It should b e noted that our method does not work in real-time , and, in its current form, our speech enhancement is better suited for the post-processing stage of video editing. The synthetic “Double Brady” video in our supplementary mate- rial highlights the utilization of visual information by our model, as it is very dicult to perform speech separation in this scenario using only characteristic spee ch frequencies contained in the audio. The “Noisy Bar” scene shows a limitation of our approach in separating spe ech from mixtures with low SNR. In this case, the background noise is almost entirely suppressed, however output T able 5. Comparison with existing audio-visual speech separation work. W e compare our sp eech separation and enhancement results on several datasets to those of previous work, using the evaluation protocols and objective scores reported in the original papers. Note that previous approaches are speaker-dependent , whereas our results are obtained by using a general, speaker-independent mo del. Mandarin (Enhancement) Gabbay et al. [2017] Hou et al. [2018] Ours PESQ 2.25 2.42 2.5 STOI - 0.66 0.71 SDR - 2.8 6.1 TCD- TIMIT (Separation) Gabbay et al. [2017] Ours SDR 0.4 4.1 PESQ 2.03 2.42 CU A VE (Separation) Casanovas et al. [2010] Pu et al. [2017] Ours SDR 7 6.2 12.6 speech quality is noticeably degrade d. Sun et al . [2017] observed that this limitation stems from the use of a masking-based approach for separation, and that in this scenario, directly predicting the denoised spectrogram could help overcome this problem. In cases of classic speech enhancement, i.e. one speaker with non-spee ch background noise, our A V model obtains similar results to those of our strong AO baseline. W e suspect this is because the characteristic frequencies of noise are typically well separated from the characteristic frequencies of speech, and therefore incorporating visual information does not provide additional discrimination capabilities. 5.3 Comparison with Previous W ork in A udio- Visual Speech Separation and Enhancement Our evaluation would not be complete without comparing our re- sults to those of previous work in A V sp eech separation and en- hancement. T able 5 contains these comparisons on three dierent A V datasets, Mandarin, TCD- TIMI T and CU A VE, mentioned in Sec- tion 2, using the evaluation protocols and metrics described in the respective papers. The reported objective quality scores are PESQ [Rix et al . 2001], STOI [T aal et al . 2010] and SDR from the BSS eval toolbox [Vincent et al . 2006]. Qualitative results of these compar- isons are available on our project page. It is important to note that these prior methods require training a dedicated mo del for each speaker in their dataset ( speaker dependent ), whereas our evaluation on their data is done using a mo del trained on our general A VS dataset ( speaker independent ). Despite having never encountered these particular speakers before, our results are signicantly better than those reported in the original pap ers, indicating the strong generalization capability of our model. 5.4 Application to Video Transcription While our focus in this pap er is sp eech separation and enhance- ment, our metho d can also b e useful for automatic spe ech recog- nition ( ASR) and video transcription. A s a proof of concept, we ACM T rans. Graph., V ol. 37, No. 4, Article 112. Publication date: August 2018. Looking to Listen at the Cocktail Party • 112:9 Fig. 7. Speech separation in the wild: Representative frames from natural videos demonstrating our method in various real-world scenarios. All videos and results can be found in the supplementary material. The “Undisputed Interview” video is courtesy of Fox Sports. performed the following qualitative experiment. W e uploaded our speech-separate d results for the “Stand-Up ” video to Y ouT ube, and compared the resulting captions produced by Y ouT ube’s automatic captioning 3 with those it produce d for the corresponding source videos with mixe d sp eech. For parts of the original “Stand-Up” video, the ASR system was unable to generate any captions in mixe d speech segments of the video. The results included spe ech fr om both speak- ers, resulting in hard-to-read sentences. However , captions produce d on our separated sp eech results were noticeably more accurate. W e show the full captioned videos in our supplementary material. 5.5 Additional Analysis W e also conducted extensive experiments to better understand the model’s behavior and ho w its dierent components ae ct the results. Ablation study . In order to better understand the contribution of dierent parts of our mo del, we p erformed an ablation study on the task of spee ch separation from a mixture of two clean speakers ( 2S Clean ). In addition to ablating several combinations of netw ork modules (visual and audio streams, BLSTM and FC layers), we also investigated higher-level changes such as a dierent output mask (magnitude), the eect of reducing the learned visual features to one scalar per timestep, and a dierent fusion method (early fusion). In the early fusion model, we do not have separate visual and audio streams, but rather combine the two modalities at the input. This is done by rst using two fully connected layers to reduce the dimensionality of each visual embe dding to match the spectrogram dimension at each timestep, then stacking the visual features as a 3 https://support.google.com/youtube/answer/6373554?hl=en T able 6. Ablation study: W e investigate the contribution of dier ent parts of our model on the scenario of separating mixtures of two clean speakers. SDR correlates well with noise suppression, and ViSQOL indicates level of speech quality (see Section A in the Appendix) . SDR ViSQOL Our full model (cRM) 10.3 3.0 - No FC 10.0 2.3 - No BLSTM 8.7 2.7 - A udio-only (input) 8.6 2.7 - No BLSTM or FC 0.6 1.8 - Visual-only (input) 1.4 2.0 Magnitude mask (RM) 9.7 2.8 Bottleneck (cRM) 9.8 2.9 Early fusion (cRM) 8.1 2.5 Oracle RM + noisy ph. 9.7 3.4 Oracle cRM 14.8 3.8 Oracle RM + oracle ph. 17.4 4.7 third spectrogram “channel” and processing them jointly throughout the model. T able 6 shows the results of our ablation study . The table includes evaluation using SDR and ViSQOL [Hines et al . 2015], an objective measure intended to approximate human listener mean opinion scores (MOS) of speech quality . The ViSQOL scores wer e calculated on a random 2000 sample subset of our testing data. W e found that SDR correlates well with the amount of noise left in the separated audio, and ViSQOL is a better indicator of output speech quality . See Section A in the Appendix for more details on these scores. “Oracle” RMs and cRMs are masks obtained as described in Section 4.1, by us- ing the ground truth real-valued and complex-valued spectrograms, respectively . The most interesting ndings of this study are the drop in MOS when using a real-valued magnitude mask rather than a complex one, and the surprising eectiveness of squeezing the visual information into one scalar per timestep, described below . Bottleneck features. In our ablation analysis we found that a net- work which squeezes the visual information into a bottleneck of one scalar per timestep (“Bottleneck (cRM)”) p erforms almost as well (only 0.5 dB less) as our full model (“Full model (cRM)”) that uses 64 scalars per timestep. How do es the model utilize the visual signal? Our model uses face embeddings as the input visual representation (Section 4.1). W e want to gain insights on the information captured in these high- level features and to identify which regions of the input frames are used by the mo del for separating the spee ch. T o this end, we follow a similar protocol as in [Zeiler and Fergus 2014; Zhou et al . 2014] for visualizing receptive elds of deep networks. W e extend that protocol from 2D images to 3D (space-time) video. More sp eci- cally , we use a space-time patch occluder ( 11 px × 11 px × 200 ms patch 4 ) in a sliding window fashion. For each space-time occluder , we feed-forward the occlude d video into our model and compare the spee ch separation result, S o c c , with the one obtained on the original (non-occluded) video, S o r i д . T o quantify the dier ence be- tween the network outputs, we use SNR, treating the result without 4 W e use 200ms length to co ver the typical range of phoneme duration: 30-200 ms. ACM T rans. Graph., V ol. 37, No. 4, Article 112. Publication date: August 2018. 112:10 • Ephrat, A. et al Fig. 8. How does the model utilize the visual signal? W e show heat maps overlaid on representative input frames from several videos, visu- alizing the contribution of dierent regions of the frames to our speech separation result (in dB, see text), from blue ( low contribution) to red (high contribution). the occluder as the “signal” 5 . That is, for each space-time patch, we compute: E = 10 · log S o r i д 2 ( S o c c − S o r i д ) 2 ! . (1) Repeating this process for all space-time patches in a video results in a heat map for each frame . For visualization purposes we normalize the heat maps by the maximum SNR for the video: ˜ E = E m a x − E . In ˜ E , high values correspond to patches with high impact on the speech separation result. In Fig. 8 we show the resulting heat maps for representative frames from sev eral videos (the full heat map videos are available on our project page). As expecte d, the facial regions that contribute the most are located around the mouth, yet the visualization reveals that other areas such as the eyes and cheeks contribute as well. Eect of missing visual information. W e further teste d the contri- bution of visual information to the model by gradual elimination of visual embeddings. Sp ecically , w e start by running the model and evaluating the speech separation quality using visual information for the full 3 second video. W e then gradually discard embeddings from both ends of the segment, and re-evaluate the separation qual- ity with visual durations of 2, 1, 0.5 and 0.2 seconds. The results are shown in Fig. 9. Inter estingly , the speech separa- tion quality is reduced by only 0 . 8 dB on average when dropping as much as 2 / 3 of the visual embeddings in the segments. This shows the robustness of the model to missing visual information, which may occur in r eal world scenarios due to head motion or o cclusions. 6 CONCLUSION W e proposed an audio-visual neural network-based mo del for single- channel, speaker-independent spe ech separation. Our model works well in challenging scenarios, including multi-speaker mixtures 5 W e refer the reader to the supplementary material to validate that our separated speech on the non-occlude d video, which we treat as “ correct” in this example, is indeed accurate. Fig. 9. The eect of missing visual information: This graph shows the impact of the duration of the visual information on output SDR improvement in the 2S clean scenario. W e test this by gradually zeroing-out input face embeddings from both ends of the sample. The results show that even a small number of visual frames are suicient for high-quality separation. with background noise. T o train the model, we created a new audio- visual dataset with thousands of hours of video segments containing visible speakers and clean speech we collecte d from the W eb. W e showed state-of-the-art results on speech separation as well as a potential application to vide o captioning and sp eech recognition. W e also conducted extensive experiments to analyze the behavior of our model and its components. A CKNO WLEDGEMEN TS W e would like to thank Y ossi Matias and Google Research Israel for their support for the project, and John Hershey for his valuable feedback. W e also thank Arkady Ziefman for his help with gur e design and video editing, and Rachel Soh for helping us procure permissions for video content in our results. REFERENCES T . Afouras, J. S. Chung, and A. Zisserman. 2018. The Conversation: De ep A udio- Visual Speech Enhancement. In . Anna Llagostera Casanovas, Gianluca Monaci, Pierre V andergheynst, and Rémi Gri- bonval. 2010. Blind audiovisual source separation based on sparse redundant repre- sentations. IEEE Transactions on Multimedia 12, 5 (2010), 358–371. E Colin Cherry . 1953. Some experiments on the recognition of speech, with one and with two ears. The Journal of the acoustical society of A merica 25, 5 (1953), 975–979. Joon Son Chung, Andrew W . Senior, Oriol Vinyals, and Andre w Zisserman. 2016. Lip Reading Sentences in the Wild. CoRR abs/1611.05358 (2016). Forrester Cole, David Belanger, Dilip Krishnan, Aaron Sarna, Inbar Mosseri, and William T Freeman. 2016. Synthesizing normalized faces from facial identity features. In CVPR’17 . Pierre Comon and Christian Jutten. 2010. Handbook of Blind Source Separation: Inde- pendent component analysis and applications . Academic press. Masood Delfarah and DeLiang Wang. 2017. Features for Masking-Based Monaural Speech Separation in Reverberant Conditions. IEEE/A CM Transactions on Audio, Speech, and Language Processing 25 (2017), 1085–1094. Ariel Ephrat, T avi Halperin, and Shmuel Peleg. 2017. Improved Speech Reconstruction from Silent Video. In ICCV 2017 W orkshop on Computer Vision for A udio- Visual Media . Hakan Erdogan, John R. Hershey , Shinji W atanab e, and Jonathan Le Roux. 2015. Phase- sensitive and recognition-boosted speech separation using deep recurrent neural networks. IEEE International Conference on Acoustics, Speech and Signal Processing (ICASSP) (2015). W eijiang Feng, Naiyang Guan, Y uan Li, Xiang Zhang, and Zhigang Luo. 2017. A udio visual speech recognition with multimodal recurrent neural networks. In Neural Networks (IJCNN), 2017 International Joint Conference on . IEEE, 681–688. A viv Gabbay , Ariel Ephrat, T avi Halperin, and Shmuel Peleg. 2018. Se eing Through Noise: Speaker Separation and Enhancement using Visually-derived Speech. IEEE International Conference on Acoustics, Speech and Signal Processing (ICASSP) (2018). A viv Gabbay, Asaph Shamir, and Shmuel Peleg. 2017. Visual Speech Enhancement using Noise-Invariant Training. arXiv preprint arXiv:1711.08789 (2017). R. Gao, R. Feris, and K. Grauman. 2018. Learning to Separate Object Sounds by W atching Unlabeled Video. arXiv preprint arXiv:1804.01665 (2018). Jort F. Gemmeke , Daniel P. W . Ellis, Dylan Freedman, Aren Jansen, W ade Lawrence, R. Channing Moore, Manoj Plakal, and Mar vin Ritter . 2017. Audio Set: An ontology and human-labeled dataset for audio events. In Proc. IEEE ICASSP 2017 . ACM T rans. Graph., V ol. 37, No. 4, Article 112. Publication date: August 2018. Looking to Listen at the Cocktail Party • 112:11 Elana Zion Golumbic, Gr egory B Cogan, Charles E. Schroeder , and David Poeppel. 2013. Visual input enhances selective spe ech envelope tracking in auditory cortex at a "cocktail party" . The Journal of neuroscience : the ocial journal of the Society for Neuroscience 33 4 (2013), 1417–26. Naomi Harte and Eoin Gillen. 2015. TCD- TIMIT: An audio-visual corpus of continuous speech. IEEE Transactions on Multimedia 17, 5 (2015), 603–615. David F. Harwath, Antonio T orralba, and James R. Glass. 2016. Unsuper vised Learning of Spoken Language with Visual Context. In NIPS . John Hershey , Hagai Attias, Nebojsa Jojic, and Trausti Kristjansson. 2004. Audio-visual graphical models for speech processing. In IEEE International Conference on Acoustics, Speech and Signal Processing (ICASSP) . John R Hershey and Michael Casey . 2002. Audio-visual sound separation via hidden Markov models. In Advances in Neural Information Processing Systems . 1173–1180. John R. Hershey , Zhuo Chen, Jonathan Le Roux, and Shinji Watanabe. 2016. Deep clustering: Discriminative emb eddings for segmentation and separation. IEEE International Conference on Acoustics, Sp eech and Signal Processing (ICASSP) (2016), 31–35. Andrew Hines, Eoin Gillen, Damien Kelly , Jan Skoglund, Anil C. Kokaram, and Naomi Harte. 2015. ViSQOLAudio: An objective audio quality metric for low bitrate codecs. The Journal of the Acoustical Society of America 137 6 (2015), EL449–55. Andrew Hines and Naomi Harte. 2012. Speech Intelligibility Prediction Using a Neuro- gram Similarity Index Measure. Sp eech Commun. 54, 2 (Feb. 2012), 306–320. DOI: http://dx.doi.org/10.1016/j.specom.2011.09.004 Ken Hoover , Sourish Chaudhuri, Caroline Pantofaru, Malcolm Slaney , and Ian Sturdy . 2017. Putting a Face to the V oice: Fusing A udio and Visual Signals Acr oss a Video to Determine Speakers. CoRR abs/1706.00079 (2017). Jen-Cheng Hou, Syu-Siang Wang, Ying-Hui Lai, Jen-Chun Lin, Y u Tsao , Hsiu-W en Chang, and Hsin-Min W ang. 2018. Audio- Visual Speech Enhancement Using Multi- modal Deep Convolutional Neural Networks. IEEE Transactions on Emerging Topics in Computational Intelligence 2, 2 (2018), 117–128. Y ongtao Hu, Jimmy SJ Ren, Jingwen Dai, Chang Y uan, Li Xu, and W enping W ang. 2015. Deep multimodal speaker naming. In Proceedings of the 23rd A CM international conference on Multime dia . A CM, 1107–1110. Sergey Ioe and Christian Szegedy. 2015. Batch Normalization: Accelerating Deep Network Training by Reducing Internal Covariate Shift. In ICML . Y usuf Isik, Jonathan Le Roux, Zhuo Chen, Shinji W atanabe, and John R Hershey . 2016. Single-Channel Multi-Speaker Separation Using Deep Clustering. Interspee ch (2016), 545–549. Faheem Khan. 2016. Audio-visual sp eaker separation . Ph.D. Dissertation. University of East Anglia. W ei Ji Ma, Xiang Zhou, Lars A. Ross, John J. Foxe , and Lucas C. Parra. 2009. Lip-Reading Aids W ord Recognition Most in Moderate Noise: A Bayesian Explanation Using High-Dimensional Feature Space. PLoS ONE 4 (2009), 233 – 252. Josh H McDermott. 2009. The cocktail party problem. Current Biology 19, 22 (2009), R1024–R1027. Gianluca Monaci. 2011. T owards real-time audiovisual speaker localization. In Signal Processing Conference, 2011 19th European . IEEE, 1055–1059. Y oussef Mroueh, Etienne Marcheret, and V aibhava Goel. 2015. Deep multimodal learn- ing for audio-visual speech recognition. In Acoustics, Spe ech and Signal Processing (ICASSP), 2015 IEEE International Conference on . IEEE, 2130–2134. Jiquan Ngiam, Aditya Khosla, Mingyu Kim, Juhan Nam, Honglak Lee, and Andre w Y. Ng. 2011. Multimodal Deep Learning. In ICML . Andrew O wens and Alexei A Efros. 2018. A udio- Visual Scene Analysis with Self- Supervised Multisensor y Features. (2018). Eric K. Patterson, Sabri Gurbuz, Zekeriya T ufekci, and John N. Gowdy . 2002. Moving- T alker , Speaker-Independent Feature Study , and Baseline Results Using the CU A VE Multimodal Speech Corpus. EURASIP J. Adv . Sig. Proc. 2002 (2002), 1189–1201. Jie Pu, Y annis Panagakis, Stavros Petridis, and Maja Pantic. 2017. A udio-visual object localization and separation using low-rank and sparsity . In Acoustics, Speech and Signal Processing (ICASSP), 2017 IEEE International Conference on . IEEE, 2901–2905. Bertrand Rivet, W enwu W ang, Syed M. Naqvi, and Jonathon A. Chambers. 2014. Audio- visual Speech Source Separation: An overview of key methodologies. IEEE Signal Processing Magazine 31 (2014), 125–134. Antony W Rix, John G Be erends, Michael P Hollier , and Andries P Hekstra. 2001. Perceptual evaluation of speech quality (PESQ)-a new method for speech quality assessment of telephone networks and codecs. In Acoustics, Speech, and Signal Processing, 2001. Proceedings.(ICASSP’01). 2001 IEEE International Conference on , V ol. 2. IEEE, 749–752. Ethan M Rudd, Manuel Günther , and T errance E Boult. 2016. Moon: A mixed obje ctive optimization network for the recognition of facial attributes. In European Conference on Computer Vision . Springer , 19–35. J S Garofolo, Lori Lamel, W M Fisher , Jonathan Fiscus, D S. Pallett, N L. Dahlgren, and V Zue. 1992. TIMI T Acoustic-phonetic Continuous Speech Corpus. (11 1992). Lei Sun, Jun Du, Li-Rong Dai, and Chin-Hui Lee. 2017. Multiple-target deep learning for LSTM-RNN based speech enhancement. In HSCMA . Cees H T aal, Richard C Hendriks, Richard Heusdens, and Jesper Jensen. 2010. A short- time objective intelligibility measure for time-frequency weighted noisy speech. In Acoustics Spe ech and Signal Processing (ICASSP), 2010 IEEE International Conference on . IEEE, 4214–4217. Emmanuel Vincent, Jon Barker , Shinji W atanabe, Jonathan Le Roux, Francesco Nesta, and Marco Matassoni. 2013. The se cond ’chime ’ speech separation and recognition challenge: Datasets, tasks and baselines. 2013 IEEE International Conference on Acoustics, Spe ech and Signal Processing (2013), 126–130. E. Vincent, R. Gribonval, and C. Fevotte. 2006. Performance Measurement in Blind A udio Source Separation. Trans. Audio, Spee ch and Lang. Proc. 14, 4 (2006), 1462–1469. DeLiang W ang and Jitong Chen. 2017. Supervised Spe ech Separation Based on Deep Learning: An Overview . CoRR abs/1708.07524 (2017). Y uxuan W ang, Arun Narayanan, and DeLiang W ang. 2014. On training targets for supervised speech separation. IEEE/A CM Transactions on A udio, Spe ech and Language Processing (T ASLP) 22, 12 (2014), 1849–1858. Ziteng W ang, Xiaofei W ang, Xu Li, Qiang Fu, and Y onghong Y an. 2016. Oracle perfor- mance investigation of the ideal masks. In IW AENC . Felix W eninger , Hakan Erdogan, Shinji W atanabe, Emmanuel Vincent, Jonathan Le Roux, John R. Hershey , and Björn W . Schuller. 2015. Spee ch Enhancement with LSTM Recurrent Neural Networks and its Application to Noise-Robust ASR. In LV A/ICA . Dong Y u, Morten Kolbæk, Zheng-Hua T an, and Jesper Jensen. 2017. Permutation invariant training of deep models for speaker-independent multi-talker speech separation. IEEE International Conference on Acoustics, Spe ech and Signal Processing (ICASSP) (2017), 241–245. Matthew D Zeiler and Rob Fergus. 2014. Visualizing and understanding convolutional networks. In European conference on computer vision . Springer, 818–833. Hang Zhao, Chuang Gan, Andrew Rouditchenko, Carl V ondrick, Josh McDermott, and Antonio T orralba. 2018. The Sound of Pixels. (2018). Bolei Zhou, Aditya Khosla, Agata Lapedriza, A ude Oliva, and Antonio T orralba. 2014. Object detectors emerge in deep scene cnns. arXiv preprint arXiv:1412.6856 (2014). A OBJECTIVE METRICS USED FOR EV ALU A TING SEP ARA TION QU ALI T Y A.1 SDR The signal-to-distortion ratio (SDR), introduce d by Vincent et al . [2006], is one of a family of measures designed to evaluate Blind A udio Source Separation (BASS) algorithms, where the original source signals are available as ground truth. The measures are base d on the decomposition of each estimated source signal into a true source part ( s t a r д e t ) plus error terms corresponding to interferences ( e i n t e r f ), additive noise ( e n o i s e ) and algorithmic artifacts ( e a r t i f ). SDR is the most general score, commonly reported for sp eech separation algorithms. It is measured in dB, and is dened as: S D R : = 10 · log 10 | | s t a r д e t | | 2 | | e i n t e r f + e n o i s e + e a r t i f | | 2 ! . (2) W e refer the reader to the original paper for details on signal decom- position into its components. W e found this measure to correlate well with the amount of noise left in the separated audio. A.2 ViSQOL The Virtual Speech Quality Objective Listener (ViSQOL) is an ob- jective speech quality model, introduce d by Hines et al . [2015]. The metric models human speech quality perception using a spe ctro- temporal measure of similarity between a reference ( r ) and a de- graded ( d ) speech signal, and is based on the Neurogram Similarity Index Measure (NSIM) [Hines and Harte 2012]. NSIM is dened as N S I M ( r , d ) = 2 µ r µ d + C 1 µ 2 r + µ 2 d + C 1 · σ r d + C 2 σ r σ d + C 2 , (3) where the µ s and σ s are mean and correlation coecients, respec- tively , calculate d between reference and degraded spectrograms. In ViSQOL, NSIM is calculated on spectrogram patches of the reference signal and their corresponding patches from the degraded signal. The algorithm subsequently aggregates and translates the NSIM scores into a mean opinion score (MOS) between 1 and 5. ACM T rans. Graph., V ol. 37, No. 4, Article 112. Publication date: August 2018.
Original Paper
Loading high-quality paper...
Comments & Academic Discussion
Loading comments...
Leave a Comment