A deep learning architecture to detect events in EEG signals during sleep
Electroencephalography (EEG) during sleep is used by clinicians to evaluate various neurological disorders. In sleep medicine, it is relevant to detect macro-events (> 10s) such as sleep stages, and micro-events (<2s) such as spindles and K-complexes…
Authors: Stanislas Chambon, Valentin Thorey, Pierrick J. Arnal
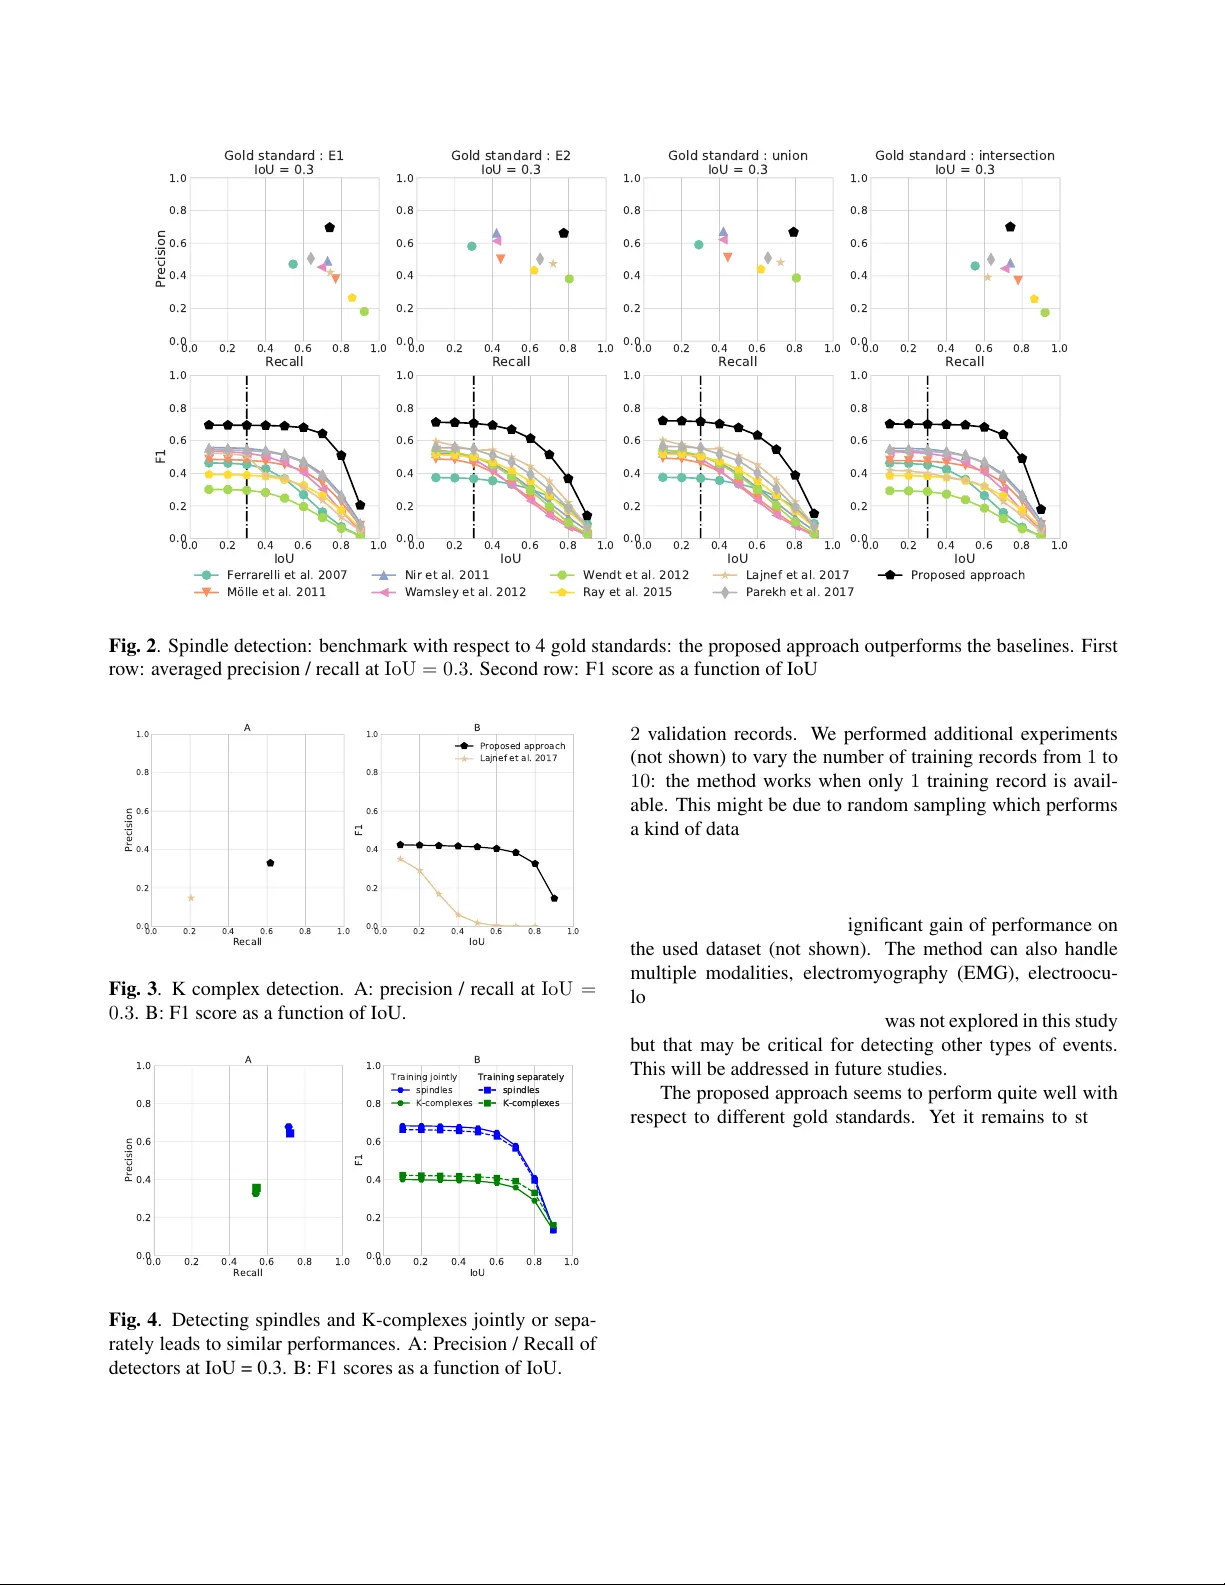
A DEEP LEARNING ARCHITECTURE TO DETECT EVENTS IN EEG SIGNALS DURING SLEEP Stanislas Chambon 1 , 2 , 3 ∗ , V alentin Thor e y 2 ∗ , Pierrick J . Arnal 2 , Emmanuel Mignot 1 , Alexandr e Gr amfort 3 , 4 , 5 1 Center for Sleep Sciences and Medicine, Stanford Uni versity , Stanford, California, USA 2 Research & Algorithms T eam, Dreem, Paris, France 3 L TCI T ´ el ´ ecom ParisT ech, Uni versit ´ e Paris-Saclay , P aris, France 4 Inria, Uni versit ´ e Paris-Saclay , P aris, France 5 CEA Neurospin, Uni versit ´ e Paris-Saclay , P aris, France ABSTRA CT Electroencephalography (EEG) during sleep is used by clinicians to ev aluate various neurological disorders. In sleep medicine, it is relev ant to detect macro-ev ents ( ≥ 10 s) such as sleep stages, and micro-ev ents ( ≤ 2 s) such as spindles and K-complex es. Annotations of such e vents require a trained sleep expert, a time consuming and tedious process with a large inter -scorer variability . Automatic algorithms hav e been de veloped to detect v arious types of ev ents but these are ev ent-specific. W e propose a deep learning method that jointly predicts locations, durations and types of events in EEG time series. It relies on a con volutional neural network that builds a feature representation from raw EEG signals. Numerical experiments demonstrate efficiency of this new approach on various ev ent detection tasks compared to cur- rent state-of-the-art, ev ent specific, algorithms. Index T erms — Deep learning, EEG, event detection, sleep, EEG-patterns, time series 1. INTRODUCTION During sleep, brain activity is characterized by some spe- cific electroencephalographic (EEG) patterns, or events, (e.g. spindles, K-complexes) used to define more global state (e.g. sleep stages) [1]. Detecting such events is meaningful to better understand sleep physiology [2, 3] and relev ant to the physiopathology of some sleep disorders [4, 5, 6]. T radi- tionally , visual analysis of these ev ents is conducted, b ut it is tedious, time consuming and requires a trained sleep expert. Agreement between e xperts is often lo w , although this can be improv ed by taking consensus of multiple sleep experts [2]. Automatic detection algorithms have been proposed to de- tect specific types of micro-events in sleep EEG. These typi- cally build on a band-pass filtering step within a certain fixed ∗ Contributed equally . This work was supported in part by the french Association Nationale de la Recherche et de la T echnologie (ANR T) under Grant 2015 / 1005 frequency band, for instance 11 − 16 Hz for the detection of spindles. Three types of methods can be distinguished. The first type relies on extracting the en velop of the filtered signal and performing a thresholding-like step with either a fixed or tunable threshold [7, 8, 9, 10, 11, 12]. It is primarily used for spindle detection. The main difference between these lies in the thresholding part which is either performed on the rec- tified filtered signal [12], or on the instantaneous amplitude obtained after an Hilbert-T ransform [11], on the root mean square of the filtered signal [10] or on the mo ving a verage of the rectified filtered signal [8]. This first type of methods can identify start and end times of e vents by looking at inflex- ion points of the env elop of the filtered signal [9]. Further- more, most of these approaches are specific to a sleep stage [12, 11, 10, 8, 7] and rely hea vily on preprocessing steps such as notch filtering around 50 Hz to remove the electrical cur- rent artefacts or general visual artefacts removal, impractical on large amounts of data. The second type of methods re- lies on decomposing the EEG into its oscillatory and tran- sient components. Then filtering and thresholding are used to detect events of interest [13, 14, 15]. These are more gen- eral methods since they can detect either sleep spindles or K- complex es and can work over entire sleep recordings indepen- dently of sleep stages. The third type of methods corresponds to machine learning methods and are more general. These filter the EEG signal, extract spectral and temporal features from a segment and predict with a binary SVM whether it is a spindle [16]. These methods all hav e significant limitations: (1) use of band-pass filtering with fixed cut-off frequencies that might not be adapted to some subjects (2) they are in- trinsically e vent specific (3) their hyper parameters are often optimized on the record used for ev aluating the performance, introducing an ov erfitting bias in reported results. A solution to these problems may be found in the adap- tation of recent computer vision algorithms developed in the context of object detection. Indeed, detecting e vents in multi- variate EEG signals consist in predicting time locations, dura- tion and types of events which is closely related to the object detection problem in computer vision where bounding boxes and objects categories are to be predicted. For this latter prob- lem, state-of-the-art methods make use of dedicated deep neu- ral networks architectures [17, 18, 19, 20]. In this paper , we introduce such a dedicated neural net- work architecture to detect any type of ev ent over the sleep EEG signal. The proposed approach b uilds on a conv olu- tional neural network which extracts high-le vel features from the raw input signal(s) for multiple default e vent locations. A localization module predicts an adjustment on start and end times for those default ev ent locations while a classification module predicts their labels. The whole network architec- ture is trained end-to-end by back-propagation. In this paper , we first present the general method and the architecture of the proposed neural network. W e then e valuate performance of the proposed approach versus the current state-of-the-art methods on 2 e vent detection tasks. Notation W e denote by J n K the set { 1 , . . . , n } for n ∈ N . Let X ∈ R C × T be the set of input signals, C is the number of EEG channels and T the number of time steps. Ł = J | L | K stands for labels of events where L is the number of dif ferent labels. 0 is the label associated to no e vent or background signal. An event e = t c , t d , l ∈ E = R 2 × Ł ∪ { 0 } is defined by a center location time t c , a duration t d and an e vent label (or type) l ∈ Ł. A true event is an event with label in Ł detected by a human scorer or a group of human scorers, a.k.a. gold standar d . A predicted e vent is an ev ent with label in Ł detected by an algorithm or a group of algorithms. 2. METHOD The detection procedure employed by our predictiv e system is illustrated in Figure 1 (with C=1). Let x ∈ X be an in- put EEG signal. First, default ev ents are generated over the input signal, e.g. 1 s ev ents e very 0.5 s if this corresponds to a typical duration of ev ents to be detected (cf. Figure 1- A). Positions, durations and overlaps of default e vents can be modified. Then, the network predicts for each default ev ent its adjusted center and duration, together with the label of the potential e vent (cf. Figure 1-B). Events with the high- est probabilities are selected, and non-maximum suppression is applied to remov e o verlapping predictions (cf. Figure 1-C). This is similar to the SSD [18] and Y OLO approaches [19] dev eloped in the conte xt of object detection. T raining this predictiv e system requires the following steps. First, default ev ents are generated over the input signal and matched to the true ev ents based on their Jaccard index, a.k.a. Intersection ov er Union (IoU) [19]. The network is trained to predict the centers and durations together with the labels of the ev ents. Default e vents which do not match a true event with a suf fi- cient IoU are assigned the label l = 0 . T o address the issue of label imbalance between real ev ents and events with label l = 0 , subsampling is used so that only a fraction of events with label l = 0 is used for training. A B C i i + 1 i i + 1 Fig. 1 . Proposed approach prediction procedure inspired by SSD [18]: A: default events are generated over the input sig- nals. B: the network predicts refined locations of any default ev ent and its label included the label no event: 0 . C: non- suppression maximum is applied to merge ov erlapping e vents with label different from 0 . The network finally returns the locations of the merged e vents and their labels In order to learn a system to achieve the prediction task just described with back-propagation, one needs to design a fully dif ferentiable architecture. The aim is to learn a function ˆ f from X to Y where y ∈ Y is a set of elements from E . Let N d be the number of default e vents generated over the input signal x ∈ X . It is also the number of adjusted events pre- dicted by the network. Let D ( x ) = d i = ( t c i , t d i ) , i ∈ J N d K be the set of centers and durations of the N d default ev ents generated over x . Let E ( x ) = e j = ( t c j , t d j , l j ) : j ∈ J N e K be the list of the N e true ev ents annotated over the signal x . Default ev ents which match a true e vent are selected to train the localization and classification capacities of the system. The IoU( d i , e j ) ∈ [0 , 1] is computed between each default ev ent d i ∈ D ( x ) and each true event from e j ∈ E ( x ) . Let η > 0 , d i matches e j if IoU( d i , e j ) ≥ η . If multiple true ev ents match the same default e vent d i , the true ev ent which exhibits the highest IoU with d i is selected. W e introduce the function γ which returns, if it exists, the index of the true ev ent matching with the default e vent d i , and ∅ otherwise: γ ( i ) = arg max j ∈ J N e K IoU( d i ,e j ) ≥ η IoU( d i , e j ) ∈ J N e K ∪ {∅} Let d i be a default ev ent matching with the true event e j . d i ’ s center and duration are then encoded with φ e j : R 2 − → R 2 , d i = ( t c i , t d i ) 7− → t c j − t c i t d i , log t d j t d i ! [20]. This encoding function quantifies the relati ve v ariations in centers and dura- tions between the default event d i and the true e vent e j , and represents the quantities the network actually predicts. Let ˆ f ( x ) ∈ Y be the prediction made by model ˆ f ov er x . W e define it as ˆ f ( x ) = { ( ˆ t c i , ˆ t d i , ˆ l i ) ∈ E , i ∈ J N d K } . ˆ τ i = ( ˆ t c i , ˆ t d i ) are the predicted coordinates of encoded default event d i and ˆ l i is its predicted label. In practice, the model will output the probability of each label l ∈ Ł ∪ { 0 } for default e vent d i so ˆ l i is replaced by ˆ π i ∈ [0 , 1] | Ł | +1 . As it is a probability vector , we hav e P l ∈ Ł ∪{ 0 } ˆ π l i = 1 . The loss between the true annotation E ( x ) and the model prediction ˆ f ( x ) ov er signal x is a function ` : Y × Y → R + defined as ` E ( x ) , ˆ f ( x ) = ` + norm + ` − norm where ` + = X i ∈ J N d K γ ( i ) 6 = ∅ L1 smooth φ e γ ( i ) ( d i ) , ˆ τ i − log( ˆ π l γ ( i ) i ) (1) ` − = − X i ∈ J N d K ∀ j ∈ J N e K :IoU( d i ,e j ) <η log( ˆ π 0 i ) (2) ` + norm (resp. ` − norm ) is obtained by dividing ` + (resp. ` − ) by the number of terms in the sum (1) (resp. (2)). In (1), we sum the localization and classification loss for an y default ev ent d i matching a true event e γ ( i ) . The L1 smooth loss applies coordinate-wise the real valued function: x 7→ ( x 2 / 2) 1 | x | < 1 + ( | x | − 1 / 2) 1 | x |≥ 1 [20]. Equation (2) stands for the classification loss of default boxes which do not ma tch any true event. Subsampling has been ommitted in (2) for simplicity . In practice, we use a 1 / 3 ratio between default ev ents matching true e vents and those not matching a true ev ent, selecting those with the worst classification scores. In the end, the learning problem consists in solving the following minimization problem to obtain e vent detector ˆ f : ˆ f ∈ arg min f ∈F E x ∈X [ ` ( E ( x ) , f ( x ))] (3) In order to specify what is the function class F , one needs to detail the netw ork architecture. W e consider a general con- volutional network that, gi ven a set of default ev ents D ( x ) = { d i = (2 8 · ( i − 0 . 5) /ρ, t d i ) : i ∈ J N d K } , predicts N d ev ents, where N d = T · ρ/ 2 8 and ρ ∈ N is an o verlapping f actor . The network is composed of 3 parts, see T able 1. The first part, called Block 0, performs a spatial filtering in order to increase the Signal to Noise Ratio (SNR) by re- combining the original EEG channels into virtual channels using a 2D spatial con volution [21]. It takes as input a tensor x ∈ X and outputs a new tensor x 0 ∈ X . Channels of x 0 are obtained by linear combination of the channels of x . It can be seen as a 2D conv olution with C kernel of size (C, 1), a stride of 1 and a linear acti vation. It is follo wed by a transpo- sition to permute the channel and spatial dimensions in order to recov er a tensor x 0 ∈ X . If C = 1 , this block is skipped. The second part, composed of Block k , for k ∈ J 8 K , per- forms feature extraction ov er x 0 in the time domain. Each block is composed of a 2D con volution layer with batch nor- malization [22] and ReLU activ ation x 7→ max( x, 0) [23], followed by a temporal max-pooling. Block k first con volves the previous feature maps x k − 1 with 4 × 2 k kernels of size (1 , 3) (space, time), using a stride of 1 . Zero padding is used to maintain the dimension of the tensor through the con vo- lution layer . Then, the ReLU activ ation is applied. Finally a temporal max pooling operation with kernel of size (1 , 2) and stride 2 is applied to di vide by 2 the temporal dimension. Each Block k does not process the spatial dimension. The third part, Block 9 takes as input a tensor x 8 ∈ R 1024 × C × T / 2 8 , and for each default event i ∈ J N d K , it pre- dicts the event label and its encoded center and duration. Block 9 has two layers: a classification layer 9-a and a local- ization layer 9-b. Layer 9-a conv olves the last feature maps with ( | Ł | + 1) × ρ kernels of size ( C, 3) (stride of 1 ). A softmax operation is applied along the channel dimension on ev ery set of ( | Ł | + 1) channels so that, for each default ev ent d i , one obtains the probability ˆ π l i of the corresponding e vent i to belong to any of the classes l ∈ Ł ∪ { 0 } . Similarly , layer 9-b conv olves the last feature maps x 8 with 2 × ρ kernels of size ( C , 3) and stride 1 . This giv es the predicted coordinates ˆ τ i = ( ˆ t c i , ˆ t d i ) of an y encoded default ev ent i ∈ J N d K . 3. EXPERIMENTS Data The e xperiments were performed on MASS SS2 [24]: 19 records from 19 subjects (11 females, 8 males, ∼ 23.6 ± 3.7 years old), sampled at 256 Hz. The spindles have been scored by expert E1 (resp. E2) ov er 19 records (resp. 15 ) using different guidelines [14] resulting in ∼ 550 (resp. ∼ 1100 ) scored spindles per record. For records scored by both E1 and E2 ∼ 500 spindles per record exhibit IoU > 0 (Gaussian-like distribution, pic at 0.6). The 15 records annotated by E1 and E2 were used for spindles detection benchmark. For K-complex detection, and joint spindle and K-complex detection, the 19 records scored by E1 were used. Cross validation A 5 split cross validation was used. A split stands for 10 training, 2 validation and 3 (resp. 4 ) test- ing records for spindle detection (resp. K-complex and joint spindle and K-complex detection). Metrics By event metrics [2] were used to quantify the de- tection and localization performances of detectors. They rely on an IoU criterion: for a given δ > 0 , a predicted ev ent was considered as a true positive if it exhibited an IoU ≥ δ with a true ev ent otherwise it was considered as a false positiv e. Layer Layer T ype # kernels output dimension activ ation kernel size stride 1 Con volution 2D C (C, 1, T) linear (C, 1) 1 Block 0 2 T ranspose - (1, C, T) - - k-a Con volution 2D 4 × 2 k (4 × 2 k , C, T / 2 k − 1 ) ReLU (1, 3) 1 Block k for k ∈ J 8 K k-b Max Pooling 2D - (4 × 2 k , C, T / 2 k ) - (1, 2) 2 9-a Con volution 2D ( | Ł | + 1) × ρ ( | Ł | + 1) × ρ, 1 , T / 2 8 ) softmax (channel dimension) (C, 3) 1 Block 9 9-b Con volution 2D 2 × ρ (2 × ρ, 1 , T / 2 8 ) linear (C, 3) 1 T able 1 . Model architecture: Block 0 performs spatial filtering and outputs a tensor x 0 ∈ X . Block k , k ∈ J 8 K , extracts temporal features and outputs a tensor x k ∈ R (4 × 2 k ) × C × T / 2 k . Block 9-a performs the classification of any potential e vent i ∈ J N d K and Block 9-b predicts the encoded center and duration of this e vent. Each conv olution is follo wed by a zero padding layer and batch normalization. Note that the batch dimension is omitted. W e have ρ = N d / ( T / 2 8 ) . The numbers of positiv es and true positiv es were ev aluated to compute the precision, the recall and the F1 scores of de- tectors. Evaluation was performed on entire testing records. Performances reported were av eraged over testing records. Baselines For spindles detection, 8 baselines were bench- marked: F errar elli et al. 2007 [12], M ¨ olle et al. 2011 [10], Nir et al. 2011 [11], W amsle y et al. 2012 [8], Ray et al. 2015 [7] (Python package https://github.com/ wonambi- python/wonambi ), W endt et al. 2012 [9], P ar ekh et al. 2017 [13] and Lajnef et al. 2017 [14]. W e used the implementations by the authors of [2, 13, 14]. For K-complex detection, Lajnef et al. 2017 [14] was compared. Signal from C3 channel was used by all the baselines ex- cept P ar ekh et al. 2017 which used: F3, F4, Fz, C3, C4, Cz channels. Hyper -parameters of P arekh et al. 2017 and La- jnef et al. 2017 were selected in the ranges provided by the authors of [13, 14] by grid search on the validation data. Proposed approach The proposed approach was bench- marked on signal from channel C3. The network was provided with 20 s samples x ∈ R C × T with C = 1 and T = 5120 ( 256 H z sampling). A normalization was applied to x : centering and standardization by di viding each centered signal by its standard deviation computed on the full record. The approach was implemented with PyT orch library [25]. Minimizing (3) was achie ved with stochastic gradient descent using a learning rate lr = 10 − 3 , a momentum µ = 0 . 9 and a batch size of 32 . 100 training epochs were considered. Each sample was randomly selected to contain at least a true e vent. When a true e vent was partially included in a sample, its label l was set to 0 if less than 50% of this ev ent was part of that sample. Early stopping was used to stop the training process when no improvement was observ ed on the loss ev aluated on validation data after 5 consecutiv e epochs. Matching hyper-parameter η was fixed to η = 0 . 5 . De- fault ev ent hyper-parameters were fixed to: ρ = 4 , N d = 80 , t d i = 256 . The resulting set D ( x ) = { (64 · i − 32 , 256) : i ∈ J N d K } seemed a reasonable choice gi ven the f act that both spindles and K-complexes hav e ∼ 1 s duration. A potential ev ent i was considered as a positi ve ev ent of label l ∈ Ł if ˆ π l i ≥ θ l . Hyper parameter θ l was selected by grid search o ver the validation data. Spindles Detectors were compared to 4 gold standards: ev ents scored by E1, E2, the union and the intersection of ev ents scored by both E1 and E2, see Figure 2. First, the proposed approach seems to detect the occur- rence of spindles without any supplementary information re- garding the sleep stages b ut also to localize the spindles accu- rately . Indeed, the proposed approach outperforms the base- lines in terms of precision / recall at IoU = 0 . 3 and exhibits an higher F1 than the baselines for any IoU . Second, the pro- posed approach seems to take into account any considered gold standard. Indeed, it exhibits stable performances over the gold standards contrarily to most of the baselines, except P ar ekh et al. 2017 and Lajnef et al. 2017 . K-complexes Performances are reported in Figure 3. The proposed approach seems to outperform the baseline in terms of precision / recall at IoU = 0 . 3 and exhibits a higher F1 score than the compared baseline at any IoU. Detecting events jointly or separately The proposed ap- proach was trained to detect both spindle and K-complex jointly and separately . Performances are reported in Figure 4. Same performances are obtained when the method is trained to detect spindles and K-complex es jointly or separately . 4. DISCUSSION The proposed approach b uilds on deep learning to learn a fea- ture representation relev ant for detecting any type of event. Surprisingly enough, the approach handles well the task of de- tecting spindles and K-complexes using only 10 training and 0.0 0.2 0.4 0.6 0.8 1.0 Recall 0.0 0.2 0.4 0.6 0.8 1.0 Precision Gold standard : E1 IoU = 0.3 0.0 0.2 0.4 0.6 0.8 1.0 IoU 0.0 0.2 0.4 0.6 0.8 1.0 F1 0.0 0.2 0.4 0.6 0.8 1.0 Recall 0.0 0.2 0.4 0.6 0.8 1.0 Gold standard : E2 IoU = 0.3 0.0 0.2 0.4 0.6 0.8 1.0 IoU 0.0 0.2 0.4 0.6 0.8 1.0 0.0 0.2 0.4 0.6 0.8 1.0 Recall 0.0 0.2 0.4 0.6 0.8 1.0 Gold standard : union IoU = 0.3 0.0 0.2 0.4 0.6 0.8 1.0 IoU 0.0 0.2 0.4 0.6 0.8 1.0 0.0 0.2 0.4 0.6 0.8 1.0 Recall 0.0 0.2 0.4 0.6 0.8 1.0 Gold standard : intersection IoU = 0.3 0.0 0.2 0.4 0.6 0.8 1.0 IoU 0.0 0.2 0.4 0.6 0.8 1.0 Ferrarelli et al. 2007 Mölle et al. 2011 Nir et al. 2011 Wamsley et al. 2012 Wendt et al. 2012 Ray et al. 2015 Lajnef et al. 2017 Parekh et al. 2017 Proposed approach Fig. 2 . Spindle detection: benchmark with respect to 4 gold standards: the proposed approach outperforms the baselines. First row: averaged precision / recall at IoU = 0 . 3 . Second row: F1 score as a function of IoU 0.0 0.2 0.4 0.6 0.8 1.0 Recall 0.0 0.2 0.4 0.6 0.8 1.0 Precision A 0.0 0.2 0.4 0.6 0.8 1.0 IoU 0.0 0.2 0.4 0.6 0.8 1.0 F1 B Proposed approach Lajnef et al. 2017 Fig. 3 . K complex detection. A: precision / recall at IoU = 0 . 3 . B: F1 score as a function of IoU. 0.0 0.2 0.4 0.6 0.8 1.0 Recall 0.0 0.2 0.4 0.6 0.8 1.0 Precision A 0.0 0.2 0.4 0.6 0.8 1.0 IoU 0.0 0.2 0.4 0.6 0.8 1.0 F1 B Training jointly spindles K-complexes Training separately spindles K-complexes Training separately spindles K-complexes Fig. 4 . Detecting spindles and K-complexes jointly or sepa- rately leads to similar performances. A: Precision / Recall of detectors at IoU = 0.3. B: F1 scores as a function of IoU. 2 validation records. W e performed additional experiments (not shown) to vary the number of training records from 1 to 10 : the method works when only 1 training record is av ail- able. This might be due to random sampling which performs a kind of data augmentation. As the proposed approach can handle multiple channels, additional experiments on spindles / K-complex detection were run using multiple channels: F3, F4, C3, C4, O1, O2. This did not result in any significant gain of performance on the used dataset (not sho wn). The method can also handle multiple modalities, electromyography (EMG), electroocu- lography (EOG) or breathing, and mutiple def ault e vent scales at the same time, a property that was not explored in this study but that may be critical for detecting other types of e vents. This will be addressed in future studies. The proposed approach seems to perform quite well with respect to different gold standards. Y et it remains to study how the method performs compared to the inter-scorer agree- ment [2]. This shall be also addressed in future works. 5. CONCLUSION This paper introduces a new deep learning architecture that can perform ev ent detection of any type over an entire night of EEG recording. The proposed approach learns by back- propagation to build a feature representation from the raw input signal(s), and to predict both locations, durations and types of ev ents. Numerical experiments on spindles and K- complex es detection demonstrate that the proposed approach outperforms pre viously published detection methods. A ma- jor advantage of the proposed approach is that it can detect jointly multiple types of ev ents. 6. REFERENCES [1] C. Iber, S. Ancoli-Israel, A. Chesson et al. , The AASM Manual for the Scoring of Sleep and Associated Events: Rules, T erminolo gy and T echnical Sp e cifica- tions . American Academy of Sleep Medicine, 2007. [2] S. C. W arby , S. L. W endt, P . W elinder et al. , “Sleep spindle detection: crowdsourcing and ev aluating per- formance of experts, non-experts, and automated meth- ods, ” Natur e methods , v ol. 11, no. 4, pp. 385–392, 2014. [3] S. M. Purcell, D. S. Manoach, C. Demanuele et al. , “Characterizing sleep spindles in 11,630 indi viduals from the National Sleep Research Resource, ” Nature Communications , vol. 8, p. 15930, jun 2017. [4] J. B. Stephansen, A. Ambati, E. B. Leary et al. , “The use of neural networks in the analysis of sleep stages and the diagnosis of narcolepsy , ” , 2017. [5] D. S. Manoach, J. Q. Pan, S. M. Purcell et al. , “Reduced sleep spindles in schizophrenia: A treatable endopheno- type that links risk genes to impaired cognition?” Bio- logical psyc hiatry , v ol. 80, no. 8, pp. 599–608, oct 2016. [6] E. S. Musiek, D. D. Xiong, and D. M. Holtzman, “Sleep, circadian rhythms, and the pathogenesis of Alzheimer Disease, ” Exp Mol Med , vol. 47, no. 3, mar 2015. [7] L. B. Ray , S. Sockeel, M. Soon et al. , “Expert and crowd-sourced validation of an individualized sleep spindle detection method employing complex demod- ulation and individualized normalization, ” F r ontiers in Human Neur oscience , vol. 9, p. 507, sep 2015. [8] E. J. W amsley , M. A. T ucker , A. K. Shinn et al. , “Reduced sleep spindles and spindle coherence in schizophrenia: Mechanisms of impaired memory con- solidation?” Biological psychiatry , v ol. 71, no. 2, pp. 154–161, jan 2012. [9] S. L. W endt, J. A. E. Christensen, J. K empfner et al. , “V alidation of a nov el automatic sleep spindle detector with high performance during sleep in middle aged sub- jects, ” in Pr oc. IEEE EMBC , 2012, pp. 4250–4253. [10] M. M ¨ olle, T . O. Ber gmann, L. Marshall et al. , “Fast and Slow Spindles during the Sleep Slow Oscillation: Dis- parate Coalescence and Engagement in Memory Pro- cessing, ” Sleep , vol. 34, no. 10, pp. 1411–1421, 2011. [11] Y . Nir, R. Staba, T . Andrillon et al. , “Regional Slo w W av es and Spindles in Human Sleep, ” Neur on , vol. 70, no. 1, pp. 153–169, apr 2011. [12] F . Ferrarelli, R. Huber , M. J. Peterson et al. , “Reduced sleep spindle acti vity in schizophrenia patients, ” Am J Psychiatry , v ol. 164, no. 3, pp. 483–492, 2007. [13] A. Parekh, I. W . Selesnick, R. S. Osorio et al. , “Mul- tichannel sleep spindle detection using sparse low-rank optimization, ” J. Neur osci. Methods , v ol. 288, pp. 1–16, 2017. [14] T . Lajnef, C. O’Reilly , E. Combrisson et al. , “Meet Spinky: An Open-Source Spindle and K-Complex De- tection T oolbox V alidated on the Open-Access Montreal Archiv e of Sleep Studies (MASS), ” F r ontiers in Neu- r oinformatics , vol. 11, p. 15, mar 2017. [15] A. Parekh, I. W . Selesnick, D. M. Rapoport et al. , “De- tection of K-complexes and sleep spindles (DETOKS) using sparse optimization, ” J . Neur osci. Methods , vol. 251, pp. 37–46, 2015. [16] D. Lachner-Piza, N. Epitashvili, A. Schulze-Bonhage et al. , “A single channel sleep-spindle detector based on multiv ariate classification of EEG epochs: MUSSDET , ” J. Neur osci. Methods , vol. 297, pp. 31–43, 2018. [17] T . Lin, P . Goyal, R. B. Girshick et al. , “F ocal loss for dense object detection, ” , Aug. 2017. [18] W . Liu, D. Anguelov , D. Erhan et al. , “SSD: single shot multibox detector , ” , Dec. 2015. [19] J. Redmon, S. Di vvala, R. Girshick et al. , “Y ou Only Look Once: Unified, Real-Time Object Detection, ” in Pr oc. CVPR , 2016, pp. 779–788. [20] S. Ren, K. He, R. Girshick et al. , “Faster R-CNN: T o- wards real-time object detection with re gion proposal networks, ” in Pr oc. NIPS , 2015, pp. 91–99. [21] S. Chambon, M. N. Galtier , P . J. Arnal et al. , “A Deep Learning Architecture for T emporal Sleep Stage Clas- sification Using Multiv ariate and Multimodal T ime Se- ries, ” IEEE T rans Neural Syst Rehabil Eng , vol. 26, no. 4, pp. 758–769, 2018. [22] S. Iof fe and C. Sze gedy , “Batch normalization: Acceler- ating deep netw ork training by reducing internal co vari- ate shift, ” in Pr oc. ICML , 2015, pp. 448–456. [23] V . Nair and G. E. Hinton, “Rectified Linear Units Im- prov e Restricted Boltzmann Machines, ” in Pr oc. ICML , 2010, pp. 807–814. [24] C. O’Reilly , N. Gosselin, J. Carrier et al. , “Montreal Archiv e of Sleep Studies: an openaccess resource for instrument benchmarking and exploratory research, ” J Sleep Res , vol. 23, no. 6, pp. 628–635, jun 2014. [25] A. Paszke, S. Gross, S. Chintala et al. , “ Automatic dif- ferentiation in PyT orch, ” in NIPS W orkshop , 2017.
Original Paper
Loading high-quality paper...
Comments & Academic Discussion
Loading comments...
Leave a Comment