Denoising Auto-encoder with Recurrent Skip Connections and Residual Regression for Music Source Separation
Convolutional neural networks with skip connections have shown good performance in music source separation. In this work, we propose a denoising Auto-encoder with Recurrent skip Connections (ARC). We use 1D convolution along the temporal axis of the …
Authors: Jen-Yu Liu, Yi-Hsuan Yang
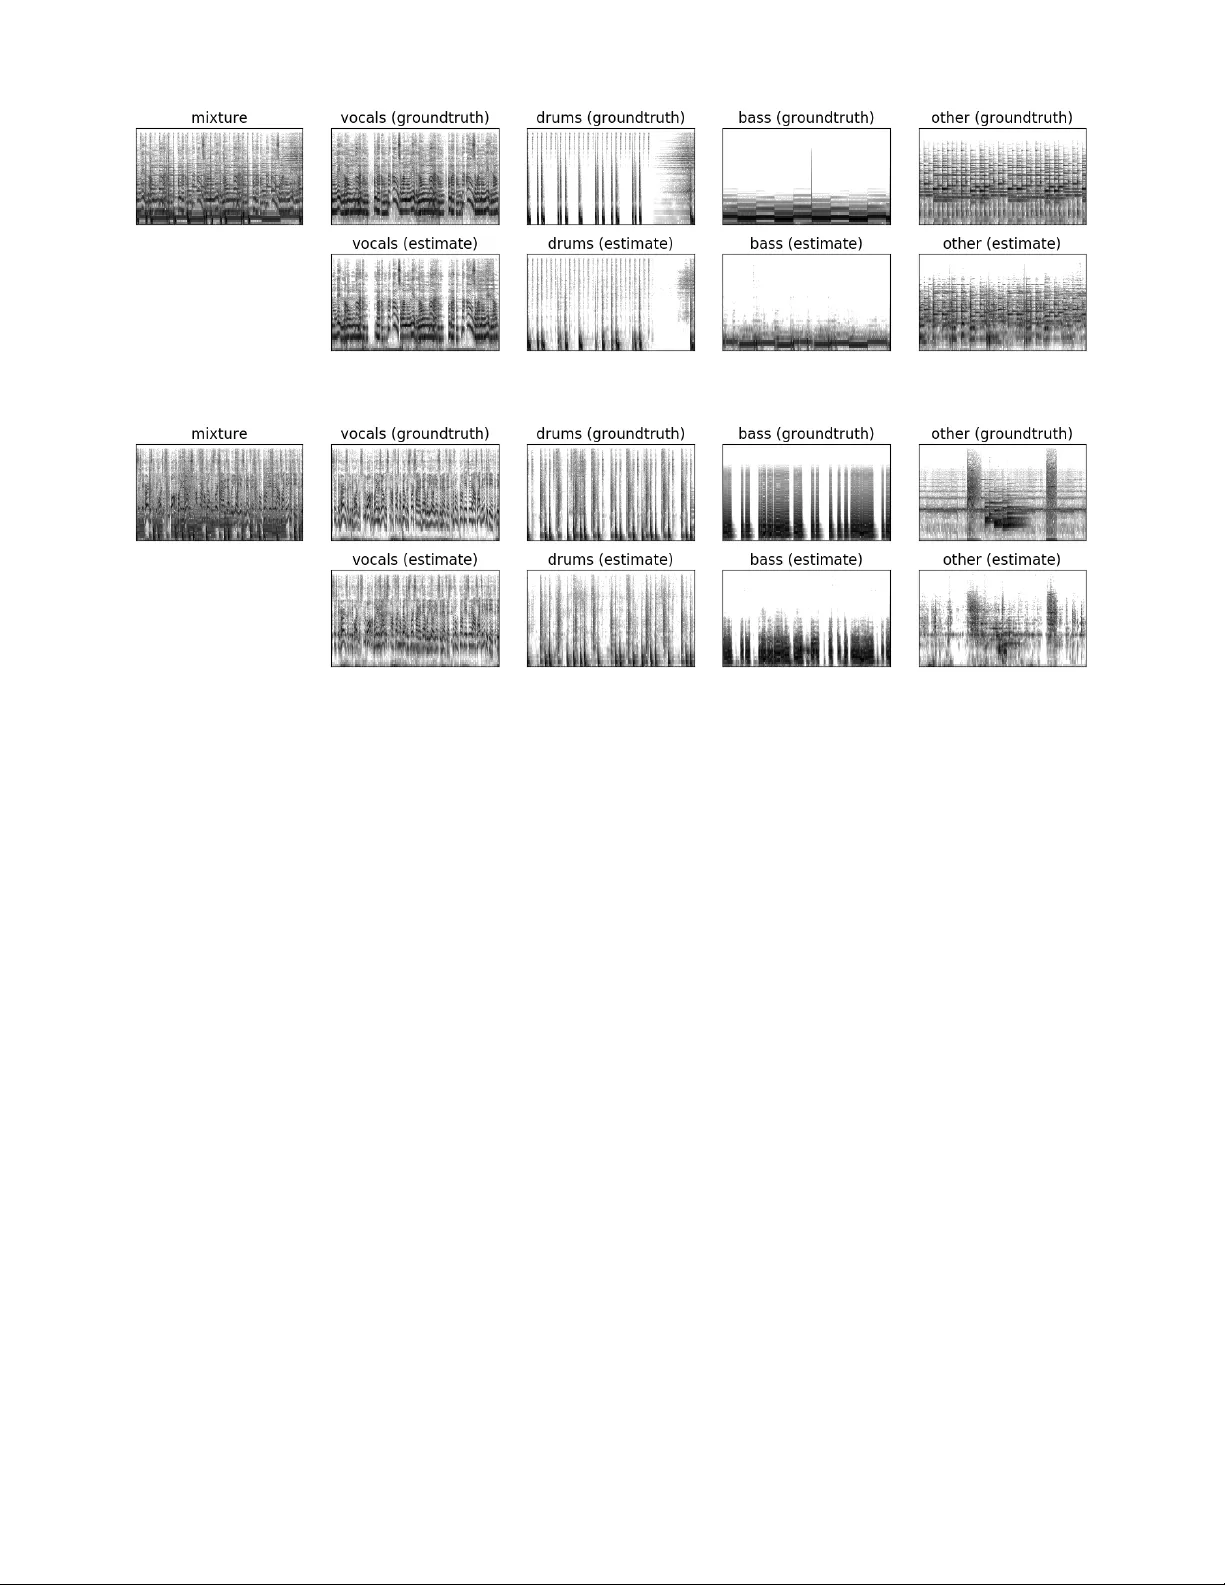
Denoising Auto-encoder with Recurrent Skip Connections and Residual Re gression for Music Source Separation Jen-Y u Liu Resear ch Center for IT Innovation Academia Sinica T aipei, T aiwan ciaua@citi.sinica.edu.tw Y i-Hsuan Y ang Resear ch Center for IT Innovation Academia Sinica T aipei, T aiwan yang@citi.sinica.edu.tw Abstract —Con volutional neural networks with skip connec- tions hav e shown good perf ormance in music source separa- tion. In this work, we pr opose a denoising A uto-encoder with Recurrent skip Connections (ARC). W e use 1D con volution along the temporal axis of the time-frequency feature map in all layers of the fully-convolutional network. The use of 1D con volution makes it possible to apply recurrent lay ers to the intermediate outputs of the con volution layers. In addition, we also pr opose an enhancement network and a residual regression method to further impr ove the separation result. The recurrent skip connections, the enhancement module, and the residual regr ession all improve the separation quality . The ARC model with residual regr ession achieves 5.74 siganl-to-distoration ratio (SDR) in vocals with MUSDB in SiSEC 2018. W e also evaluate the ARC model alone on the older dataset DSD100 (used in SiSEC 2016) and it achieves 5.91 SDR in vocals. Index T erms —Music source separation, recurrent neural net- work, skip connections, residual regression I . I N T RO D U C T I O N Music source separation aims at separating music sources such as vocals, drums, strings, or accompaniment from the original song. It can facilitate tasks that require clean sound sources, such as music remixing and karaoke [1]. In this work, we introduce a new model that uses denoising auto-encoder with symmetric skip connections for music source separation. Symmetric skip connections have been used for biomedical image segmentation [2] and singing voice separation [3]. Our model is different in that it uses 1D con volutions instead of 2D con volutions. Using 1D conv olutions has the benefit that we can use recurrent layers right after the con volution layers. Furthermore, an enhancement module and a residual regression method are introduced in addition to the separation module. I I . P RO P O S E D M O D E L S In this section, we introduce the separation model, the enhancement model, and residual regression. A. Separation model The separation model is a fully-con v olutional network (FCN) [4], [5]. All the con volution layers use 1D con v olution. W e call Fig. 1: Diagram of the proposed separation model, ARC. Each tuple in the figure represents (output channels, filter size, stride) of the corresponding conv olution layer . An STFT window size 2,048 is used and a spectrogram is symmetric in the frequency dimension, so the ef fectiv e dimension of a spectrogram is (2 , 048 / 2 + 1) = 1025 . T is the number of temporal frames. it the ARC model, for it is in principal a denoising a uto-encoder with recurrent skip connections. CNN with symmetric skip connections had been used for singing voice separation by Jansson et al. [3]. They used 2D con volutions in their conv olutional neural networks (CNNs). The output tensor of a 2D con volution layer is of the shape (channels, frequency bins, temporal points). If we want to apply recurrent layers to this tensor, the dimension of frequency bins will pose some problems. In our model, the conv olution layers use 1D con volutions, namely doing con volutions along the temporal axis [6], [7]. The output tensor of an 1D con volution layer takes the shape (channels, temporal points). This allows us to directly apply recurrent layers to the con volution output tensors. The proposed architecture is presented in Fig. 1. It contains Fig. 2: Diagram of the proposed enhancement model. Each tuple in the figure represents (output channels, filter size, stride) of the corresponding conv olution layer . six con volution layers and two skip connections. The two skip connections are processed by gated recurrent unit (GRU) layers [8], [9]. W e use weight normalization [10] instead of batch normalization [11] in each conv olution layer . Leaky rectified linear units (Leaky ReLUs) with 0.01 slope [12] are applied to all the conv olution and transposed conv olution layers. The model takes a spectrogram of a song clip as the input. An input is also referred to as a mixture because it contains the sources such as vocals, bass, drums, and other sounds. The input to the model is log (1 + mixture spectrogram ) , and the training target is the source spectrograms, that is, the concatenation of log (1 + source 1 ) , log (1 + source 2 ) , ..., log (1 + source S ) , where S denotes the number of sources. This model can be seen as a denoising auto-encoder because, for one target source, the other sources can be seen as noises in the mixture signal. In our pilot experiments, we also tried to apply a softmax function to the output layer so that the network predicts masks for different sources and enforces the condition that the summation of the predicted source spectrograms is equal to the mixture spectrogram. W e found that this setting largely speeds up the training process, but the result becomes much worse. Therefore, we decided to use a leakly ReLU as the nonlinearity function to the output layer to directly estimate the source spectrograms. B. Enhancement model The separation model is in charge of the task of music source separation. The small noises could be ignored in the training process because the losses introduced by other sources could be much larger than the losses introduced by the smaller artifacts. But, we human beings are very sensitive to those smaller artifacts, especially in vocals. In order to reduce these small artifacts, we introduce an extra enhancement model as a post-processing module. The enhancement model is another denoising auto-encoder that Fig. 3: Illustration of residual regression. In iteration i , the separation model also takes the output i − 1 as the input. The total output of iteration i is the sum of the total output of iteration i − 1 and the output of the separation model. Therefore, the separation model only has to estimate the residual. takes the output of a separation model (i.e. the ARC) as its input, and estimates an enhanced version of the separation result. Each source has its own enhancement model, and the training target is that specific source spectrogram. The architecture is shown in Fig. 2. It is similar to ARC but the skip connections are implemented as con v olution layers for simplicity . In the training process of the enhancement model, the parameters of a separation model are fixed. C. Residual r e gr ession Residual regression is also used to improve the separation result. Unlike the enhancement model, the model with residual regression uses the separation model itself to further improve the separation result. The process of residual regression is depicted in Fig. 3. The separation model in Fig. 3 is similar to the one introduced in Section II-A . The difference is that the separation model takes another input feature map (the left arrow below the separation model) that is the output from the previous iteration. In iteration i , the separation model takes both the output i − 1 and the mixture feature map as the input. For the iteration 1, the output 0 is set to an all-zero tensor with the same shape as the mixture feature map. The total output of iteration i is the output of the separation model plus the total output of iteration i − 1 . In this way , the separation model will only estimate the residual of the target sources. In the training process, the total loss is the av erage of the losses from all the iterations. I I I . E V A L UAT I O N The ev aluation is conducted by using the official dataset MUSDB (100 songs for training and 50 songs for testing) and the official packages 1 from SiSEC2018 [13]. The models are implemented with PyT orch. 2 W e will report the ev aluation result in terms of signal-to-distortion ratio (SDR) [14], as it is the most widely used metric in literature [13], [15], [16] 1 https://github .com/sigsep/sigsep- mus- ev al and https://github.com/sigsep/ sigsep- mus- 2018- analysis 2 https://pytorch.org/ T ABLE I: Performance (in SDR) for MUSDB in SiSEC 2018 SiSEC ID Skip connections Enhancement Residual fegression vocals drums bass other accompaniment JY1 1 GRU layer No No 5.57 4.60 3.18 3.45 11.81 JY2 1 GRU layer Y es No 5.69 4.76 3.58 3.70 11.90 JY3 1 GRU layer No Y es (3 iterations) 5.74 4.66 3.67 3.40 12.08 A. T raining pr ocess The training dataset is MUSDB. 3 It contains 100 songs, each of which has four sources: drums, bass, other , and vocals. W e randomly choose 90 songs as the training set and 10 songs as the v alidation set. The validation set is used for early stopping. Each song is divided into 5-second sub-clips. The short-time Fourier transform (STFT) is applied to the sub-clips for feature extraction. The native sampling rate 44,100 is used with a window size 2,048 and a hop size 1,024. Uhlich et al. [15] showed that data augmentation is crucial to compensate for the scarcity of training data in music source separation. W e conduct the online data augmentation to increase the number of training data as follows. Assume we have N 5-second sub-clips. First, we randomly choose one sub-clip from the N sub-clips for each source. Note that the sub-clip chosen for one source could be different from the sub-clip chosen for another source. The four sub-clips from the four sources are summed, leading to the mixture of one training instance. Then, we use the spectrogram of this mixture as the input and use the concatenated spectrograms of the four source sub-clips as the training target. W e use mean square error (MSE) as the loss function for updating the network. Assume that the mini-batch size is B , and there are S sources, T temporal points, and F frequency bins. Then, the loss function is ( P B b =1 P S s =1 P T t =1 P F f =1 | P b,s,t,f − log (1 + G b,s,t,f ) | 2 ) / ( B S T F ) , where P b,s,t,f is the prediction and G b,s,t,f is the target source spectrogram. W e use Adam [17] and a mini-batch of 10 instances to train the models. The initial learning rate is set to 0.001 for the con volution layers, and it is set to 0.0001 for the GRU layers. W e found that using 0.001 learning rate often lead to gradient explosion for the GR U layers, while the training process was stable when we used 0.0001 for the GR U layers. B. T esting process In the testing phase, an entire song is processed at once. Because we adopt a FCN design, our model can deal with songs of abitrary length. Multi-channel W iener filter is used for post-processing [14], [15]. W e use the phases of the mixture to con vert the estimated source spectrograms into wav eforms via the in verse STFT . W e use the sum of the estimates of the four sources as the estimate of the accompaniment (‘accomp. ’). C. Result In this subsection, we show the performance of our submis- sions to SiSEC2018. The result is shown in T ABLE I. In the model with residual regression (JY3), we run three iterations. W e can see from this table that JY2 (using enhancement model) 3 https://sigsep.github .io/datasets/musdb .html#tools Fig. 4: Result (in SDR for vocals) for submissions of SiSEC 2018. This figure shows the best supervised model from each author group without using additional training data. and JY3 (using residual re gression) improv es o ver JY1 in almost all sources. Fig. 4 display the SiSEC 2018 results of the models using supervised approaches without using additional training data, sho wing the best model of each author group. 4 Statistically the result of JY3 in vocals is not significantly dif ferent from that of the other two leading models T AK1 5 [18], [19] and UHL2 6 [15], according to the official SiSEC2018 report [13]. D. Effect of differ ent skip connections W e compare different skip connections in this subsection. The four compared architectures are shown in Fig. 5, and the result is shown in T ABLE II. W e can see that the models with skip connections outperform the one without skip connections, and the model with recurrent skip connections outperforms the one with con volution skip connections. 4 This figure is generated with a modified v ersion of the code provided by the or ganizers https://github .com/sigsep/sigsep- mus- 2018- analysis. W e specify “not using additional training data” here, because some submissions did use additional training data (not by data augmentation but by actually including more songs with clean sources for training. 5 https://github .com/sigsep/sigsep- mus- 2018/blob/master/submissions/ T AK1/description.md 6 https://github .com/sigsep/sigsep- mus- 2018/blob/master/submissions/ UHL2/description.md (a) No skip connections (b) Identity skip connections (c) Conv olution skip connections (d) Recurrent skip connections (ARC) Fig. 5: Different skip connections T ABLE II: Comparison of different skip connections (in SDR) for MUSDB in SiSEC 2018 Skip connections vocals drums bass other accomp. None 4.41 4.48 3.43 2.91 10.74 Direct (identity) 5.05 4.65 3.41 3.02 11.25 1 Conv olution layer 5.03 4.78 3.37 2.80 11.39 1 GRU layer (JY1) 5.57 4.60 3.18 3.45 11.81 E. Applying r ecurr ent layers at differ ent locations The recurrent layers could be applied at different locations of the separation model. W e tested sev eral possibilities, and many of them improves ov er the non-recurrent versions. For example, another possible way of using recurrent layers is shown in Fig. 6b and its performance is shown in T ABLE III. Among these variants, we found that applying the recurrent layers to the skip connections is the most effecti ve one. T ABLE III: Recurrence at dif ferent layers (in SDR) for MUSDB in SiSEC 2018 Where to use recurrent layers vocals drums bass other accomp. Skip connections (JY1) 5.57 4.60 3.18 3.45 11.81 After TConv4 output 5.36 4.38 3.53 3.66 11.91 F . Batch normalization VS W eight normalization W e have found that the separated audios subjecti vely sound less noisy using weight normalization [10] in conv olution layers than the separated audios using batch normalization [11] after con volution layers. Howe ver , the objectiv e ev aluation with SDR suggests that their results are very close in vocals and the one with batch normalization is ev en better in the other sources, as shown in T ABLE IV. (a) Recurrent skip connections (ARC) (b) Pre-output recurrent layer Fig. 6: Recurrent layers at different locations. The yello w arrows indicate recurrent layers. T ABLE IV: Batch normalization VS W eight normalization (in SDR) for MUSDB in SiSEC 2018 Normalization v ocals drums bass other accomp. W eight norm (JY1) 5.57 4.60 3.18 3.45 11.81 Batch norm 5.56 4.92 3.63 3.57 11.98 G. Qualitative Result Fig. 7 sho ws the groundtruth spectrograms and the estimated spectrograms of two example songs from the MUSDB test set. The groundtruths and the estimates hav e similar patterns. W e can see clear activ ations of the fundamental frequencies and their harmonics from the estimated spectrograms. On the other hand, we can observe that the estimated spectrograms are less sharp and noisier compared to the groundtruth spectrograms, which indicate rooms for improvement in the future work. W e also build a website (http://mss.ciaua.com) to demo the result of the proposed model JY3 for songs not in MUSDB. H. Evaluating with DSD100 dataset W e also ev aluate the proposed ARC net with DSD100 dataset that was used in SiSEC2016 [16]. W e ev aluate ARC with batch normalization as introduced in Section III-F with DSD100 by using the official toolkit. 7 The enhancement and residual regression are not used in this ev aluation. W e use the 50/50 train/test split specified by SiSEC2016. The result is shown in T ABLE V. The result of our model is only second to that of the MMDenseNet [18] and MMDenseLSTM [19] models proposed by T akahashi et al. The T AK1 method shown in Fig. 4 is an extended version of these models. I V . C O N C L U S I O N S In this paper, we ha ve presented our models for music source separation. W e proposed to use 1D con volutions in con volution layers so that we can naturally apply recurrent layers to the conv olution outputs. The experiments show that 7 https://github .com/faroit/sisec- mus- results T ABLE V: Evaluation on DSD100 (in SDR). W e use ARC with batch normalization for our model here. vocals drums bass other accomp. DeepNMF [20] 2.75 2.11 1.88 2.64 8.90 NUG [14] 4.55 3.89 2.72 3.18 10.29 MaDT winNet [21] 4.57 — — — — BLSTM [15] 4.86 4.00 2.89 3.24 11.26 SH-4stack [22] 5.16 4.11 1.77 2.36 12.14 BLEND [15] 5.23 4.13 2.98 3.52 11.70 MMDenseNet [18] 6.00 5.37 3.91 3.81 12.10 MMDenseLSTM [19] 6.31 5.46 3.73 4.33 12.73 Ours 5.91 4.11 2.54 3.53 11.31 the recurrent skip connections largely improv e the separation result. Moreover , the proposed enhancement model and residual regression can further improve the separation result. For future work, we would be interested in applying the source separation models for other applications, such as singing style transfer [23], vocal melody extraction [24], [25], instrument recognition [26], and lyrics transcription [27]. R E F E R E N C E S [1] Z. Rafii, A. Liutkus, F . St ¨ oter , S. I. Mimilakis, D. FitzGerald, and B. Pardo, “ An overvie w of lead and accompaniment separation in music, ” CoRR , vol. abs/1804.08300, 2018. [2] O. Ronneberger , P . Fischer, and T . Brox, “U-Net: Convolutional networks for biomedical image segmentation, ” in Proc. Medical Image Computing and Computer -Assisted Intervention . Springer International Publishing, 2015, pp. 234–241. [3] A. Jansson, E. Humphrey , N. Montecchio, R. Bittner , A. Kumar , and T . W eyde, “Singing voice separation with deep U-net conv olutional networks, ” in Proc. International Society for Music Information Retrieval Confer ence , 2017. [4] M. Oquab, L. Bottou, I. Laptev , and J. Si vic, “Is object localization for free? - W eakly-supervised learning with conv olutional neural networks, ” in Pr oc. IEEE Confer ence on Computer V ision and P attern Recognition , 2015, pp. 685–694. [5] J. Long, E. Shelhamer , and T . Darrell, “Fully conv olutional networks for semantic segmentation, ” pp. 3431–3440, 2015. [6] J.-Y . Liu and Y .-H. Y ang, “Event localization in music auto-tagging, ” in Pr oc. ACM International Confer ence on Multimedia , 2016. [7] S.-Y . Chou, J.-S. R. Jang, and Y .-H. Y ang, “Learning to recognize transient sound e vents using attentional supervision, ” Pr oc. International Joint Confer ence of Artificial Intelligence , 2018. (a) Little Chicago’ s Finest – My Own from MUSDB test set, 30 seconds to 40 seconds (b) Side Ef fects Project – Sing W ith Me from MUSDB test set, 30 seconds to 40 seconds Fig. 7: Examples of spectrograms of the groundtruth sources and the estimated sources for two songs in the test set of MUSDB used by SiSEC 2018. The first row contains the groundtruth sources and the second row contains the estimated sources by the model with residual regression (JY3). The first column shows the original song, that is, the mixture. [8] K. Cho, B. van Merrienboer , D. Bahdanau, and Y . Bengio, “On the properties of neural machine translation: Encoder-decoder approaches, ” in Pr oc. W orkshop on Syntax, Semantics and Structure in Statistical T ranslation , 2014. [9] J. Chung, C. Gulcehre, K. Cho, and Y . Bengio, “Empirical evaluation of gated recurrent neural networks on sequence modeling, ” arXiv pr eprint arXiv:1412.3555 , 2014. [10] T . Salimans and D. P . Kingma, “W eight normalization: A simple reparameterization to accelerate training of deep neural networks, ” arXiv pr eprint arXiv:1602.07868 , feb 2016. [11] S. Ioffe and C. Szegedy , “Batch normalization: Accelerating deep network training by reducing internal cov ariate shift, ” in Pr oc. International Confer ence on Machine Learning , 2015, pp. 448–456. [12] A. L. Maas, A. Y . Hannun, and A. Y . Ng, “Rectifier nonlinearities improve neural network acoustic models, ” in Pr oc. International Confer ence on Machine Learning , vol. 30, no. 1, 2013, p. 3. [13] F .-R. St ¨ oter , A. Liutkus, and N. Ito, “The 2018 signal separation ev aluation campaign, ” in Pr oc. International Conference on Latent V ariable Analysis and Signal Separation , 2018. [14] A. A. Nugraha, A. Liutkus, and E. V incent, “Multichannel music separation with deep neural networks, ” in Pr oc. Eur opean Signal Pr ocessing Conference , 2016, pp. 1748–1752. [15] S. Uhlich, M. Porcu, F . Giron, M. Enenkl, T . Kemp, N. T akahashi, and Y . Mitsufuji, “Improving music source separation based on deep neural networks through data augmentation and network blending, ” in Pr oc. IEEE International Conference on Acoustics, Speech and Signal Pr ocessing , 2017, pp. 261–265. [16] A. Liutkus, F . R. St ¨ oter , Z. Rafii, D. Kitamura, B. Rivet, N. Ito, N. Ono, and J. Fontecav e, “The 2016 signal separation ev aluation campaign, ” in Pr oc. LV A/ICA , 2017, pp. 323–332. [17] D. P . Kingma and J. Ba, “ Adam: A method for stochastic optimization, ” arXiv preprint arXiv:1412.6980 , 2014. [18] N. T akahashi and Y . Mitsufuji, “Multi-scale multi-band densenets for audio source separation, ” in Pr oc. IEEE W orkshop on Applications of Signal Processing to A udio and Acoustics , 2017, pp. 21–25. [19] N. T akahashi, N. Goswami, and Y . Mitsufuji, “MMDenseLSTM: An efficient combination of con v olutional and recurrent neural networks for audio source separation, ” CoRR , v ol. abs/1805.02410, 2018. [20] J. L. Roux, J. R. Hershey , and F . W eninger, “Deep NMF for speech separation, ” in Proc. IEEE International Conference on Acoustics, Speech and Signal Pr ocessing , 2015. [21] K. Drossosy , S. I. Mimilakis, D. Serdyukz, G. Schuller, T . V irtaneny , and Y . Bengio, “MaD T winNet: Masker-denoiser architecture with twin networks for monaural sound source separation, ” CoRR , vol. abs/1802.00300, 2018. [22] S. P ark, T . Kim, K. Lee, and N. Kwak, “Music source separation using stacked hourglass networks, ” in Proc. International Society for Music Information Retrieval Confer ence , 2018. [23] C.-W . Wu, J.-Y . Liu, Y .-H. Y ang, and J.-S. R. Jang, “Singing style transfer using cycle-consistent boundary equilibrium generative adversarial networks, ” in Proc. Joint W orkshop on Machine Learning for Music , 2018. [24] R. M. Bittner , B. McFee, J. Salamon, P . Li, and J. P . Bello, “Deep salience representations for f 0 estimation in polyphonic music, ” in Proc. International Society for Music Information Retrieval Confernece , 2017, pp. 63–70. [25] L. Su, “V ocal melody extraction using patch-based CNN, ” in Pr oc. IEEE International Conference on Acoustics, Speech and Signal Pr ocessing , 2018. [26] Y .-N. Hung and Y .-H. Y ang, “Frame-level instrument recognition by timbre and pitch, ” in Pr oc. International Society for Music Information Retrieval Confernece , 2018. [27] C.-P . Tsai, Y .-L. T uan, and L. shan Lee, “Transcribing lyrics from commercial song audio: The first step to wards singing content processing, ” in Pr oc. IEEE International Confer ence on Acoustics, Speech and Signal Pr ocessing , 2018.
Original Paper
Loading high-quality paper...
Comments & Academic Discussion
Loading comments...
Leave a Comment