Multilevel Wavelet Decomposition Network for Interpretable Time Series Analysis
Recent years have witnessed the unprecedented rising of time series from almost all kindes of academic and industrial fields. Various types of deep neural network models have been introduced to time series analysis, but the important frequency inform…
Authors: Jingyuan Wang, Ze Wang, Jianfeng Li
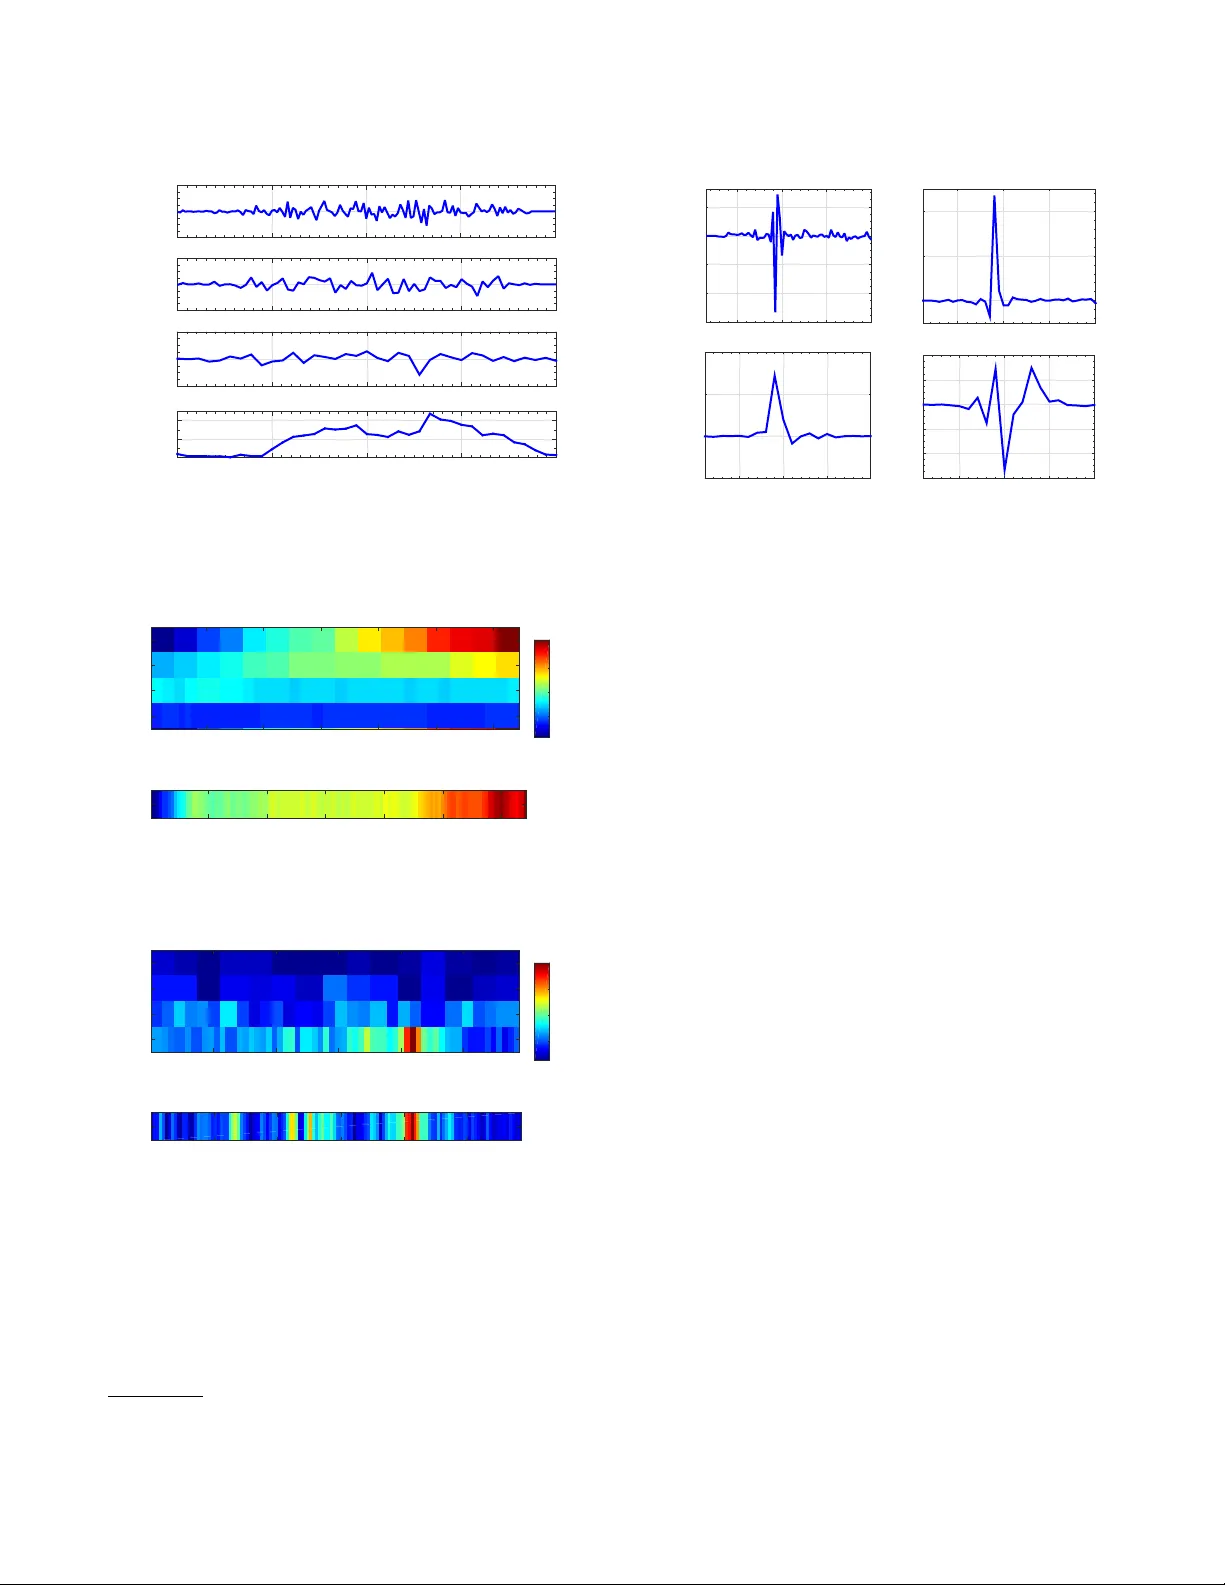
Multilev el W avelet Decomposition Network for Interpretable Time Series Analysis Jingyuan W ang, Ze W ang, Jianfeng Li, Junjie W u Beihang University , Beijing, China {jywang, ze.w , leejianfeng, wujj}@buaa.edu.cn ABSTRA CT Recent years have witnessed the unprece dented rising of time series from almost all kindes of academic and industrial elds. V arious types of deep neural network models have been introduce d to time series analysis, but the important frequency information is yet lack of eective mo deling. In light of this, in this paper we propose a wavelet-based neural network structure called multilevel W avelet Decomposition Network (mWDN) for building frequency-aware deep learning models for time series analysis. mWDN preserves the advantage of multilevel discrete wavelet decomposition in fre- quency learning while enables the ne-tuning of all parameters under a de ep neural network framework. Based on mWDN, we further propose two deep learning models called Residual Classi- cation Flow (RCF) and multi-fr equecy Long Short- T erm Memory (mLSTM) for time series classication and forecasting, respectively . The two models take all or partial mWDN decomposed sub-series in dierent frequencies as input, and resort to the back propaga- tion algorithm to learn all the parameters globally , which enables seamless embedding of wavelet-based frequency analysis into deep learning frameworks. Extensiv e experiments on 40 UCR datasets and a real-world user volume dataset demonstrate the excellent performance of our time series models based on mWDN. In partic- ular , we propose an importance analysis method to mWDN based models, which successfully identies those time-series elements and mWDN lay ers that are crucially important to time series analy- sis. This indeed indicates the interpretability advantage of mWDN, and can be viewed as an indepth exploration to interpretable deep learning. CCS CONCEPTS • Computing methodologies → Neural networks ; Super vised learning by classication ; Supervised learning by regression ; KEY W ORDS Time series analysis, Multilevel wavelet decomposition network, Deep learning, Importance analysis A CM Reference Format: Jingyuan W ang, Ze W ang, Jianfeng Li, Junjie Wu. 2018. Multilevel W avelet Decomposition Network for Interpretable Time Series Analysis. In KDD Permission to make digital or hard copies of all or part of this work for personal or classroom use is granted without fee provided that copies are not made or distribute d for prot or commercial advantage and that copies bear this notice and the full citation on the rst page. Copyrights for components of this work owned by others than ACM must be honored. Abstracting with credit is permitted. T o copy otherwise, or republish, to post on servers or to redistribute to lists, r equires prior specic permission and /or a fee. Request permissions from permissions@acm.org. KDD 2018, August 19–23, 2018, London, United Kingdom © 2018 Association for Computing Machinery . ACM ISBN 978-1-4503-5552-0/18/08. . . $15.00 https://doi.org/10.1145/3219819.3220060 2018: 24th A CM SIGKDD International Conference on Knowledge Discov ery & Data Mining, A ugust 19–23, 2018, London, Unite d Kingdom . ACM, New Y ork, NY, USA, 10 pages. https://doi.org/10.1145/3219819.3220060 1 IN TRODUCTION A time series is a series of data points indexed in time order . Metho ds for time series analysis could be classied into two typ es: time- domain methods and frequency-domain methods. 1 Time-domain methods consider a time series as a se quence of ordered points and analyze correlations among them. Frequency-domain metho ds use transform algorithms, such as discr ete Fourier transform and Z-transform, to transform a time series into a frequency sp ectrum, which could be used as features to analyze the original series. In recent years, with the bo oming of deep learning concept, var- ious types of de ep neural network models have be en introduced to time series analysis and achieved state-of-the-art performances in many real-life applications [ 28 , 38 ]. Some well-known models in- clude Recurrent Neural Networks (RNN) [ 40 ] and Long Short- T erm Memory (LSTM) [ 14 ] that use memory nodes to model correlations of series points, and Convolutional Neural Network (CNN) that uses trainable convolution kernels to model lo cal shape patterns [ 42 ]. Most of these models fall into the category of time-domain methods without leveraging frequency information of a time series, although some begin to consider in indirect ways [6, 19]. W avelet decompositions [ 7 ] are well-known methods for cap- turing features of time series both in time and frequency domains. Intuitively , we can employ them as feature engine ering tools for data preprocessing before a deep modeling. While this loose cou- pling way might improve the performance of raw neural network models [ 24 ], they are not globally optimized with independent parameter inference processes. How to integrate wavelet trans- forms into the framework of deep learning models remains a great challenge. In this paper , we propose a wavelet-based neural network struc- ture, name d multilev el W avelet Decomposition Network (mWDN), to build frequency-aware deep learning mo dels for time series analysis. Similar to the standard Multilev el Discrete W avelet Decomposition (MD WD) model [ 26 ], mWDN can decomp ose a time series into a group of sub-series with frequencies ranke d from high to low , which is crucial for capturing frequency factors for deep learning. Dierent from MD WD with xed parameters, howev er , all parame- ters in mWDN can b e ne-turned to t training data of dierent learning tasks. In other words, mWDN can take advantages of both wavelet based time series decomposition and the learning ability of deep neural networks. Based on mWDN, two deep learning models, i.e. , Residual Classi- cation Flow (RCF) and multi-frequency Long Short- T erm Memory 1 https://en.wikipedia.org/wiki/Time_series x l h ↓ 2 ↓ 2 l h ↓ 2 ↓ 2 l h ↓ 2 ↓ 2 x l (1) x l (2) a l (1) a h (1) x h (1) a l (2) a h (2) x h (2) a l (3) a h (3) x l (3) x h (3) ↓ 2 l or h A verage Pooling The Functions (2) … … The third level decomposition results of x (a) Illustration of the mWDN Framework h = + A verage Pooling or W l ( i ) W h ( i ) x l ( i -1) b l ( i -1) or a l ( i ) a h ( i ) x l ( i ) l or h (b) Approximative Discrete W avelet Transform Figure 1: The mWDN framew ork. (mLSTM), are designed for time series classication (TSC) and fore- casting (TSF), respe ctively . The key issue in TSC is to extract as many as possible representative features from time series. The RCF model therefore adopts the mWDN decomposed results in dierent levels as inputs, and employs a pipelined classier stack to exploit features hidden in sub-series through residual learning methods. For the TSF problem, the key issue turns to inferring future states of a time series according to the hidden trends in dierent frequen- cies. Therefore , the mLSTM model feeds all mWDN decomposed sub-series in high frequencies into indep endent LSTM models, and ensembles all LSTM outputs for nal forecasting. Note that all pa- rameters of RCF and mLSTM including the ones in mWDN are trained using the back propagation algorithm in an end-to-end man- ner . In this way , the wavelet-based frequency analysis is seamlessly embedded into de ep learning frameworks. W e evaluate RCF on 40 UCR time series datasets for TSC, and mL- STM on a real-world user-volume time series dataset for TSF . The results demonstrate their superiorities to state-of-the-art baselines and the advantages of mWDN with trainable parameters. As a nice try for interpretable deep learning, we further pr opose an impor- tance analysis method to mWDN based models, which successfully identies those time-series elements and mWDN layers that are crucially important to the success of time series analysis. This in- dicates the interpretability advantage of mWDN by integrating wavelet decomposition for frequency factors. 2 MODEL Throughout the pap er , we use lowercase symbols such as a , b to denote scalars, bold lowercase symbols such as a , b to denote vec- tors, bold uppercase symbols such as A , B to denote matrices, and uppercase symbols such as A , B , to denote constant. 2.1 Multilevel Discrete W avelet Decomposition Multilevel Discrete W avelet Decomposition (MD WD) [ 26 ] is a wavelet based discrete signal analysis method, which can extract multilevel time-frequency features from a time series by decom- posing the series as low and high frequency sub-series level by level. W e denote the input time series as x = { x 1 , . . . , x t , . . . , x T } , and the low and high sub-series generated in the i -th level as x l ( i ) and x h ( i ) . In the ( i + 1 ) -th level, MDWD uses a low pass lter l = { l 1 , . . . , l k , . . . , l K } and a high pass lter h = { h 1 , . . . , h k , . . . , h K } , K ≪ T , to convolute low fr equency sub-series of the upper level as a l n ( i + 1 ) = K Õ k = 1 x l n + k − 1 ( i ) · l k , a h n ( i + 1 ) = K Õ k = 1 x l n + k − 1 ( i ) · h k , (1) where x l n ( i ) is the n -th element of the low frequency sub-series in the i -th level, and x l ( 0 ) is set as the input series. The low and high frequency sub-series x l ( i ) and x h ( i ) in the level i are generated from the 1/2 down-sampling of the intermediate variable sequences a l ( i ) = n a l 1 ( i ) , a l 2 ( i ) , . . . o and a h ( i ) = n a h 1 ( i ) , a h 2 ( i ) , . . . o . The sub-series set X ( i ) = n x h ( 1 ) , x h ( 2 ) , . . . , x h ( i ) , x l ( i ) o is called as the i -th level decomposed results of x . Specically , X ( i ) satises: 1) W e can fully reconstruct x from X ( i ) ; 2) The frequency from x h ( 1 ) to x l ( i ) is from high to low; 3) For dierent layers, X ( i ) has dierent time and frequency resolutions. As i increases, the fre- quency resolution is increasing and the time resolution, especially for low frequency sub-series, is decreasing. Because the sub-series with dierent frequencies in X keep the same order information with the original series x , MD WD is re- garded as time-frequency decomposition. 2.2 Multilevel W avelet Decomposition Network In this section, we propose a multilevel W avelet Decomposition Network (mWDN), which approximativ ely implements a MDWD under a deep neural network framework. The structure of mWDN is illustrated in Fig. 1. As shown in the gures, the mWDN model hierarchically decomposes a time series using the following two functions a l ( i ) = σ W l ( i ) x l ( i − 1 ) + b l ( i ) , a h ( i ) = σ W h ( i ) x l ( i − 1 ) + b h ( i ) , (2) where σ (·) is a sigmoid activation function, and b l ( i ) and b h ( i ) are trainable bias v ectors initialized as close-to-zero random values. W e can see the functions in Eq. (2) have similar forms as the functions The original time series x h l h l FC 2 h l FC 3 Classification Flow Level 1 Level 2 Classifier Classifier Classifier Level 3 mWDN Figure 2: The RCF framew ork. in Eq. (1) for MD WD. x l ( i ) and x h ( i ) also denote the low and high frequency sub-series of x generated in the i -th level, which are down-sampled from the intermediate variables a l ( i ) and a h ( i ) using an average pooling layer as x l j ( i ) = ( a l 2 j ( i ) + a l 2 j − 1 ( i ))/ 2 . In order to implement the convolution dened in Eq. (1) , we set the initial values of the weight matrices W l and W h as W l ( i ) = l 1 l 2 l 3 · · · l K ϵ · · · ϵ ϵ l 1 l 2 · · · l K − 1 l K · · · ϵ . . . . . . . . . . . . . . . . . . . . . . . . ϵ ϵ ϵ · · · l 1 · · · l K − 1 l K . . . . . . . . . . . . . . . . . . . . . . . . ϵ ϵ ϵ · · · · · · · · · l 1 l 2 ϵ ϵ ϵ · · · · · · · · · ϵ l 1 , (3) W h ( i ) = h 1 h 2 h 3 · · · h K ϵ · · · ϵ ϵ h 1 h 2 · · · h K − 1 h K · · · ϵ . . . . . . . . . . . . . . . . . . . . . . . . ϵ ϵ ϵ · · · h 1 · · · h K − 1 h K . . . . . . . . . . . . . . . . . . . . . . . . ϵ ϵ ϵ · · · · · · · · · h 1 h 2 ϵ ϵ ϵ · · · · · · · · · ϵ h 1 . (4) Obviously , W l ( i ) and W h ( i ) ∈ R P × P , where P is the size of x l ( i − 1 ) . The ϵ in the weight matrices are random values that satisfy | ϵ | ≪ | l | , ∀ l ∈ l and | ϵ | ≪ | h | , ∀ h ∈ h . W e use the Daub echies 4 W avelet [ 29 ] in our practice, where the lter coecients are set as l = { − 0 . 0106 , 0 . 0329 , 0 . 0308 , − 0 . 187 , − 0 . 028 , 0 . 6309 , 0 . 7148 , 0 . 2304 } , h = { − 0 . 2304 , 0 . 7148 , − 0 . 6309 , − 0 . 028 , 0 . 187 , 0 . 0308 , − 0 . 0329 , − 0 . 0106 } . From Eq. (2) to Eq. (3) , we use the deep neural network frame- work to implement an appro ximate MD WD. It is note worthy that although the weight matrices W l ( i ) and W h ( i ) are initialized as the lter coecients of MD WD, they are still trainable according to real data distributions. The original time series x h l h l h l Level 1 Level 2 LSTM Level 3 LSTM LSTM LSTM NN Linear regression mWDN Figure 3: The mLSTM framew ork. 2.3 Residual Classication F low The task of TSC is to predict unknown category lab el of a time series. A key issue of TSC is extracting distinguishing features from time series data. The decompose d results X of mWDN are natural time- frequency features that could b e used in TSC. In this subse ction, we propose a Residual Classication Flow (RCF) netw ork to e xploit the potentials of mWDN in TSC. The framework of RCF is illustrated in Fig. 2. As shown in the gure, RCF contains many independent classiers. The RCF model connects the sub-series generated by the i -th mWDN level, i.e. , x h ( i ) and x l ( i ) , with a for ward neural network as u ( i ) = ψ x h ( i ) , x l ( i ) , θ ψ , (5) where ψ (· ) could be a multilayer perceptron, a convolutional net- work, or any other types of neural networks, and θ ψ represents the trainable parameters. Moreover , RCF adopts a residual learning method [13] to join u ( i ) of all classiers as ˆ c ( i ) = S ( ˆ c ( i − 1 ) + u ( i ) ) , (6) where S (·) is a softmax classier , ˆ c i is a predicted value of one-hot encoding of the category lab el of the input series. In the RCF model, the decomposed results of all mWDN levels, i.e. X ( 1 ) , . . . , X ( N ) , are ev olved. Because the decomposed results in dierent mWDN levels have dierent time and frequency resolu- tions [ 26 ], the RCF model can fully exploit patterns of the input time series from dierent time/frequency-resolutions. In other words, RCF employs a multi-view learning methodology to achieve high- performance time series classication. Moreover , deep residual networks [ 13 ] were proposed to solve the problem that using deeper network structures may result in a great training diculty . The RCF model also inherits this merit. In Eq. (6) , the i -th classier makes decision based on u ( i ) and the decision made by the ( i − 1 ) -th classier , which can learn from u ( i ) the incremental knowledge that the ( i − 1 ) -th classier do es not have. Therefore, users could append residual classiers one after another until classication performance does not increase any more. 2.4 Multi-frequency Long Short- T erm Memory In this subsection, we propose a multi-frequency Long-Short T erm Memory (mLSTM) model base d on mWDN for TSF. The design of mLSTM is base d on the insight that the temp oral correlations of points hidden in a time series have close relations with frequency . For example, large time scale correlations, such as long-term ten- dencies, usually lay in low frequency , and the small time scale correlations, such as short-term disturbances and e vents, usually lay in high frequency . Therefore, we could divide a complicated TSF problem as many sub-problems of forecasting sub-series decom- posed by mWDN, which are relatively easier because the frequency components in the sub-series are simpler . Given a time series with innite length, on which we open a T size slide window from the past to the time t as x = { x t − T + 1 , . . . , x t − 1 , x t } . (7) Using mWDN to decompose x , we get the low and high frequency component series in the i -th level as x l ( i ) = { x l t − T 2 n + 1 ( i ) , . . . , x l t − 1 ( i ) , x l t ( i ) } , x h ( i ) = { x h t − T 2 n + 1 ( i ) , . . . , x h t − 1 ( i ) , x h t ( i ) } . (8) As shown in Fig. 3, the mLSTM model uses the de composed re- sults of the last level, i.e. , the sub-series in X ( N ) = { x h ( 1 ) , x h ( 2 ) , . . . , x h ( N ) , x l ( N ) } , as the inputs of N + 1 independent LSTM sub- networks. Every LSTM sub-network forecasts the future state of one sub-series in X ( N ) . Finally , a fully connected neural network is employed to fuse the LSTM sub-networks as an ensemble for forecasting. 3 OPTIMIZA TION In TSC applications, we adopt a deep supervision metho d to train the RCF model [ 37 ]. Given a set of time series { x 1 , x 2 , . . . , x M } , we use cross-entropy as loss metric and dene the objective function of the i -th classier as ˜ J c ( i ) = − 1 M M Õ m = 1 c ⊤ m ln ˆ c m ( i ) + ( 1 − c m ) ⊤ ln ( 1 − ˆ c m ( i )) , (9) where c m is the one-hot encoding of x m ’s real category , and ˆ c m ( i ) is the softmax output of the i -th classier with the input x m . For a RCF with N classiers, the nal objective function is a weighted sum of all ˜ J ( i ) [37]: J c = N Õ i = 1 i N ˜ J c ( i ) . (10) The result of the last classier , ˆ c ( N ) , is used as the nal classication result of RCF . In TSF applications, we adopt a pre-training and ne turning method to train the mLSTM mo del. In the pre-training step, we use MD WD to decompose the real value of the future state to b e predicted as N wavelet components, i.e. y p = { y h ( 1 ) , y h ( 2 ) , . . . , y h ( N ) , y l ( N ) } , and then combine the outputs of all LSTM sub- network as ˆ y p , then the objective function of the pre-training step is dened as ˜ J f = − 1 M M Õ m = 1 ∥ y m − ˆ y p m ∥ 2 F , (11) where ∥ · ∥ F is the Frobenius Norm. In the ne-turning step, we use the following objective function to train mLSTM based on the parameters learned in the pre-training step: J f = 1 T T Õ t = 1 ( ˆ y − y ) 2 , (12) where ˆ y is future state predicted by mLSTM and y is the real value. W e use the error back pr opagation (BP) algorithm to optimize the objective functions. Denoting θ as the parameters of the RCF or mLSTM model, the BP algorithm iteratively updates θ as θ ← θ − η ∂ J ( θ ) ∂ θ , (13) where η is an adjustable learning rate. The weight matrices W h ( i ) and W l ( i ) of mWDN are also trainable in Eq. (13) . A problem of training parameters with preset initial values like W l ( i ) and W h ( i ) is that the model may “forget” the initial values [ 9 ] in the training process. T o deal with this, we introduce tw o regularization items to the objective function and therefore have J ∗ = J ( θ ) + α Õ i ∥ W l ( i ) − ˜ W l ( i ) ∥ 2 F + β Õ i ∥ W h ( i ) − ˜ W h ( i ) ∥ 2 F , (14) where ˜ W l ( i ) and ˜ W h ( i ) are the same matrices as W h ( i ) and W h ( i ) except that ϵ = 0 , and α , β are hyper-parameters which are set as empirical values. Accordingly , the BP algorithm iteratively updates the weight matrices of mWDN as W l ( i ) ← W l ( i ) − η ∂ J ∂ W l ( i ) − 2 α W l ( i ) − ˜ W ( i ) , W h ( i ) ← W h ( i ) − η ∂ J ∂ W h ( i ) − 2 β W l ( i ) − ˜ W ( i ) . (15) In this way , the weights in mWDN will converge to a point that is near to the wavelet decomposed prior , unless wav elet decomposi- tion is far inappropriate to the task. 4 EXPERIMEN TS In this section, we evaluate the performance of the mWDN-based models in both the TSC and TSF tasks. 4.1 T ask I: Time Series Classication Experimental Setup. The classication performance was tested on 40 datasets of the UCR time series repository [ 4 ], with various competitors as follows: • RNN and LSTM . Recurrent Neural Networks [ 40 ], and Long Short- T erm Memor y [ 14 ] are two kinds of classical deep neural networks widely used in time series analysis. • MLP , FCN , and ResNet . These three models were proposed in [ 38 ] as strong baselines on the UCR time series datasets. They have the same framework: an input layer , followed by three hidden basic blocks, and nally a softmax output. MLP adopts a fully-connected layer as its basic block, FCN and ResNet adopt a fully convolutional layer and a residual convolutional network, respectively , as their basic blocks. • MLP-RCF , FCN-RCF , and ResNet-RCF . The three models use the basic blocks of MLP/FCN/ResNet as the ψ model of RCF T able 1: Comparison of Classication Performance on 40 UCR Time Series Datasets Err Rate RNN LSTM MLP FCN ResNet MLP-RCF FCN-RCF ResNet-RCF W avelet-RCF Adiac 0.233 0.341 0.248 0.143 0.174 0.212 0.155 0.151 0.162 Beef 0.233 0.333 0.167 0.25 0.233 0.06 0.03 0.06 0.06 CBF 0.189 0.118 0.14 0 0.006 0.056 0 0 0.016 ChlorineConcentration 0.135 0.16 0.128 0.157 0.172 0.096 0.068 0.07 0.147 CinCECGtorso 0.333 0.092 0.158 0.187 0.229 0.117 0.014 0.084 0.011 CricketX 0.449 0.382 0.431 0.185 0.179 0.321 0.216 0.297 0.211 CricketY 0.415 0.318 0.405 0.208 0.195 0.254 0.172 0.301 0.192 CricketZ 0.4 0.328 0.408 0.187 0.187 0.313 0.162 0.275 0.162 DiatomSizeReduction 0.056 0.101 0.036 0.07 0.069 0.013 0.023 0.026 0.028 ECGFiveDays 0.088 0.417 0.03 0.015 0.045 0.023 0.01 0.035 0.016 Face All 0.247 0.192 0.115 0.071 0.166 0.094 0.098 0.126 0.076 FaceFour 0.102 0.364 0.17 0.068 0.068 0.102 0.05 0.057 0.058 FacesUCR 0.204 0.091 0.185 0.052 0.042 0.15 0.087 0.102 0.087 50words 0.316 0.284 0.288 0.321 0.273 0.316 0.288 0.258 0.3 FISH 0.126 0.103 0.126 0.029 0.011 0.086 0.021 0.034 0.026 GunPoint 0.1 0.147 0.067 0 0.007 0.033 0 0.02 0 Haptics 0.594 0.529 0.539 0.449 0.495 0.480 0.461 0.473 0.476 InlineSkate 0.667 0.638 0.649 0.589 0.635 0.543 0.566 0.578 0.572 ItalyPowerDemand 0.055 0.072 0.034 0.03 0.04 0.031 0.023 0.034 0.028 Lighting2 0 0 0.279 0.197 0.246 0.213 0.145 0.197 0.162 Lighting7 0.288 0.384 0.356 0.137 0.164 0.179 0.091 0.177 0.144 MALLA T 0.119 0.127 0.064 0.02 0.021 0.058 0.044 0.046 0.024 MedicalImages 0.299 0.276 0.271 0.208 0.228 0.251 0.164 0.188 0.206 MoteStrain 0.133 0.167 0.131 0.05 0.105 0.105 0.076 0.032 0.05 NonInvasiveFatalECGThorax1 0.09 0.08 0.058 0.039 0.052 0.029 0.026 0.04 0.042 NonInvasiveFatalECGThorax2 0.069 0.071 0.057 0.045 0.049 0.056 0.028 0.033 0.048 OliveOil 0.233 0.267 0.6 0.167 0.133 0.03 0 0 0.012 OSULeaf 0.463 0.401 0.43 0.012 0.021 0.342 0.018 0.021 0.021 Sony AIBORobotSurface 0.21 0.309 0.273 0.032 0.015 0.193 0.042 0.032 0.052 Sony AIBORobotSurfaceII 0.219 0.187 0.161 0.038 0.038 0.092 0.064 0.083 0.072 StarLightCurves 0.027 0.035 0.043 0.033 0.029 0.021 0.018 0.027 0.03 SwedishLeaf 0.085 0.128 0.107 0.034 0.042 0.089 0.057 0.017 0.046 Symbols 0.179 0.117 0.147 0.038 0.128 0.126 0.04 0.107 0.084 T woPatterns 0.005 0.001 0.114 0.103 0 0.070 0 0 0.005 uW aveGestureLibraryX 0.224 0.195 0.232 0.246 0.213 0.213 0.218 0.194 0.162 uW aveGestureLibraryY 0.335 0.265 0.297 0.275 0.332 0.306 0.232 0.296 0.241 uW aveGestureLibraryZ 0.297 0.259 0.295 0.271 0.245 0.298 0.265 0.204 0.194 wafer 0 0 0.004 0.003 0.003 0.003 0 0 0 W ordsSynonyms 0.429 0.343 0.406 0.42 0.368 0.391 0.338 0.387 0.314 yoga 0.202 0.158 0.145 0.155 0.142 0.138 0.112 0.139 0.128 Winning times 2 2 0 9 6 2 19 7 7 A VG arithmetic ranking 7.425 6.825 7.2 4.025 4.55 5.15 2.175 3.375 3.075 A VG geometric ranking 6.860 6.131 7.043 3.101 3.818 4.675 1.789 2.868 2.688 MPCE 0.039 0.043 0.041 0.023 0.025 0.028 0.017 0.021 0.019 in Eq. (5) . W e compar e them with MPL/FCN/ResNet to verify the eectiveness of RCF. • W avelet-RCF . This model has the same structure as ResNet- RCF but replaces the mWDN part with a standar d MD WD with xed parameters. W e compare it with ResNet-RCF to verify the eectiveness of trainable parameters in mWDM. For each dataset, we ran a model 10 times and returned the average classication error rate as the evaluation. T o compare the overall performances on all the 40 data sets, we further introduce d Mean Per-Class Error (MPCE) as the performance indicator for each competitor [ 38 ]. Let C k denote the amount of categories in the k th dataset, and e k the error rate of a model on that dataset, MPCE of a model is then dened as MPCE = 1 K K Õ l = 1 e k C k . (16) Note that the factor of category amount is wiped out in MPCE. A smaller MPCE value indicates a better overall performance. Results & Analysis. T able 1 sho ws the experimental results, with the summarized information listed in the bottom two lines. Note that the best performance for each dataset is highlighted in bold, and the second best is in italic. From the table, we have various Interval length (min) 5 10 15 20 25 30 MPAE (%) 10 20 30 40 SAE RNN LSTM wLSTM mLSTM mLSTM (a) Comparison by MAPE Interval length (min) 5 10 15 20 25 30 RMSE 5 10 15 20 25 SAE RNN LSTM wLSTM mLSTM mLSTM (b) Comparison by RMSE Figure 4: Comparison of prediction performance with vary- ing period lengths (Scenario I). interesting observations. Firstly , it is clear that among all the com- petitors, FCN-RCF achieves the best performance in terms of b oth the largest number of wins (the b est in 19 out of 40 datasets) and the smallest MPCE value. While the baseline FCN itself also achieves a satisfactory performance — the second largest number of wins at 9 and a rather small MPCE value at 0.023, the gap to FCM-RCF is still rather big, implying the signicant benet from adopting our RCF framework. This is actually not an individual case; from T able 1, MLP-RCF performs much better than MLP on 37 datasets, and the number for ResNet-RCF against ResNet is 27. This indicates RCF is indeed a general framework compatible with dierent types of deep learning classiers and can improve TSF performance sharply . Another observation is from the comparison between W avelet- RCF and ResNet-RCF. T able 1 sho ws that W av elet-RCF achieved the second overall performance on MPCE and A VG rankings, which in- dicates that the frequency information introduce d by wavelet tools is very helpful for time series problems. It is clear from the table that ResNet-RCF outperforms W avelet-RCF on most of the datasets. This strongly demonstrates the advantage of our RCF framework in adopting parameter-trainable mWDN under the deep learning architecture, rather than using directly the wavelet decomposition as a feature engine ering tool. More technically speaking, compar ed with W avelet-RCF, mWND-based ResNet-RCF can achieve a good tradeo between the prior of frequency-domain and the likelihoods of training data. This well illustrates why RCF base d models can achieve much better results in the pre vious observation. Summary . The above experiments demonstrate the superiority of RCF based models to some state-of-the-art baselines in the TSC tasks. The experiments also imply that the trainable parameters in a deep learning architecture and the strong priors from wavelet decomposition are two key factors for the success of RCF . 4.2 T ask II: Time Series Forecasting Experimental Setup. W e tested the predictive power of mLSTM on a visitor volume prediction scenario [ 35 ]. The experiment adopts a real-life dataset named WuxiCellPhone , which contains user-volume time series of 20 cell-phone base stations locate d in the downtown of Wuxi city during tw o weeks. Detail informantion of cell-phone data refers [ 30 , 31 , 34 ]. The time granularity of a user-volume series is 5 minutes. In the experiments, we compared mLSTM with the following baselines: Interval length (min) 5 10 15 20 25 30 MPAE (%) 20 25 30 35 40 SAE RNN LSTM wLSTM mLSTM mLSTM (a) Comparison by MAPE Interval length (min) 5 10 15 20 25 30 RMSE 5 10 15 20 25 SAE RNN LSTM wLSTM mLSTM mLSTM (b) Comparison by RMSE Figure 5: Comparison of prediction performance with vary- ing interval lengths (Scenario II). • SAE (Stacked A uto-Encoders), which has been used in vari- ous TSF tasks [25]. • RNN (Recurrent Neural Networks) and LSTM (Long Short- T erm Memor y), which are specically designed for time se- ries analysis. • wLSTM , which has the same structure with mLSTM but replaces the mWDN part with a standard MDWD. W e use three metrics to evaluate the performance of the mo dels, including Mean Absolute Percentage Error (MAPE) and Root Mean Square Error (RMSE), which ar e dened as MAPE = 1 T T Õ t = 1 | ˆ x t − x t | x t × 100% , RMSE = v u t 1 T T Õ t = 1 ( ˆ x t − x t ) 2 , (17) where x t is the real value of the t -th sample in a time series, and ˆ x t is the predicted one. The less value of the three metrics means the better performance. Results & Analysis. W e compared the performance of the com- petitors in two TSF scenarios suggested in [ 33 ]. In the rst scenario, we predicted the average user volumes of a base station in sub- sequent periods. The length of the periods was varied from 5 to 30 minutes. Fig. 4 is a comparison of the performance averaged on the 20 base stations in one week. As can be seen, while all the models experience a gradual decrease in prediction error as the period length increases, that mLSTM achie ves the best performance compared with the baselines. Particularly , the p erformance of mL- STM is consistently better than wLSTM, which again approves the introduction of mWDN for time series forecasting. In the second scenario, we predicted the average user v olumes in 5 minutes after a given time interval varying from 0 to 30 min- utes. Fig. 5 is a performance comparison between mLSTM and the baselines. Dierent from the tend we observed in Scenario I, the prediction errors in Fig. 5 generally increase along the x-axis for the increasing uncertainty . From Fig. 5 we can se e that mLSTM again outperforms wLSTM and other baselines, which conrms the observations from Scenario I. Summary . The above experiments demonstrate the sup erior- ity of mLSTM to the baselines. The mWDN structure adopted by mLSTM again becomes an important factor for the success. Time 0:00 6:00 12:00 18:00 24:00 User Number 0 20 40 60 80 100 (a) Cell-phone User Number Time 40 60 80 100 120 Voltage -6 -4 -2 0 2 4 6 T-Wave (b) ECG Figure 6: Samples of time series. 5 IN TERPRET A TION In this section, we highlight the unique advantage of our mWDN model: the interpretability . Since mWDN is embedded with a dis- crete wavelet decomp osition, the outputs of the middle layers in mWDN, i.e. , x l ( i ) and x h ( i ) , inherit the physical meanings of wavelet decompositions. W e here take two data sets for illustration: WuxiCellPhone used in Se ct. 4.2 and ECGFiveDays use d in Sect. 4.1. Fig. 6(a) shows a sample of the user number series of a cell-phone base station in one day , and Fig. 6(b) exhibits an electrocardiogram (ECG) sample. 5.1 The Motivation Fig. 7 shows the outputs of mWDN layers in the mLSTM and RCF models fe d with the two samples given in Fig. 6, respectively . In Fig. 7(a), we plot the outputs of the rst three layers in the mLSTM model as dierent sub-gures. As can be seen, from x h ( 1 ) to x l ( 3 ) , the outputs of the middle layers correspond to the frequency com- ponents of the input series running from high to low . A similar phenomenon could be observed in Fig. 7( b), where the outputs of the rst three layers in the RCF model ar e presented. This phenom- enon again indicates that the middle layers of mWDN inherit the frequency decomposition function of wavelet. Then here comes the problem: can w e evaluate quantitatively what layer or which frequency of a time series is more important to the nal output of the mWDN based models? If possible, this can provide valuable interpretability to our mWDN model. 5.2 Importance Analysis W e her e intr oduce an importance analysis method for the pr oposed mWDN model, which aims to quantify the imp ortance of each middle layer to the nal output of the mWDN based models. W e denote the problem of time series classication/forecasting using a neural network model as p = M ( x ) , (18) where M denotes the neural network, x denotes the input series, and p is the prediction. Given a well-trained model M , if a small disturbance ε to the i -th element x i ∈ x can cause a large change to the output p , we say M is sensitive to x i . Therefore, the sensibility of the network M to the i -th element x i of the input series is dened as the partial derivatives of M ( x ) to x i as follows: S ( x i ) = ∂ M ( x i ) ∂ x i = lim ε → 0 M ( x i ) − M ( x i − ε ) ε . (19) Obviously , S ( x i ) is also a function of x i for a given mo del M . Given a training data set X = { ˜ x 1 , · · · , ˜ x j , · · · , ˜ x J } with J training samples, the importance of the i -th element of the input series x to the mo del M is dened as I ( x i ) = 1 J J Õ j = 1 S ( ˜ x j i ) , (20) where ˜ x j i is the value of the i -th element in the j -th training sample. The importance denition in Eq. (20) can be extended to the middle layers in the mWDN model. Denoting a as an output of a middle layer in mWDN, the neural network M can be rewritten as p = M ( a ( x )) , (21) and the sensibility of M to a is then dened as S a ( x ) = ∂ M ( a ( x )) ∂ a ( x ) = lim ε → 0 M ( a ( x )) − M ( a ( x ) − ε ) ε . (22) Given a training data set X = { ˜ x 1 , · · · , ˜ x j , · · · , ˜ x J } , the importance of a w .r .t. M is calculate d as I ( a ) = 1 J J Õ j = 1 S a ( ˜ x j ) . (23) The calculation of ∂ M ∂ x i and ∂ M ∂ a in Eq. (19) and Eq. (22) are given in the Appendix for concision. Eq. (20) and Eq. (23) respectively dene the importance of a time-series element and an mWDN layer to an mWDN based model. 5.3 Experimental Results Fig. 8 and Fig. 9 shows the results of importance analysis. In Fig. 8, the mLSTM mo del trained on WuxiCellPhone in Sect. 4.2 is used. Fig. 8(b) exhibits the imp ortance spe ctrum of all the elements, where the x-axis denotes the increasing timestamps and the colors in spectrum denote the varying importance of the features: the redder , the more important. From the spectrum, we can see that the latest elements are more important than the older ones, which is quite reasonable in the scenario of time series forecasting and justies the time value of information. Fig. 8(a) exhibits the importance spectra of the middle layers listed from top to bottom in the increasing order of frequency . Note that for the sake of comparison, we resize the lengths of the outputs to the same. From the gure, we can observe that i ) the lower frequency layers in the top ar e with higher importance, and i i ) only the layers with higher imp ortance exhibit the time value of the elements as in Fig. 8(b). These imply that the low frequency layers in mWDN are crucially important to the success of time series forecasting. This is not dicult to understand since the information captured by low frequency layers often characterizes the essential tendency of human activities and therefore is of great use to revealing the futur e. Fig. 9 depicts the importance spectra of the RCF model trained on the ECGFiveDay data set in Sect. 4.1. As shown in Fig. 9(b), the most important elements ar e located in the range from roughly 100 to 110 of the time axis, which is quite dierent from that in Fig. 8(b). T o understand this, recall Fig. 6(b) that this range corresponds to the T - W ave of electrocardiography , co vering the period of the heart relaxing and preparing for the next contraction. It is generally x h (3) -50 0 50 x h (2) -50 0 50 x h (3) -50 0 50 Time 0:00 6:00 12:00 18:00 24:00 x l (3) 0 100 200 (a) Cell-phone User Numbers in Dierent Layers 20 40 60 80 x h (1) -1.5 -1 -0.5 0 0.5 5 10 15 20 x h (3) -5 0 5 10 5 10 15 20 x l (3) -6 -4 -2 0 2 4 10 20 30 40 x h (2) 0 2 4 (b) ECG W aves in Dierent Layers Figure 7: Sub-series generated by the mWDN model. (a) Importance spectra of middle layers 20 40 60 80 100 120 x l (3) x h (3) x h (2) x h (1) × 10 -5 1 1.5 2 2.5 (b) Importance spectra of inputs 20 40 60 80 100 120 x Figure 8: Importance spectra of mLSTM on W uxiCellPhone . (b) Importance spectra of inputs 20 40 60 80 100 120 x (a) Importance spectra of middle layers 20 40 60 80 100 120 x l (3) x h (3) x h (2) x h (1) × 10 -6 0.5 1 1.5 2 Figure 9: Importance spectra of RCF on ECGFiveDays . believed that abnormalities in the T - W av e can indicate seriously impaired physiological functioning 2 . As a result, the elements describing T - W ave are more important to the classication task. Fig. 9(a) shows the importance spectra of middle layers, also listed from top to bottom in the increasing order of frequency . 2 https://en.m.wikipedia.org/wiki/T_wave It is interesting that the phenomenon is opposite to the one in Fig. 8(a); that is, the layers in high frequency are more important to the classication task on ECGFiveDays . T o understand this, we should know that the general trends of ECG curves captured by low frequency layers are ver y similar for everyone , whereas the abnormal uctuations captured by high frequency layers are the real distinguishable information for heart diseases identication. This also indicates the dierence b etween a time-series classication task and the a time-series forecasting task. Summary . The experiments in this section demonstrate the interpretability advantage of the mWDN model stemming from the integration of wav elet decomposition and our proposed importance analysis method. It can also b e regarded as an indepth exploration to solve the black box problem of deep learning. 6 RELA TED WORKS Time Series Classication (TSC). The target of TSC is to assign a time series pattern to a specic category , e.g. , to identify a word based on series of voice signals. Traditional TSC methods could be classied into three major categories: distance based, feature based, and ensemble metho ds [ 6 ]. Distance base d metho ds predict the category of a time series by comparing the distances or similarities to other labeled series. The widely use d TSC distances includes the Euclidean distance and dynamic time warping (DTW) [ 2 ], and DTW with KNN classier has be en the state-of-the-art TSC method for a long time [ 18 ]. A defect of distance based TSC methods is the relatively high computational comple xity . Feature based methods overcome this defect by training classiers on deterministic features and category labels of time series. T raditional methods, howev er , usually depend on handcraft features as inputs, such as symbolic aggregate approximation and interval mean/deviation/slop [ 8 , 22 ]. In recent years, automatic featur e engineering was introduced to TSC, such as time series shapelets mining [ 11 ], attention [ 27 ] and deep learning based representative learning [ 20 ]. Our study also falls in this area but with frequency awareness. The well-known en- semble methods for TSC include PROP [ 23 ], COTE [ 1 ], etc. , which aim to improv e classication performance via knowledge integra- tion. As reported by some latest works [ 6 , 38 ], however , existing ensemble methods are yet inferior to some distance based deep learning methods. Time Series Forecasting (TSF). TSF refers to predicting fu- ture values of a time series using past and present data, which is widely adopted in nearly all application domains [ 32 , 36 ]. A classic model is autoregressive integrated moving average ( ARIMA) [ 3 ], with a great many variants, e.g. , ARIMA with explanatory variables (ARIMAX) [ 21 ] and seasonal ARIMA (SARIMA) [ 39 ], to meet the requirements of various applications. In r ecent years, a tendency of TSF research is to introduce supervised learning metho ds, such as support vector regression [ 16 ] and deep neural networks [ 41 ], for modeling complicated non-linear correlations between past and future states of time series. T wo well-known deep neural network structures for TSF are recurrent neural networks (RNN) [ 5 ] and long short-term memory (LSTM) [ 10 ]. These indicate that an elab- orate model design is crucially important for achieving e xcellent forecasting performance. Frequency Analysis of Time Series. Frequency analysis of time series data has be en de eply studied by the signal process- ing community . Many classical metho ds, such as Discrete W avelet Transform [ 26 ], Discrete Fourier [ 12 ], and Z- T ransform [ 17 ], have been proposed to analysis the frequency pattern of time series sig- nals. In existing TSC/TSF applications, however , transforms are usually used as an independent step in data preprocessing [ 6 , 24 ], which have no interactions with model training and therefore might not be optimized for TSC/TSF tasks from a global view . In recent years, some research works, such as Clockwork RNN [ 19 ] and SFM [ 15 ], begins to introduce the frequency analysis metho dology into the de ep learning framework. T o our best knowledge, our study is among the very few works that emb ed wavelet time series trans- forms as a part of neural networks so as to achiev e an end-to-end learning. 7 CONCLUSIONS In this pap er , we aim at building frequency-aware de ep learning models for time series analysis. T o this end, we rst designed a novel wavelet-based network structure called mWDN for frequency learning of time series, which can then b e seamlessly embedded into deep learning frameworks by making all parameters trainable. W e further designed two deep learning models based on mWDN for time series classication and forecasting, respectively , and the extensive experiments on abundant real-world datasets demon- strated their superiority to state-of-the-art competitors. As a nice try for interpretable deep learning, we further pr opose an impor- tance analysis method for identifying important factors for time series analysis, which in turn veries the interpretability merit of mWDN. REFERENCES [1] Anthony Bagnall, Jason Lines, Jon Hills, and Aaron Bostrom. 2015. Time-series classication with CO TE: the collective of transformation-based ensembles. IEEE TKDE 27, 9 (2015), 2522–2535. [2] Donald J Berndt and James Cliord. 1994. Using dynamic time warping to nd patterns in time series. In KDD ’94 , V ol. 10. Seattle, W A, 359–370. [3] George EP Box and David A Pierce. 1970. Distribution of residual autocorrelations in autoregressive-integrated moving average time series models. Journal of the A merican statistical Association 65, 332 (1970), 1509–1526. [4] Y anping Chen, Eamonn K eogh, Bing Hu, Nurjahan Begum, Anthony Bagnall, Abdullah Mueen, and Gustavo Batista. 2015. The UCR Time Series Classication Archive. www.cs.ucr .edu/~eamonn/time_series_data/. [5] Jerome T Connor, R Douglas Martin, and Les E Atlas. 1994. Recurrent neural networks and robust time series prediction. IEEE T NN 5, 2 (1994), 240–254. [6] Zhicheng Cui, W enlin Chen, and Yixin Chen. 2016. Multi-scale convolutional neural networks for time series classication. arXiv preprint (2016). [7] Ingrid Daubechies. 1992. T en lectures on wavelets . SIAM. [8] Houtao Deng, George Runger , Eugene T uv, and Martyanov Vladimir . 2013. A time series forest for classication and feature e xtraction. Information Sciences 239 (2013), 142–153. [9] Robert M French. 1999. Catastrophic forgetting in connectionist networks. Trends in cognitive sciences 3, 4 (1999), 128–135. [10] Felix A Gers, Douglas Eck, and Jürgen Schmidhuber . 2002. Applying LSTM to time series predictable through time-window approaches. In Neural Nets WIRN Vietri-01 . Springer , 193–200. [11] Josif Grabocka, Nicolas Schilling, Martin Wistuba, and Lars Schmidt- Thieme . 2014. Learning time-series shap elets. In KDD ’14 . A CM, 392–401. [12] Fredric J Harris. 1978. On the use of windows for harmonic analysis with the discrete Fourier transform. Proc. IEEE 66, 1 (1978), 51–83. [13] Kaiming He, Xiangyu Zhang, Shaoqing Ren, and Jian Sun. 2016. Deep residual learning for image recognition. In CVPR ’16 . 770–778. [14] Sepp Hochreiter and Jürgen Schmidhuber . 1997. Long short-term memory . Neural computation 9, 8 (1997), 1735–1780. [15] Hao Hu and Guo-Jun Qi. 2017. State-Frequency Memor y Recurrent Neural Networks. In International Conference on Machine Learning . 1568–1577. [16] Y oung-Se on Jeong, Y oung-Ji By on, Manoel Mendonca Castro-Neto, and Said M Easa. 2013. Super vised weighting-online learning algorithm for short-term trac ow prediction. IEEE T I TS 14, 4 (2013), 1700–1707. [17] Eliahu Ibraham Jury . 1964. Theor y and Application of the z- Transform Method. (1964). [18] Eamonn Keogh and Chotirat Ann Ratanamahatana. 2005. Exact indexing of dynamic time warping. Knowledge and Information Systems 7, 3 (2005), 358–386. [19] Jan Koutnik, Klaus Gre, Faustino Gomez, and Juergen Schmidhuber . 2014. A clockwork rnn. In International Conference on Machine Learning . 1863–1871. [20] Martin Längkvist, Lars K arlsson, and Amy Lout. 2014. A revie w of unsupervised feature learning and deep learning for time-series modeling. Pattern Recognition Letters 42 (2014), 11–24. [21] Sangsoo Lee and Daniel Fambro. 1999. Application of subset autoregressive inte- grated moving average model for short-term freeway trac volume forecasting. Transportation Research Record: Journal of the Transportation Research Board 1678 (1999), 179–188. [22] Jessica Lin, Eamonn K eogh, Stefano Lonardi, and Bill Chiu. 2003. A symbolic representation of time series, with implications for streaming algorithms. In SIGMOD’03 workshop on Research issues in DMKD . ACM, 2–11. [23] Jason Lines and Anthony Bagnall. 2015. Time series classication with ensembles of elastic distance measures. Data Mining and Knowledge Discovery 29, 3 (2015), 565–592. [24] Hui Liu, Hong-qi Tian, Di-fu Pan, and Y an-fei Li. 2013. For ecasting models for wind speed using wavelet, wavelet packet, time series and Articial Neural Networks. Applied Energy 107 (2013), 191–208. [25] Yisheng Lv , Y anjie Duan, W enwen Kang, Zhengxi Li, and Fei- Y ue W ang. 2015. Trac ow prediction with big data: A deep learning approach. IEEE T I TS 16, 2 (2015), 865–873. [26] Stephane G Mallat. 1989. A theory for multiresolution signal de composition: the wavelet representation. IEEE T P AMI 11, 7 (1989), 674–693. [27] Y ao Qin, Dongjin Song, Haifeng Cheng, W ei Cheng, Guofei Jiang, and Garrison Cottrell. 2017. A dual-stage attention-based recurrent neural network for time series prediction. arXiv preprint arXiv:1704.02971 (2017). [28] Pranav Rajpurkar , A wni Y Hannun, Masoumeh Haghpanahi, Codie Bourn, and Andrew Y Ng. 2017. Cardiologist-Level Arrhythmia Detection with Convolutional Neural Networks. arXiv preprint arXiv:1707.01836 (2017). [29] Alistair CH Rowe and Paul C Abbott. 1995. Daubechies wavelets and mathematica. Computers in P hysics 9, 6 (1995), 635–648. [30] Xin Song, Yuanxin Ouyang, Bow en Du, Jingyuan W ang, and Zhang Xiong. 2017. Recovering Individualąŕs Commute Routes Based on Mobile P hone Data. Mobile Information Systems,2017,(2017-02-9) 2017, 18 (2017), 1–11. [31] Jingyuan W ang, Chao Chen, Junjie W u, and Zhang Xiong. 2017. No Longer Sleeping with a Bomb: A Duet System for Protecting Urban Safety from Danger- ous Goods. In Proceedings of the 23rd ACM SIGKDD International Conference on Knowledge Discovery and Data Mining . ACM, 1673–1681. [32] Jingyuan W ang, Fei Gao, Peng Cui, Chao Li, and Zhang Xiong. 2014. Discov ering urban spatio-temporal structure from time-evolving trac networks. In Proceed- ings of the 16th Asia-Pacic W eb Conference . Springer International Publishing, 93–104. [33] Jingyuan W ang, Qian Gu, Junjie Wu, Guannan Liu, and Zhang Xiong. 2016. Trac speed prediction and congestion source exploration: A deep learning method. In Data Mining (ICDM), 2016 IEEE 16th International Conference on . IEEE, 499–508. [34] Jingyuan W ang, Xu He, Ze W ang, Junjie Wu Wu, Nicholas Jing Y uan, Xing Xie, and Zhang Xiong. 2018. CD-CNN: A Partially Super vised Cross-Domain Deep Learning Model for Urban Resident Recognition. In Proceedings of the 32nd AAAI Conference on Articial Intelligence . [35] Jingyuan Wang, Y ating Lin, Junjie Wu, Zhong W ang, and Zhang Xiong. 2017. Coupling Implicit and Explicit Knowledge for Customer V olume Prediction. In Proceedings of the 31st AAAI Conference on Articial Intelligence . 1569–1575. [36] Jingyuan W ang, Y u Mao, Jing Li, Zhang Xiong, and W en-Xu W ang. 2014. Pre- dictability of road trac and congestion in urban areas. P los One 10, 4 (2014), e0121825. [37] Liwei Wang, Chen- Y u Lee, Zhuow en Tu, and Svetlana Lazebnik. 2015. Train- ing deeper convolutional networks with deep supervision. arXiv preprint arXiv:1505.02496 (2015). [38] Zhiguang W ang, W eizhong Y an, and Tim Oates. 2017. Time series classication from scratch with deep neural networks: A strong baseline . In IJCNN ’17 . IEEE, 1578–1585. [39] Billy M Williams and Lester A Hoel. 2003. Modeling and forecasting vehicular trac ow as a seasonal ARIMA process: Theoretical basis and empirical results. Journal of Transportation Engineering 129, 6 (2003), 664–672. [40] Ronald J Williams and David Zipser . 1989. A learning algorithm for continually running fully recurrent neural networks. Neural computation 1, 2 (1989), 270–280. [41] G Peter Zhang. 2003. Time series forecasting using a hybrid ARIMA and neural network model. Neurocomputing 50 (2003), 159–175. [42] Yi Zheng, Qi Liu, Enhong Chen, Y ong Ge, and J Leon Zhao. 2016. Exploiting multi-channels deep convolutional neural networks for multivariate time series classication. Frontiers of Computer Science 10, 1 (2016), 96–112. APPENDIX In a neural network model, the outputs of the layer l are connected as the inputs of the layer l + 1 . According to the chain rule, the partial derivative of the model M to middle layer outputs could be calculated layer-by-layer as ∂ M ∂ a ( l ) i = Õ j ∂ M ∂ a ( l + 1 ) j ∂ a ( l + 1 ) j ∂ a ( l ) i , (24) where a ( l ) i is the i -th output of the layer l . The proposed models con- tain types of layers: the convolutional, LSTM and fully connected layers, which are discussed below . For convolutional layers, only 1D convolutional operation is used in our cases. The output of the layer l is a matrix with the size of L × 1 × C , which is connected to neural matrix of the l + 1 -th with a convolutional kernel in the size of k × 1 × C . The partial derivative of M to the i t h output of the layer l is calculated as ∂ M ∂ a ( l ) i = k − 1 Õ n = 0 ∂ M ∂ a ( l + 1 ) i − n ∂ a ( l + 1 ) i − n ∂ a ( l ) i = k − 1 Õ n = 0 δ ( l + 1 ) i − n w ( l + 1 ) n f ′ a ( l ) i , where w n denotes the n -th element of the convolutional kernel, δ ( l ) i = ∂ M ∂ a ( l ) i , and f ′ a ( l ) i is the derivative of activation function. For LSTM laysers, we denote the output of a LSTM unit in layer l + 1 at time t as a t , ( l + 1 ) i = f b t , ( l ) , where b t ( l ) is calculated as b t , ( l ) = Õ i w a i a t , ( l ) i + Õ i w b i b t − 1 , ( l ) i + Õ i w s i s t − 1 , ( l ) i . s t − 1 , ( l ) i is the history state that is saved in the memor y cell. There- fore, the partial derivative of M to the a t , ( l ) i is calculated as ∂ M ∂ a ( l ) i = Õ t ∂ M ∂ b t , ( l ) ∂ b t , ( l ) ∂ a t , ( l ) i = Õ t δ t , ( l + 1 ) i f ′ ( b t , ( l ) ) θ t , ( l ) i , where θ t , ( l ) i is an equation as θ t , ( l ) i = © « w a i + w b i ∂ b t + 1 , ( l ) ∂ a t + 1 , ( l ) i + w s i ∂ s t + 1 , ( l ) ∂ a t + 1 , ( l ) i ª ® ¬ . The derivative ∂ s t , ( l ) ∂ a t , ( l ) i in the above equation is calculated as ∂ s t , ( l ) ∂ a t , ( l ) i = s t − 1 , ( l ) ∂ b t , ( l ) ∂ a t , ( l ) i + ∂ b t , ( l ) ∂ a t , ( l ) i f ( a t , ( l ) i ) + b t , ( l ) f ′ ( a t , ( l ) i ) . For fully connect layers, the output a ( l ) i = f ( w i a ( l − 1 ) i + b ) . Then the partial derivative is equal to w i f ′ ( w i a ( l − 1 ) i + b ) .
Original Paper
Loading high-quality paper...
Comments & Academic Discussion
Loading comments...
Leave a Comment