Speaker Clustering Using Dominant Sets
Speaker clustering is the task of forming speaker-specific groups based on a set of utterances. In this paper, we address this task by using Dominant Sets (DS). DS is a graph-based clustering algorithm with interesting properties that fits well to ou…
Authors: Feliks Hibraj, Sebastiano Vascon, Thilo Stadelmann
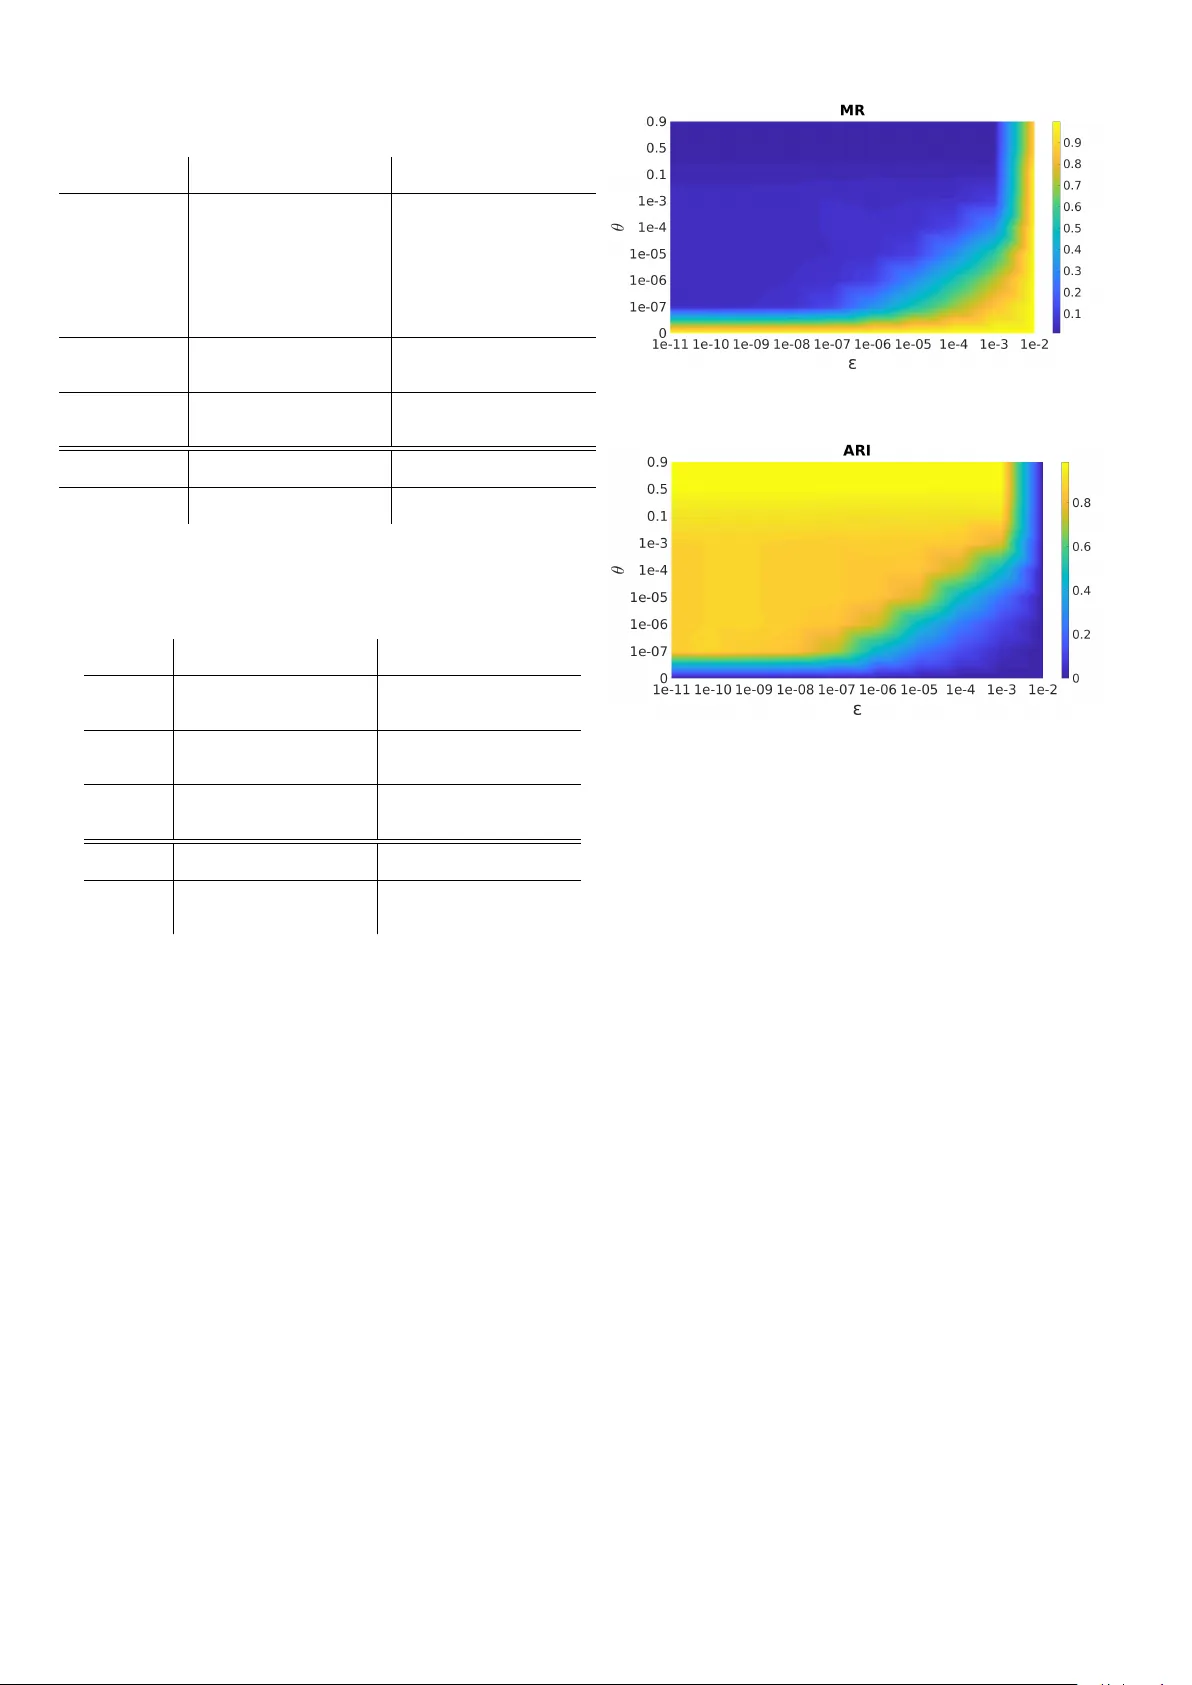
Speaker Clustering Using Dominant Sets Feliks Hibraj* Ca’ Foscari Uni versity V enice, Italy feliks.hibraj@gmail.com Sebastiano V ascon* Ca’ Foscari Uni versity V enice, Italy sebastiano.vascon@uni ve.it Thilo Stadelmann ZHA W Datalab W interthur , Switzerland stdm@zhaw .ch Marcello Pelillo Ca’ Foscari Uni versity V enice, Italy pelillo@univ e.it Abstract —Speaker clustering is the task of forming speaker - specific groups based on a set of utterances. In this paper , we address this task by using Dominant Sets (DS). DS is a graph- based clustering algorithm with interesting properties that fits well to our problem and has never been applied befor e to speaker clustering. W e report on a comprehensive set of experiments on the TIMIT dataset against standard clustering techniques and specific speaker clustering methods. Moreover , we compare performances under different features by using ones learned via deep neural network directly on TIMIT and other ones extracted from a pre-trained VGGV ox net. T o asses the stability , we perform a sensitivity analysis on the free parameters of our method, showing that performance is stable under parameter changes. The extensive experimentation carried out confirms the validity of the proposed method, reporting state-of-the-art results under three different standard metrics. W e also report refer ence baseline results for speaker clustering on the entire TIMIT dataset for the first time. I . I N T R O D U C T IO N Speaker clustering (SC) is the task of identifying the unique speakers in a set of audio recordings (each belonging to exactly one speaker) without kno wing who and how many speakers are present altogether [1]. Other tasks related to speaker recognition and SC are the following: • Speaker verification (SV): A binary decision task in which the goal is to decide if a recording belongs to a certain person or not. • Speaker identification (SI): A multiclass classification task in which to decide to whom out of n speakers a certain recording belongs. SC is also referred to as speaker diarization when a single (usually long) recording in volv es multiple speakers and thus needs to be automatically segmented prior to clustering. Since SC is a completely unsupervised problem (the number of speakers and segments per speaker is unknown), it is straight- forward to note that it is considered of higher complexity with respect to both SV and SI. The complexity of SC is comparable to the problem of image segmentation in computer vision, in which the number of regions to be found is typically unknown. The SC problem is of importance in the domain of audio analysis due to many possible applications, for example in lec- ture/meeting recording summarization [2], as a pre-processing * = Equal contribution step in automatic speech recognition, or as part of an informa- tion retrie val system for audio archives [3]. Furthermore, SC represents a building block for speaker diarization [4]. The SC problem has been widely studied [5], [6]. A typical pipeline is based on three main steps: i.a) acoustic feature extraction from audio samples, i.b) voice feature aggregation from the lower-le vel acoustic features by means of a speaker modeling stage, and ii) a clustering technique on top of this feature-based representation. The voice features after phase i) have been traditionally created based on Mel Frequency Cepstral Coefficient (MFCC) acoustic features modeled by a Gaussian Mixture Model (GMM) [7], or i-vectors [8], [9]. More recently , with the rise of deep learning, the community is moving towards learned features instead of hand-crafted ones, as surve yed by Richardson et al. [10]. Recent examples of deep-feature representations for SI, SV , and SC problems come for example from Lukic et al. [11], after Con volutional neural networks (CNN) hav e been introduced in the speech processing field by LeCun et al. already in the nineties [12]. McLaren et al. used a CNN for speaker recognition in order to improve robustness to noisy speech [13]. Chen et al. used a novel deep neural architecture to learn speaker specific characteristics directly from MFCC features [14]. Y ella et al. exploited the capabilities of an artificial neural network of 3 layers to extract features directly from a hidden layer , which are used for speaker clustering [15]. Howe ver advanced phase i) has become during the last years, the clustering phase ii) still relies on traditional method- ologies. For example, Khoury et al. demonstrated good results for speaker clustering using a hierarchical clustering algorithm [16], while Kenn y et al. report hierarchical clustering to be unsuitable for the speaker clustering stage in a speaker diarization system [17]. In [18] they performed clustering with K-means on dimensionality-reduced i-v ectors which sho wed to work better than spectral clustering as noted in [4]. In this paper , we therefore improv e the results of the speaker clustering task by first using state-of-art learned features and then, a different and more robust clustering algorithm, dominant sets (DS) [19]. The motiv ation driving the choice of dominant sets is the follo wing: a) no need for an a-priori number of clusters; b) having a notion of compactness to be able to automatically detect clusters composed of noise; c) for each cluster the centrality of each element is quantified (centroids emerge naturally in this context); and d) extensiv e 9.44e-08 ... 2.32e-08 2.12e-04 ... 1.04e-08 2.61e-04 ... 4.98e-07 4.20e-09 ... 4.55e-07 3.82e-07 ... 3.14e-02 0 1 m 0 1 m 0 1 m 0 1 m 0 1 m Fig. 1. Pipeline of the overall sequence of elaborations: voices → spectrograms → CNN → feature vectors → graph → Dominant Set → clusters. experimentations and the underlying theory prove a high robustness to noise [19]. All the aforementioned properties perfectly fit the SC problem. The contribution of this paper is three-fold: first, we apply the dominant set method for the first time in the SC domain, outperforming the pre vious state of the art; second, it is the first time that the full TIMIT dataset [20] is used for SC problems, making this paper a reference baseline in this context and on this dataset; third, we use for the first time a pre-trained VGGV ox 1 network to extract features for the TIMIT dataset, obtaining good results and demonstrating the capability of this embedding. The remainder of this paper is organized as follow: in Sec II the proposed method is explained in detail (with Sec II-A having explanations for the dif ferent feature extraction methods, and Sec II-B having an introduction to the theoretical foundations of DS). In Sec III the experiments that hav e been carried out are explained and in Sec IV we discuss the results before drawing conclusions in Sec V together with future perspectiv es. I I . S P E A K E R C L U S T E R I N G W I T H D O M I N A N T S E T S Our proposed approach, called SCDS is based on the two- phase schema (see Fig.1): the first part in which features are extracted from each utterance and the second one in which from this feature-based representation the dominant sets are extracted. In this section, the specific parts are explained. A. F eatur es extr action W e use two dif ferent feature extraction methods in this work that we call CNN-T (deriv ed from embeddings based on the TIMIT dataset), and CNN-V (based on a model trained on V oxCeleb [21]): 1) CNN-T featur es: Features are extracted from the CNN 2 described in detail by Lukic et al. [22], specifically from the dense layer L7 therein. The network has been trained on 590 speakers of the TIMIT database that hav e been fed to the net as spectrograms deriv ed from the corresponding utterances, and yields 1,000-dimensional feature vectors. 2) CNN-V featur es: Features are extracted from the pub- lished VGGV ox model trained on the 100,000 utterances of the V oxCeleb dataset [21]. Since the domain of V oxCeleb and TIMIT are similar, we expect to ha ve good performances on the latter . VGGV ox is based on the VGG-M con volutional architecture [23] which was previously used for image data, adapted for spectrogram input. W e get 1,024-dimensional features from the FC7 layer as in the original publication. 1 https://github .com/a- nagrani/VGGV ox 2 https://github .com/stdm/ZHA W deep voice B. Dominant Set clustering Dominant set clustering is a graph-based method that gen- eralizes the problem of finding a maximal clique to edge- weighted graphs. A natural application of this method is for partitioning (clustering) a graph into disjoint sets. In this framework, a dataset is modeled as an undirected edge- weighted graph G = ( V , E , w ) with no self loops, in which the nodes V are the items of the dataset (represented by feature vectors). The edges E ⊆ V × V are the pairwise relations between nodes and their weight function ω : E → R ≥ 0 calculates pairwise similarities. The n × n symmetric adjacency matrix A = ( a ij ) is employed to summarize G : a ij = w ( i, j ) if ( i, j ) ∈ E 0 otherwise. T ypically with ev ery clustering method two properties shall hold: the intra-cluster homogeneity is high while inter-cluster homogeneity is low . These two properties are important in order to separate and group objects in the best possible way . They are directly reflected in the combinatorial formulation of DS (see [19] for the details). Pav an and Pelillo propose an intriguing connection between clusters, dominant sets and local solutions of the following quadratic problem [19]: maximize x T A x (1) subject to x ∈ 4 n where A is the similarity matrix of the graph and x is the so- called characteristic vector which lies in the n-dimensional simplex 4 n , that is, ( P i x i = 1 , ∀ i x i ≥ 0) . The components of vector x represent the likelihood of each element to belong to the cluster , the higher the score the higher the chance of being part of it. If x is a strict local solution of (1) then its support σ ( x ) = { i ∈ V | x i > 0 } is a dominant set. In order to extract a DS, a local solution of (1) must be found. A method to solve this problem is to use a result from ev olutionary game theory [24] known as r eplicator dynamic (RD) (see Eq. 2). x i ( t + 1) = x i ( t ) ( A x ( t )) i x ( t ) T A x ( t ) (2) RD is a dynamical system that operates a selection process ov er the components of the vector x . At con ver gence of Eq. 1 ( || ( x ( t ) − x ( t + 1)) || 2 ≤ ) , certain components will emerge ( x i > 0 ) while others will get extinct ( x i = 0 ). In practical cases, if these last components of x are not exactly equal to zero then a thresholding ( x i > θ ) is performed. The con ver gence of the process is guaranteed if the matrix A is non-negati ve and symmetric. The dynamical system starts at the barycenter of the simplex and its components are updated using Eq. 2. Deciding upon a cutoff threshold θ is not obvious. Instead of using a predefined value, we prefer to employ the approach proposed by V ascon et al. [25], [26]. The parameter is com- puted based on the following idea: it decides the minimum degree of participation of an element to a cluster and is relati ve to the participation of the centroid. The support for each dominant set becomes σ ( x ) = { i ∈ V | x i > θ ∗ max ( x ) } with θ ∈ [0 , 1) (see Sec. IV -E for sensitivity analysis on the parameters). At each iteration a dominant set is extracted and its subsets of nodes are remov ed from the graph (this is called peeling-off strategy). The process iterates on the remaining nodes until all are assigned to a cluster . C. Similarity measure T o compute weights on edges of graph G we use the cosine distance to construct a similarity function. The cosine distance has been chosen because it showed good performance on SC tasks [16], [18], [21]. Giv en two utterances and their m - dimensional feature vectors f i and f j , we apply the following function: ω ( f i , f j ) = exp − d ( f i , f j ) σ (3) where d is the cosine distance between given features, and σ is the similarity scaling parameter . Setting the parameter σ is often problematic and typically requires a grid search over a range of plausible v alues or a cross-validation. In this work, we decided to use a principle heuristic from spectral clustering [27] which prov ed to work well also in other works [28], [29]. Based on [27] and [29] we tested a local scaling parameter σ i for each utterance to be clustered. This means that in (3) our parameter σ = σ i σ j depends on local neighborhoods of giv en features f i and f j and it is determined as follows: σ i = 1 | N i | X k ∈ N i d ( f i , f k ) (4) where N i represents the nearest neighborhood of element i . In our experiments we used | N i | = 7 as in [29]. D. Cluster labeling Once all dominant sets are extracted, the final step is to label each partition such that each speaker is in one-to-one correspondence with a cluster . The labels of the data are then used to perform the assignment. W e tested two approaches for cluster labeling: 1) Max: a prototype selection method which assigns cluster labels using the class of the element with maximum partic- ipation in the characteristic vector [25]. Labels are unique, and in case 2 dif ferent clusters share their labels, the latter one is considered completely mistaken, increasing error in the ev aluation. T ABLE I D AT A S ET S U SE D I N T H I S PAP E R . Acronym #POIs #Utt/POI Utterances TIMIT Small [31] T imitS 40 2 80 TIMIT Full [20] T imitF 630 2 1260 2) Hungarian: with this approach, each cluster is labeled using the Munkres (aka Hungarian) method [30]. The cost c i,j of assigning a cluster i to a particular label j is computed as the number of elements of class j in the cluster i . Since the method minimizes the total cost of assignments, the value of c i,j is changed to ˆ c i,j = max( c ) − c i,j . This turns the minimization problem to a maximization one, where max( c ) is the maximum cost ov er all the assignments. I I I . E X P E R I M E N T S A. Datasets & data prepar ation W e e valuate our method on the TIMIT dataset, presented as TIMIT Small and TIMIT Full (see T able III-A). The dataset is composed of 6,300 phrases (10 phrases per speaker), spoken by 438 males (70%) and 192 females (30%). Speakers coming from 8 different regions and having different dialects. The phrases of each speaker have been divided into 2 parts in accordance with previous research [11], [22], [31]. In our experimentation we used the same 40 speakers dataset as reported by these earlier attempts (here called TIMIT Small), and the full TIMIT set composed by 630 speakers. Note that TIMIT Small is disjoint with the training set of CNN-T . This dataset is suited to our work because we are not dealing with noise, segmentation or similar diarization problems. B. Comparison to other methods The proposed method has been compared with the state of the art [11], [22], [31] and with other clustering techniques like spectral clustering (SP), k-means (KM) and hierarchical clustering (HC). Given the fact that our proposed method is completely unsupervised (in particular , there is no knowledge a-priori of the number of clusters), we tested some heuris- tics to estimate k also for the aforementioned algorithms. Specifically , the Eigengap heuristic [32] and the number of clusters found by our method are used. Moreover , we chose affinity propagation (AP) [33] and HDBSCAN [34] because they do not require an a-priori k . In order to fairly compare our method, we tested them with the best settings. Specifically for HC and KM, cosine distance was the best choice, while for SP we used RBF kernel with γ parameter found through an extensiv e grid search. The cut on HC has been set such that the error is minimized as in [22]. For AP we used the same similarity measure of SCDS while for HDBSCAN the Euclidean distance and minimum number of points per cluster equal to 2 were used. C. Evaluation criteria T o e valuate the clustering quality we used three distinct metrics: the misclassification rate (MR) [35], the adjusted RAND index (ARI) [36] and the averag e cluster purity (A CP) [37]. The usage of different metrics is important because each of them gi ves a different perspective on results: MR quantifies how many labels of speakers are inferred correctly from clus- ters while ARI and A CP are measures of grouping/separation performance on utterances. Formally , giv en a one-to-one mapping between clusters and labels (see Sec II-D), MR is defined as M R = 1 N P N s j =1 e j where N is the total number of audio segments to cluster , N s the number of speakers, and e j the number of segments of speaker j classified incorrectly . Cluster purity is a measure to determine how pure clusters are. If a cluster is composed of utterances belonging to the same speaker, then it is completely pure, otherwise (i.e., other speakers are in that cluster , too) purity decreases. Formally , av erage cluster purity is defined as: acp = 1 N N c X i =1 p i. · n i. , where p i. = N s X j =1 n 2 ij /n 2 i. N c is the number of clusters, n ij utterances in cluster i spoken by speaker j and n i. is the size of cluster i . The ARI finally is the normalized version of RAND index [38], with maximum value 1 for perfectly assigned clusters with respect to the expected ones. D. Experimental setup Our proposed method is e valuated in experiments composed as follows: giv en a set of audio utterances, features are extracted following one of the methods in Sec II-A and the affinity matrix is computed as in Sec II-C. Subsequently , the DS are found on top of this graph-based representation. Labeling is performed on each cluster following the method- ology proposed in Sec II-D. The goodness of clusters are then ev aluated using the metrics in Sec III-C. The summarized results are reported in T ables II and III and discussed in the next section. The hyper parameters for all experiments are set to θ = 0 . 1 and ε = 1 e − 6 . I V . R E S U LT S In this section, the results of a series of analyses are reported, followed by an overall discussion. A. Initialization of k in the competitors DS does not need an a-priori number of clusters, while the supervised competitors do. In order to make a fair comparison with standard approaches (HC, KM and SP), we used as k : the correct number of clusters to be found (symbol ♦ in tables II and III), the number of clusters found by DS (symbol k in the tables) and the number of clusters estimated with Eigengap (symbol # in tables). Experimental results show that ev en when the correct num- ber of clusters is provided, SCDS still achiev es more desirable results (see tables). This means that not only our method is able to recover a number of clusters close to the right one, but also that it is able to extract much more correct partitions. And when the number of clusters found by DS is given to the other methods, results obtained are plausible, showing that our method is able to grasp a good number of clusters while with standard heuristics the performance drops strongly . B. Analysis of differ ent featur e extraction methods In the next experiments, we tested the two CNN-based features, CNN-T and CNN-V . Both provide good features in term of capacity to discriminate speakers. With the CNN-T features, the performance of our method saturates on TIMIT Small (see last rows of T able II) and reaches almost perfect performances on TIMIT Full (see last rows of T able III). This is mainly explained by the fact that the network used to extract the CNN-T embeddings has been trained in using the remaining 590 of the 630 TMIT speakers [22], thus biasedly performing well on the entire dataset. Surprisingly , features obtained from VGGV ox are so generic that they allow almost the same performances for SCDS. This approach is also beneficial for competitors, and in fact all of them have better performances in term of MR/ARI/A CP with CNN-V features rather than CNN-T ones (except for KM). C. Cluster labeling W e tested two methods for labeling clusters for our approach (see Max and Hungarian in Sec II-D), while for all the other competitors we used only the Hungarian algorithm since Max is a peculiarity of DS. Under all conditions and datasets both labeling methods perform the same (see last rows of results where Max = SCDS ? , Hungarian = SCDS). Labeling with Max method comes for free directly from DS theory , while applying the Hungarian method has its computational cost. D. Metrics comparison The three metrics (MR, ARI and ACP) are important to be analyzed in conjunction because they capture different aspects of the result. Having the lowest MR in the final results in both datasets emphasize the fact that we are correctly labeling clusters and that the number of miss-classified samples is extremely low . On the other side, reaching the highest value in ARI shows that our method obtains a good partitioning of the data with respect to the expected clusters. Furthermore, having the higher A CP confirms that clusters extracted with SCDS are mainly composed by utterances from the same speaker . The proposed method reaches best scores on all metrics simultaneously . Indeed, other methods reach similar perfor- mances, in particular on TIMIT Small (like HC, AP), but none of them work as well as our in the most complex experimental setting used, TIMIT Full with VGGV ox features (where no knowledge of the actual voices to be clustered could possibly enter the features and thus the clustering system). E. Sensitivity analysis Finally , we report the results of a sensitivity analysis on the two free-parameters of our method under two metrics (see Fig 2 and 3), the precision ε of Replicator Dynamics (see Eq. 2) and the relative cut-of f θ (see Sec. II-B). The analysis has been carried out on TIMIT Full with VGGV ox features because under this setting a certain amount of variability on results is observed, which made this analysis interesting. The search space for the parameters is as follows: θ ∈ [0 . 0 , 0 . 9995] and ε ∈ [1 e − 11 , 1 e − 2] . The choice has been made on these T ABLE II C L US T E R IN G R ES U LTS O N T H E T I M I T S M AL L DA TA SE T . SMALL TIMIT CNN-T Features CNN-V Features MR ↓ ARI ↑ A CP ↑ MR ↓ ARI ↑ A CP ↑ HC ♦ 0.0250 0.9259 0.9667 0.0000 1.0000 1.0000 HC [22] 0.0500 - - - - - Adadelta 20k [11] 0.0500 - - - - - Adadelta 30k [11] 0.0500 - - - - - ν -SVM [31] 0.0600 - - - - - GMM/MFCC [31] 0.1300 - - - - - SP ♦ 0.0750 0.8422 0.9500 0.0000 1.0000 1.0000 KM ♦ 0.0250 0.9259 0.9667 0.0375 0.9390 0.9750 HC k 0.0250 0.9259 0.9667 0.0000 1.0000 1.0000 SP k 0.0750 0.8422 0.9500 0.0000 1.0000 1.0000 KM k 0.0250 0.9259 0.9667 0.0375 0.9390 0.9750 HC # 0.4500 0.4234 0.5500 0.6750 0.2466 0.3250 SP # 0.4500 0.0827 0.5500 0.6750 0.1751 0.3038 KM # 0.4500 0.3543 0.5267 0.6750 0.1746 0.3193 AP 0.0500 0.8951 0.9416 0.0000 1.0000 1.0000 HDBS 0.1000 0.8056 0.8833 0.0750 0.8422 0.9083 SCDS 0.0000 1.0000 1.0000 0.0000 1.0000 1.0000 SCDS ? 0.0000 1.0000 1.0000 0.0000 1.0000 1.0000 T ABLE III C L US T E R IN G R ES U LTS O N T H E T I M I T F U LL DAT A S ET . FULL TIMIT CNN-T Features CNN-V Features MR ↓ ARI ↑ A CP ↑ MR ↓ ARI ↑ A CP ↑ HC ♦ 0.0770 0.8341 0.9283 0.0571 0.8809 0.9484 SP ♦ 0.2294 0.0432 0.8355 0.0675 0.5721 0.9488 KM ♦ 0.1071 0.7752 0.9071 0.1286 0.6982 0.8730 HC k 0.0762 0.8343 0.9280 0.0706 0.8502 0.9295 SP k 0.2341 0.0421 0.8332 0.0635 0.4386 0.9427 KM k 0.1079 0.7682 0.9007 0.1429 0.6646 0.8485 HC # 0.9921 0.0050 0.0079 0.9984 0.0000 0.0016 SP # 0.9921 0.0003 0.0075 0.9984 0.0000 0.0016 KM # 0.9921 0.0052 0.0076 0.9984 0.0000 0.0016 AP 0.0753 0.8330 0.9030 0.1396 0.7127 0.8222 HDBS 0.1825 0.6214 0.7825 0.3000 0.4112 0.6527 SCDS 0.0048 0.9897 0.9947 0.0349 0.9167 0.9578 SCDS ? 0.0048 0.9897 0.9947 0.0349 0.9167 0.9578 SCDSbest 0.0032 0.9929 0.9966 0.0024 0.9944 0.9974 extremal points for the following reasons: a low value, e.g. θ = 0 . 0005 , means that a point belongs to a cluster if and only if its lev el of participation in the cluster with respect to the centroid is at least θ × centrality of the centroid. Instead, θ = 0 . 9995 means that the centroid and the sample must be almost exactly the same. In the first case we are creating clusters which span widely in terms of similarities of its elements, while in the latter case we create clusters composed by very similar elements. Regarding the parameter ε , when it is set to 1 e − 11 , it requires that two successive steps in Eq. 2 are very close to each other while in the case 1 e − 2 we allow for a coarse equilibrium point. Changes in both variables showed that the area in which the performances are stable is large (see the blue area in Fig 2 and yellow area in Fig 3). Only when extremal values of parameters are used the performances drops. The best parameter choice (CNN-T : θ = 0 . 15 , ε = 1 e − 6 ; CNN-V : θ = 0 . 67 , ε = 1 e − 7 ) is shown in T able III as SCDSbest. Fig. 2. Sensitivity of ε and θ with respect to the MR measure. Fig. 3. Sensitivity of ε and θ with respect to the ARI measure. F . Overall discussion From a global perspectiv e we can say that the proposed SCDS method performs better than the alternativ es on the used datasets, outperforming the state-of-the-art and sho wing a more adaptiv e response also with a pre-trained model on a different dataset. In particular , this is evident in TIMIT Full, where better performances than competitors are achiev ed ev en when they are gi ven the right number of clusters to be found. It is worth to note that our clustering method has only two parameters to set, which are both very insensitiv e to variation as shown in the sensitivity analysis. Interesting to note, an analysis of misclassified speakers shows that if a speaker is wrongly clustered by DS, it is also wrongly clustered by all other methods. This gi ves rise to the assumption that in these cases the extracted features may be the reason for the error rather than the clustering approach used. V . C O N C L U S I O N S In this paper , we hav e proposed a nov el pipeline for speaker clustering. The proposed method is based on the dominant set clustering algorithm which has been applied to this domain for the first time. It outperforms the previous state of the art and other clustering techniques. W e proposed a method which is almost parameter-less – the two free parameters do not affect too much the results, testifying to its stability . Moreov er , we successfully used a pre-trained CNN model on a different dataset and report reasonable speaker clustering performance on the TIMIT Full dataset for the first time (after the 99 . 84 % MR reported by Stadelmann and Freisleben using a classical pipeline [31]). Now that we reached a good starting point with noise-free utterances we can start considering more complex datasets with their relativ ely more challenging tasks (noise, segmentation, cross-talk etc.). Future work also includes improving the features using the siamese network proposed by Nagrani et al. [21] to extract similarities directly . Code av ailable at https://github .com/feliksh/SCDS A C K N O W L E D G M E N T The authors would like to thank Y . Lukic for providing the MLSP features and J. Salamone for contributing to first results. R E F E R E N C E S [1] H. Beigi, Fundamentals of speaker r ecognition . Springer Science & Business Media, 2011. [2] X. Anguera, S. Bozonnet, N. Evans, C. Fredouille, G. Friedland, and O. V inyals, “Speaker diarization: A revie w of recent research, ” IEEE T ransactions on A udio, Speech, and Languag e Processing , vol. 20, no. 2, pp. 356–370, 2012. [3] J. Ajmera and C. W ooters, “ A robust speaker clustering algorithm, ” in IEEE W orkshop on Automatic Speech Recognition and Understanding , 2003. [4] S. Shum, N. Dehak, and J. Glass, “On the use of spectral and iterative methods for speaker diarization, ” in Annual Confer ence of the Interna- tional Speech Communication Association . ISCA, 2012, pp. 482–485. [5] H. Jin, F . Kubala, and R. Schwartz, “ Automatic speaker clustering, ” in Proceedings of the DARP A speech reco gnition workshop , 1997, pp. 108–111. [6] S. O. Sadjadi, T . Kheyrkhah, A. T ong, C. Greenberg, E. S. Reynolds, L. Mason, and J. Hernandez-Cordero, “The 2016 nist speaker recogni- tion e valuation, ” Interspeech , pp. 1353–1357, 2017. [7] W . M. Campbell, D. E. Sturim, and D. A. Reynolds, “Support vector machines using gmm supervectors for speaker verification, ” IEEE Signal Pr ocessing Letters , vol. 13, no. 5, pp. 308–311, 2006. [8] N. Dehak, R. Dehak, P . K enny , N. Br ¨ ummer , P . Ouellet, and P . Du- mouchel, “Support vector machines versus fast scoring in the low- dimensional total variability space for speaker verification, ” in Annual Confer ence of the International Speech Communication Association , 2009. [9] H.-S. Lee, Y . Tsao, H.-M. W ang, and S.-K. Jeng, “Clustering-based i- vector formulation for speaker recognition, ” in Annual Confer ence of the International Speech Communication Association , 2014. [10] F . Richardson, D. Reynolds, and N. Dehak, “Deep neural network ap- proaches to speaker and language recognition, ” IEEE Signal Pr ocessing Letters , vol. 22, no. 10, pp. 1671–1675, 2015. [11] Y . Lukic, C. V ogt, O. Durr, and T . Stadelmann, “Learning embeddings for speaker clustering based on voice equality , ” in IEEE International W orkshop on Machine Learning for Signal Pr ocessing (MLSP) , 2017, pp. 1–6. [12] Y . LeCun, Y . Bengio et al. , “Convolutional networks for images, speech, and time series, ” The Handbook of Brain Theory and Neural Networks , vol. 3361, no. 10, p. 1995, 1995. [13] M. McLaren, Y . Lei, N. Scheffer , and L. Ferrer, “ Application of con volutional neural networks to speaker recognition in noisy condi- tions, ” in Annual Confer ence of the International Speec h Communication Association , 2014. [14] K. Chen and A. Salman, “Learning speaker -specific characteristics with a deep neural architecture, ” IEEE Tr ansactions on Neural Networks , vol. 22, no. 11, pp. 1744–1756, 2011. [15] S. H. Y ella, A. Stolcke, and M. Slaney , “ Artificial neural network features for speaker diarization, ” in IEEE Spoken Language T echnology W orkshop (SLT) . IEEE, 2014, pp. 402–406. [16] E. Khoury , L. El Shafey , M. Ferras, and S. Marcel, “Hierarchical speaker clustering methods for the nist i-vector challenge, ” in Odyssey: The Speaker and Language Recognition W orkshop. , 2014. [17] P . K enny , D. Reynolds, and F . Castaldo, “Diarization of telephone con versations using factor analysis, ” IEEE Journal of Selected T opics in Signal Processing , vol. 4, no. 6, pp. 1059–1070, 2010. [18] S. Shum, N. Dehak, E. Chuangsuw anich, D. Reynolds, and J. Glass, “Ex- ploiting intra-conv ersation variability for speaker diarization, ” in Annual Confer ence of the International Speech Communication Association , 2011, pp. 945–948. [19] M. Pav an and M. Pelillo, “Dominant sets and pairwise clustering, ” IEEE T ransactions on P attern Analysis and Machine Intelligence , vol. 29, no. 1, pp. 167–172, 2007. [20] W . M. Fisher, G. R. Doddington, and K. M. Goudie-Marshall, “The D ARP A Speech Recognition Research Database: Specifications and Status, ” in Pr oceedings of DARP A W orkshop on Speech Recognition , 1986, pp. 93–99. [21] A. Nagrani, J. S. Chung, and A. Zisserman, “V oxceleb: a large-scale speaker identification dataset, ” in Interspeech , 2017. [22] Y . Lukic, C. V ogt, O. Drr, and T . Stadelmann, “Speaker Identification and Clustering Using Conv olutional Neural Networks, ” in IEEE Inter- national W orkshop on Machine Learning for Signal Pr ocessing (MLSP) , Sept 2016, pp. 1–6. [23] K. Chatfield, K. Simonyan, A. V edaldi, and A. Zisserman, “Return of the devil in the details: Delving deep into con volutional nets, ” in British Machine V ision Conference (BMVC) , 2014. [24] J. W . W eib ull, Evolutionary game theory . MIT press, 1997. [25] S. V ascon, M. Cristani, M. Pelillo, and V . Murino, “Using dominant sets for k-nn prototype selection, ” in International Confer ence on Image Analysis and Pr ocessing (ICIAP) , A. Petrosino, Ed. Springer Berlin Heidelberg, 2013, pp. 131–140. [26] L. Dodero, S. V ascon, L. Giancardo, A. Gozzi, D. Sona, and V . Murino, “ Automatic white matter fiber clustering using dominant sets, ” in In- ternational W orkshop on P attern Recognition in Neur oimaging (PRNI) . IEEE, 2013, pp. 216–219. [27] L. Zelnik-Manor and P . Perona, “Self-tuning spectral clustering, ” in Advances in neural information processing systems (NIPS) , 2005, pp. 1601–1608. [28] R. Tripodi, S. V ascon, and M. Pelillo, “Context aware nonnegativ e matrix factorization clustering, ” in IEEE International Confer ence on P attern Recognition (ICPR) . IEEE, 2016, pp. 1719–1724. [29] E. Zemene, L. T . Alemu, and M. Pelillo, “Dominant sets for ”constrained” image segmentation, ” CoRR , vol. abs/1707.05309, 2017. [Online]. A vailable: http://arxiv .org/abs/1707.05309 [30] H. W . Kuhn, “The hungarian method for the assignment problem, ” Naval Resear ch Logistics (NRL) , v ol. 2, no. 1-2, pp. 83–97, 1955. [31] T . Stadelmann and B. Freisleben, “Unfolding speaker clustering poten- tial: a biomi metic approach, ” in International Confer ence on Multimedia , 2009, pp. 185–194. [32] U. V on Luxburg, “ A tutorial on spectral clustering, ” Statistics and computing , v ol. 17, no. 4, pp. 395–416, 2007. [33] B. J. Frey and D. Dueck, “Clustering by passing messages between data points, ” science , vol. 315, no. 5814, pp. 972–976, 2007. [34] R. J. G. B. Campello, D. Moulavi, and J. Sander, “Density-based clustering based on hierarchical density estimates, ” in Advances in Knowledge Discovery and Data Mining , J. Pei, V . S. Tseng, L. Cao, H. Motoda, and G. Xu, Eds. Berlin, Heidelberg: Springer Berlin Heidelberg, 2013, pp. 160–172. [35] M. Kotti, V . Moschou, and C. Kotropoulos, “Revie w: Speaker segmen- tation and clustering, ” Signal Process. , vol. 88, no. 5, pp. 1091–1124, May 2008. [36] L. Hubert and P . Arabie, “Comparing partitions, ” Journal of Classifica- tion , v ol. 2, no. 1, pp. 193–218, 1985. [37] A. Solomonoff, A. Mielke, M. Schmidt, and H. Gish, “Clustering speak- ers by their voices, ” in IEEE International Conference on Acoustics, Speech and Signal Pr ocessing (ICASSP) , 1998. [38] W . M. Rand, “Objective criteria for the ev aluation of clustering meth- ods, ” Journal of the American Statistical association , vol. 66, no. 336, pp. 846–850, 1971.
Original Paper
Loading high-quality paper...
Comments & Academic Discussion
Loading comments...
Leave a Comment