CrowdMI: Multiple Imputation via Crowdsourcing
Can humans impute missing data with similar proficiency as machines? This is the question we aim to answer in this paper. We present a novel idea of converting observations with missing data in to a survey questionnaire, which is presented to crowdwo…
Authors: Lovedeep Gondara
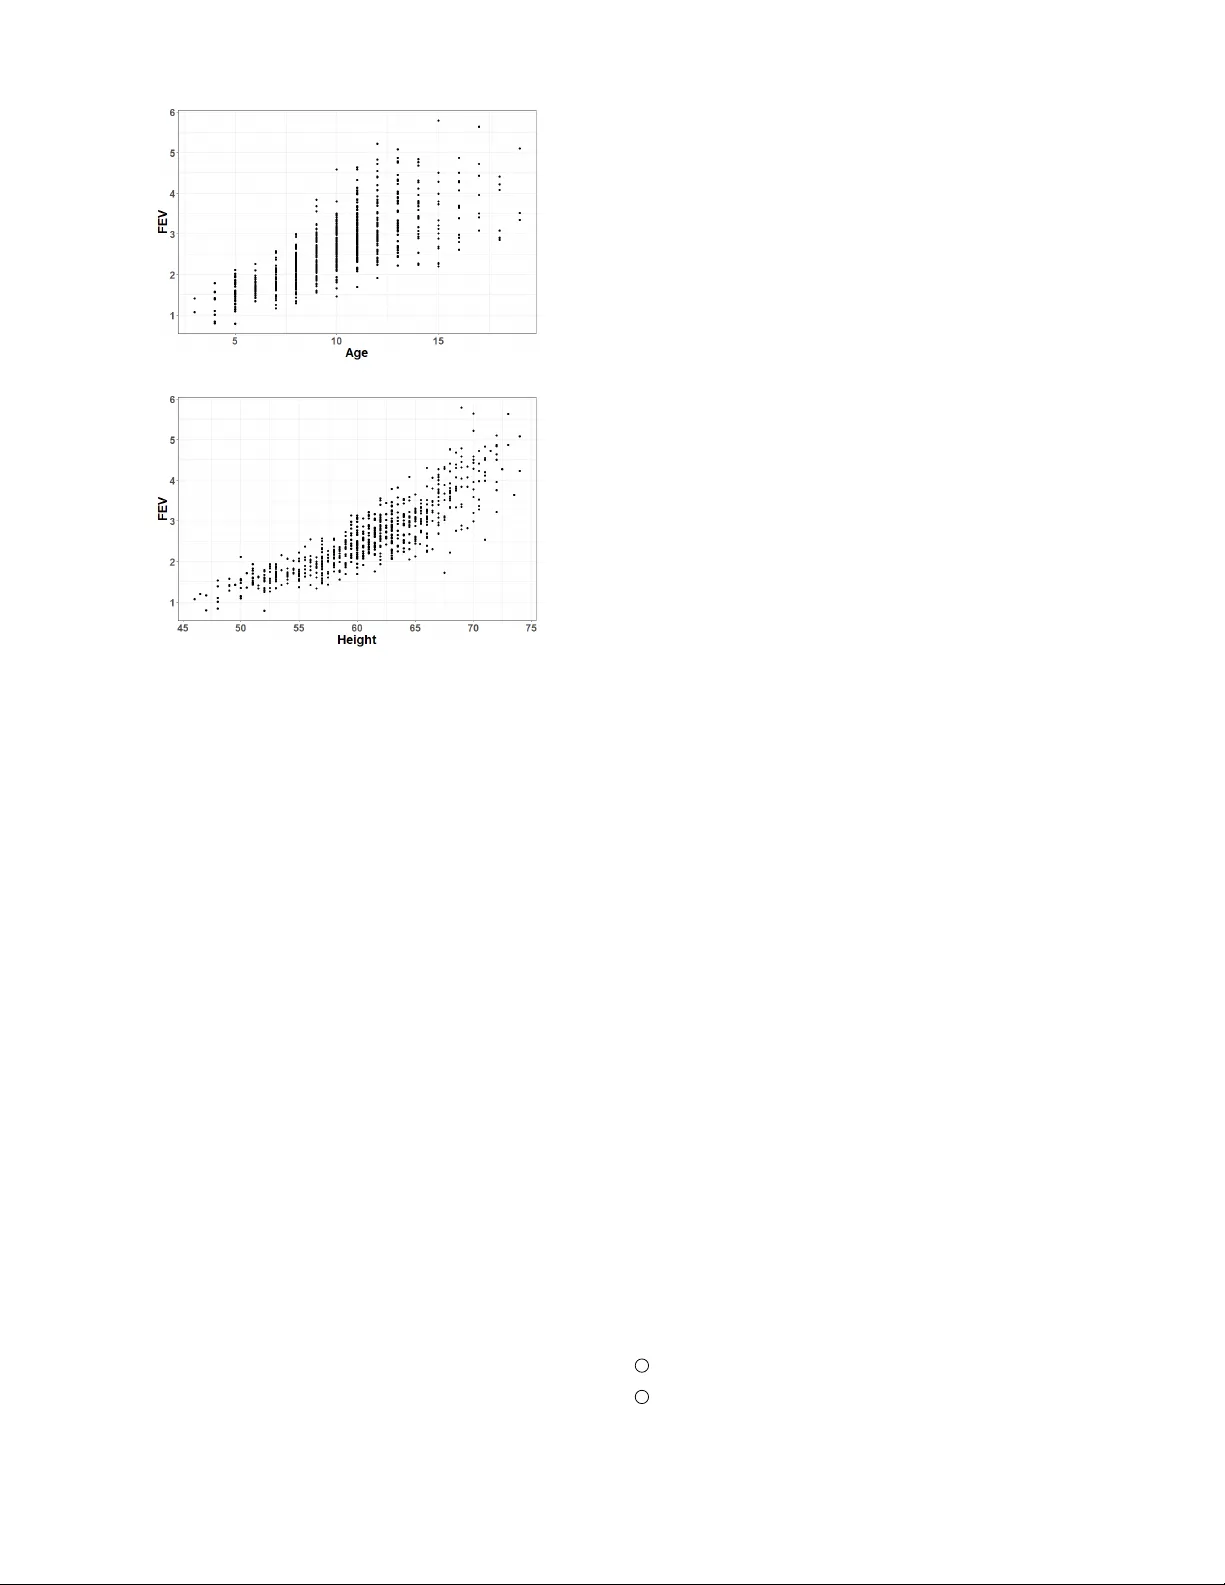
Cr owdMI: Multiple Imputation via Cro wdsour cing Lovedeep Gondara Simon Fraser Univ ersity lgondara@sfu.ca Abstract Can humans impute missing data with similar proficienc y as machines? This is the question we aim to answer in this pa- per . W e present a nov el idea of con verting observations with missing data in to a surve y questionnaire, which is presented to cro wdworkers for completion. W e replicate a multiple im- putation framew ork by having multiple unique cro wdwork ers complete our questionnaire. Experimental results demonstrate that using our method, it is possible to generate v alid imputa- tions for qualitativ e and quantitativ e missing data, with results comparable to imputations generated by complex statistical models. Introduction Missing data is unav oidable and is a significant issue im- pacting all domains. Data can be missing due to a number of reasons, including but not limited to a faulty apparatus, error prone manual data entry , non response in surve ys etc. Irrespectiv e of the cause, missing data is always undesirable. Even small proportions of missing data can seriously bias inference, resulting in erroneous conclusions. Popular and often used method for missing data is im- putation. Where we replace missing v alues with most prob- able candidates. Chosen using methods from statistics or machine learning. The methods can be as simple as replac- ing the missing observation with the average of observed values or as complicated as modelling missing data using Bayesian models or complex models from deep learning. In- stead of imputing one v alue for one missing observation. It is recommended and preferred to impute multiple slightly different v alues. This creates multiple versions of the com- plete dataset. It is done to induce variability in imputation process that accounts for the imputation error (Rubin 2004; Schafer 1999), as the true value of the missing observ ation is ne ver known. The process of creating multiple versions of complete dataset is kno wn as multiple imputation . V ari- ance in multiple imputations reflect the error in imputation process. Imputed datasets are then analyzed separately and the output is combined using the methods described by Little and Rubin (Little and Rubin 2014). Multiple imputation is the most widely used framew ork to deal with missing data. Computational imputation methods are limited by v ari- ous factors such as the sample size of training data, miss- Footnote ingness patterns, missing outliers, proper encoding of prior information etc. Crowdsourcing has recently emerged as a new tool for collecting data that is otherwise not av ailable (Franklin et al . 2011). Crowdsourcing missing information is a promising concept and has varying degrees of success where computational methods lack state-of-the-art (Brabham 2008; Leimeister et al . 2009; Goodchild and Glennon 2010; Gao, Barbier , and Goolsby 2011; Doan, Ramakrishnan, and Halevy 2011). Inspired from the unique human abilities such as the large degrees of freedom, intuitiv e reasoning and previous suc- cess of crowdsourced problems. W e propose a nov el multi- ple imputation framework based on cro wdsourcing, called CrowdMI . CrowdMI w orks by structuring missing data prob- lem as a surv ey questionnaire, which is presented to crowd- workers for completion. This study is aimed at answering the following main questions: 1. Can humans fill in (impute) missing qualitati ve and quan- titativ e data? 2. If the same missing v alue is imputed multiple times by humans, will it have similar v ariation as in v alues imputed by machine based multiple imputation methods? 3. How much information is needed by crowdworkers to efficiently impute missing observations and what are the best methods to provide that information? This study has far reaching impact. Successful imputation of qualitativ e and quantitati ve data by humans can open re- search possibilities in activ e learning, where observations with missing data can be first imputed by humans before commencing the learning task. Leading to making use of incomplete observ ations, which is currently impossible. Ex- isting cro wdsourcing framew orks can le verage human c om- putation to fill in quantitati v e and qualitati ve information in the databases using a prov en systematic method. Our contributions in this study are as follo wing: 1. T o best of our knowledge, we present the first study to use crowdsourcing for multiple imputation. 2. W e present the nov el idea of structuring missing data as a surve y questionnaire, making it easier for cro wdw orkers to impute missing values. 3. W e present feasibility analysis of using human computa- tion for multiple imputation. 4. W e study the impact of presenting crowdw orkers with v ary- ing degrees of prior knowledge about the dataset before imputing missing values. 5. W e present the comparison of human imputed values with state-of-the-art machine imputation. Next section revie ws some related work to missing data and crowdsourcing. Followed by the section introducing CrowdMI. Ne xt section presents ev aluation of Cro wdMI and sev eral challenges using real life datasets. Finally , we con- clude the paper with limitations and directions for our future work. This study has been approved by Of fice of research Ethics at XXX (Institutional Revie w Board Approval Number: XXX). Preliminaries This section provides some required background on crowd- sourcing and missing data imputation. Cro wdsourcing Crowdsourcing is defined as ”The outsourcing of a job (typically performed by a designated agent) to a large un- defined group in the form of an open call” (Howe 2006; Misra et al . 2014). Cro wdsourcing generally refers to the idea of bringing together a group of individuals to collabo- rate for solving a problem. Under right circumstances, the results obtained from crowdsourcing a problem are highly reliable and the process is efficient. Now internet provides an ideal platform to implement crowdsourcing for various problems. W e refer readers to Brabham (Brabham 2008) for further discussion. Missing data and multiple imputation Missing data is a well researched topic and a pervasi ve prob- lem in data mining and analytical domains. As most of the statistical and machine learning models are designed to work with complete datasets only , missing data results in reduced sample size and biased inference. Usually when dealing with missing data. A single missing value is replaced with a single predicted value, which can be chosen using a simple column av erage or a complex statistical model. During analysis, imputed value is treated same as all observed values. The disadvantage of doing so is obvious. Considering an imputed value same as observed values is indirectly assuming that imputation model is prefect, which is impossible in real life scenarios. T o ov ercome this issue multiple imputation is often used. For multiple imputation (Rubin 2004), instead of filling in a single value per missing observ ation. W e fill in the missing observation with multiple imputed values, each slightly dif- ferent than the other . W e explain this further using a simple example. Using aid of data from T able 1, representing an income questionnaire in a surve y , we denote missing v alues with ”?”. In a multiple imputation scenario, we will create multiple copies of the dataset presented in T able 1 with ’?’ replaced by slightly different imputed v alues in each copy . All imputed v alues are assumed to be drawn from the posterior predictive distribution of missing data, giv en the T able 1: Data snippet for income questionnaire with missing data represented using ’?’ Id Age Sex Income Postal Job Marital status 1 50 M 100 123 a single 2 45 ? ? 456 ? married 3 ? F ? 789 ? ? observed data. The goal of filling in multiple values is to cap- ture the uncertainty of imputation model in form of variance in imputed values, which better reflects real world scenarios. Multiple imputation in v olves three steps: 1. Fill in missing v alues k times to create k complete datasets 2. Analyze k datasets separately 3. Combine the inference Point estimates such as classification accuracy and RMSE can be combined using simple av erage ¯ Q = 1 k k X i =1 ˆ Q i (1) Cro wdMI In this section we introduce Cro wdMI, our multiple imputa- tion model based on human computation. Method The most important challenge we face is to present av ailable raw data to a presumably data nai ve crowdw orker . Especially presenting it in a way so to aid the crowdw orker to fill in the missing values. It is well understood that presenting ro ws of raw data without proper context to crowdw orkers will not yield good results. Instead it will inflate the total time needed to complete the job, associated job costs, and will result in noisy answers. Surve ys and questionnaires are known to be one of the best methods to extract cro wd kno wledge (De Leeuw 2005; Wright 2005) in a structured format using indirect commu- nication. W e chose the same route, a surve y questionnaire is designed that presents some preliminary information about the dataset and then each row with missing data is presented as an easily interpretable surve y question. In a basic format, our process is presented using Figure 1. From a theoretical perspectiv e, missing data imputation using crowd can be considered as a special case of acti v e learning. Where the survey responses to fill in the missing data are synon ymous to the labels pro vided by users in active learning framew orks. Considering the widely used strategy of uncertainty sample in activ e learning, where we select a sample for query , that we are most uncertain about (Lewis and Gale 1994). W e can immediately see that in case of missing data, we will choose rows with missing observations to get information so they can be used in further analysis. W e refer readers to the work of Y an et al. (Y an et al . 2011) and Fang et al. (Fang, Y in, and T ao 2014) for further details on the role of crowdsourcing in activ e learning. Get dataset Extract n missing ro ws Create surv ey questionnaire Post Job Update dataset Does imputed value fulfills con- straints? stop yes no Figure 1: CrowdMI mechanism of action: n missing data rows are e xtracted from the candidate dataset with missing data and are con verted into a surv ey questionnaire pro viding details about the dataset and extra av ailable information (vary- ing degrees). The questionnaire is then answered by human participants using a cro wdsourcing frame work, answers are treated as imputed values and the dataset is updated. Process is repeated k times to get multiple imputations. It is well kno wn that the quality of surv e y data is directly proportional to respondents capacity and willingness to pro- vide accurate and reliable answers (Sanchez 1992). Uninter- esting questionnaires coupled with the length and complexity tend to get more noisy answers compared to a well designed questionnaire with intuitiv e directions and a limited number of questions. Hence, we follow some basic design principles outlined below . 1. Keep questionnaire short : Long questionnaires are known to cause fatigue in participants. So, we limit the maximum number of questions to 10. But, this will only allo w us to get 10 imputations. A natural question is: what if we hav e more than 10 missing observ ations? Our design is easily extended by creating dif ferent questionnaires with dif ferent missing rows and releasing them to a crowdsourc- ing platform as individual questionnaires, results of which can be combined later to get a complete dataset. 2. Keep questionnaire simple : This is arguably the most important design choice in our case. As our datasets can be from different domains, such as medical informatics, sales etc. Cro wdwork ers are not assumed to ha v e any prior knowledge. Using simple language to phrase the informa- tion about the dataset and the survey questions themselves is vital. If we use technical jar gons a voiding e xplanation of concepts in a layman’ s context, we risk inferior quality responses. W e need to hav e a balance in the complexity of the language used and the information conv eyed for best possible results. 3. Use visual r epr esentations : Long and tedious te xt only or numbers only descriptions induce boredom and contribute to random noisy answers by crowdworkers. T o provide visual stimulation with information, we decided to use plots showing the data distribution with respect to the attribute with missing v alues. 4. Follo w basic design aesthetics : Surprisingly , the aesthet- ics play a significant role in questionnaire response and the quality of responses received. Keeping the basic design principles in mind, we use easy to read font with black color on white background while a v oiding unnecessary use of colors. An example W e demonstrate the questionnaire generation process by an example using a sample dataset sho wn in T able 2. T able 2: Sample data from Galton’ s height dataset. Father and mother column hold the information for height of subject’ s parents, with gender holding subject’ s sex information and height has the information for the subject’ s height. Father Mother Gender Height 78.5 67 M 73.2 75.5 65.5 M 73.5 75 64 F 68 69.5 64.5 F 63.7 W e start by providing context around the dataset as an introduction to the surve y . In this particular case, the tuples belong to the famous Galton’s height data . Which in vesti- gates the relationship between of fspring’ s and their parent’ s height. A sample surve y introduction based on the dataset is framed as following: ”This dataset presents relationship between the heights of parents and their adult children. It is seen that there a positiv e relationship between parent’ s and their offspring’ s height. In other words, taller parents tend to hav e taller children. It is also observed that on a verage males are taller than females. ” Additional details such as attribute distribution or relation- ship between dif ferent attrib utes can be provided if needed, either in forms of tables or as plots. After providing the in- troduction and other necessary details, a surv ey question is formulated as following: Q : W e hav e a data record with missing height information for a child. Giv en that the gender is male, height of the father is 78.5 inch and mother is 67 inch. What do you think is the most probable height for the child? A : T o mimic multiple imputation, same question is asked to k participants. Which completes one iteration of our multiple imputation model for a single row of missing data. k here is the parameter chosen by the end user . It dictates the num- ber of imputations required for a single missing observ ation. Multiple rows of missing data can be combined as part of a single surv ey , called a batc h and se v eral batches can be combined into a single job . An obvious question is, ”Ho w many imputations are needed?”. That is, what value of k should we use? This is a crucial decision, as it will impact the financial decision making for use of cro wdsourcing in a missing data scenario. Our primary goal, similar to multiple imputation, is to dra w imputations at random from posterior predictiv e distribution of missing data, giv en observ ed data. In a way as to provide enough variation in the imputed values. There is no strict rule of thumb for this decision, howe ver statistical simula- tions hav e shown (Graham, Olcho wski, and Gilreath 2007; von Hippel 2005) that imputations ranging from 5 to 100 can be needed depending on proportion of missing data. That is, higher the proportion of missing data, more imputations are needed. Howe ver , about 10 imputations are sufficient for good results. Which in our case, will keep cro wdsource budget at a minimum. Evaluation This section presents feasibility analysis and ev aluation of CrowdMI on real life datasets under v arying conditions. Datasets W e begin with an introduction to the datasets used for ev aluat- ing Cro wdMI. W e use publicly av ailable datasets that explore the relationship between respiratory function(measured using Forced Expiratory V olume(FEV)) and smoking, and diabetes in females of at least 21 years of age of Pima Indian heritage (T ager et al. 1979; Smith et al. 1988). In the first dataset , FEV is the amount of air an individual can exhale in first second of forceful breath. Data includes measurements on FEV(litres), age(years), height(inches), gender(male/female) and smoke(yes/no). First fe w ro ws of dataset are shown in T able 3 for better understanding. T able 3: FEV data, first column holds the age of the subject, second column holds the information for FEV , third and fourth columns show information for height and gender of the subject and last column shows smoking status of the subject. Age FEV Height Gender Smoke 9 1.708 57.0 F No 8 1.724 67.5 F No 7 1.720 54.5 F No 9 1.558 53.0 M No For second dataset related to diabetes in females of at least 21 years of age of the Pima Indian heritage. W e ha ve infor - mation on number of times a subject was pregnant, Plasma glucose concentration, Diastolic blood pressure, Triceps skin fold thickness, 2-Hour serum insulin, Body mass inde x, Di- abetes pedigree function, Age and an indicator for diabetic status. First few ro ws of this dataset are shown in T able 4 T able 4: First few rows of dataset related to diabetes in fe- males of at least 21 years of age of Pima Indian heritage. Pg is the number of times a subject was pregnant, GL is plasma glucose concentration, BP is diastolic blood pressure, T r is T riceps skin fold thickness, In is 2-Hour serum insulin, Ms is body mass index, Pr is diabetes pedigree function, Ag is age and Ds is an indicator for diabetic status. It is clear that this dataset is much more richer in information compared to the FEV dataset. Pg Gl BP T r In Ms Pr Ag Ds 6 148 72 35 0 33.6 0.63 50 Pos 1 85 66 29 0 26.6 0.35 31 Neg 8 183 64 0 0 23.3 0.67 32 Pos 1 89 66 23 94 28.1 0.17 21 Neg T o create a thir d dataset , we use FEV data and perturb some of the rows. This is done in order to create a new questionnaire, results of which will demonstrate the quality of responses received and how do crowdwork ers react to small changes in surve y questions. Setup As it is clear from the previous section, we are using datasets containing clinical information. The datasets do not hav e simple and intuiti ve information and explanation similar to the offspring’ s height dataset used as an example in earlier sections. W e decided to use these datasets on purpose. As we as- sume that most of our crowdw orkers are data nai ve, or nai v e enough not to understand the mechanics behind several med- ical phenomenons and their relationship with other attributes. This gi ves us the opportunity to design the perfect setup for our no vel study , as if we do get good results on these datasets. W e can assume better performance on relatively easy datasets, encountered in day to day scenarios. W e start our experiments using the first dataset FEV by setting ten observations to ha ve missing v alues for age and gender at random and pose the imputation problem as a sur - ve y question to cro wdw orkers. W e chose age and gender to get an idea of imputation process with different data types, as age is a continuous measure and gender is binary . Crowd- Flower is used as a crowdsourcing platform in all of our experiments. Model calibration Our first challenge is to calibrate our imputation model. That is to setup the model for optimal results. For proper calibra- tion, we need to understand the type of responses we receiv e and amount of attention a crowdworker pays to the survey details. So for our test job, we created a simple questionnaire with a basic data description, stated as following: ”In a data set, we ha v e subjects with age from 3 to 19 years old, with half ov er 10 years of age. W e also ha ve about 51% males and 49% females. W e ha ve a case that has age and gender missing. Based on the information provided please fill in the values you think are most probable. ” Radio b uttons were provided to the crowdw orkers to select gender and a free text field to enter values for age. Under the free text field, we pro vided a help text reminding crowd- workers of the valid range for age. The surve y w as run with 100 judgments . A judgment is defined by CrowdFlo wer as a v alid answer . Each judgment has to be completed by a unique user to pre vent same users from completing our surv e y mul- tiple times. W e set no constraints ov er user ability . That is all categories of users from beginner to expert were able to complete this initial surve y . Initial compensation of $0.1 per judgment was used. Our expectation was to get a uniform distribution for age within our predefined age limit and gen- der distribution similar to the one described in initial dataset description. Main questionnaire was preceded by an instruction to read descriptions carefully and ending with asking for the contrib- utor’ s ID. Contributor ID is asked to enforce quality control as is recommended by CrowdFlo wer itself. Initial results were disappointing. Returned age distribu- tion was out of our predefined age limit and gender distrib u- tion was biased tow ards males with 83% imputed as males and 17% as females. Initial results of this survey are sho wn in Figure 2. Figure 2: Age distribution from initial imputation. Results show that crowdworkers did not adhere to the guidelines or the data description. These results show that crowdwork ers do not adhere to guidelines or suggestions and try to complete the task as soon as possible, a confirmation of the findings in many pre vious cro wdsourcing studies. The poor performance in our case can also be attributed to no control ov er contributor’ s experience le vel. As a pool of w orkers without experience can ha v e a net negati v e impact on imputations. T o answer some of the questions, and to measure the im- pact of constraints on range of crowdwork ers input. W e reran the same experiment, b ut this time using a conditional con- straint where users were only allowed to enter age from 3 to 19 years. Hence forcing them to stay within the limits of our age distribution. Results were better compared to the last run, with the imputation distribution centered around the maxi- mum allowed age v alue. Imputation proportion for ”female” gender increased by 7%, that is, 17% to 24%. T o measure the effect of a crowdworker’ s experience on imputation process. W e added an additional constraint where only crowdw orkers at highest e xperience lev el were allo wed to complete the surv ey . Results were improv ed further . Using most experienced batch of crowdw orkers, age distribution was more closer to empirical distribution with 34% less than or equal to 10. Imputed gender distribution improv ed as well, with 32% imputations for female. So, for the rest of our experiments, we decided to use most experienced crowd with compensation fixed at $0.15 per judgment. W e restrict judgments for each question at 30, which means 300 total judgments for 10 missing values. Inf ormation selection Next significant challenge is to figure out what type and what amount of information is required by the crowdw orkers to facilitate better quality responses. What criteria should be used to select the attributes that are related t o the missing data and how the information should be framed as an easy to read surve y description. W e decided to use a simple approach of descriptiv e statistics. Where we inv estigate the relationship of the missing attribute with the rest of the attributes in the dataset and limit the information provided to the attributes that hav e strongest correlation with the missing attribute. This is in principle similar to how regression based imputation works. Using dataset number one (FEV), and setting ten random rows to ha ve missing age values. W e start with the basic description of inter -variable relationships. W e structure our surve y introduction as follo wing: ”This data concerns FEV (F orced Expiratory V olume), a measure of lung functionality in participants 3 to 19 years of age. W e kno w that: • FEV increases with age and height • Minimum and maximum FEV in our case is 0.79 and 5.79 • For a 5 year old, a verage FEV is 1.6 and for a 10 year old, av erage FEV is 2.7. • A participant between heights of 55 and 60 inch have av erage FEV of 2.0 and participants taller than 70 inches hav e a verage FEV of 4.3 • Females hav e slightly lo wer FEV than males which aver - ages at 2.5 in females compared to 2.8 in males. ” W e also provided supplemental information in form of tw o scatter plots, shown in Figure 3. This is to be noted that we did not provide descriptiv es that are specific to a missing attribute. But instead ha v e gi ven a general overvie w of the dataset that includes the relation of missing attribute with other variables. This is done on purpose to estimate the crowd capacity to reason relationships between different v ariables. So to generalize this method for cases when more than one variables are missing. After providing the information, we presented our questionnaire to crowdworkers, with one question per line and designed following the principles discussed in the earlier section. Comparison with machine imputation T o get an estimate of how good CrowdMI imputations are, we need a competitor . One of the state-of-the-art methods (a) (b) Figure 3: Scatter plots showing the relationship between the attribute with missing values and other attributes in the dataset. These are presented to the cro wdwork ers for visual aid to impute missing values. in multiple imputation is Multiple Imputation by Chained Equation (MICE) (Buuren and Groothuis-Oudshoorn 2011), built on the top of Predicti ve Mean Matching (PMM) (Rubin 1986; Little 1988). It is a complex statistical model and works as following: Gi ven some variable x with missingness and a set of complete variables z , the model works by regressing x on z producing regression coeffi cients β . Random draws are then made from posterior predictive distrib ution of β ’ s, creating a new set of coefficients β ∗ . Using β ∗ , the model then generates predictive values for x for all cases and for cases where x is missing. It chooses a set of cases with observed x whose predicted value for x is closer to predicted values for x with missingness. Then from the chosen k close cases, it randomly selects one and uses it as an imputed v alue. T o get comparable results with CrowdMI, we ran MICE based imputation to impute 30 datasets as part of multiple imputation. This comparison is made interesting by the fact that MICE has access to all of the ra w data and can model complex as- sociations whereas the crowd work ers only hav e information on the general statistics of the missing v alues coupled with what information we decide to share with them. W e chose this state-of-the-art imputation model for one main reason. If cro wdworkers can perform at par with MICE for imputa- tion tasks, then there is an obvious research direction and advantage in missing data scenarios where it is better to use crowdsourcing to gather missing data compared to one shot machine based models. Imputation results from cro wd imputed data and MICE along with original v alues are shown in T able 5. As the results are from multiple imputations (30 imputations), they are displayed using median imputed value with 25th and 75th percentile of the distribution of imputed v alues. T able 5: Imputation results for missing age, results are sho wn using the median and the 25th and 75th percentiles of im- putations for an observation. Results show that CrowdMI imputes v alues much closer to the original value compared to the imputations by MICE. Original CrowdMI MICE 5 6.0(5.0,7.0) 6.0(6.0,6.8) 10 11.0(8.0,12.0) 12.0(11.0,12.8) 10 10.5(8.0,12.0) 12.5(11.0,17.3) 11 11.5(9.3,13.0) 8.5(8.0,9.0) 10 12.0(10.0,13.0) 12.0(12.0,15.5) 12 13.0(12.0,14.8) 9.0(8.0,9.0) 11 14.0(12.0,15.0) 11.5(11.0,12.0) 14 14.0(11.5,16.0) 12.0(11.0,14.8) 14 16.0(13.0,16.0) 12.0(11.0,13.0) 16 16.0(13.3,17.0) 12.5(11.0,13.8) Results sho w that almost all Cro wdMI imputations cov er missing data distribution with some median imputed values exactly same as the missing observations. CrowdMI impu- tations are more impressive and less variable as compared to imputations from MICE. Which sometimes did not cov er missing v alue between 25th and 75th percentile of all impu- tations. These results are very encouraging. Hence, as of our next step, we are interested to inv estigate if the displayed plots provided an y additional assistance to crowdw orkers. As read- ing plots and making correct inference is not an easy task for a data naive person and visuals can be distracting from the contextual information. Hence, we again administered the same survey . But this time after removing the plots. Distribu- tion of results was similar b ut cov erage of original missing values was worse compared to the results obtained with the use of plots. This shows that an effecti ve visualization of data plays a vital role in a good design of human powered imputation framew ork. T o challenge cro wdwork ers further , we decided to create a little more complicated scenario. This time, we randomly set 10 observations to hav e missing values for gender . W e did not provide an y additional information to cro wdwork ers compared to the last designed questionnaire. But, we added another plot displaying empirical gender distribution and FEV in the dataset. W e framed our questions as follo wing with radio b uttons provided for input. Q :”What is the gender gi ven that FEV is 2.4, height is 62.5, and age is 11? Male Female W e would like to emphasize that imputing a categorical variable is far more error prone compared to a continuous value. Because there is no definition of an error margin or an acceptable range. The answer is either ”T rue” or ”False”. W e administered the surve y for 10 questions with 30 judgments each. T o get a comparison with machine imputations, we again used MICE with 30 imputations. T able 6 shows the results. It shows that distribution of imputed values using CrowdMI is very similar to the ones imputed by MICE. Both models agreed on all results but one, where MICE imputed the correct v alue and Cro wdMI got it wrong by two v otes. T able 6: Imputation results for missing gender . First col- umn sho ws original value with second and third showing imputed values by Cro wdMI and MICE. V alues in Cro wdMI and MICE show the raw number of votes receiv ed by each category from 30 imputations. Both models agree on all ob- servations b ut one. Original CrowdMI(Male - Female) MICE (Male - Female) Female 13 - 17 13 - 17 Male 27 - 3 20 - 10 Female 24 - 6 25 - 5 Male 5 - 25 15 - 15 Female 28 - 2 19 - 11 Female 4 - 26 12 - 18 Female 17 - 13 10 - 20 Male 25 - 5 19 - 11 Male 28 - 2 17 - 13 Female 14 - 16 8 - 22 Perturbed data For this comparison, we use the systematically perturbed version of FEV dataset (dataset number three). Perturbation is performed within the age attribute where original age v alues are replaced by new smaller age v alues. Now , the resulting surve y is not an e xact copy of first surv ey . But, it is also not a completely new surv e y . Running the surve y for same number of iterations (30). This time imputation resulted in an ov erall increased propor- tion of gender being selected as ”male” (about 57% imputed values were male compared to near 40% in last survey). This increase in selected male proportion is attributed to the pertur- bation where we decreased age from original value, keeping height the same. Which weighs the decision of cro wdwork ers to wards selecting ”male” for missing observ ations. This adds to our claim of good imputation quality where crowdw orkers pay careful attention to details. A more complicated scenario T o test CrowdMI on a more complex task. W e use dataset number two (Pima Indian diabetes). This dataset is much more richer in information compared to FEV dataset. Sim- ilar to previous runs, we randomly set ten observations to hav e missing v alues for diabetic status and frame the surve y questionnaire as following: ”This data has information on diabetes status for females aged 21 years and older . W e know that: • Diabetes positive patients ha v e higher blood glucose le vels. • Glucose lev els are at av erage of around 100 for diabetes negati v e and 130 for diabetes positi ve patients. • Diabetes positi ve patients also ha v e slightly higher blood pressure, which is about 70 compared to 65 for diabetes negati v e • Blood pressure is also higher in people with higher body mass index. • Blood pressure is around 77 for people with mass greater than 40 and around 70 for mass less than 40. • Diabetes positive are also of older age compared to dia- betes negati v es patients, that is, av erage age for diabetic is 35 compared to about 25 for non diabetic. • Diabetics also hav e on a verage lo wer insulin compared to negati v es, that is 68 compared to 100 in neg ati ves. ” In addition to the introduction above, we also provided two box plots to show the relationship between diabetes status and age, and blood glucose and diabetes status. F actors that can be easily understood by naiv e audience. T able 7: Imputation results for diabetic status, first col- umn shows original values in the dataset Second column is Cro wdMI results and third column is results from MICE. Pos is positiv e, Neg is negati v e. V alues in Cro wdMI and MICE sho w the raw number of votes recei ved by each cate- gory from 30 imputations. Imputation distribution is similar using CrowdMI and MICE, the y disagree on two results. Original CrowdMI(Pos - Ne g) MICE(Pos - Ne g) Pos 17 - 13 22 - 8 Pos 25 - 5 21 - 9 Neg 5 - 25 6 - 24 Pos 22 - 8 22 - 8 Neg 5 - 25 2 - 28 Neg 4 - 26 4 - 26 Pos 21 - 9 25 - 5 Pos 5 - 25 18 - 12 Neg 21 - 9 12 - 18 Pos 8 - 22 11 - 19 T able 7 shows the results. Cro wdMI and MICE disagree on two results, where MICE imputed the correct value. Al- though the difference w as small in one misclassification, we do belie ve this is due to the f act that MICE has access to all av ailable data whereas CrowdMI only uses what we decide to share with cro wdw orkers, hence gi ving MICE an unf air ad- vantage in this scenario. Gi ving more contextual information should improv e the outcomes with cro wd. Participant satisfaction Using the results of the default surve y administered by CrowdFlo wer to gather crowd responses for quality , ease of work, and compensation. Our surveys ranged from ”easy” to ”average” for question dif ficulty , meaning that we have room to provide more information for improvement of our outcome. Compensation is deemed ”fair” by crowdworkers. Instructions for survey completion are reported as ”clear”. Even though we use most experienced crowd with reasonably dif ficult questions, we had a net ”positiv e” response with ov er 90% judgments recei ved within first 3 hours of launching the surve y . Is human mind Bayesian? In this section we try to ev aluate if gi ven e xtra information that is not already contained in the dataset. Can we influence cro wd decision? This is in spirit similar to Bayesian methods where we use prior kno wledge to update posterior probabili- ties. This can be useful in v arious real life scenarios, where researchers already know or can make strong assumptions about the missing data distribution. Influencing cro wd imputation using prior kno wledge can av oid inconsistencies due to small sample size or dispro- portionate sampling. An example can be of a small sample with missing gender information, where the sample is from a breast cancer study . In vestigator kno ws that breast cancer affects majority of females but also a minority of males. If not providing an y information or beliefs, cro wdworkers can impute missing gender as all females or with an equal pro- portion of males/females. Whereas, if the in vestig ator states explicitly that in this scenario we can expect to see 10% of males with breast cancer . This information can nudge crowd- workers with a certain probability to impute males versus all female imputation. In order to do ev aluate this, we use the first dataset (FEV). W e added a little blurb at end of our questionnaire ”Howe ver , in addition to the information contained in our dataset, we also know that in general population related to this study , females account for about 65% of total. ” Results were not significantly dif ferent from pre vious ob- serv ations, but there was a noticeable shift, with reduced male imputation proportion. W e strongly belie v e that cro wdwork- ers can be further influenced by placing the e xtra information at start of the questionnaire compared to the end. As most crowdw orkers might not pay full attention to the text below the rest of description. Related work Missing data Most common and easiest to use method to deal with missing data is complete case analysis in which any instance with missing data is deleted from final analysis. Filling in plausible values using mean or most frequent label from observed data is also common. There are number of studies in statistics and machine learning (Stephens and Scheet 2005; Efron 1994; Y uan 2010; Jerez et al . 2010; Allison 2001) that propose advanced methods for missing data imputation. Cro wdsourced data completion V ery few studies in cro wdsourcing hav e attempted to le verage human computation for missing data. CrowdDB (Franklin et al . 2011) uses crowdsourced queries, which can include searching and filling in missing v alues such as an address or email for a person. Y e et al. (Y e and W ang 2014) pro- posed a human-machine hybrid approach, in volving a model imputing multiple missing v alues and an oracle(human) se- lecting the best fit. This sev erely limits human degrees of freedom, which in turn will limit the model’ s performance. Analyzing all imputations as a machine based multiple im- putation model is a better alternati ve in such scenarios. P ark and W idom (Park and W idom 2014) proposed Crowdfill that collects structured data from the crowd by presenting cro wd- workers with a spreadsheet like interf ace where workers can enter missing values. This howe v er limits the information that can be provided to the crowdw orkers related to the dataset and attribute relations. Conclusions, limitations and future work W e conclude our study by answering the questions we asked in the introduction: 1. Can humans fill in (impute) missing qualitati ve and quan- titativ e data? Our results show that indeed, humans can be effecti vely used to fill in missing qualitativ e and quantitati v e data. 2. If the same missing v alue is imputed multiple times by humans, will it have similar v ariation as in v alues imputed by machine based multiple imputation methods? Our results show that v ariation induced by multiple impu- tation using Cro wdMI is similar to the v ariation induced by machine based imputations. 3. How much information is needed by crowdw orkers for imputing missing observations? W e ha ve sho wn that providing a dataset context with some descripti ves about attrib ute correlations and plots for effec- tiv e visualization pro vides an optimal amount of informa- tion needed by crowdw orkers to fill in missing v alues. Limitations and further work : In this study , we have only used three datasets (two independent datasets, one per- turbed version) to ev aluate CrowdMI. This is partly due to increased costs with the use of more questionnaires and partly due to the fact that three datasets are enough to establish use- fulness of a new method and to do a feasibility analysis. Which is inline with other ev aluations done in crowdsourc- ing, some of which only use a single dataset. F or our future work ho wever , we would like to v alidate our method on more datasets of v arying v ariety . W e only considered relativ ely low dimensional datasets, our future attempts will focus on large dimensional datasets with information presented using a small subset of v ariables that are strongly associated with the attribute ha ving missing v alues. References [Allison 2001] Allison, P . D. 2001. Missing data , volume 136. Sage publications. [Brabham 2008] Brabham, D. C. 2008. Crowdsourcing as a model for problem solving: An introduction and cases. Con ver gence 14(1):75–90. [Buuren and Groothuis-Oudshoorn 2011] Buuren, S., and Groothuis-Oudshoorn, K. 2011. mice: Multiv ariate imputa- tion by chained equations in r . Journal of statistical softwar e 45(3). [De Leeuw 2005] De Leeuw , D. 2005. T o mix or not to mix data collection modes in surveys. Journal of of ficial statistics 21(2):233. [Doan, Ramakrishnan, and Halevy 2011] Doan, A.; Ramakr- ishnan, R.; and Halevy , A. Y . 2011. Crowdsourcing sys- tems on the world-wide web. Communications of the ACM 54(4):86–96. [Efron 1994] Efron, B. 1994. Missing data, imputation, and the bootstrap. Journal of the American Statistical Association 89(426):463–475. [Fang, Y in, and T ao 2014] Fang, M.; Y in, J.; and T ao, D. 2014. Activ e learning for crowdsourcing using knowledge transfer . [Franklin et al. 2011] Franklin, M. J.; K ossmann, D.; Kraska, T .; Ramesh, S.; and Xin, R. 2011. Cro wddb: answering queries with crowdsourcing. In Pr oceedings of the 2011 A CM SIGMOD International Confer ence on Management of data , 61–72. A CM. [Gao, Barbier , and Goolsby 2011] Gao, H.; Barbier, G.; and Goolsby , R. 2011. Harnessing the cro wdsourcing power of social media for disaster relief. IEEE Intelligent Systems 26(3):10–14. [Goodchild and Glennon 2010] Goodchild, M. F ., and Glen- non, J. A. 2010. Cro wdsourcing geographic information for disaster response: a research frontier . International J ournal of Digital Earth 3(3):231–241. [Graham, Olchowski, and Gilreath 2007] Graham, J. W .; Ol- chowski, A. E.; and Gilreath, T . D. 2007. Ho w many im- putations are really needed? some practical clarifications of multiple imputation theory . Pre vention Science 8(3):206– 213. [Howe 2006] Howe, J. 2006. The rise of crowdsourcing. [Jerez et al. 2010] Jerez, J. M.; Molina, I.; Garc ´ ıa-Laencina, P . J.; Alba, E.; Ribelles, N.; Mart ´ ın, M.; and Franco, L. 2010. Missing data imputation using statistical and machine learn- ing methods in a real breast cancer problem. Artificial intelli- gence in medicine 50(2):105–115. [Leimeister et al. 2009] Leimeister , J. M.; Huber , M.; Bretschneider , U.; and Krcmar , H. 2009. Lev eraging cro wd- sourcing: activ ation-supporting components for it-based ideas competition. Journal of management information systems 26(1):197–224. [Lewis and Gale 1994] Lewis, D. D., and Gale, W . A. 1994. A sequential algorithm for training text classifiers. In Pr o- ceedings of the 17th annual international A CM SIGIR confer- ence on Resear c h and development in information retrie val , 3–12. Springer-V erlag Ne w Y ork, Inc. [Little and Rubin 2014] Little, R. J., and Rubin, D. B. 2014. Statistical analysis with missing data . John W iley & Sons. [Little 1988] Little, R. J. 1988. Missing-data adjustments in large surveys. J ournal of Business & Economic Statistics 6(3):287–296. [Misra et al. 2014] Misra, A.; Gooze, A.; W atkins, K.; Asad, M.; and Le Dantec, C. 2014. Cro wdsourcing and its ap- plication to transportation data collection and management. T ransportation Resear c h Recor d: J ournal of the T ransporta- tion Resear c h Boar d (2414):1–8. [Park and W idom 2014] Park, H., and Widom, J. 2014. Crowdfill: collecting structured data from the crowd. In Pr oceedings of the 2014 ACM SIGMOD international con- fer ence on Manag ement of data , 577–588. A CM. [Rubin 1986] Rubin, D. B. 1986. Statistical matching using file concatenation with adjusted weights and multiple imputa- tions. Journal of Business & Economic Statistics 4(1):87–94. [Rubin 2004] Rubin, D. B. 2004. Multiple imputation for nonr esponse in surve ys , v olume 81. John W iley & Sons. [Sanchez 1992] Sanchez, M. E. 1992. Effects of question- naire design on the quality of survey data. Public Opinion Quarterly 56(2):206–217. [Schafer 1999] Schafer , J. L. 1999. Multiple imputation: a primer . Statistical methods in medical r esear ch 8(1):3–15. [Smith et al. 1988] Smith, J. W .; Everhart, J.; Dickson, W .; Knowler , W .; and Johannes, R. 1988. Using the adap learn- ing algorithm to forecast the onset of diabetes mellitus. In Pr oceedings of the Annual Symposium on Computer Appli- cation in Medical Car e , 261. American Medical Informatics Association. [Stephens and Scheet 2005] Stephens, M., and Scheet, P . 2005. Accounting for decay of linkage disequilibrium in haplotype inference and missing-data imputation. The Amer- ican Journal of Human Genetics 76(3):449–462. [T ager et al. 1979] T ager , I. B.; W eiss, S. T .; Rosner , B.; and Speizer , F . E. 1979. Effect of parental cigarette smoking on the pulmonary function of children. American Journal of Epidemiology 110(1):15–26. [von Hippel 2005] von Hippel, P . T . 2005. T eacher’ s cor- ner: ho w many imputations are needed? a comment on her - shberger and fisher (2003). Structural Equation Modeling 12(2):334–335. [Wright 2005] Wright, K. B. 2005. Researching internet- based populations: Adv antages and disadv antages of online surve y research, online questionnaire authoring software packages, and web survey services. J ournal of Computer- Mediated Communication 10(3):00–00. [Y an et al. 2011] Y an, Y .; Fung, G. M.; Rosales, R.; and Dy , J. G. 2011. Activ e learning from crowds. In Proceedings of the 28th international confer ence on machine learning (ICML-11) , 1161–1168. [Y e and W ang 2014] Y e, C., and W ang, H. 2014. Capture missing v alues based on crowdsourcing. In International Confer ence on W ir eless Algorithms, Systems, and Applica- tions , 783–792. Springer . [Y uan 2010] Y uan, Y . C. 2010. Multiple imputation for miss- ing data: Concepts and ne w de velopment (v ersion 9.0). SAS Institute Inc, Rockville , MD 49.
Original Paper
Loading high-quality paper...
Comments & Academic Discussion
Loading comments...
Leave a Comment