Linear Regression for Speaker Verification
This paper presents a linear regression based back-end for speaker verification. Linear regression is a simple linear model that minimizes the mean squared estimation error between the target and its estimate with a closed form solution, where the ta…
Authors: Xiao-Lei Zhang
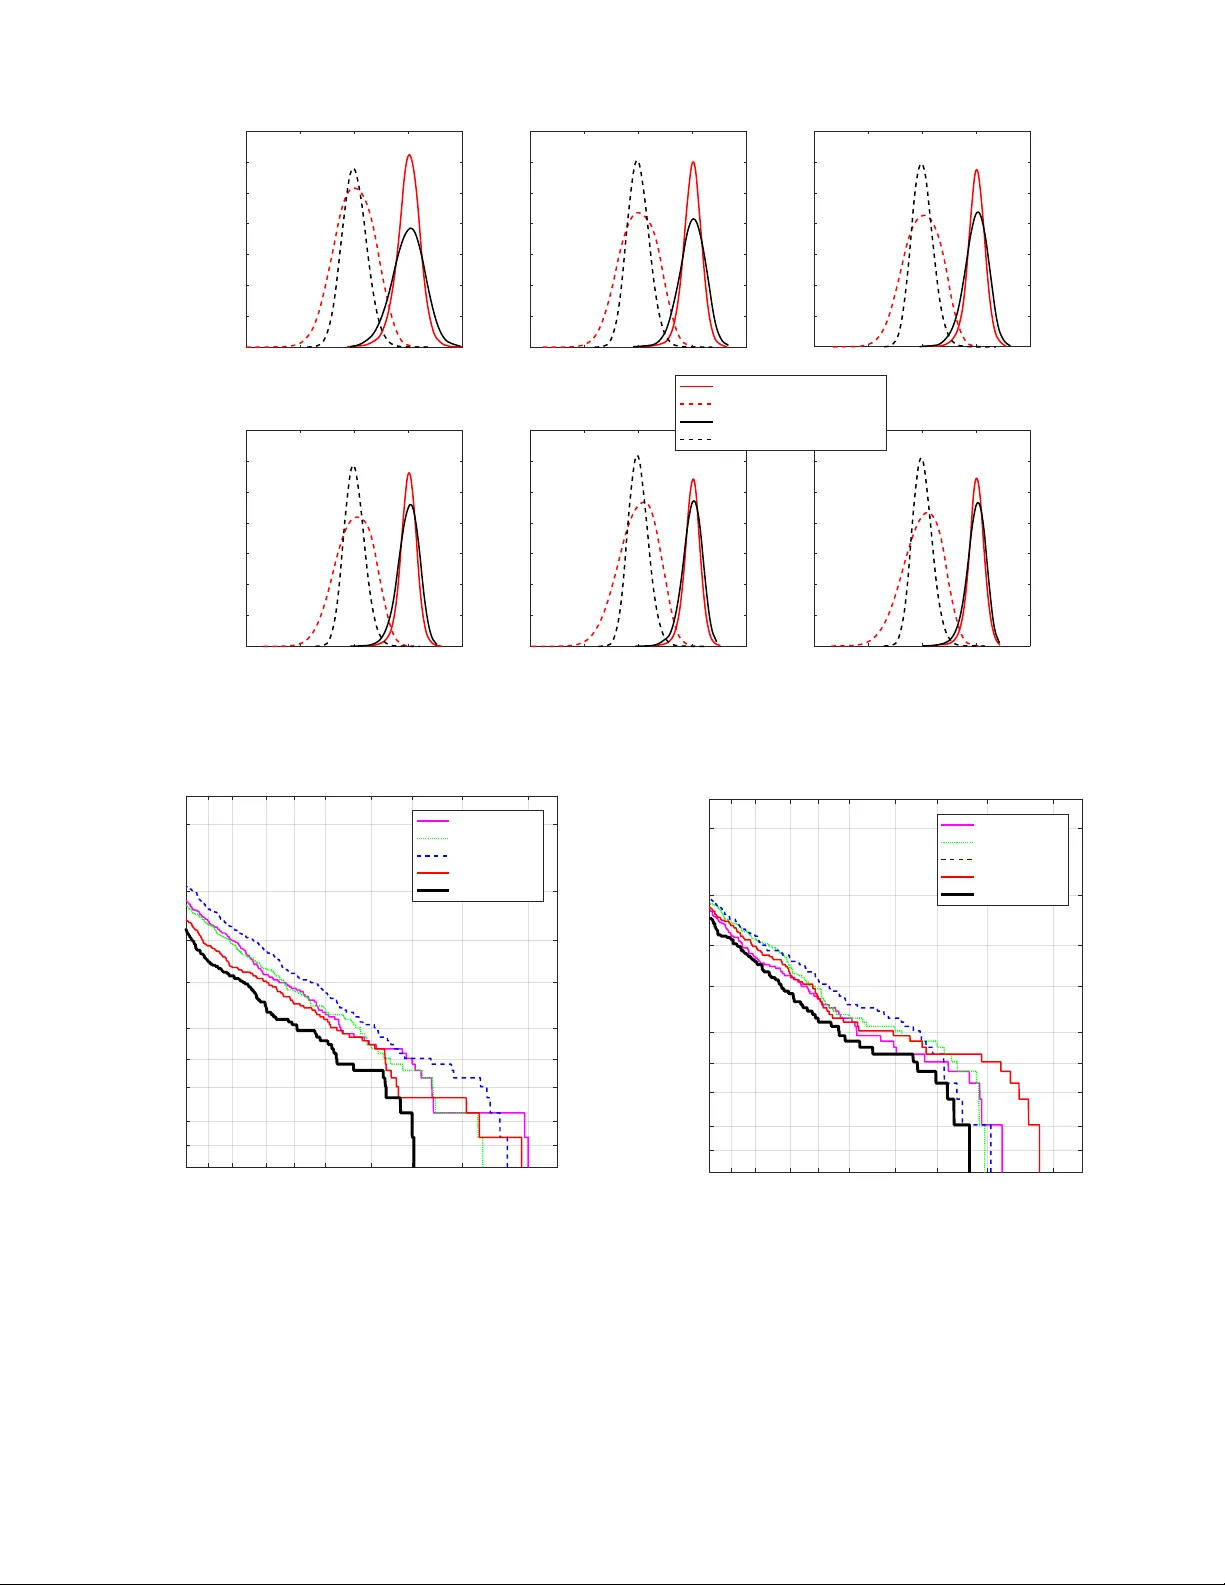
1 Linear Re gression for Speaker V erification Xiao-Lei Zhang Abstract —This paper presents a linear regression based back- end for speaker verification. Linear regr ession is a simple linear model that minimizes the mean squared estimation error between the target and its estimate with a closed form solution, where the target is defined as the gr ound-truth indicator vectors of utterances. W e use the linear regression model to learn speaker models fr om a front-end, and verify the similarity of two speaker models by a cosine similarity scoring classifier . T o evaluate the effectiveness of the linear regression model, we construct three speaker verification systems that use the Gaussian mixture model and identity-vector (GMM/i-vector) front-end, deep neural net- work and i-vector (DNN/i-vector) front-end, and deep vector (d- vector) front-end as their front-ends, respectively . Our empirical comparison results on the NIST speaker recognition evaluation data sets show that the proposed method outperforms within- class covariance normalization, linear discriminant analysis, and probabilistic linear discriminant analysis, given any of the three front-ends. Index T erms —Linear regression, speaker verification. I . I N T RO D U C T I O N S PEAKER verification has long been a fundamental task in speech processing. A speaker verification system verifies an identity claim made by a test speaker , and decides to accept or reject the claim. It can be either text-dependent or text-independent based on its input speech materials: the former constrains a speaker to pronounce a prescribed text, while the latter does not constrain the speech contents. This paper studies text-independent speaker v erification. A text- indepdent speaker verification system generally contains two components. The first component is a front-end which extracts a feature vector from a speaker utterance by some density estimator . The second component is a back-end which builds speaker models and measures the similarity of two speaker models by a classifier . An early speaker verification front-end is feature av eraging which learns a feature vector from a speaker utterance by av eraging the frame-level acoustic features [1]. The method requires long speech utterances to reach stable speech statis- tics. Another class of front-ends is statistical models, which estimates the density of speech frames by statistical models. Early approaches of this kind build a model, e.g. vector quantization [2] or Gaussian mixture model (GMM) [3], [4], for each speaker . These approaches are inefficient when the number of speakers is large. T o alleviate this problem, in [5], Reynolds et al. proposed a GMM-based univ ersal background model (GMM-UBM) which builds a single GMM from the pool of all training speakers. GMM-UBM is a fundamental method of speaker verification in recent years. T o deal with Xiao-Lei Zhang is with the Center for Intelligent Acoustics and Immersive Communications, School of Marine Science and T echnology , Northwestern Polytechnical Univ ersity , Xi’an, China (e-mail: xiaolei.zhang9@gmail.com). speaker and channel variability , many approaches were pro- posed along with GMM-UBM, where factor analysis [6] is among the effecti ve ones. It first extracts high-dimensional supervectors of utterances which are their first- and second- order statistics produced from GMM-UBM, and then reduces the superv ectors to lo w-dimensional identity vector s (i-vectors) by factor analysis. The above combination of GMM-UBM and i-vector is the GMM/i-vector front-end. Recently , deep neural network (DNN) based front-ends hav e receiv ed much attention [7]–[9]. In [7], Sarkar et al. used DNN to extract frame-lev el bottleneck features that were then used as the input of GMM-UBM. In [9], Lei et al. took a DNN trained for a different task, e.g. speech recognition, to generate posterior probability of speech frames, which is a supervised alternativ e to GMM-UBM, and then used the factor analysis [6] to extract i-vectors from the DNN based UBM. The method is denoted as the DNN/i-vector front-end. T o demonstrate the advantages of the DNN/i-vector front-end, its DNN acoustic model needs to be trained with additional data [10]. In [8], V ariani et al. trained a DNN classifier to map frame-lev el features in a giv en context to the corresponding speaker identity target, and extracted a feature vector , referred as a deep vector or “d-vector”, from a speaker utterance by av eraging the activ ations deriv ed from the last DNN hidden layer . The method is known as the d-vector front-end. After feature extraction by a front-end, a speaker v erification back-end builds speaker models for classification. It generally contains two stages—a de velopment stage and a test stage. The dev elopment stage builds a speaker space from dev elopment data, where each speaker acts like a coordinate axis of the space. The test stage gets the enrollment and test speaker models of a trial from the speaker space and then ev aluates the similarity of the two models by a classifier . W e summarize some back-ends as follows. In [5], Reynolds et al. first b uilt a speaker space by adapting the GMM- UBM to many speaker-dependent GMMs by the maximum a posteriori estimation in the de velopment stage and then verifies the identity of a test speaker by a likelihood ratio test. Later on, in [11], Campbell et al. trained a support vector machine classifier to distinguish true speakers from imposter speakers with nuisance attribute projection [12] for compensating ses- sion v ariability . In [6], Dehak et al. proposed to learn a speaker space by within class cov ariance normalization (WCCN) or linear discriminant analysis (LD A) and then applied cosine similarity scoring as the classifier . In [13], Kenn y proposed to extract speaker models from an i-vector based front-end or LD A and then used probabilistic LD A (PLD A) as the classifier . Besides, in [14], Snyder et al. proposed an end-to-end training method to train a DNN based front-end and a PLD A-like back- end jointly . In this paper , we propose a linear regression (LR) based 2 back-end. LR is a traditional statistical regression model that minimizes the mean squared error between the target and its estimate with a closed-form solution. In the dev elopment stage of the back-end, we apply LR to learn a speaker space where the target of the LR model is the ground-truth indicator vectors of the speaker utterances. In the enrollment and test stages, we first extract the enrollment and test speaker models of a trial from the speaker space, and then ev aluate the similarity of the two models by cosine similarity scoring. The overall back- end is denoted as the LR+cosine back-end. T o ev aluate its effecti veness, we propose three speaker verification systems which combine the LR+cosine back-end with the GMM/i- vector , DNN/i-vector , and d-vector front-ends, respectively . W e have conducted an extensi ve experiment on the NIST 2006 speaker recognition e valuation (SRE) and NIST 2008 SRE data sets. W e have compared the LR+cosine back-end with the cosine similarity scoring (cosine), WCCN with the co- sine similarity scoring (WCCN+cosine), LDA with the cosine similarity scoring (LD A+cosine), and LDA with the PLD A scoring (LD A+PLD A) back-ends. Our experimental results show that the proposed method outperforms the comparison methods, and the e xperimental conclusion is consistent in different lengths of enrollment speech. This paper is organized as follows. In Section II, we introduce the LR-based back-end and three LR-based speaker verification systems. In Section III, we present the experi- ments. In Section IV, we summarize the paper . I I . L I N E A R R E G R E S S I O N F O R S P E A K E R V E R I FI C A T I O N In this section, we first present the LR-based back-end in Section II-A, and then present three front-ends that will be combined respectiv ely with the LR-based back-end in Section II-B. The procedure of any of the three speaker verification systems is as follows. The front-end extracts a feature vector x from an utterance { z k } s k =1 where s denotes the number of frames of the utterance. Then, the LR-based back-end first gets the speaker model m from x by the LR model and then verifies the identity of m by the cosine similarity scoring. A. Linear re gr ession based back-end Suppose a labeled de velopment corpus after processed by a front-end is given by {{ ( x i,j , y i,j ) } U i j =1 } S i =1 where S is the number of speakers, U i is the number of utterances of the i - th speaker , x i,j is the feature vector of a speaker utterance produced from a front-end, and y i,j is the ground-truth label of the utterance representing the identification of the speaker , 1 ≤ y i,j ≤ S . Suppose y i,j = k , then we change y i,j to an S -dimensional indicator vector y i,j which is a binary code with the k -th dimension set to 1 and the other dimensions set to 0 . As a result, we can rewrite the labeled corpus as {{ ( x i,j , y i,j ) } U i j =1 } S i =1 . W e fit {{ ( x i,j , y i,j ) } U i j =1 } S i =1 to a LR model: y i,j = A T x i,j + i,j (1) where A is the LR model and i,j is the estimation error . Minimizing the squared estimation error k k 2 2 deriv es the following closed-form solution: A = ( XX T ) − 1 XY T (2) where X = [ x 1 , 1 , . . . , x 1 ,U 1 , . . . , x i,j , . . . , x S, 1 , . . . , x S,U S ] , Y = [ y 1 , 1 , . . . , y 1 ,U 1 , . . . , y i,j , . . . , y S, 1 , . . . , y S,U S ] . In the enrollment and test stages, we apply the LR model to extract a new feature ˆ y from x by the following equation: ˆ y = A T x . (3) The speaker model m is giv en by: m = 1 V V X v =1 ˆ y v (4) where V is the number of utterances of the speaker . Finally , we employ a classifier to identify the similarity of two speaker models m enroll and m test . Despite that many clas- sifiers could be applied, we use the simple and effecti ve cosine similarity scoring as an example based on the experimental conclusion of reference [6]. The cosine similarity of the two models is calculated by: score( m enroll , m test ) = m enroll , m test k m enroll k k m test k R θ (5) which is compared with a decision threshold θ . If the score is larger than θ , then the two models are judged as from the same speaker; otherwise, they are from different speakers. B. F r ont-ends The three speaker verification systems based on the LR- based back-end use the GMM/i-vector [5], [6], DNN/i-vector [9], and d-vector [8] front-ends, respectively . 1) GMM/i-vector fr ont-end: The GMM/i-vector front-end contains a GMM-UBM Ω [5], [15] which is a speaker- and channel-independent GMM trained from the pool of all speech frames of the dev elopment data, and a total variability matrix T [6] that encompasses both speaker - and channel-variability . Suppose Ω contains C Gaussian mixture components, and suppose we hav e an utterance of L frames { z l } L l =1 where z l is a F -dimensional acoustic feature. The zero-th order and centralized first-order Baum-W elch statistics of the utterance extracted from the c -th component of Ω is: n c = L X l =1 P( c | z l , Ω) , (6) f c = L X l =1 P( c | z l , Ω)( z l − µ c ) (7) where µ c is the mean of the c -th component of Ω . If we define N as a C F × C F -dimensional diagonal matrix whose diagonal blocks are n c I , ¯ f = [ f T 1 , . . . , f C ] T as a supervector , and Σ as a C F × C F -dimensional diagonal cov ariance matrix estimated 3 during factor analysis training [6], then we obtain the i-vector x by: x = ( I + T T Σ − 1 NT ) − 1 T T Σ − 1 ¯ f (8) where T and Σ is in variant across utterances. 2) DNN/i-vector front-end: The dif ference between the DNN/i-vector front-end [9] and the GMM/i-vector front-end is that the GMM-UBM in the DNN/i-vector front-end is estimated by a DNN acoustic model trained for automatic speech recognition. Specifically , the DNN acoustic model is used to estimate the senone posteriors of acoustic features, where a senone is used to model the tied states of a set of triphones that are close in the acoustic space. If we model the posterior distribution of a senone by a Gaussian mixture component of the GMM-UBM, then we can use the senone posteriors to train the GMM-UBM in the following way . Suppose the development corpus contains U utterances, and the u -th utterance has L u frames { z ( u ) l } L u l =1 . The parameters of the GMM-UBM are estimated by: γ ( u ) c,l ≈ P( c | z ( u ) l ) , (9) π c = U X u =1 L u X l =1 γ ( u ) c,l , (10) µ c = P U u =1 P L u i =1 γ ( u ) c,l z ( u ) l P U u =1 P L u i =1 γ ( u ) c,l , (11) Σ c = P U u =1 P L u i =1 γ ( u ) c,l z ( u ) l z ( u ) l T P U u =1 P L u i =1 γ ( u ) c,l − µ c µ T c (12) where { γ ( u ) c,l } C c =1 represent the alignments of z ( u ) l which are the posteriors of z ( u ) l produced by the DNN acoustic model, π c and Σ c are the prior and cov ariance of the c -th mixture component, respectively . The DNN acoustic model is trained in a supervised mode, where the ground-truth labels of the speech frames are the alignments produced by a hidden-Markov-model-GMM (HMM-GMM) speech recognition system. It usually adopts a contextual window with a window size of, e.g. (2 W + 1) , to expand the input from z l to [ z T l − W , . . . , z T l , . . . , z T l + W ] T where W is the half-window length. 3) D-vector fr ont-end: The d-vector front-end [8] averages the frame-level features of an utterance produced from the top hidden layer of a DNN classifier for an utterance-le vel d-vector x . The DNN is trained to minimize the classification error of speech frames, where the ground-truth label of a speech frame is the indicator vector y of the speaker that the speech frame belongs to. The DNN adopts a lar ge contextual window with a window size of (2 W d + 1) to expand its input acoustic feature from z l to [ z T l − W d , . . . , z T l , . . . , z T l + W d ] T , which is important in improving the effecti veness and robustness of the d-vector front-end. I I I . E X P E R I M E N T S In this section, we present the databases and e valuation metrics at first in Section III-A, then the experimental setup in Section III-B, and finally the experimental results in Sections III-C and III-D. T ABLE I D E SC R I P TI O N O F T E S T C O ND I T IO N S . Name Length of enrollment speech Length of test speech 15"-15" 15 seconds 15 seconds 30"-15" 30 seconds 15 seconds 45"-15" 45 seconds 15 seconds 75"-15" 75 seconds 15 seconds 150"-15" 150 seconds 15 seconds 225"-15" 225 seconds 15 seconds A. Databases and evaluation metrics W e took the 8 con v condition of NIST 2006 speaker recog- nition ev aluation (SRE) database as the dev elopment set, and the 8 con v condition of NIST 2008 SRE for enrollment and test. The 8 con v condition of NIST 2006 SRE contains 402 female speakers and 298 male speakers. The 8 con v condition of NIST 2008 SRE contains 395 female speakers and 240 male speakers. Each speaker has 8 con versations. A speaker utterance in a conv ersation was about 1 to 2 minutes long after removing the silence segments by V AD, where we took its ASR transcript as its V AD label. W e split all speech signals into 15 second segments. T o illustrate the global performance of the proposed method in terms of detection error tradeoff (DET) curves, we built an initial test condition as follows. W e selected the first 150 second speech of the first con versation of a speaker as the enrollment data of the speaker , and split the last 30 second speech of the 6-th conv ersation of the speaker into two test segments with each segment as an individual test. W e took each speaker as a claimant with the remaining speakers acting as imposters, and rotated through the tests of all speakers. W e conducted the experiment on females and males respectively . The number of claimant and imposter trials are summarized in T able II. The closer the DET curve approaches to the origin, the better the performance is. T o in vestigate how the performance of the proposed method varies with the length of the enrollment speech, we con- ducted experiments in six test conditions described in T able I. Specifically , for each speaker in the 8 con v condition of the NIST 2008 SRE, we first randomly picked 2 segments from a randomly selected con versation with each segment as an individual test; then, we randomly selected X segments from the remaining 7 con versations as the enrollment data of the speaker , where we set X to 1, 2, 3, 5, 10, and 15 for the six test conditions respectiv ely . For a giv en test condition, we built the claimant and imposter trials in the same way as the initial test condition. Therefore, the number of the trials are the same as that in T able II. Because the enrollment and test speech of a trial was selected randomly , we ran the experiments on each test condition 100 times and reported the av erage results so as to pre vent biased conclusions. W e used equal error rate (EER), minimum detection cost function (DCF) with SRE’08 parameters (DCF 08 ), and minimum DCF with SRE’10 parameters (DCF 10 ) as the ev aluation metrics. The smaller the EER or DCF is, the better the performance is. 4 T ABLE II N U MB E R O F C L A IM A N T A N D I M PO S T E R T RI A L S . #speakers #true trials #imposter trials Female 395 790 311,260 Male 240 480 114,720 B. Experimental setup 1) Acoustic featur es: W e set the frame length to 25 ms and the frame shift to 10 ms. W e extracted 19-dimensional mel-frequency cepstral coefficients (MFCC), 13-dimensional relativ e spectral filtered perceptual linear predictive cepstral coefficients (RAST A-PLP) and 1-dimensional log energy , as well as their delta and delta-delta coefficients from each frame, which produced a total of 99-dimensional acoustic feature per frame. 2) F r ont-ends: For the GMM/i-vector front-end, we used gender-dependent UBMs containing 2048 Gaussian mixtures and 400 total factors defined by the total variability matrix T . W e followed the MSR identity toolbox for the implementation of the GMM/i-vector front-end. For the DNN/i-vector front-end, we trained a DNN acoustic model from the Switchboard-1 database. The alignments of the frames for the DNN training, which contained 8730 senones, were generated by a HMM-GMM speech recognition system implemented in the Kaldi pipeline. The half-window length W of the DNN was set to 3, which expanded the acoustic features to 693 dimensions. As a result, the DNN acoustic model used the 693-dimensional feature as the input and its corresponding 8730 dimensional alignment as the ground- truth label. The DNN has 7 hidden layers, each of which consists of 2048 rectified linear units. The output units of the DNN are the softmax functions. The DNN was optimized by the minimum cross-entropy criterion. The number of epoches for backpropagation training was set to 50 . The batch size was set to 512 . The learning rate of the stochastic gradient descent was set to 0 . 1 . The momentum was set to 0.5 for the first 10 epoches, and set to 0.9 for the other epoches. The dropout rate of the hidden units was set to 0.2. W e used the posterior probability of the dev elopment data produced by the DNN acoustic model to train gender-dependent UBMs. Because many senones have small posterior probabilities, we truncated the UBMs from 8730 Gaussian mixtures to 3096 Gaussian mixtures by discarding the mixtures that hav e small zero-th order Baum-W elsh statistics. W e used 400 total factors to generate the i-vectors. For the d-vector front-end, we trained gender -dependent DNNs on the dev elopment data, where the two DNNs have the same parameter setting as follo ws. The half-windo w length W d was set to 20, which expanded the acoustic feature to 4059 dimensions. Each DNN has 4 hidden layers, each of which consists of 400 rectified linear units. The output dimensions of the two DNNs are 395 for the females and 240 for the males, respectiv ely . The learning rate of the stochastic gradient descent was set to 0 . 008 . All other parameters were set to the same values as those in the DNN/i-vector front-end. 0.1 0.2 0.5 1 2 5 10 20 40 False Alarm probability (in %) 0.1 0.2 0.5 1 2 5 10 20 40 Miss probability (in %) cosine WCCN+cosine LDA+cosine LDA+PLDA LR+cosine Fig. 1. DET curves of the back-ends with the GMM/i-vector front-end on the female part of the initial test condition. 3) Bac k-ends in comparison: W e compared the LR+cosine back-end with the following back-ends: • Cosine similarity scoring (cosine): The cosine back- end evaluates the cosine similarity of two speaker models directly where the speaker model is simply an av erage of the utterance-lev el feature vectors of the speaker produced from a front-end [6]. • WCCN+cosine: WCCN helps compensate for channel variability [16]. It was first proposed for a SVM based back-end, and then applied to the cosine similarity scor- ing by Dehak et al. [6]. Here we compared with the WCCN+cosine method [6]. • LD A+cosine: LDA is a supervised dimensionality reduc- tion method. Dehak et al. [6] applied LDA to the cosine similarity scoring. Here we set the output dimension of LD A to 200 in all ev aluations, which is a common experimental setting in literature. • LD A+PLDA: The PLD A classifier was first introduced to speaker verification by Kenn y in [13]. LDA is usually used as a feature extractor for PLD A. W e set the output dimension of LD A to 200 in all ev aluations. C. Results W e report the comparison results in the initial test condition in Figs. 1 to 6 respectiv ely . From the figures, we observe that the proposed method outperforms the comparison methods significantly when the GMM/i-vector or DNN/i-vector front- end is used (Figs. 1, 2, 4 and 5), and outperforms the comparison methods slightly when the d-vector front-end is used (Figs. 3 and 6). T o prev ent a biased conclusion that the proposed method happens to have some advantage in the initial test condition, we ran a comparison in the 6 test conditions described in T able I, where each test condition has 100 independent implementations randomly generated from the NIST 2008 5 0.1 0.2 0.5 1 2 5 10 20 40 False Alarm probability (in %) 0.1 0.2 0.5 1 2 5 10 20 40 Miss probability (in %) cosine WCCN+cosine LDA+cosine LDA+PLDA LR+cosine Fig. 2. DET curves of the back-ends with the DNN/i-vector front-end on the female part of the initial test condition. 0.1 0.2 0.5 1 2 5 10 20 40 False Alarm probability (in %) 0.1 0.2 0.5 1 2 5 10 20 40 Miss probability (in %) cosine WCCN+cosine LDA+cosine LDA+PLDA LR+cosine Fig. 3. DET curves of the back-ends with the d-vector front-end on the female part of the initial test condition. SRE database. W e report the a verage results on the male and female parts of the implementations in T ables III and IV respectiv ely . From the tables, we observe that the proposed LR+cosine back-end outperforms the comparison methods when the enrollment speech is longer than 15 seconds, and is comparable to LD A+PLD A when the enrollment speech is 15 seconds long, giv en any of the three front-ends. W e drew the curves of the relative improv ement scores of the proposed method over the best comparison methods in Figs. 7 and 8, where the relative improvement score is defined by: Score = EER LR − EER best _ comp EER best _ comp with EER LR and EER best _ comp denoted as the EERs of the 0.1 0.2 0.5 1 2 5 10 20 40 False Alarm probability (in %) 0.1 0.2 0.5 1 2 5 10 20 40 Miss probability (in %) cosine WCCN+cosine LDA+cosine LDA+PLDA LR+cosine Fig. 4. DET curves of the back-ends with the GMM/i-vector front-end on the male part of the initial test condition. 0.1 0.2 0.5 1 2 5 10 20 40 False Alarm probability (in %) 0.1 0.2 0.5 1 2 5 10 20 40 Miss probability (in %) cosine WCCN+cosine LDA+cosine LDA+PLDA LR+cosine Fig. 5. DET curves of the back-ends with the DNN/i-vector front-end on the male part of the initial test condition. proposed method and best comparison method respectiv ely . From the figures, we observe the following phenomena. (i) The relati ve improv ement is getting lar ger when the enrollment speech is getting longer . An e xception is that, when the DNN/i- vector is used as the front-end, the relativ e improvement is not always increased for the females. This is caused by the fast performance improvement of the cosine similarity scoring when the enrollment speech is getting longer . (ii) The highest relativ e improv ement happens with the GMM/i-vector front- end, which reaches 44.3% for the females in the 225"-15" test condition and 33.0% for the males in the 150"-15" test condition. W e also drew the soft decision scores produced from the LR+cosine and LD A+PLD A back-ends for the females in 6 T ABLE III C O MPA R IS O N R E S ULT S O F T H E BA CK - E N DS O N T H E F E M AL E PA RT S O F T H E 6 T E S T C ON D I T IO N S . EER (in %) DCF 08 DCF 10 GMM/i-vector DNN/i-vector d-vector GMM/i-vector DNN/i-vector d-vector GMM/i-vector DNN/i-vector d-vector 15"-15" Cosine 16.52 12.14 9.87 6.2423 4.8058 4.2655 0.0940 0.0882 0.0873 WCCN+cosine 3.78 4.26 9.87 1.8382 2.2631 4.2655 0.0625 0.0764 0.0873 LD A+cosine 9.70 9.21 10.03 3.9029 3.8131 4.0192 0.0805 0.0833 0.0855 LD A+PLDA 3.08 2.84 7.70 1.3656 1.3634 3.1572 0.0550 0.0575 0.0831 LR+cosine 2.80 3.10 7.45 1.2911 1.4950 2.9859 0.0528 0.0578 0.0748 30"-15" Cosine 10.54 7.14 7.80 4.2643 3.0554 3.5023 0.0833 0.0760 0.0808 WCCN+cosine 2.44 2.71 7.80 1.1682 1.4803 3.5023 0.0485 0.0629 0.0808 LD A+cosine 5.72 5.54 7.72 2.4234 2.4642 3.2372 0.0655 0.0706 0.0789 LD A+PLDA 2.05 1.85 5.80 0.9270 0.9054 2.4158 0.0455 0.0471 0.0750 LR+cosine 1.59 1.77 5.10 0.7326 0.8503 2.1988 0.0391 0.0435 0.0645 45"-15" Cosine 7.63 5.07 7.02 3.2110 2.2481 3.2053 0.0745 0.0679 0.0778 WCCN+cosine 1.98 2.22 7.02 0.9423 1.1902 3.2053 0.0413 0.0563 0.0778 LD A+cosine 4.17 4.12 6.91 1.7938 1.9061 2.9395 0.0563 0.0636 0.0752 LD A+PLDA 1.73 1.57 5.15 0.7831 0.7733 2.1448 0.0410 0.0434 0.0715 LR+cosine 1.18 1.34 4.34 0.5670 0.6585 1.9069 0.0331 0.0380 0.0592 75"-15" Cosine 5.07 3.29 6.57 2.2101 1.5529 2.9559 0.0629 0.0586 0.0745 WCCN+cosine 1.64 1.79 6.57 0.7537 0.9592 2.9559 0.0355 0.0493 0.0745 LD A+cosine 3.01 2.94 6.36 1.3081 1.4282 2.7023 0.0480 0.0554 0.0719 LD A+PLDA 1.53 1.40 4.62 0.6779 0.6855 1.9399 0.0376 0.0396 0.0674 LR+cosine 0.94 1.07 3.70 0.4384 0.5065 1.6927 0.0274 0.0327 0.0545 150"-15" Cosine 2.92 1.89 6.06 1.2964 0.9553 2.7485 0.0493 0.0484 0.0713 WCCN+cosine 1.35 1.46 6.06 0.5999 0.7758 2.7485 0.0308 0.0430 0.0713 LD A+cosine 2.10 2.12 5.81 0.9249 1.0437 2.4882 0.0402 0.0484 0.0683 LD A+PLDA 1.34 1.24 4.25 0.6010 0.6022 1.7482 0.0356 0.0371 0.0640 LR+cosine 0.74 0.86 3.25 0.3375 0.3967 1.4872 0.0233 0.0281 0.0500 225"-15" Cosine 2.14 1.45 5.88 0.9864 0.7626 2.6622 0.0430 0.0438 0.0700 WCCN+cosine 1.24 1.37 5.88 0.5564 0.7024 2.6622 0.0286 0.0409 0.0700 LD A+cosine 1.82 1.85 5.65 0.8148 0.9222 2.4214 0.0371 0.0449 0.0672 LD A+PLDA 1.33 1.22 4.07 0.5771 0.5913 1.6874 0.0344 0.0364 0.0619 LR+cosine 0.69 0.78 3.10 0.3155 0.3674 1.4063 0.0218 0.0265 0.0476 0.1 0.2 0.5 1 2 5 10 20 40 False Alarm probability (in %) 0.1 0.2 0.5 1 2 5 10 20 40 Miss probability (in %) cosine WCCN+cosine LDA+cosine LDA+PLDA LR+cosine Fig. 6. DET curves of the back-ends with the d-vector front-end on the male part of the initial test condition. 45"-15" 75 "-15" Test conditions -10 0 10 20 30 40 50 Relative improvement (in %) 15"-15" 30"-15" 150"-15" 225"-15" GMM/i-vector front-end DNN/i-vector front-end d-vector front-end Fig. 7. Relativ e EER improvement of the LR+cosine back-end over the best comparison methods in the female parts of the 6 test conditions. 7 T ABLE IV C O MPA R IS O N R E S ULT S O F T H E BA CK - E N DS O N T H E M A L E P A RT S O F T H E 6 T E S T C O ND I T IO N S . EER (in %) DCF 08 DCF 10 GMM/i-vector DNN/i-vector d-vector GMM/i-vector DNN/i-vector d-vector GMM/i-vector DNN/i-vector d-vector 15"-15" Cosine 15.74 7.95 10.16 5.9013 3.2361 4.0586 0.0898 0.0755 0.0883 WCCN+cosine 4.14 4.13 10.16 1.8184 1.9061 4.0586 0.0661 0.0713 0.0883 LD A+cosine 9.89 6.55 10.29 3.8431 2.7328 3.8002 0.0781 0.0717 0.0785 LD A+PLDA 3.72 3.33 8.58 1.5178 1.4099 3.2521 0.0630 0.0654 0.0858 LR+cosine 3.55 3.44 8.37 1.5312 1.4960 3.1300 0.0572 0.0557 0.0793 30"-15" Cosine 10.03 4.31 8.12 3.9863 1.8684 3.3539 0.0780 0.0598 0.0837 WCCN+cosine 2.63 2.68 8.12 1.1601 1.2544 3.3539 0.0523 0.0588 0.0837 LD A+cosine 5.87 3.77 7.97 2.3780 1.6657 3.0572 0.0630 0.0571 0.0720 LD A+PLDA 2.50 2.25 6.46 1.0336 0.9715 2.5377 0.0544 0.0588 0.0822 LR+cosine 2.05 2.08 5.90 0.9079 0.9157 2.3789 0.0448 0.0446 0.0727 45"-15" Cosine 7.38 2.94 7.25 3.0176 1.3420 3.0528 0.0682 0.0516 0.0810 WCCN+cosine 2.08 2.12 7.25 0.9033 1.0171 3.0528 0.0451 0.0507 0.0810 LD A+cosine 4.29 2.81 7.00 1.7848 1.2687 2.7608 0.0545 0.0498 0.0682 LD A+PLDA 2.08 1.83 5.59 0.8581 0.8065 2.2553 0.0508 0.0550 0.0799 LR+cosine 1.54 1.57 4.99 0.6975 0.7030 2.0807 0.0385 0.0385 0.0689 75"-15" Cosine 4.80 1.93 6.68 2.0268 0.9133 2.7933 0.0564 0.0423 0.0785 WCCN+cosine 1.65 1.70 6.68 0.7231 0.8063 2.7933 0.0384 0.0431 0.0785 LD A+cosine 3.07 2.11 6.25 1.3144 0.9545 2.4982 0.0452 0.0417 0.0638 LD A+PLDA 1.74 1.56 5.06 0.7340 0.6900 1.9961 0.0477 0.0516 0.0778 LR+cosine 1.14 1.20 4.13 0.5295 0.5530 1.7971 0.0327 0.0323 0.0644 150"-15" Cosine 2.92 1.28 6.28 1.2581 0.6091 2.6047 0.0442 0.0339 0.0752 WCCN+cosine 1.38 1.42 6.28 0.6140 0.6831 2.6047 0.0333 0.0373 0.0752 LD A+cosine 2.27 1.61 5.83 0.9524 0.7351 2.3034 0.0381 0.0352 0.0606 LD A+PLDA 1.57 1.41 4.69 0.6839 0.6470 1.8220 0.0458 0.0502 0.0744 LR+cosine 0.93 1.03 3.73 0.4423 0.4682 1.6328 0.0290 0.0285 0.0602 225"-15" Cosine 2.23 1.03 6.04 0.9779 0.4954 2.5024 0.0383 0.0302 0.0746 WCCN+cosine 1.28 1.29 6.04 0.5518 0.6083 2.5024 0.0309 0.0346 0.0746 LD A+cosine 1.89 1.42 5.53 0.8172 0.6262 2.2010 0.0352 0.0320 0.0590 LD A+PLDA 1.49 1.29 4.41 0.6461 0.6154 1.7348 0.0453 0.0488 0.0737 LR+cosine 0.86 0.94 3.43 0.3913 0.4057 1.5194 0.0267 0.0262 0.0582 45"-15" 75 "-15" Test conditions -10 0 10 20 30 40 50 Relative improvement (in %) 15"-15" 30"-15" 150"-15" 225"-15" GMM/i-vector front-end DNN/i-vector front-end d-vector front-end Fig. 8. Relativ e EER improvement of the LR+cosine back-end over the best comparison methods in the male parts of the 6 test conditions. Fig. 9 where we hav e normalized the decision scores to a range where the mean values of the decision scores of the imposter and true trials are zero and one respectiv ely . From the figure, we observe that the scores produced by LR+cosine hav e smaller with-in class variances and smaller overlaps than those produced by LD A+PLD A. D. Effects of back-ends in fusion systems Fusing the decision scores produced from multiple base methods is an effecti ve way for further improving the per - formance of the base methods. This subsection studies the approach of averaging the soft decision scores produced from the systems that use GMM/i-vector and DNN/i-vector as the front-ends, respectively . Figures 10 and 11 sho w the DET curves of the fusion systems with different back-ends on the initial test condition. T ables V and VI list the comparison results of the fusion systems on the 6 test conditions defined in T able I. From the figures and tables, we observe the same experimental phenomena as those in Section III-C, which supports the ef fectiv eness of the LR+cosine back-end in the fusion systems. Note that we have also ev aluated the fusion systems that fuse the GMM/i-vector , DNN/i-vector , and d-vector front-ends 8 -2 -1 0 1 2 0 0.05 0.1 0.15 0.2 0.25 0.3 Probability 15"-15" -2 -1 0 1 2 0 0.05 0.1 0.15 0.2 0.25 0.3 30"-15" -2 -1 0 1 2 0 0.05 0.1 0.15 0.2 0.25 0.3 45"-15" -2 -1 0 1 2 Normalized scores 0 0.05 0.1 0.15 0.2 0.25 0.3 Probability 75"-15" -2 -1 0 1 2 Normalized scores 0 0.05 0.1 0.15 0.2 0.25 0.3 150"-15" -2 -1 0 1 2 Normalized scores 0 0.05 0.1 0.15 0.2 0.25 0.3 225"-15" LDA+PLDA (true tests) LDA+PLDA (imposter tests) LR+cosine (true tests) LR+cosine (imposter tests) Fig. 9. Histograms of the soft decision scores produced by LR+cosine and LDA+PLD A in the female parts of the 6 test conditions, where the decision scores hav e been normalized so that the mean values of the imposter and true trials are zero and one respectiv ely . 0.1 0.2 0.5 1 2 5 10 20 40 False Alarm probability (in %) 0.1 0.2 0.5 1 2 5 10 20 40 Miss probability (in %) cosine WCCN+cosine LDA+cosine LDA+PLDA LR+cosine Fig. 10. DET curves of the fusion systems on the female part of the initial test condition. together . The experimental conclusions are similar with the abov e. I V . C O N C L U S I O N S In this paper , we hav e presented a speaker verification back- end based on linear regression. Linear regression is a simple linear model that minimizes the mean squared estimation 0.1 0.2 0.5 1 2 5 10 20 40 False Alarm probability (in %) 0.1 0.2 0.5 1 2 5 10 20 40 Miss probability (in %) cosine WCCN+cosine LDA+cosine LDA+PLDA LR+cosine Fig. 11. DET curves of the fusion systems on the male part of the initial test condition. error between the target and its estimate with a closed form solution, where the target for our speaker verification problem is defined as the ground-truth indicator vectors of utterances. The proposed LR+cosine back-end first learns speaker models by the LR model, and then applies the cosine similarity scoring to ev aluate the similarity of a pair of speaker models. W e hav e further proposed three LR-based speaker verification systems 9 T ABLE V C O MPA R IS O N R E S ULT S O F T H E BA CK - E N DS I N T H E F U S IO N S Y S T EM S O N T H E F EM A L E PA RTS O F T H E 6 T E S T C O ND I T I ON S . EER (in %) DCF 08 DCF 10 15"-15" Cosine 9.85 3.9613 0.0816 WCCN+cosine 3.34 1.6565 0.0625 LD A+cosine 6.72 2.7861 0.0720 LD A+PLD A 2.64 1.1850 0.0491 LR+cosine 2.46 1.1496 0.0501 30"-15" Cosine 5.32 2.3171 0.0669 WCCN+cosine 2.12 1.0516 0.0486 LD A+cosine 3.78 1.6648 0.0575 LD A+PLD A 1.73 0.7877 0.0399 LR+cosine 1.43 0.6557 0.0369 45"-15" Cosine 3.59 1.6360 0.0582 WCCN+cosine 1.76 0.8402 0.0416 LD A+cosine 2.69 1.2355 0.0498 LD A+PLD A 1.48 0.6643 0.0359 LR+cosine 1.07 0.5102 0.0317 75"-15" Cosine 2.22 1.0728 0.0487 WCCN+cosine 1.44 0.6726 0.0356 LD A+cosine 1.88 0.8991 0.0424 LD A+PLD A 1.31 0.5844 0.0328 LR+cosine 0.89 0.3925 0.0269 150"-15" Cosine 1.27 0.6418 0.0393 WCCN+cosine 1.18 0.5437 0.0308 LD A+cosine 1.35 0.6384 0.0358 LD A+PLD A 1.16 0.5038 0.0308 LR+cosine 0.72 0.3108 0.0230 225"-15" Cosine 0.97 0.5041 0.0349 WCCN+cosine 1.11 0.4976 0.0289 LD A+cosine 1.17 0.5593 0.0332 LD A+PLD A 1.13 0.4923 0.0300 LR+cosine 0.66 0.2911 0.0217 by combining the LR+cosine back-end with the GMM/i- vector , DNN/i-vector , and d-vector front-ends respectiv ely . W e hav e conducted an extensi ve experiment on the NIST 2006 SRE and NIST 2008 SRE data sets, where we used the 8 con v condition of the NIST 2006 SRE for de velopment and the 8 con v condition of the NIST 2008 SRE for enrollment and test. T o prev ent a biased experimental conclusion on a particular ev aluation en vironment, the experiment was carried out with dif ferent lengths of enrollment speech cov ering a range from 15 seconds to 225 seconds and repeated 100 times. The experimental results sho w that the proposed LR+cosine back-end outperforms se veral common back-ends including the cosine, WCCN+cosine, LD A+cosine, and LD A+PLDA back-ends in most cases in terms of DET curves, EER, DCF 08 , and DCF 10 . V . A C K N OW L E D G E M E N T S This work was supported in part by the Natural Science Foundation of China under Grant No. 61671381. T ABLE VI C O MPA R IS O N R E S ULT S O F T H E BA CK - E N DS I N T H E F U S IO N S Y S T EM S O N T H E M AL E PART S O F T H E 6 T E S T C ON D I T IO N S . EER (in %) DCF 08 DCF 10 15"-15" Cosine 7.75 3.0791 0.0713 WCCN+cosine 3.60 1.6093 0.0636 LD A+cosine 5.92 2.3919 0.0646 LD A+PLD A 3.21 1.3305 0.0592 LR+cosine 3.04 1.3140 0.0531 30"-15" Cosine 4.16 1.7299 0.0557 WCCN+cosine 2.36 1.0279 0.0502 LD A+cosine 3.23 1.3784 0.0496 LD A+PLD A 2.17 0.9102 0.0528 LR+cosine 1.78 0.8054 0.0422 45"-15" Cosine 2.77 1.2232 0.0479 WCCN+cosine 1.85 0.8134 0.0428 LD A+cosine 2.38 1.0190 0.0421 LD A+PLD A 1.78 0.7465 0.0486 LR+cosine 1.37 0.6244 0.0358 75"-15" Cosine 1.71 0.7997 0.0388 WCCN+cosine 1.46 0.6495 0.0359 LD A+cosine 1.68 0.7529 0.0346 LD A+PLD A 1.51 0.6403 0.0456 LR+cosine 1.04 0.4770 0.0304 150"-15" Cosine 1.08 0.5223 0.0309 WCCN+cosine 1.27 0.5602 0.0313 LD A+cosine 1.26 0.5737 0.0295 LD A+PLD A 1.34 0.5974 0.0442 LR+cosine 0.89 0.4074 0.0269 225"-15" Cosine 0.85 0.4194 0.0274 WCCN+cosine 1.12 0.4976 0.0286 LD A+cosine 1.06 0.4904 0.0267 LD A+PLD A 1.27 0.5681 0.0429 LR+cosine 0.80 0.3586 0.0247 R E F E R E N C E S [1] J. Markel, B. Oshika, and A. Gray , “Long-term feature averaging for speaker recognition, ” IEEE T rans. Acoust., Speech, Signal Pr ocess. , vol. 25, no. 4, pp. 330–337, 1977. [2] F . K. Soong, A. E. Rosenberg, B.-H. Juang, and L. R. Rabiner, “Report: A vector quantization approach to speaker recognition, ” A T&T T ech. J. , vol. 66, no. 2, pp. 14–26, 1987. [3] D. A. Reynolds, “Speaker identification and verification using gaussian mixture speaker models, ” Speech Commun. , vol. 17, no. 1, pp. 91–108, 1995. [4] D. A. Reynolds and R. C. Rose, “Robust text-independent speaker identification using gaussian mixture speaker models, ” IEEE T rans. Speech, Audio Pr ocess. , vol. 3, no. 1, pp. 72–83, 1995. [5] D. A. Reynolds, T . F . Quatieri, and R. B. Dunn, “Speaker verification using adapted gaussian mixture models, ” Digital Signal Pr ocess. , vol. 10, no. 1-3, pp. 19–41, 2000. [6] N. Dehak, P . J. Kenny , R. Dehak, P . Dumouchel, and P . Ouellet, “Front- end factor analysis for speaker verification, ” IEEE T rans. Audio, Speec h, Lang. Process. , vol. 19, no. 4, pp. 788–798, 2011. [7] A. K. Sarkar, C.-T . Do, V .-B. Le, and C. Barras, “Combination of cep- stral and phonetically discriminative features for speaker verification, ” IEEE Signal Pr ocess. Lett. , vol. 21, no. 9, pp. 1040–1044, 2014. [8] E. V ariani, X. Lei, E. McDermott, I. L. Moreno, and J. Gonzalez- Dominguez, “Deep neural networks for small footprint text-dependent speaker verification, ” in Proc. IEEE Int. Conf. Acoust., Speech, Signal Pr ocess. , 2014, pp. 4052–4056. 10 [9] Y . Lei, N. Scheffer , L. Ferrer , and M. McLaren, “ A novel scheme for speaker recognition using a phonetically-aware deep neural network, ” in Pr oc. IEEE Int. Conf. Acoust., Speech, Signal Pr ocess. , 2014, pp. 1695–1699. [10] F . Richardson, D. Reynolds, and N. Dehak, “Deep neural network approaches to speaker and language recognition, ” IEEE Signal Process. Lett. , vol. 22, no. 10, pp. 1671–1675, 2015. [11] W . M. Campbell, D. E. Sturim, and D. A. Reynolds, “Support vector machines using GMM supervectors for speaker verification, ” IEEE Signal Pr ocess. Lett. , vol. 13, no. 5, pp. 308–311, 2006. [12] W . M. Campbell, D. E. Sturim, D. A. Reynolds, and A. Solomonoff, “SVM based speaker verification using a GMM supervector kernel and NAP variability compensation, ” in Pr oc. IEEE Int. Conf. Acoust., Speech, Signal Process. , 2006, pp. 1–4. [13] P . Kenn y , “Bayesian speaker verification with heavy-tailed priors. ” in Pr oc. Odyssey , 2010, pp. 14–23. [14] D. Snyder , P . Ghahremani, D. Pove y , D. Garcia-Romero, Y . Carmiel, and S. Khudanpur, “Deep neural network-based speaker embeddings for end-to-end speaker verification, ” in Pr oc. IEEE Spoken Lang. T ech. W orkshop , 2016, pp. 165–170. [15] P . Kenny , P . Ouellet, N. Dehak, V . Gupta, and P . Dumouchel, “ A study of interspeaker variability in speaker verification, ” IEEE T rans. Audio, Speech, Lang. Pr ocess. , vol. 16, no. 5, pp. 980–988, 2008. [16] A. O. Hatch, S. S. Kajarekar, and A. Stolcke, “W ithin-class covariance normalization for SVM-based speaker recognition, ” in Pr oc. Inter speech , 2006, pp. 1874–1877.
Original Paper
Loading high-quality paper...
Comments & Academic Discussion
Loading comments...
Leave a Comment