Scalable Preprocessing of High Volume Bird Acoustic Data
In this work, we examine the problem of efficiently preprocessing high volume bird acoustic data. We combine several existing preprocessing steps including noise reduction approaches into a single efficient pipeline by examining each process individu…
Authors: Alex, er Brown, Saurabh Garg
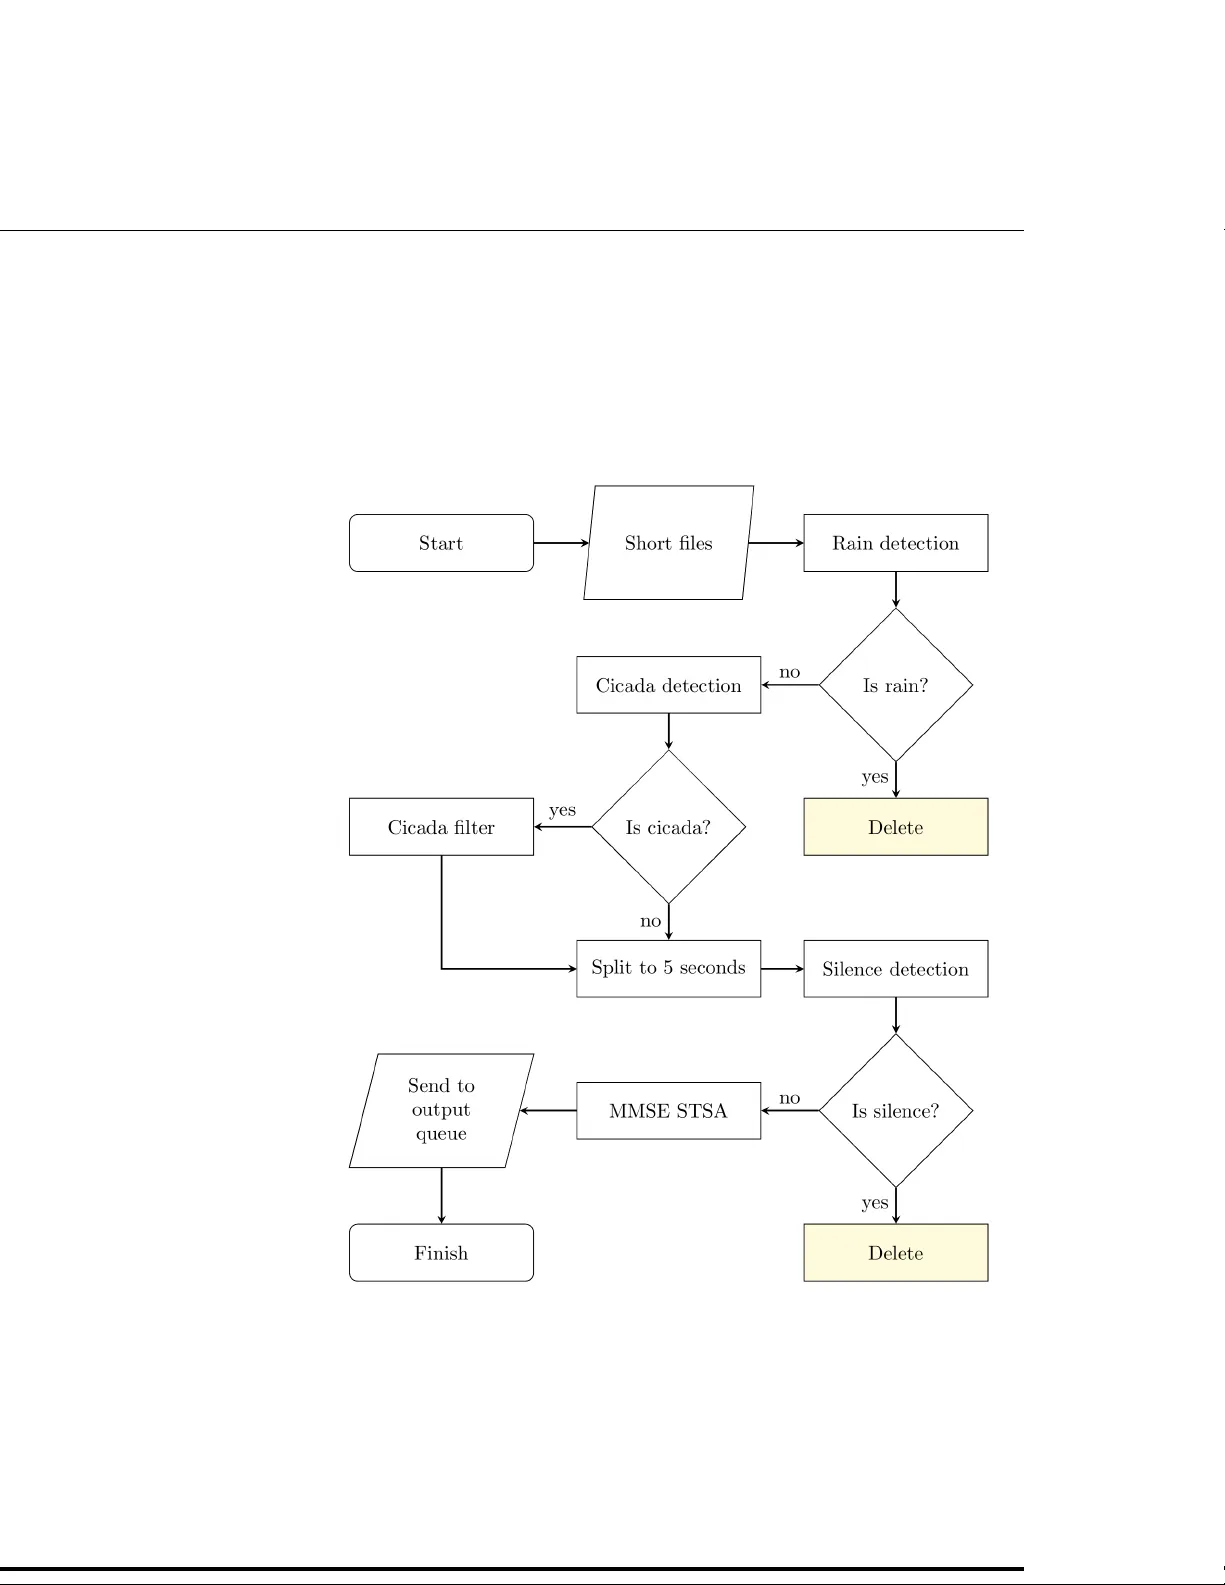
Scalable prepro cessing of high v olume bird acoustic data Alexander Bro wn, Saurabh Garg, James Montgormery S c ho ol of T ec hnology , Environmen ts and Design, Univ ersity of T asmania, Hobart, T asmania, Australia Abstract In this w ork, we examine the problem of efficien tly preprocessing high volume bird acoustic data. W e com bine sev eral existing preprocessing steps including noise reduction approac hes into a single efficien t pipeline by examining eac h pro cess individually . W e then utilise a distributed computing architecture to impro v e execution time. Using a master-sla ve model with data parallelisation, we dev eloped a near-linear automated scalable system, capable of prepro cessing bird acoustic recordings 21.76 times faster with 32 cores o ver 8 virtual mac hines, compared to a serial process. This work con tributes to the research area of bioacoustic analysis, which is curren tly v ery active because of its p oten tial to monitor animals quickly at lo w cost. Ov ercoming noise in terference is a significant c hallenge in many bioacoustic studies, and the v olume of data in these studies is increasing. Our work mak es large scale bird acoustic analyses more feasible b y parallelising imp ortan t bird acoustic pro cessing tasks to significan tly reduce execution times. In tro duction Bird monitoring has recen tly b een of great researc h interest because of its broad range of applications including trac king migration [1], monitoring bio div ersity [2], and trac king p opulation size [3]. Monitoring is highly imp ortan t b ecause it can be used to measure h uman impact on the environmen t [3, 4]. A current approac h to bird monitoring is to set up sensors to record vocalisations. The science of analysing animal v o calisations is called bioacoustics. Almost all bioacoustic analyses require audio to b e prepro cessed to get it in to a form suitable for analysis. This could include data compression tec hniques to sp eed up pro cessing suc h as remo ving unnecessary audio c hannels [5] and downsampling [6]. It can also include impro ving the qualit y of audio b y reducing noise in terference, which is a k ey c hallenge for many bioacoustic studies b ecause noise can mask v o calisations of in terest [7]. Noise can b e considered to be an y sound that is not pro duced b y a bird. It is of great interest to remo v e these noises so that further pro cessing (e.g. bird iden tification) can fo cus on the parts of a recording con taining bird sound without in terference. Many approac hes already exist for detecting and remo ving noise from multiple sources [8 – 12]. Curren tly , many bioacoustic prepro cessing approac hes are applied individually in a man ual or semi-automated wa y . Ho wev er, such approaches are not w ell suited to large scale studies b ecause of the time required to pro cess recordings [7, 13, 14]. Recorders are b eing deploy ed in larger n umbers across different natural environmen ts, and so are collecting bioacoustic data at high v olumes, sometimes on the order of hundreds of gigab ytes p er da y [15]. Moreov er, prepro cessing is made up of multiple steps, and previous w ork do es not consider how to efficiently combine pro cesses together. Thus, it is not trivial to ev en apply an off-the-shelf solution such as Hado op to pro cess such large amoun ts of data. While there ha ve b een some attempts to scale the pro cessing of 1/28 bioacoustic data using distributed systems [15 – 17], these do not fo cus on prepro cessing steps, and use off-the-shelf solutions (e.g. Hado op, or MA TLAB distributed file system) whic h add ov erhead and do not utilise low lev el control ov er data, resulting in inefficiencies. In this w ork, we examine how to prepro cess high volume bird acoustic data quickly and efficiently . T o ac hieve this, we com bine existing prepro cessing steps into an efficien t pro cessing pip eline. This includes compression and the remov al of several types of noise, namely stationary background noise, rain, and cicada choruses. W e also remo ve silence to impro ve pro cessing efficiency . The order in which to p erform these approac hes is significan t in that time can b e sa ved by skipping unneeded pro cesses in some files. This order is determined here b y examining how muc h audio eac h pro cess remo ves, and the effect of some pro cesses on the accuracy of others. T o increase pro cessing sp eed, we derive a mechanism to distribute this unified pip eline across multiple machines in an efficient and scalable manner. This greatly increases the computing p o w er av ailable for pro cessing the pip eline, increasing pro cessing sp eeds and making the pro cessing of very large amounts of bioacoustics data more feasible. An emphasis is placed on scalability , aiming for linear prop ortionalit y b et w een the improv emen t rate of execution time and the amoun t of resources used. Bac kground This section introduces the ob jectiv es of our w ork, b efore listing the pro cesses we will b e using. It then introduces the pro cessing pip eline, giving a brief ov erview of ho w we deriv e it, b efore discussing ho w we approach the distribution of the pip eline. Pip eline pro cesses This w ork fo cuses on improving the efficiency of prepro cessing bird acoustic recordings, whic h can later b e used for further analysis, suc h as sp ecies detection. The prepro cessing stage consists of the following tasks: • Splitting : Audio is split into smaller c hunks which allows for work to b e distributed more easily . Additionally , long files are not viable for pro cessing on their own b ecause of high RAM requiremen ts [15], and some classification tasks in the pip eline work b etter on shorter samples. • Do wnsampling : Audio files hav e sample rates con verted to 22.05 kHz to reduce their size. Bird sounds are normally b elo w 11.025 kHz (the Nyquist frequency) [18], so signals of in terest are not lost. • Con v erting to Mono : Only one channel of audio is needed to detect significan t audio signals, so this is used to further reduce the size of files. • High-P ass Filter (1 kHz) : Birds typically do not emit sound b elo w 1 kHz [18], so all data b elo w this frequency is noise and hence is atten uated. • Sound Enhancement : Stationary background noise is reduced. While there are sev eral approaches that can achiev e this [12, 19, 20] we use the Minimum Mean Square Error Short Time Sp ectral Amplitude estimator (MMSE STSA) filter [9], whic h was found in separate work [7] to b e highly effective. • Short-Time F ourier T ransform : Time-based information is transformed in to frequency-based information. Several acoustic indices used in cicada and rain detection use frequency-based information, so this is only executed once, rather 2/28 than for eac h acoustic index calculated, or for each pro cess. The FFT implemen tation used here is from the Apache Commons Math library [21] and is describ ed by Demmel [22]. A windo w size of 256 samples is used with Hamming windo ws with 50% ov erlap. • Hea vy Rain Detection and Remo v al : Hea vy rain is detected by using rules deriv ed from a C4.5 classifier [23] using acoustic indices. This approach is similar to T o wsey et al. [11] and F erroudj [10]. Sp ectral-based signal to noise ratio and p o w er sp ectral density used by Bedoy a et al. [8] were added to the acoustic indices used in the classifier. The classifier was trained on a se parate sample of data and its rules then hard co ded into our Jav a-based implementation prior to beginning the pip eline. • Cicada Detection : Cicada c horuses are detected using the same general approac h as rain detection. • Cicada Remov al : Cicada choruses are remov ed using band-pass filters to eliminate audio from frequency ranges con taining cicada choruses. These ranges are calculated b y examining FFT co efficien ts. Problem ob jectives This w ork aims to improv e the sp eed and efficiency of prepro cessing bird acoustic data b y combining existing prepro cessing tasks in to an efficient pip eline and applying this pip eline in a distributed system. This is done so that large data sets can b e pro cessed in a reasonable time, whic h is b ecoming increasingly imp ortan t b ecause of increasing amoun ts of data b eing recorded [15]. In this work, we do not fo cus on impro ving the efficiency of individual prepro cessing tasks. Challenges Unification of pro cesses The first k ey challenge in achieving the research ob jectives is to determine an efficient approac h to comp ose noise remo v al pro cesses as a single system. This requires several questions to b e answered, such as whether differen t sequences of the denoising tasks affect their accuracy and whether executing some tasks earlier can improv e the ov erall efficiency of the pip eline. In other w ords, we need to inv estigate the trade-off b etw een t wo factors: execution time of each pro cess and how they influence the accuracy of eac h other when applied in a pip eline. W e also consider whic h lengths of audio are b est for p erforming denoising in terms of b oth accuracy and execution time. Distribution of tasks for large scale pro cessing T o supp ort the pre-pro cessing of large volume bird acoustic data distributed computing approac hes can b e utilised. How ev er, determining whic h approach should b e emplo yed for this problem of scalable pro cessing still needs to b e inv estigated. F or this researc h, w e aim to achiev e linear scalability . This means that improv emen ts in execution time (i.e. in terms of ratios) are linearly prop ortional to the n umber of pro cessors used. • Distributed Computing Architectures: There are typically tw o distributed system arc hitectures in literature: the master-slav e and p eer-to-peer mo dels [24]. These determine ho w different comp onen ts of the system communicate with each other, and also guide how work is distributed. In the master-slav e mo del, a single master pro cess manages m ultiple identical slav e pro cesses and distributes work to 3/28 them. This approach is simpler than many other mo dels, suc h as p eer-to-p eer, b ecause the master pro cess handles all work distribution. How ev er, it is also less fault toleran t than other architectures, as the master pro cess is a central p oint of failure, and can b e less scalable than other approaches if, for example, the master pro cess is b eing ov erw ork ed, creating a b ottlenec k [24]. Another arc hitecture is the p eer-to-p eer mo del. This is the opp osite of the master-sla ve mo del, where w orkload is decentralised. Because of the decen tralisation, p eer-to-p eer netw orks are more adaptable than master-sla ve net works, and can b e highly scalable [25]. How ev er, this mo del is also more complex to w ork with in many cases, b ecause communication can o ccur b etw een an y tw o systems in the netw ork, which can create extra ov erhead and ultimately slo w the system down [24]. As suc h, a master-slav e mo del is well suited for the present system, as different parts of the audio can b e prepro cessed indep endently without any requirement of comm unication. The master can simply split files, and distribute them to slav es. This should b e scalable, b ecause the master do es not p erform muc h w ork in splitting audio files and managing distribution, relativ e to the ov erall pip eline. This approac h is comparable to other work with large scale bioacoustics analyses [15 – 17]. • P arallelisation Approac hes: In addition to deciding which architecture to use for our system, w e must also consider how to parallelise the workload. Here, w e will examine t wo such approaches: data parallelisation and functional parallelisation. Data parallelisation in volv es dividing data b etw een machines, and ha ving each mac hine apply pro cessing on the data it receiv es. This is most well suited to problems where data can b e easily split and divided evenly , and pro cessed indep enden tly . F unctional parallelisation inv olv es ha ving machines pro cess differen t functions on the same data. This allows for multiple pro cessors to work on the same data in parallel, but is more difficult to evenly distribute work, particularly if differen t functions take different amounts of time to execute. Data parallelisation is well suited to the pre-pro cessing of bioacoustics data. The nature of audio recordings makes them easy to divide into small c hunks, and hav e eac h ch unk pro cessed on a different machine. F urthermore, detection pro cesses require files to b e split into small ch unks anyw a y (e.g., it mak es little sense to decide if a single da y-long sample is silent). Additionally , pro cesses in our pip eline execute at v ery different sp eeds, and some can remov e audio without completing subsequen t steps, complicating a p oten tial functional parallelisation approach. While w e could use an off-the-shelf system such as Hado op [26] or Spark [27] to ac hieve this parallelisation, these do not give low level control ov er data in order to maximise efficiency . A previous attempt to utilise Hado op and Spark for some prepro cessing steps (such as splitting bioacoustic audio files and generating sp ectrograms) by Thudum u et al. [17] did not achiev e linear scalability . Moreo ver, for the b est results, the inv estigation of the exact split length of each audio file for each pre-pro cessing task, the sequence of each task and how they are distributed for linear scalabilit y are still needed. Therefore, in this pap er we inv estigate these factors and prop ose a master-sla ve based data parallelisation system for pre-pro cessing high volume bioacoustic data. 4/28 Pro cessing pip eline The pro cessing pip eline unifies prepro cessing tasks previously describ ed to prepare bioacoustic data for future analysis. W e aim to do this as efficiently as p ossible, while main taining the accuracy of detection pro cesses. As such, the execution order is imp ortan t, b ecause some pro cesses remov e or mo dify the audio. Remov ed audio do es not need to b e pro cessed by subsequent steps in the pip eline, increasing efficiency , whereas mo dified audio affects the accuracy of subsequent detection steps, which affects the o verall effectiveness of the pip eline. The pip eline is deriv ed by first ev aluating execution times for each pro cess, and how this v aries with the lengths of audio ch unks processed at a time. W e then ev aluate the accuracy of noise detection pro cesses b efore and after applying the MMSE STSA filter, and finally test to see if detection approac hes hav e a dep endency on split length. Ev aluation for sequencing of the pro cessing pip eline Three exp eriments are conducted to help in dev eloping the pro cessing pip eline. The first exp erimen t lo oks at the computation times for eac h pro cessing step, and how these v ary dep ending on the size of data they are pro cessing at once (called file split size/length). This exp erimen t identifies fast and slo w pro cesses. F aster pro cesses are placed earlier in the pip eline where p ossible if they can result in later, slo wer pro cesses b eing skipp ed for some data (i.e. due to the deletion of audio). This exp eriment can help to identify whic h split lengths result in faster execution for each pro cess, which can b e used to impro ve their execution time. The second exp erimen t examines the effect of the MMSE STSA filter, whic h alters audio files in a significan t wa y and affects detection pro cesses. As such, we test the accuracy of detection approac hes b efore and after applying the filter. The final exp erimen t lo oks at whether detection accuracy is dep enden t on the length of c hunks into which the audio is split. W e take a random 30 min ute sample extracted from four da ys of unsup ervised en vironmental recordings, manually classify rain and cicada c horuses and compare this to the automatic classifiers. This can show if detectors w ork b etter on certain lengths. This is imp ortan t in determining the pro cessing order, b ecause files can only b e split, and not joined (as adjacent ch unks ma y b e sent to different slav es), meaning detection pro cesses with longer split lengths will need to run earlier than those that do not. Recording data En vironmental recordings for ev aluating the system ha ve b een provided by the Samford Ecological Research F acility (SERF), based in the Queensland Universit y of T echnology (QUT). These recordings w ere taken ov er fiv e days b et ween 12 Octob er 2010 and 16 Octob er 2010, ov er four sensors, for a total of 20 days of audio to pro cess. In practice, four da ys of recordings are used in testing. Recordings from this group hav e b een used in sev eral studies b efore [11, 14, 15]. While these recordings are of high quality , they do con tain significant levels of background noise, large v ariations in the loudness of bird sounds, ranging from v ery clear to barely audible, and noise interference from many sources including rain and cicadas, whic h makes the sample well suited for this study . P er-step execution time A test is conducted where eac h step is p erformed indep enden tly . Two hours of audio kno wn to contain rain, cicada choruses and bird sounds is passed through the pro cessing pip eline in sequence, using one pro cessor. The split length is v aried (from 5 to 30 5/28 Fig 1. Computation times p er pro cess for different split lengths up to cicada detection. Error bars indicate standard deviation (FFT = F ast F ourier T ransform, HPF = High-P ass Filter, MMSE STSA = Minimum Mean Square Error Short Time Sp ectral Amplitude filter) T able 1. Computation times for each processing step in relation to split lengths with standard deviations Processing Step Split Length (seconds) 5 10 15 20 30 Splitting 7.85 ± 0.42 7.95 ± 0.49 8.13 ± 0.51 9.24 ± 0.42 8.87 ± 0.42 Downsampling 10.18 ± 0.42 9.59 ± 0.68 9.30 ± 0.30 9.29 ± 0.52 9.57 ± 0.19 High-pass Filter 86.63 ± 0.13 47.79 ± 0.17 34.8 ± 0.18 28.2 ± 0.11 21.67 ± 0.09 F ast F ourier transform 2.39 ± 1.01 47.79 ± 1.44 71.90 ± 1.36 73.15 ± 0.56 73.21 ± 0.95 Rain Filter 41.11 ± 0.20 40.46 ± 0.20 39.86 ± 0.15 39.94 ± 0.18 42.67 ± 1.16 Cicada Detection 30.47 ± 0.20 31.58 ± 0.20 32.04 ± 0.08 32.32 ± 0.26 31.36 ± 0.60 Cicada Filter 103.48 ± 0.56 64.30 ± 0.18 51.94 ± 0.22 45.27 ± 0.23 37.46 ± 0.52 MMSE STSA 1020.57 ± 6.49 1002.65 ± 5.98 993.10 ± 3.39 986.92 ± 3.09 923.21 ± 21.78 seconds in 5-second incremen ts) to observe its effects on pro cessing time. Each test is completed five times for each split length, and the av erage and standard deviation of the computation times are tak en. Fig. 1 and T able 1 sho ws the execution times for all pro cesses for 2 hours (1.2 GB) of audio. Each pro cess is applied to every file, although, once the pip eline is dev elop ed, not all pro cesses are applied to every file, as some files may be remo ved b ecause they con tain rain. The figure shows tw o distinctive features. First is the large decrease in the execution time of the high-pass, cicada, and MMSE STSA filters filters when the split size is larger. The differences in high-pass and cicada execution times are likely due to the use of the non-nativ e sound pro cessing library Sound eXc hange (SoX) [28]. This causes extra o verhead with each call, and shorter split sizes require more calls to SoX. This is more of a problem for high-pass filtering than cicada filtering, as this is executed on ev ery file, whereas cicada filtering only applies to parts of the recording where cicada c horuses are detected, whic h, as determined b y subsequent testing, is a small fraction of the total recording. 6/28 Fig 2. High-pass filtering computation times High-pass filtering computation times comparison, b et w een splitting to the final length, downsampling, and then high-pass filtering (one split) and splitting to 1-min ute (2.5 MB) ch unks first, do wnsampling and high-pass filtering, then splitting to the final length (tw o splits) The second observ ation is that the MMSE STSA filter takes muc h longer than the other pro cessing steps combined. As such, execution time can b e significan tly sav ed b y remo ving audio b efore the MMSE STSA filter is applied. The trend in high pass filter execution time gives rise to a p otential improv emen t. If clips are split in to larger ch unks first, downsampled and high-pass filtered, and then split in to smaller ch unks, execution time can b e improv ed. T esting an approac h that p erforms this sho ws an improv emen t in execution time, as sho wn in Fig. 2. Here, audio is split in to 1-minute (2.5 MB) long ch unks, do wnsampled, high-pass filtered, and then split to the target split length. Two hours of audio is tested against tw o approaches, one that splits audio to the target length immediately , and one that split files into 1-minute long c hunks first, and then splits again. While it would b e theoretically optimal to run a high-pass filter on whole audio files, rather than running an initial split to 1-min ute long ch unks, some consideration needs to b e made for when this pip eline is pro cessed in parallel, where it is adv an tageous to start allo cating files to machines to pro cess as quickly as p ossible, and to give them shorter files suc h that work can b e distributed more evenly . As such, this initial split length is used as an input parameter to test the distributed system to find an efficient configuration. Silence remov al As discussed ab o v e, it is highly adv an tageous to remo ve audio b efore execution the MMSE STSA filter b ecause of its long execution time. Audio con taining heavy rain is already remov ed, but ev en more audio can b e remov ed b y detecting audio that do es not con tain any bird sound of interest. Because of this, we in tro duce a basic silence remov al approac h to the pro cessing pip eline. This approach uses a simple threshold. The choice of threshold is derived next, based on one of tw o acoustic indices taken from Bedoy a et al. [8]: Po w er Sp ectral Density (PSD), and Signal to Noise Ratio (SNR). In testing the execution time of this silence detection approac h, we found it takes a very short time relativ e to other pro cesses, taking approximately 10 seconds to pro cess 2 hours (1.2 GB) of audio, regardless of the split length. Silence detection testing is no w added to subsequent tests used in ev aluating the pro cessing pip eline. 7/28 T able 2. Comparison of Detection Accuracy Dep ending on Use of MMSE STSA Filter Filter Cicada Accuracy Rain Accuracy Ra w 99.3% 96.9% MMSE STSA 99.1% 92.9% T able 3. Area Under the Curve (A UC) results for Silence Remov al, with 95% Confidence Interv als (CI) for raw and MMSE STSA filtered audio using P ow er Sp ectral Densit y (PSD) and Signal to Noise Ratio (SNR) thresholds. Audio Source Index AUC 95% CI Ra w PSD 0.768 0.745–0.831 Ra w SNR 0.939 0.910–0.969 Filtered PSD 0.913 0.8818–0.944 Filtered SNR 0.929 0.894–0.964 Effect of the MMSE STSA filter on noise reduction The Minim um Mean Square Error Short Time Sp ectral Amplitude estimator (MMSE STSA) [9] is a pro cess within the pro cessing pip eline that reduces stationary background noise. Because this pro cess makes signals clearer, it seems likely that this pro cess w ould impro ve the accuracy of detection pro cesses. How ev er, this pro cess is time consuming, as sho wn in Fig. 1, so pro cesses should only b e applied after the MMSE STSA filter if they show significant improv emen t in detection accuracy , particularly if these pro cesses remo ve audio, as remov ed audio do es not need to b e pro cessed further. Here, w e test the accuracy of rain, cicada, and silence filters b efore and after applying the MMSE STSA filter to determine where they b elong in the pip eline, relative to the MMSE STSA filter. W e first ev aluate the accuracy of rain and cicada detection when the MMSE STSA filter is applied. F or this test, acoustic indices were calculated for raw audio, and audio pro cessed by the MMSE STSA filter (although a 1 kHz high-pass filter was used for eac h set). The audio in each set was otherwise identical outside of processing. The classification accuracies of eac h set are given in T able 2. This clearly sho ws that the MMSE STSA filter do es not improv e accuracy , and actually reduces it for rain detection. This is lik ely b ecause rain has stationary and non-stationary comp onen ts (i.e. raindrops distan t from the sensor make a constant background noise, whereas closer raindrops are clearly audible and distinguishable). As such, the MMSE STSA reduces some, but not all of the noise sources, making them more difficult to detect. F or silence detection, thresholds using t wo different measures were considered: p ow er sp ectral density and signal to noise ratio (SNR). These were applied to files with and without the MMSE STSA filter to ev aluate accuracy . Because only one measure is used, an ROC curve (Fig. 3) w as employ ed to visualise the accuracy of the thresholds as they w ere increased, in terms of the sensitivity and selectivity . The Area Under the Curv e (A UC) was taken for each threshold and recording set, shown in T able 3. The results of this sho w that, if using the Po w er Sp ectral Density measure, the MMSE STSA filter w ould b e necessary to obtain go od results. How ever, the SNR measure p erforms similarly well regardless of the use of the MMSE STSA filter. Because of the time cost of using the MMSE STSA filter, it is more efficient to execute silence detection based on SNR prior to executing the MMSE STSA filter. Effect of split length on noise reduction This section examines if detection approac hes are dep enden t on split lengths. T o do this, the accuracy of eac h detector (silence, rain, and cicada chorus) is tested on 30 8/28 Fig 3. R OC Curve for Classifying Silence 9/28 Fig 4. Results of cicada classification test. min utes of audio comp osed by randomly selected 1-minute ch unks spread ov er four days of original recordings. These ch unks were then split into 5, 10, 15, 20, and 30 second c hunks (these divide evenly into 60 seconds). These were listened to and man ually lab eled as rain, cicada, or silence, to a resolution of 5 seconds. Each detection approach w as then tested for each split length. Man ual lab elling w as p erformed on audio filtered b y the MMSE STSA algorithm, even though automatic metho ds work with raw audio. This giv es b etter accuracy for man ual lab elling, particularly for detecting silence, b ecause very quiet calls b ecome clearer. Accuracy is ev aluated for each split length to a precision of 5 seconds, despite the fact that these approac hes do not hav e this level of precision for longer split lengths. F or example, given a 10-second long ch unk, if there is silence in the first 5 seconds, but a sound in the follo wing 5 seconds, and that ch unk is lab elled as silence by the system, this is in terpreted as one true p ositiv e and one false p ositiv e result, even though only one file w as classified. In practice, the silence classifier lab els some rain as silence. This mak es intuitiv e sense, giv en it is using an estimated signal to noise ratio (SNR) threshold, which is a measure of p eak v olume to av erage v olume. If the a verage volume is very loud then the SNR will b e low, even if the p eak volume is also loud (compared to times when it is not raining). Despite technically b eing a false p ositiv e, this is not a significan t issue, b ecause rain is remov ed by the rain filter anyw a y . How ev er, this creates a complication, b ecause some rain samples contain audible rain drops, which results in files with a high signal to noise ratio. Consequently , b ecause the silence filter detects some, but not all rain samples as con taining silence, samples manually classified as containing rain were remo ved from the silence classification test. In all figures in this section, the n umber of true p ositiv es, false p ositiv es, and false negativ es are shown. T rue negatives are excluded from these figures as the n umber of true negativ es is muc h greater than the others in every case, whic h makes visual comparison more difficult. • Cicadas: The cicada detection results, depicted in Fig. 4 and T able 4, shows that cicada detection w orks well for all split lengths, detecting all cicada choruses in the sample, with a small n umber of false p ositiv es. The b est p erforming split length is 15 seconds, which contained no false positives, although this strong result could b e partially due to chance. • Rain: Similar to cicada detection, the amount of rain detected do es not v ary m uch dep ending on split length, as sho wn in Fig. 5 and T able 5. Somewhat surprisingly , rain detection is slightly more sensitiv e, and more accurate, for longer 10/28 T able 4. Cicada detection accuracy Split T rue F alse F alse T rue Length P os. P os. Neg. Neg. Accuracy 5 10.3% 2.0% 0.0% 87.6% 98.0% 10 10.3% 1.7% 0.0% 87.9% 98.3% 15 10.3% 1.7% 0.0% 89.7% 100.0% 20 10.3% 2.3% 0.0% 87.4% 97.7% 30 10.3% 1.7% 0.0% 87.9% 98.3% Fig 5. Amoun t of audio detected as rain in a sample as it v aries with split length. split lengths, at least up to 30 seconds, at which p oin t a steep drop-off o ccurs. This is lik ely b ecause rain tends to o ccur ov er a long duration, and patterns that can b e used to detect rain are clearer ov er longer time p eriods. In practice, the accuracy of rain detection is not as p oor as this ev aluation suggests. When manually lab elling the data, only rain considered in tense enough to dro wn out any bird signal was classified as rain, although the rain classifier classifies some ligh ter rain without significant bird sound as containing rain. While these are lab elled as false p ositives, many of these would b e (v alidly) remo ved by the silence detector anyw a y . • Silence: Figs 6 and 7, and T able 6, show the effectiveness of the silence detector at different signal to noise ratio thresholds. Unlike rain and cicada detection, split length has a significan t effect on the sensitivity of silence detection. This is b ecause silence is muc h more lik ely to o ccur o ver shorter durations. Ov erall, the silence detector p erforms somewhat p oorly , pro ducing ab out as many T able 5. Rain detection accuracy Split T rue F alse F alse T rue Length P os. P os. Neg. Neg. Accuracy 5 6.8% 5.4% 4.8& 83.0% 89.9% 10 6.9% 4.0% 4.3% 84.7% 91.7% 15 7.5% 4.6% 3.7% 84.2% 91.7% 20 8.3% 5.5% 2.9% 83.3% 91.7% 30 6.0% 4.3% 5.2% 84.5% 90.5% 11/28 Fig 6. Silence detection accuracy for the higher of the tw o thresholds tested Fig 7. Silence detection accuracy for the low er of the tw o thresholds tested . All split lengths ab o v e 15 seconds detect no silence. T able 6. Silence detection accuracy Split T rue F alse F alse T rue Length P os. P os. Neg. Neg. Accuracy SNR thr eshold = 0.25 5 9.1% 8.4% 11.0% 71.5% 80.6% 10 5.5% 4.9% 14.5% 78.0% 80.5% 15 3.9% 1.9% 16.2% 78.0% 81.9% 20 3.6% 1.3% 16.5% 78.6% 82.2% 30 0.0% 0.0% 20.7% 79.9% 79.9% SNR thr eshold = 0.2 5 7.2% 3.3% 12.9% 79.9% 83.8% 10 2.9% 1.0% 17.2% 78.9% 80.0% 15 0.0% 0.0% 20.1% 79.9% 79.9% 12/28 Fig 8. Early steps of the pro cessing pip eline. The “long length” and “short length” are determined in subsequen t tests. false p ositiv es as true p ositiv es on more aggressiv e settings, and failing to detect man y instances of silence on all settings, with worsening p erformance for longer split lengths and low er thresholds. This indicates a b etter approach is needed for remo ving silence ov erall, which will b e the sub ject of future work. F or the present in vestigation a less sensitive threshold is selected, as this is more accurate ov erall and retains more samples con taining bird sound, which is more imp ortant than an y efficiency gained from removing silence, as these can b e dropp ed at a later p oin t. As such, the 5-second sample with the low er threshold is considered the b est setting for our filter, which do es remov e ov er one third of silence, while classifying relativ ely few false p ositives. Though using 5 second splits means that the MMSE STSA filter takes longer to execute (see Fig. 1), the effect of removing silence will ha ve a greater effect on reducing execution time ov erall. It is notable that, while the silence detector do es pro duce many false p ositiv es, the false p ositiv es con tain quiet bird calls, not significantly louder than the bac kground noise. Even after applying the MMSE STSA filter, noise is still very audible in comparison to the bird call of in terest (which consequently are p o orer candidates for automated sp ecies identification anyw ay). In our testing, the silence filter nev er remov ed any audio with v ery clear bird calls. Final pip eline Based on the ab o ve findings and ev aluation results from the previous sections, the final pip eline for prepro cessing bioacoustics recording based on denoising filters is given in Algorithm ?? and summarised in Figs 8 and 9. Files are first split to break up pro cessing into smaller steps which can be parallelised. Compression pro cesses are then applied to reduce execution time of all other pro cesses. High-pass filtering is applied, remo ving any noise b elo w 1 kHz and impro ving detection mechanisms. This also works b etter with longer split lengths, so 13/28 Fig 9. Denoising steps of the pro cessing pip eline 14/28 applying earlier improv es execution times. Then rain and cicada detection are executed, with rain detection executing earlier b ecause it may eliminate audio from further pro cessing. Files are then split to 5 seconds, b efore silence detection is p erformed. Finally , the MMSE STSA filter is executed. Placing this at the end reduces execution time b ecause any files remo ved by other pro cesses do not need to undergo MMSE STSA filtering, whic h has the longest execution time of any individual pro cess. Imp ortan tly , an y file remov ed in earlier pro cesses do es not need to complete the pip eline, saving significant execution time. Hence, silence and rain detection steps significan tly improv e execution times, while resulting in higher quality output because useless ch unks are discarded. In particular, skipping the MMSE STSA step remov es the ma jority of pro cessing time of any given file. The next section tak es this pro cessing pip eline and distributes it ov er m ultiple mac hines to greatly further execution times. Scalable distribution of the prepro cessing pip eline This section describ es the prop osed approach for distributing work (i.e. the pro cessing pip eline) amongst m ultiple machines, and ev aluates this approach in terms of execution time, resource utilisation and load balancing. Results from these tests are used to impro ve the efficiency of the ov erall pip eline’s execution for pro cessing large recordings. Master-sla v e system Our approac h utilises a master-slav e architecture with file parallelisation to progress through the pro cessing pip eline. This architecture makes it easy to allo cate work to sla ves without the master needing to do muc h w ork itself. W e constructed a b esp ok e master-sla ve system, as opp osed to using an off-the-shelf approach, to a void unnecessary o verhead and to gain low level control ov er data flo w. Files are pro cessed through the pip eline on one slav e eac h. This is chosen, as opp osed to distributing work on a p er-process basis, b ecause workload can b e ev enly distributed among slav es by splitting files in to small ch unks. The master first splits, downsamples, and high-pass filters each file. The time tak en to p erform these steps is small compared to the ov erall pro cessing time of the pip eline, so executing these steps in serial do es not increase pro cessing time. High-pass filtering is p erformed on the master pro cess b ecause it utilises long split lengths. By doing this on the master pro cess, files can b e split into shorter ch unks for distribution. It then adds files it has pro cessed into a queue. The master and slav es then communicate with eac h other ab out when they are ready to send and receive files. The master tracks which files ha ve b een sen t to each slav e, and whic h hav e completed pro cessing, such that it can re-send files to differen t slav es if a slav e disconnects or crashes. Up on completing pro cessing, slav es will send results back to the master. Results come in t wo forms: pro cessed files and deleted files. If the slav e sends a pro cessed file, the name of the original file is first sent to the master, such that it can recognise that the file has b een pro cessed and the original file can b e replaced, and then the pro cessed files deriv ed from the original file are sent. There are usually more pro cessed files than original files, as files are split in to 5 second ch unks for silence detection. The functionalit y enabling slav es to send multiple files of differen t lengths for each file they receiv ed also allows for more flexibility as to how slav es pro cess files in future w ork. In the case of samples identified for deletion, the slav e simply sends the name of the file to delete and the master deletes its cop y . 15/28 Sla v e parallelisation P arallelisation is p erformed b oth b etw een multiple machines and b etw een m ulticore pro cessors. T o parallelise w ork within a single machine, a central thread handles comm unication b et ween the master and the slav e, acting similarly to a secondary master (with threads b eing slav es). Files given to the slav e from the master are added to a queue of files p ending pro cessing, which is managed by the central thread. The queue is set to a fixed size, such that if the queue falls b elo w this size, the slav e will request more files from the master. Pro cessing threads then remov e files from the queue and pro cess them in the the denoising pip eline. Upon completing pro cessing, results are sen t to one of tw o queues managed by the cen tral thread: one for pro cessed files and another for deleted files. After a set time interv al, all results are sent to the master and queues are cleared. Using a dedicated thread for communication allows pro cessing threads to con tinually pro cess audio without individually communicating with the master. This results in few er requests to the master, reducing communication ov erhead. Ev aluation The approac h for distributing the prepro cessing pip eline describ ed in the previous section is tested using sev eral measures across several configurations to improv e the system’s scalabilit y and to determine its time efficiency for prepro cessing large recordings. Metho dology The testing metho dology for this system is as follows: • Run a basic pro cess in isolation that sends files from one machine to the other. Measure sending times with files of v arying lengths (5–30 seconds), with 30 min utes (302 MB) of audio; rep eat 5 times to observ e v ariabilit y • T est the system b y v arying the following parameters: – Split file length (5, 10, 15, 20, and 30 seconds, or 215, 430, 646, 861, and 1260 kB) – Split file length prior to high-pass filtering (1–3 min utes, or 2.52–7.56 MB); hereafter referred to as the L ong split length ) – Queue size of the cen tral slav e thread – F requency with whic h slav es send results • Ev aluation measures: – Av erage pro cessing time – Av erage CPU and RAM usage for all machines – Changes in execution time as sla ves are added – Load balancing Comm unication times A short test w as conducted where 30 minutes (302 MB) of audio, already split into short c hunks of a fixed length, was sent back and forth b etw een tw o machines, one c hunk after another, with the aim of determining if file transmission to ok a significant amoun t of time, and if the sending time v aries with split length. The total time tak en 16/28 Fig 10. File sending times Time sp ent to send 30 minutes (302 MB) of audio back and forw ard b et ween tw o virtual machines per split length to send all the files w as recorded. The test was rep eated five times for different file lengths. The results of this test are shown in Fig. 10. This test sho ws that sending 5-second long ch unks results in a slow er sending time, whereas an ything higher consumes about the same amount of time. Overall, the sending time is small relativ e to other computation, taking less than 4 seconds for all ch unk sizes for 30 min utes (302 MB) of audio. This is equal to less than 16 seconds for tw o hours (1.2GB) of audio. This is a very small amoun t of time compared to the execution times of other pro cesses in the pip eline, such as the MMSE STSA filter (see Fig. 1). Ho wev er, this b ecomes more significant as the num ber of pro cessors increases b ecause, while o verall pro cessing times are reduced, the communication time will remain appro ximately constant. Additionally , this is an idealised scenario in which files are sent and received in a predictable fashion. The distributed system used in pro cessing the files is m uch more complicated, with sla ves sending and receiving files as needed, creating a less predictable scenario. In a situation where multiple slav es are sending results or receiving files sim ultaneously , the sending time will inevitably increase. Ov erall, this test sho ws that comm unication b et w een the master and the slav es has a small, but not insignificant effect on ov erall pro cessing time, although changing the split length could only giv e a 1 second saving p er 30 minutes of audio at most, under ideal conditions. It is ov erall likely insignificant compared to other factors. Iden tifying b est settings for efficiency A large n umber of configurations were examined to find which set pro duces the fastest execution. In particular, the amoun t of pro cessing conducted by the master thread prior to sending to the slav es, the split length, the split length b efore applying the high-pass filter, referred to here as the long split length , the maximum queue size of slav es’ cen tral threads, and the in terv al b etw een slav es sending results are considered. These tests are carried out using 4 virtual mac hines with 4 cores each and 16 GB of RAM. These mac hines are hosted in the Nectar Cloud, which is a cloud platform used b y Australian and New Zealand univ ersities. Initial ad ho c testing w as conducted using a large num b er of differen t parameter sets to reduce the n umber of configurations to undergo more thorough testing to a more manageable lev el. In these tests, each set was only tested once. F rom this ad ho c testing, parameter ranges w ere set to ev aluate 90 configurations in more depth. Eac h test was conducted five times eac h with the same tw o hours of audio used in earlier tests b eing pro cessed each time. Of these, 10 configurations with the low est a verage 17/28 T able 7. T en b est configurations identified in distribution testing. Split length (s) Long split length (s) Max queue size Time p er send (s) Av erage execution time (s) Std. dev. (s) 10 120 7 2 72.55 1.14 20 60 5 2 72.74 0.90 10 60 5 2 72.75 0.56 5 120 7 3 72.76 1.13 30 60 3 2 72.95 0.42 10 120 5 3 72.95 0.45 15 60 5 3 73.14 0.70 5 60 7 4 73.14 1.41 10 60 7 2 73.15 1.00 20 60 3 2 73.15 1.58 execution time are sho wn in T able 7. A k ey insight from these results is that there is little difference in p erformance b et w een the b est configurations, with the top 10 b eing separated by 0.6 seconds o ver 2 hours (1.2 GB) of audio (0.8% of the fastest time) and well within the standard deviation of all the top 10. These equiv alen tly pro cess audio at a rate of 16 . 4 – 16 . 5 ± 0 . 4 MB s − 1 (error given by the maximum standard deviation). The only p oor com bination found is to ha ve a split length of 5 and maximum slav e queue size of 3, and an y combination of other settings. These configurations are ab out 25 seconds slo wer on a verage than any other configurations. The top 84 configurations (i.e. all configurations except the kno wn bad ones) are separated by 8.03 seconds (this b ecomes 2.81 seconds for the top 50), whic h is statistically significant, so there is a small time efficiency adv an tage from thoroughly testing configurations as opp osed to selecting one at random. This indicates that we can select configurations for accuracy , without significan t loss of efficiency . Because splitting into 15 second ch unks w as the most accurate approach for remo ving rain and cicada sounds, this is taken to b e the split length in further testing. This gets split into 5 second c hunks for silence detection at a later p oint of the pip eline. Scalabilit y testing and analysis A further test was conducted to determine how s calable the system is. The system was tested using tw o hours of audio known to con tain bird sound, rain, cicada choruses, and silence with v arying num bers of machines. The test w as run four times for each case, and the a verage execution time recorded. The 1-core execution test used a pro cess sp ecifically written for sequential execution, while the others used the distributed system. The CPU count includes the master and slav e no des. Because the master no de do es not require a large amount of resources, a slav e no de is also executed on the same mac hine as the master. Each instance tested contained 4 cores and 16 GB RAM, though most of this RAM is not used b y the system. The 2-core case was tested using a single 2-core instance running a master and a slav e pro cess. Fig. 11 sho ws the av erage execution time for the num b er machines used. Fig. 12 presen ts the improv emen t in the execution time ov er 1 core by measuring how many times faster execution is compared to the sequential (1-core) case. These figures show that the system is indeed scaling almost linearly , with significant sp eed b o osts from using extra pro cessors. The impro vemen t rate do es b egin to slightly div erge from p erfect linearit y when high num bers of cores are used, but even a 32-core distributed system still sho ws significant p erformance increases ov er a 24-core system. 18/28 Fig 11. Average Execution time of the system given a num ber of cores. The master and eac h slav e hav e 4 cores, so 16 cores uses 4 virtual machines. Standard deviations are to o small (4.9 seconds at most) for error bars to b e visible Fig 12. Rate of improv emen t in execution time p er n um b er of cores. This is giv en by Execution Time of 1 core/Execution time of x cores. 19/28 Fig 13. Execution time comparison b etw een using more smaller machines and using fewer larger mac hines. The master on its own is also shown for comparison There is also a sligh t statistical anomaly where the 2-core system do es not improv e as m uch ov er the sequential 1-core system as migh t b e expected. This is lik ely b ecause of the extra o verhead inv olv ed in using the distributed system ov er the sequential system. Ho wev er, this extra ov erhead do es not seem to preven t the system from b eing linearly scalable. A further test w as conducted using smaller machines which when combined give a similar p o w er level to large machines. The configurations compared are as follows: 1. One 4-core, 16 GB RAM master, one 4-core, 16 GB RAM slav e 2. One 4-core, 16 GB RAM master, t wo 2-core, 6 GB RAM slav es 3. One 4-core, 16 GB RAM master, four 1-core, 4 GB RAM slav es The master also runs a slav e instance in all cases, to mak e a fairer comparison with the previous tests. This also has the effect of testing system p erformance where different sizes of virtual machines are op erating at the same time, as the master virtual mac hine runs a sla ve with 4 cores in all cases, alb eit while comp eting for resources with the master thread. The results shown in Fig. 13 indicate that the system works as well with the master and t wo 2-core slav es compared to the master and one 4-core sla ve, and slightly worse when four 1-core sla ves are used. The slow er execution time when using 1-core machines could b e due to extra ov erhead caused by the use of the centralised slav e thread. This use of the c en tral slav e thread (whic h can b e further broken do wn in to six small threads) results in excessive o verhead with smaller machines, while with larger mac hines reducing the amoun t of communication to the master and waiting times in pro cessing files b ecome adv an tageous. It could also b e due to an inappropriate queue size b eing used for smaller machines, leading to imbalances in workload during later stages of execution. The system is dev elop ed for larger machines, so it makes intuitiv e sense that they would compute faster. Overall, the system is capable of p erforming efficien tly with virtual mac hines of any size, although slightly less efficiently when 1-core machines are used. It also sho ws that the system can maintain efficiency when machines of different sizes are pro cessing at once, b ecause the master is running a slav e thread with 4 av ailable cores in all tests. Load balancing testing and analysis An analysis of load balancing w as also conducted at the same time as the scalability tests. This measured how many files are going to each of the slav es. Because all the 20/28 Fig 14. Load distribution in pro cessing for t w o slav es . The n umber of files each sla ve pro cesses is measured o ver four tests. Files are all of the same size. Fig 15. Load distribution in pro cessing for three slav es . The n umber of files eac h slav e pro cesses is measured ov er four tests. Files are all of the same size. sla ve machines hav e iden tical sp ecifications, the file distribution should be even in an ideal case, outside of one sla ve which will hav e a lo wer num ber of files b ecause it is sharing resources with the master pro cess. Figs 14 – 16 sho w that the workload is well balanced, with each slav e pro cessing almost the same n umber of files in each test. This indicates that the system is distributing w ork evenly . Figs 17 and 18 demonstrate that the system is capable of balancing workload where the mac hines b eing used are of unequal p o w er. This data are taken from earlier tests where the master, with 4 cores, is running a slav e pro cess simultaneously and less p o w erful machines are also running slav e processes. Here, the master correctly allo cates more files to itself compared to what it allo cates to each of the sla ves, prop ortional to the differences in computing p o w er. 21/28 Fig 16. Load distribution in pro cessing for four slav es . The n umber of files eac h slav e pro cesses is measured ov er four tests. Files are all of the same size. Fig 17. Load av erages b et w een t wo 2 core sla ves and one 4 core sla v e . Load measured by the amount of files pro cessed b y each slav e. The 4 core slav e is also acting as a master 22/28 Fig 18. Load a verages b etw een four 1 core slav es and one 4 core sla v e . Load measured by the amount of files pro cessed b y each slav e. The 4 core slav e is also acting as a master Fig 19. CPU Usage o v er four 4-core machines pro cessing 2 hours (1.2 GB) of audio Resource usage test and analysi s A test w as conducted to see how efficiently the system is using resources. This was done b y pro cessing t wo hours of audio with four slav es, and sampling the CPU and RAM usage appro ximately every 8 seconds. This sampling was done using a shell script running in parallel to Ja v a execution, although some data regarding timing is sent to the debugging logs to help sync hronise the timings b et ween slav es. While accuracy of the times is imp erfect, it should b e accurate to within 3 seconds. Fig. 19 sho ws that CPU usage remains at ab out 90% for most of the pro cessing of the tw o hours of audio. There do es appear to b e a slight drop b elow this n umber at the start of pro cessing, presumably due to the master still p erforming early pro cessing and not ha ving files to send. Overall, assuming the ov erhead is not significan t to CPU usage, it would b e difficult to significantly impro ve up on the current pip eline without changing the pip eline itself. Note that the master is also running as a slav e, and the master CPU usage relates to the usage b y the slav e and master pro cesses running on that machine. Fig. 20 sho ws that the three slav es utilise around 11% of the mac hines’ 16 GB of a v ailable RAM, remaining constant after the first 10 seconds. The master uses more RAM, presumably due to holding information ab out slav e so ck ets and data streams, as 23/28 Fig 20. RAM Usage ov er four 4 core Machines pro cessing 2 hours (1.2 GB) of audio w ell as information ab out files, relating to whether they hav e b een sen t and which slav e is pro cessing them, in addition to running a slav e pro cess. RAM is underutilised o verall. The system relies heavily on file writes and file reads using hard driv es, which results in low RAM utilisation. Keeping more data in RAM could result in faster memory access and in turn, faster pro cessing. Ho wev er, as CPU usage is already fairly high, hard disk reading and writing do es not seem to b e a significan t b ottlenec k in pro cessing these audio files. Nonetheless, this is a p oten tial area for p erformance improv emen ts in future work. Comparison with similar approac hes Dugan et al. [16] fo cus their cloud infrastructure on completing tw o tasks: auto detection and noise analysis. In each of these, a pro cess manager divides w ork into M no des which each indep endently work on their own tasks. Their sensor data is m ultiplexed in the data files (i.e. data from multiple sensors are shared in the one place), so data are divided by time, rather than by sensor. Recordings for the time perio d to b e analysed are split into blo c ks equal to the n umber of pro cessing no des and each of these blo c ks are assigned a no de. Nodes pro cess indep enden tly , then return their output. Using this they found that, while sp eed improv ements v aried betw een the pro cess b eing tested, the most impro ved pro cess (classifier-based detection) was 6.57 × faster for an 8-no de server o ver a serial pro cess, although another pro cess (template-based detection) only improv ed by 3.33 × o ver a serial pro cess using an 8-no de server running in parallel. A dra wback to their approach is the use of a MA TLAB pack age to handle distribution, whic h, while easier to develop, lacks low-lev el control ov er the data, and adds o verhead. They hav e expanded this work with n umerous publications, such as in a 2015 work [29] where they built an Acoustic Data-Mining Accelerator (AD A), which parallelises mapping and gathering op erators in an otherwise sequential pro cess. T ruskinger et al. [15] aim to extract acoustic indices to visualise their bioacoustics data. T o do this, they distribute work by splitting audio into smaller ch unks, similarly to Dugan et al. [16]. The research claims it is not feasible to pro cess audio files an y longer than t wo hours due to the high amounts of RAM required, so they use a sp ecialised program called mp3splt to divide the audio into 1-minute long c hunks. A master task creates a list of work items for work tasks to do. Eac h work task is given a differen t ch unk of audio to analyse. The results of these tasks are aggregated b y the master task. Through this parallelisation, the execution time of an analysis task in volving the computation of sp ectral indices is improv ed by a mo dest 24.00 × for a 5 24/28 instance, 32 thread (with 32 cores p er instance) distributed cluster ov er a single threaded pro cess. While certainly an impro vemen t, the parallelisation app ears inefficien t as the improv emen t rate is muc h lo wer than the increase in resources. While discussion of the pip eline is not detailed in the pap er, a p ossible reason for this lo w impro vemen t rate is that there is a large serial comp onent to the pro cessing pip eline used and so the parallel pro cessors are not fully utilised. Th udumu et al. [17] developed a scalable framework to pro cess large amounts of bioacoustics data using Apac he Spark Streaming [27] and the Hado op Distributed File System (HDFS) [26] whic h utilised a master-slav e mo del. The system parallelises the c hunking of audio data and the generation of sp ectrograms. Parallelisation is handled b y Hado op and Spark. F or a task inv olving splitting 1 GB of audio into 10 second c hunks and generating sp ectrograms, the system show ed a 4.50 × improv emen t in execution time in a test with a 1 core master no de and a 4 core slav e no de, but a w eaker 7.50 × impro vemen t in execution time with a 1 core master and three 4 core sla ves compared to a serial pro cess, indicating the system is not as scalable as it could b e. Using an equiv alen t num b er of pro cessing resources, our system achiev es a 9.98 × impro vemen t, with a muc h more computationally intensiv e pro cessing pip eline. Conclusions and future directions In this w ork, we derived an approach for prepro cessing high volume bird acoustic data quic kly and efficiently . W e achiev ed this by deriving a pro cessing pip eline based on examining the pro cessing time and accuracy of individual prepro cessing tasks, and ho w these c hanged dep ending on ho w the audio is split into smaller ch unks. In testing individual comp onen ts of the system, w e found that the MMSE STSA filter consumes a v ery large amount of the execution time, meaning this should b e executed as late as p ossible. W e also found that high-pass and cicada filtering using SoX consumes more time when more, shorter files are b eing pro cessed compared to few er, longer files, which gav e rise to an efficiency impro vemen t. F rom this individual comp onen t test, a pro cessing pip eline is derived, and then applied in a distributed arc hitecture, capable of pro cessing on man y machines at once. The resulting system is found to scale almost linearly , even when using 32 cores, which impro ved execution time by 21.76 times ov er serial pro cessing. This compares fa vourably to existing research. It is also found that the system balances load evenly b et w een machines, and can prop ortionally distribute more files to more p o w erful mac hines. Cores on all machines are found to consisten tly utilise 90% of their av ailable p o w er, though RAM is underutilised. While this work presents a strong basis for creating a fast, efficient, and scalable bird acoustic prepro cessing pip eline, there is great p oten tial for expansion in the future. Silence detection currently p erforms po orly and is limited in that it can only choose to k eep or drop 5-second long ch unks. This is not a large problem for the presen t in vestigation, as we are more concerned with the efficient pro cessing of data. How ev er, if w e wan ted to improv e the accuracy and utility of our pip eline, w e could replace our relativ ely simplistic approach with one of many existing segmentation pro cesses, which divide animal calls in to syllables, often b eing insensitiv e to noise [30, 31]. This pro cessing pip eline is simple and generic enough such that additional noise reduction tec hniques could b e added to the pip eline without difficulty . Adding additional pro cesses to the pip eline would likely mean nothing more than inserting a new pro cess in b et ween tw o existing ones. Although this work fo cuses on the remo v al of noise from t wo sources, cicada choruses and rain, there are many other noise sources that could b e targeted. 25/28 References 1. P . M. Stepanian, K. G. Horton, D. C. Hille, C. E. W ainwrigh t, P . B. Chilson, and J. F. Kelly , “Extending bioacoustic monitoring of birds aloft through flight call lo calization with a three-dimensional microphone array ,” Ec olo gy & Evolution (20457758) , v ol. 6, no. 19, pp. 7039–7046, 2016. 2. J. Salamon, J. P . Bello, A. F arnsworth, M. Robbins, S. Keen, H. Klinck, and S. Kelling, “T o wards the automatic classification of avian flight calls for bioacoustic monitoring,” PL oS ONE , vol. 11, no. 11, pp. 1–26, 2016. 3. R. Bardeli, D. W olff, F. Kurth, M. Ko c h, K.-H. T auchert, and K.-H. F rommolt, “Detecting bird sounds in a complex acoustic env ironment and application to bioacoustic monitoring,” Pattern R e c o gnition L etters , v ol. 31, no. 12, pp. 1524–1534, 2010. 4. T. M. Aide, C. Corrada-Bra vo, M. Camp os-Cerqueira, C. Milan, G. V ega, and R. Alv arez, “Real-time bioacoustics monitoring and automated sp ecies iden tification,” Pe erJ , v ol. 1, p. e103, 2013. 5. J. Xie, M. T o wsey , A. T ruskinger, P . Eichinski, J. Zhang, and P . Ro e, “Acoustic classification of australian anurans using syllable features,” in Intel ligent Sensors, Sensor Networks and Information Pr o c essing (ISSNIP), 2015 IEEE T enth International Confer enc e on , pp. 1–6, IEEE, 2015. 6. A. Digb y , M. T owsey , B. D. Bell, and P . D. T eal, “A practical comparison of man ual and autonomous metho ds for acoustic monitoring,” Metho ds in Ec olo gy and Evolution , vol. 4, no. 7, pp. 675–683, 2013. 7. J. B. Alonso, J. Cabrera, R. Sh yamnani, C. M. T ravieso, F. Bola ˜ nos, A. Garc ´ ıa, A. Villegas, and M. W ain wright, “Automatic anuran identification using noise remo v al and audio activit y detection,” Exp ert Systems with Applic ations , vol. 72, pp. 83–92, 2017. 8. C. Bedo ya, C. Isaza, J. M. Daza, and J. D. L´ op ez, “Automatic identification of rainfall in acoustic recordings,” Ec olo gic al Indic ators , vol. 75, pp. 95–100, 2017. 9. Y. Ephraim and D. Malah, “Sp eec h enhancement using a minimum-mean square error short-time sp ectral amplitude estimator,” IEEE T r ansactions on A c oustics, Sp e e ch, and Signal Pr o c essing , vol. 32, no. 6, pp. 1109–1121, 1984. 10. M. F erroudj, Dete ction of R ain in A c oustic R e c or dings of the Envir onment Using Machine L e arning T e chniques . Thesis, Science and Engineering F aculty , 2015. 11. M. T o wsey , J. Wimmer, I. Williamson, and P . Ro e, “The use of acoustic indices to determine a vian sp ecies ric hness in audio-recordings of the environmen t,” Ec olo gic al Informatics , vol. 21, pp. 110–119, 2014. 12. N. Priy adarshani, S. Marsland, I. Castro, and A. Punchihew a, “Birdsong denoising using w av elets,” PloS one , vol. 11, no. 1, p. e0146790, 2016. 13. C. Bedo ya, C. Isaza, J. M. Daza, and J. D. L´ op ez, “Automatic recognition of an uran sp ecies based on syllable iden tification,” Ec olo gic al Informatics , vol. 24, pp. 200–209, 2014. 14. M. T o wsey , L. Zhang, M. Cottman-Fields, J. Wimmer, J. Zhang, and P . Ro e, “Visualization of long-duration acoustic recordings of the environmen t,” Pr o c e dia Computer Scienc e , vol. 29, pp. 703–712, 2014. 26/28 15. A. T ruskinger, M. Cottman-Fields, P . Eichinski, M. T owsey , and P . Ro e, “Practical analysis of big acoustic sensor data for environmen tal monitoring,” in Big Data and Cloud Computing (BdCloud), 2014 IEEE F ourth International Confer enc e on , pp. 91–98, IEEE, 2014. 16. P . J. Dugan, D. W. Ponirakis, J. A. Zollweg, M. S. Pitzric k, J. L. Morano, A. M. W arde, A. N. Rice, C. W. Clark, and S. M. V an Parijs, “Sedna-bioacoustic analysis to olbox,” in OCEANS 2011 , pp. 1–10, IEEE, 2011. 17. S. Th udumu, S. Garg, and J. Montgomery , “B2p2: A scalable big bioacoustic pro cessing platform,” in High Performanc e Computing and Communic ations; IEEE 14th International Confer enc e on Smart City; IEEE 2nd International Confer enc e on Data Scienc e and Systems (HPCC/SmartCity/DSS), 2016 IEEE 18th International Confer enc e on , pp. 1211–1217, IEEE, 2016. 18. B. C. Pijano wski, L. J. Villanuev a-Rivera, S. L. Dumy ahn, A. F arina, B. L. Krause, B. M. Nap oletano, S. H. Gage, and N. Pieretti, “Soundscape ecology: the science of sound in the landscape,” BioScienc e , vol. 61, no. 3, pp. 203–216, 2011. 19. S. Boll, “Suppression of acoustic noise in sp eec h using sp ectral subtraction,” IEEE T r ansactions on ac oustics, sp e e ch, and signal pr o c essing , vol. 27, no. 2, pp. 113–120, 1979. 20. Y. Ren, M. T. Johnson, and J. T ao, “Perceptually motiv ated wa v elet pack et transform for bioacoustic signal enhancemen t,” The Journal of the A c oustic al So ciety of Americ a , vol. 124, no. 1, pp. 316–327, 2008. 21. Apac he Softw are F oundation, “Apache commons math,” 2016. 22. Demmel, Applie d numeric al line ar algebr a . SIAM, 1997. 23. J. R. Quinlan, C4.5: pr o gr ams for machine le arning . Morgan Kaufmann Publishers Inc., 1993. 24. K. Krauter, R. Buyy a, and M. Maheswaran, “A taxonomy and survey of grid resource management systems for distributed computing,” Softwar e: Pr actic e and Exp erienc e , vol. 32, no. 2, pp. 135–164, 2002. 25. S. Androutsellis-Theotokis and D. Spinellis, “A surv ey of p eer-to-p eer conten t distribution tec hnologies,” ACM c omputing surveys (CSUR) , vol. 36, no. 4, pp. 335–371, 2004. 26. K. Sh v ac hk o, H. Kuang, S. Radia, and R. Chansler, “The hado op distributed file system,” in Pr o c e e dings of the 2010 IEEE 26th Symp osium on Mass Stor age Systems and T e chnolo gies (MSST) , MSST ’10, (W ashington, DC, USA), pp. 1–10, IEEE Computer So ciet y , 2010. 27. Apac he Softw are F oundation, “Spark streaming,” n.d. 28. C. Bagw ell, U. Klauer, and robs, “Sox - sound exchange,” n.d. 29. P . J. Dugan, H. Klinc k, J. A. Zollweg, C. W. Clark, et al. , “Data mining sound arc hives: A new scalable algorithm for parallel-distributing pro cessing,” in Data Mining Workshop (ICDMW), 2015 IEEE International Confer enc e on , pp. 768–772, IEEE, 2015. 30. D. A. Ramli and H. Jaafar, “P eak finding algorithm to improv e syllable segmen tation for noisy bioacoustic sound signal,” Pr o c e dia Computer Scienc e , v ol. 96, pp. 100–109, 2016. 27/28 31. X. Zhang and Y. Li, “Adaptiv e energy detection for bird sound detection in complex en vironments,” Neur o c omputing , vol. 155, pp. 108–116, 2015. 28/28
Original Paper
Loading high-quality paper...
Comments & Academic Discussion
Loading comments...
Leave a Comment