Novel digital tissue phenotypic signatures of distant metastasis in colorectal cancer
Distant metastasis is the major cause of death in colorectal cancer (CRC). Patients at high risk of developing distant metastasis could benefit from appropriate adjuvant and follow-up treatments if stratified accurately at an early stage of the disea…
Authors: Korsuk Sirinukunwattana, David Snead, David Epstein
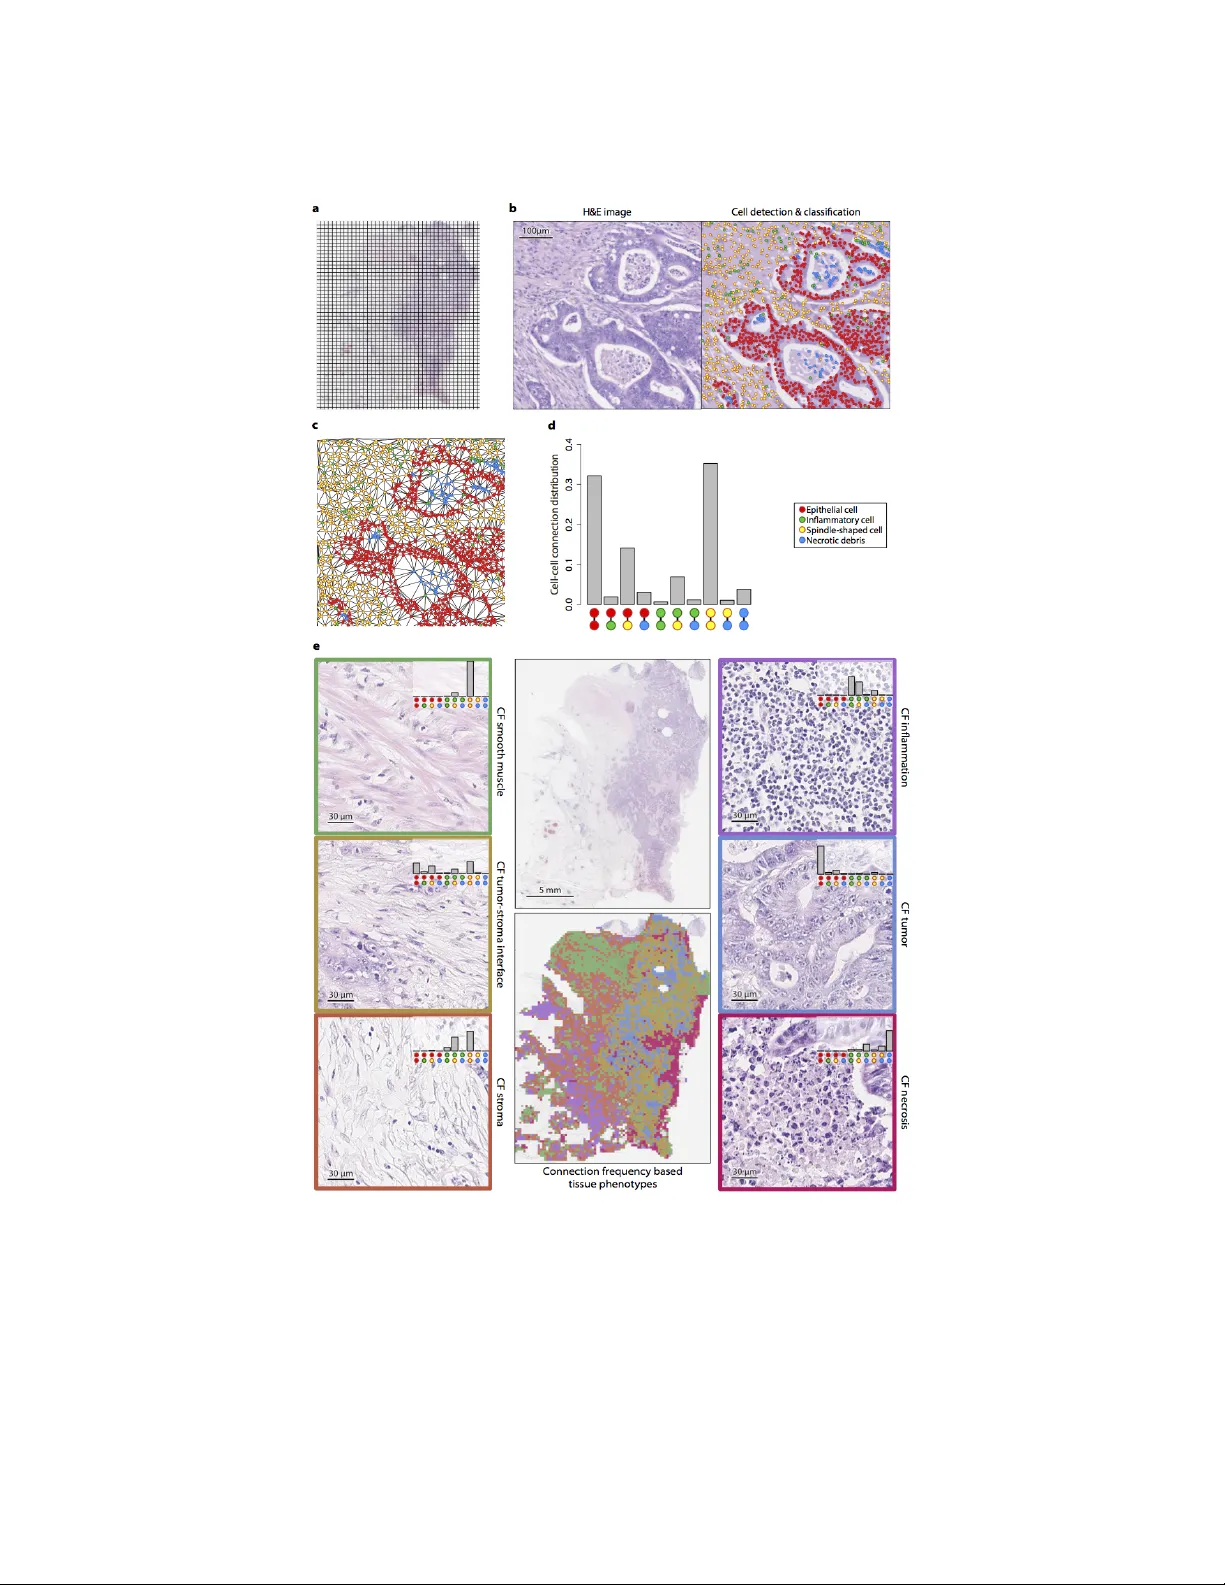
No vel digital tissue phenotypic signatures of distant metastasis in colorectal cancer K orsuk Sirin ukunwattana 1,* , David Snead 2 , David Epstein 3 , Zia Aftab 4 , Imaad Mujeeb 4 , Y ee W ah Tsang 2 , Ian Cree 5 , and Nasir Rajpoot 6 1 Institute of Biomedical Engineering, University of Oxf ord, UK 2 Depar tment of P athology , Univ ersity Hospitals Cov entr y and W arwickshire , Cov entr y , UK 3 Mathematics Institute, Univ ersity of W arwick, Co ventry , UK 4 Hamad Medical Cor poration, Doha, Qatar 5 International Association for Cancer Research, F rance 6 Depar tment of Computer Science, Univ ersity of W arwick, Co ventry , UK * T o whom correspondence should be addressed. Email: sir inukun.k orsuk@gmail.com, n.m.rajpoot@warwic k.ac.uk ABSTRA CT Distant metastasis is the major cause of death in colorectal cancer (CRC). P atients at high risk of de veloping distant metastasis could benefit from appropriate adjuv ant and f ollow-up treatments if stratified accur ately at an early stage of the disease. Studies hav e increasingly recognized the role of div erse cellular components within the tumor microen vironment in the dev elopment and progression of CRC tumors. In this paper , we show that a ne w method of automated analysis of digitized images from colorectal cancer tissue slides can provide impor tant estimates of distant metastasis-free sur vival (DMFS, the time before metastasis is first observed) on the basis of details of the microen vironment. Specifically , we determine what cell types are f ound in the vicinity of other cell types , and in what numbers, rather than concentrating e xclusiv ely on the cancerous cells. W e then extr act nov el tissue phenotypic signatures using statistical measurements about tissue composition. Such signatures can under pin clinical decisions about the advisability of v arious types of adjuvant therap y . Introduction Cell function and behavior cannot be fully understood without the context of their microen vironment. Communication between cells and their surroundings allows the functional or ganization of cells into tissues and or gans. It also plays a vital role in maintaining tissue homeostasis by generating signals that suppress and re vert malignant phenotypes 1 . Experiments in animal and cell culture models have demonstrated that certain conditions of the microen vironment can cause potent cancerous cells to re vert to an almost normal phenotype 2 , 3 . Although the normal tissue microen vironment is kno wn to be resilient to tumorigenesis, false signals in the microen vironment can disrupt tissue homeostasis and subsequently initiate tumors. The microen vironment in which tumor exists is both complex and heterogeneous, inhabited by a multitude of cellular and non-cellular components including tumor cells, e xtracellular matrix, tumor stroma, blood vessels, inflammatory cells, signaling molecules 4 – 6 . Studies ov er the last decade have increasingly recognized the role of these different components in the dev elopment and progression of tumors 5 . This paper adds to this evidence, and sho ws how its quantification may be automated. Metastasis is the major cause of morbidity and death in colorectal cancer (CRC). The 5-year surviv al rate in CRC patients with distant metastasis is approximately 10%, considerably smaller than 70% with regional metastasis and 90% without metastasis 7 . Patients at high risk of dev eloping distant metastasis could benefit from appropriate adjuvant and follow-up treatments if stratified accurately . The literature reports sev eral histopathological features carrying prognostic v alue for CRC progression. Each of the features reflects competing cellular stimuli that influence tumor progression or suppression within the microen vironment. T ype, density , and relative locations of different tissue components in the tumor microen vironment are crucial in determining progression and patient survi val in CRC. F or instance, the number of cytotoxic and memory T cells in the tumor center and the in vasi ve mar gin have been link ed to an improved prognosis of CRC 8 . Similarly , numerous studies hav e reported cancer-associated fibroblasts (CAFs) and desmoplasia to be important histopathological features associated with an unfav orable prognosis for CRC and an increased mortality rate 9 – 13 . Analogous to a wound that ne ver heals 14 , 15 , tumors stimulate many associated responses, wherein normal fibroblasts hav e been reported to acquire a cancer-associated phenotype (5,16). Furthermore, the e xtent of necrosis in CRC has been reported to correlate strongly with cancer progression and patient survi val 13 , 16 , 17 . The link between necrosis and tumor progression is possibly due to the hypoxic nature of tumors, which driv es tumor infiltrating inflammatory cells, namely phagoc ytic macrophages and granuloc ytes, to secrete pro-inflammatory cytokines which in turn promote cell proliferation 4 . In this study , we in vestigate the significance of tissue phenotypic and morphometric features, exploring in particular cellular heterogeneity in tumor microen vironments, in determining metastatic potential in CRC patients diagnosed with advanced primary tumors. Based on the AJUCC/UICC-TNM staging system 18 , this group of patients have a primary tumor that has grown through the outer lining of colon wall (T3/T4), ha ve no lymph nodes that are af fected by cancer cells (N0), and may or may not hav e distant metastasis at the time of diagnosis (M0/M1). Detailed quantitativ e analysis was performed on whole slide images (WSIs) of CRC histology slides, stained with routine Hematoxylin & Eosin (H&E) dyes in a fully quantitati ve manner , using bespoke image analysis methods to pro vide an objectiv e and reproducible assessment. Quantitati ve analysis of v arious types of cell population rev eals novel tissue phenotypic features, deri ved from both cell-cell connection frequencies and tissue appearance, with significant association with metastasis incidence and distant metastasis-free surviv al (DMFS) in the advanced primary CRC tumors. Results Quantifying tissue phenotypic signatures of CRC tumors In this study , WSIs of Hematoxylin and Eosin (H&E)-stained histological sections from 108 patients with advanced node negati ve primary CRC tumors (T3/T4, N0, M0/M1) were acquired from two independent cohorts from tw o different institutes: Univ ersity Hospitals Cov entry and W arwickshire (UHCW , 78 patients) and Hamad General Hospital (HGH, 30 patients). Summary details of the cohorts and clinical information are giv en in T able 1 . CRC, like other solid tumors, is a disease of substantial heterogeneity 19 , 20 . Different parts of the same tumor can exhibit dif ferent features including cellular morphology , gene e xpression, metabolism, motility , angiogenic, proliferati ve, immunogenic, and metastatic potential 21 . The tumor microenvironment is composed of div erse cell types; each plays a different role in tumor de velopment and progression — some support and promote tumor progression while others play host protecti ve roles 5 . The biological functions of cells are not only determined by their type but are also greatly influenced by their surrounding context. It follows that tissue morphometric signatures measuring tumor heterogeneity could be computed from the analysis of distributions and relati ve locations of cellular populations in the tumor microen vironment. Here, we outline the quantification of digital tissue phenotypic signatures (see Methods for details). W e divided each tumor histology image (i.e., each WSI) into small square regions or sub-images (Fig. 1 a) and analyzed the small sub-images to obtain local characteristics that were then summarized to characterize the entire tumor section. W e first applied our artificial intelligence (AI) based algorithm 22 , which was recently sho wn to be the state-of-the-art in detecting and distinguishing between four types of cells based on their morphology and conte xt, to each sub-image. The four types of cells were: malignant epithelial cells, spindle-shaped cells (normal fibroblasts, cancer-associated fibroblasts and smooth muscle cells), inflammatory cells (eosinophils, lymphocytes and neutrophils), and necrotic debris (Fig. 1 b). This allowed us to do quantification of tissue morphological characteristics associated with tumor , based on both distributions and relati ve spatial locations of di verse cell types. For each small tissue region (sub-image) in the large WSI, we then constructed a cell network (Fig. 1 c). Each vertex of the network represents a cell of a certain type, and an edge denotes a cell-cell connection between immediately neighboring cells. Based on the distribution of cell-cell connections in the network (Fig. 1 d), we then grouped the local tissue regions into diff erent phenotypes using an unsupervised learning approach. The six resulting connection frequency (CF) based tissue phenotypes were visually discernible with each phenotype corresponding mainly to local areas of smooth muscle, inflammation, tumor-stroma interf ace, tumor, stroma, or necrosis (Fig. 1 e). Finally , we used the ratio of the area of each CF tissue phenotype to the total tissue area to giv e digital tissue phenotypic signature of each tumor sample (Methods). T o further examine the extent to which the aforementioned automatically deri ved cell-cell CF tissue phenotypes correlate with kno wn tissue types, we also quantified the tissue types by means of appearance based (AP) tissue segmentation. The tissue content of each WSI was automatically se gmented into the following eight cate gories: tumor, stroma, loose connecti ve tissue, normal/hyperplastic mucosa, smooth muscle, necrosis, fat, and inflammation (Fig. S1). W e then inv estigated correlation between the CF and AP based tissue phenotypes. These are smooth muscle, inflammation, tumor , stroma, and necrosis. The Spearman correlation coef ficients for individual pairs of CF and AP features range from 0.427 to 0.698 (Fig. S2), indicating moderate correspondence between the automatically-deriv ed phenotypes and the underlying tissue types. In addition to the phenotypic and standard clinical features, we considered the follo wing automatically-deriv ed features: Morisita index 23 , stroma-tumor ratio 9 , 11 , 12 , and necrosis-tumor ratio 13 , 16 , 17 . These features have pre viously been identified as having prognostic significance for CRC or other malignancies. Morisita index measures the spatial coexistence of inflammatory cell and malignant epithelial cells 23 . Stroma-tumor ratio is defined as the proportion of the total area of stroma to the total area of combined stroma and tumor in the tissue. Necrosis-tumor ratio is defined in the similar manner as that of stroma-tumor ratio (Methods). It is worth noting that in the abov e studies, the stroma-tumor ratio and necrosis-tumor ratio were semi-quantitati vely assessed on manually selected small regions of histological slides. In contrast, we measured these quantities with greater precision and using all regions of our WSIs, thus a voiding subjecti ve bias. 2/ 16 Association between phenotypic and clinical f eatures Here, we determined the strength of association between the CF tissue phenotypic features and standard clinical features normally used in routine prognostication of colon cancer (T able 2 ). The clinical features included tumor dif ferentiation, tumor histological type, and primary tumor (T) stage. For example, to check whether there is association between the CF inflamation ratio and the T stage, we test if the distrib ution of CF inflammation ratio of the group of samples that are annotated as pT3 stage is significantly dif ferent from the distribution of samples that are annotated as pT4 stage using Mann-Whitne y U test (also known as W ilcoxon rank-sum test). W e found statistically significant association between CF inflammation ratio and T stage (p-v alue = 0.002) and between CF tumor ratio and tumor dif ferentiation (p-value = 0.033). Nonetheless, the relati vely small v alues of the coefficients of determination (CF inflammation ratio vs. T stage: r 2 = 0.092; CF tumor ratio vs. differentiation: r 2 = 0.042) indicate that CF inflammation ratio and CF tumor ratio are only weakly associated with T stage and tumor differentiation, respectively . There is no statistically significant association between other pairs of the CF phenotypic features and the standard clinical features. Altogether , these results suggest that the CF tissue phenotypic features are not strongly associated with standard clinical features and, therefore, are potentially new features whose prognostic significance is w orth further in vestigation. Logistic regression analysis T o assess the significance of each phenotypic feature in identifying a patient’ s risk of having distant metastasis at the time of diagnosis or future progression, we carried out logistic regression analysis. Odds ratio factor and 95% confidence interval (CI) estimates were obtained for each feature to quantify the risk of distant metastasis incidence associated with the phenotypic features (Methods). The results show that CF smooth muscle and inflammation ratios are statistically significant (p-value < 0.05) in univ ariate analysis (T able 3 ). Moreov er , when adjusted for the ef fects of the standard clinical parameters in multiv ariate analysis, CF smooth muscle and inflammation ratios are statistically significant features (p-value < 0.05), independent of other standard clinical features (T able 3 and T able S1). The interquartile change in CF smooth muscle ratio increases the odds of distant metastasis by a factor of 2.258 (95% CI: 1.117 - 4.565) in univ ariate analysis and by 2.350 (95%CI: 1.132 - 4.876) in multi v ariate analysis. The interquartile change in CF inflammation ratio, on the other hand, decreases the odds by a factor of 0.279 (95% CI: 0.119 - 0.656) in the univ ariate analysis and 0.307 (95%CI: 0.126 - 0.749). Despite the fact that CF smooth muscle and inflammation ratios are separately shown to be statistically significant in both the uni variate and multivariate analyses, when considered together in the multi variate model (T able S1), their joint contribution to wards the prediction of metastasis dev elopment becomes less clear . This is likely due to a moderate degree of correlation ( ρ =-0.652) between the features. Thus, when one is used, the other should probably be disregarded. Next, we in vestigated if the abov e statistical results could be achiev ed by means of the AP smooth muscle ratio and AP inflammation ratio features. Only the AP inflammation ratio is sho wn to be statistically significant in the uni variate analysis (p-value = 0.027, T able 3 ) and mar ginally significant in the multiv ariate analysis (p-value = 0.056, T able 3 ). Distant metastasis-free survival analysis Next, we in vestigated the prognostic significance of v arious features, using DMFS as a criterion. The analysis was carried out on all cases from the UHCW cohort (78 cases), for which survi val data were a vailable. In our multi variate analysis, the ef fect of individual features w as adjusted for the effect of standard clinical features. The tissue CF phenotypic features (smooth muscle, inflammation, and stroma ratios) and the AP phenotypic feature (inflammation ratio) were shown to be influencing features in determining the DMFS probability of the patients under Cox proportional hazards models (p < 0.05, T able 4 , and T able S2). In particular , the effect of the interquartile change in CF smooth muscle ratio is to increase the hazard by 2.138 times (95% CI: 0.188 – 0.388) in the uni variate analysis and by 2.467 times (95% CI: 1.062 – 5.73) in the multiv ariate analysis. The interquartile change in AP inflammation ratio affects the DMFS probability by reducing the hazard by a factor of 0.401 (95% CI: 0.026 - 0.075) in the univ ariate analysis and by a f actor of 0.431 (95% CI: 0.224 - 0.832) in the multiv ariate analysis. In addition, when CF smooth muscle and AP inflammation are compared together in the same multiv ariate model, the ef fects of AP inflammation ratios on the DMFS probability v anishes (T able S2). This is likely due to the correlation between these features ( ρ = -0.252). The interquartile change in CF inflammation ratio influences the survi val probability by decreasing the hazard by a factor of 0.412 (95% CI: 0.204 - 0.934) in the uni variate analysis and by a factor of 0.413 (95% CI: 0.201 – 0.849) in the multi variate analysis. Howe ver , the effect of CF inflammation ratio is only mar ginally significant (p-v alue = 0.051) when adjusted by the standard clinical parameters in the multiv ariate analysis. Interestingly , CF stroma ratio also sho ws up as statistically significant in the univ ariate analysis (p-value = 0.032, hazard ratio factor = 0.475, 95% CI: 0.252 - 0.896). W e found that lo wer v alues of CF smooth muscle ratio and higher values of CF inflammation, CF stroma, and AP inflammation ratios were associated with low 5-year surviv al probabilities (Fig. 2 left and Fig. S3d left). Furthermore, there are statistically significant differences between the surviv al distrib utions of cases when stratified by CF smooth muscle, CF stroma, 3/ 16 and AP inflammation ratios (p-v alue < 0.05, T able 4 , Fig. 2 right). Stratification by other features does not yield statistically significant results (Fig. S3). In summary , CF smooth muscle and AP inflammation ratios are consistently shown to be important prognostic f actors for DMFS across three different types of surviv al analyses, including uni variate Cox regression analysis, multi v ariate Cox analysis, and log-rank test. Nonetheless, they are not sho wn to be independent of each other and therefore when one is used, the other should probably be disregarded. Discussion The goal of this study was to in vestigate the prognostic significance of nov el image-based quantitativ e morphometric features deriv ed from di verse cellular populations that constitute the tumor microen vironment of CRC with advanced primary tumors (T3/T4, N0, M0/M1). Digital Phenotypic Features vs Histological Features. T o fully explore the rich microscopic le vel information a vailable in a tissue section, we hav e dev eloped an automated system to provide quantitativ e measurements and av oid bias due to observer variability . The analysis was conducted on WSIs of H&E-stained formalin-fixed paraffin-embedded (FFPE) histological sections. Unlike previous w orks that identify div erse cellular components in a tumor section 24 , 25 , our morphometric features are not limited to tumor cells, lymphocytes, and stromal cells, but also include other types of inflammatory cells, spindle-shaped cells, and necrotic debris. In addition, we explored the relationship between these cellular components through a cell-cell network in order to characterize the morphological and tissue phenotypic heterogeneity of tumor . Our system did not adopt a commonly used approach 26 , 27 that calculates a lar ge number of features follo wed by feature selection methods to select a handful of features suitable for the objecti ves of the analysis. Although such an exploratory approach has pro ved successful in some applications 26 , 27 , the resulting features may not be easily interpretable in clinical terms. Moreover , if suf ficiently many features are tried, it is lik ely that one of them will turn out to be “statistically significant” and so this approach requires follow-up tests of reproducibility . Instead, we in vestigated a small set of meaningful quantitati ve features, automatically found through unsupervised phenotyping and segmentation. Our systematic analysis sho ws that (a) the CF smooth muscle and CF inflammation ratios are potentially independent markers predicting the occurrence of distance metastasis (binary logistic regression analysis) and (b) the CF smooth muscle and AP inflammation ratios are potential prognostic mark ers affecting 5-year DMFS for CRC patients diagnosed with adv anced primary tumor (Cox proportional hazards re gression analysis). CF smooth muscle ratio essentially measures the amount of the smooth muscle that is part of the colon wall. It quantifies the e xtent of spread and potential advancement of the tumors — the concept is related (but not similar) to other measures such as T stage, tumor-stroma ratio 9 , 11 , 12 , and tumor border configuration 28 , 29 . Low CF smooth muscle ratio is strongly associated with fa vorable prognosis. CF inflammation and AP inflammation ratios largely measure the amount of inflammation within the tumor tissue. High inflammation ratio is strongly associated with fa vorable prognosis, which supports the host-protective role of inflammatory cells in CRC that has been described by sev eral studies 8 , 30 , 31 . From this observation, one may hypothesize about the biological rele vance of each of our automatically deriv ed tissue phenotypes for tumor dev elopment and progression. The prognostic v alue of stroma-tumor ratio 9 , 11 , 12 and necrosis-tumor ratio 13 , 16 , 17 could not be confirmed in this study . It should be emphasized that, in those studies, both the ratios were semi-quantitati vely measured in manually selected tumor-rich areas and were ine vitably prone to observ er bias. By contrast, our study measured these quantities in a fully automated and quantitati ve manner from all regions of the tumor section and therefore can be considered to be more objectiv e and reproducible. Uncertainty found in our analysis pertaining to the prognostic impact of standard clinical factors has also been confirmed in existing literature 32 – 37 . Despite the fact that tumor dif ferentiation has been consistently sho wn to be a prognostic feature independent of stage 38 – 42 , the con ventional grading process is subjectiv e by its very nature and can exhibit a substantial degree of observer variability 32 , 33 . Inconsistency in grading is likely to occur in this study since samples from different cohorts were graded by different pathologists (UHCW : DS, HGH: IM). It is also worth noting that according to the re vised WHO criteria 43 , only poorly differentiated tumor histology without mismatch repair protein deficienc y is considered a high-risk factor . Presence of the mucinous histologic type in general is not an independent prognostic factor , giv en that av ailable results are contradictory 34 , 35 . Recent data ha ve demonstrated the primary tumor extent (T4 stage) to be a likely prognostic factor for recurrence/metastasis 44 – 46 . Nevertheless, like other semi-quantitative features, there have been reports of variability in assessment of the degree of tumor extent 36 , 37 . Results from our analysis also indicate that T4 tumors hav e adv erse DMFS outcome compared to T3 tumors, though the difference is not statistically significant (p-v alue = 0.156). The majority of samples in this study come from patients diagnosed with stage II (Duk es stage B) CRC. This is characterized by adv anced primary tumor with neither lymph node nor distant metastasis in volvement (T3/T4, N0, M0). Stage II CRC consists of a heterogeneous population; some subgroups appear more likely to de velop distant metastasis than others. Although adjuv ant chemotherapy treatment is effecti ve in other stages of the disease, there is a limited incremental benefit that stage II CRC 4/ 16 patients could deriv e from this type of treatment in general 47 – 49 . Due to the high financial cost and morbidity of the treatment coupled with uncertainty ov er which patients will relapse, there has long been a debate as to whether adjuvant chemotherap y treatment should be gi ven to the patients, since a majority of the patients will already ha ve been cured by sur gical resection alone. In the absence of molecular or genetic predicti ve markers for chemotherapy response 44 , 50 , 51 , improv ed prognostication accuracy seems to be the only ke y to better identify candidates who could potentially benefit the most from systemic therapies and thereby av oid unnecessary ov ertreatment as well as provide more ef ficient use of healthcare resources. Even though se veral histological features hav e been demonstrated to be potential prognostic mark ers for recurrence or distant metastasis in stage II CRC, their prognostic significance is less clear and needs further validation. Primary tumor (T) stage and the number of lymph nodes examined hav e been recommended as risk factors by the National Comprehensiv e Cancer Network 52 . Howe ver , the results from our analysis do not support the T stage as a risk factor . Moreover , there is a contro versy as to whether examining more lymph nodes can, in fact, reduce tumor staging error and in turn result in impro ved stage II patient survi val 53 , 54 . High-frequency microsatellite instability has been associated with improv ed disease-free surviv al in one study 51 while in another study the effect w as the opposite 50 . Gene expression profile is another factor that has shown promise for prediction of recurrence 44 , 45 . Study Limitations. Based on the makeup of our dataset and the results from our analysis, we hypothesize that high CF smooth muscle ratio and lo w CF or AP inflammation ratios are potential risk factors for distant metastasis in stage II CRC. There are nev ertheless some limitations of this study as described below . Firstly , although our cell detection and classification approach 22 was de veloped to be robust to a certain de gree of variation of images arising from factors such as stain inconstanc y , batch effects, failed autofocus, and artef acts in the tissue preparation process, it remains to be tested if the degree of variation is e xcessiv e. Good image quality is therefore critical if the system is to produce accurate results. This issue can be addressed by careful tissue preparation and slide scanning. Secondly , due to the nature of the H&E stain and cellular morphology , our system is capable of identifying only a limited number of cell categories that are some what coarse. IHC stains could provide an ef fectiv e means of identifying more specific cell types, such as different types of immune cells and fibroblasts (normal fibroblasts or CAFs), at the additional costs of IHC slide preparation and associated antibodies. Thirdly , the phenotyping proposed in this work was done on the basis of local cell-cell connection frequencies and also on the basis of appearance and other important contextual information such as tissue textures. This, on the one hand, can be seen as a limitation of the proposed quantitative tissue phenotyping approach, as it relies on local cell populations to generate global statistics. On the other hand, a number of studies hav e reported that normal cells of various types undergo transformation when coming into contact with tumor cells, thus resulting in some of the previously normal cells exhibiting ne w biological functions dif ferent from the original ones. The proposed approach focuses on cellular morphology and cellular conte xt and av oids influences from other possibly misleading contextual information. Finally , our analysis was based on a single dataset consist ing of two independent cohorts from dif ferent institutes. T o further confirm the reproducibility of the results and generalizability of our automated histologic quantification system, large-scale v alidation using independent cohorts from multiple institutes is required. T o be translated into clinical practice, these limitations will need to be carefully addressed. The Outlook. W ith the increasing uptake of digital slide scanning technology in histopathology laboratories, digitized WSIs will gradually replace glass slides in routine pathology workflo w 55 . This presents an opportunity to advance image analytical techniques and computational algorithms for quantitative analysis of tissue morphology and consequently to provide an accurate and reproducible means for the diagnosis and prognostication of cancers. This is the first step to wards effecti ve treatment, decision-making, and personalized medicine with computational support. In this work, we hav e demonstrated the usefulness of such morphometric tools to re veal prognostic features in CRC. Our morphometric analysis is not restricted to images of FFPE CRC tissues but is also applicable to frozen tissue images as well as to images from different types of cancers. This morphometric approach was not designed to replace pathologists, but rather to pro vide additional information to assist in their diagnostic decision-making and risk stratification. Another potentially important direction w ould be to in vestigate potential associations between genomic alterations and digital tissue phenotypic signatures reflecting measurable aspects of in the tumor microen vironment. Methods Experimental Design The main objectiv e of this study was to assess the significance of tissue phenotypic features for determining distant metastasis in advanced primary CRC. Specifically , we asked what quantitati ve tissue phenotypic features are biologically meaningful and important in predicting the concurrence at the time of diagnosis or subsequent dev elopment of distant metastasis and the 5/ 16 distant-metastasis-free survi val. Based on results from our statistical analyses, we hav e shown that digital tissue phenotypic features are independent prognostic factors for distant metastatic potential in CRC patients with advanced primary tumors (T3/T4, N0, M0/M1). The sample size for logistic and Cox proportional hazards regression analyses was calculated based on the concept of ev ents per variable 56 – 58 which indicates that a minimum of 30 metastatic subjects would be suf ficient to control for a type I error rate at 7%, 95% CI cov erage of 93% , and a relati ve bias of 7% of the estimate in the W ald test. W e retrospectiv ely recruited CRC subjects with adv anced primary tumors. Cases without a 5-year distant metastasis status were excluded and the enrollment was stopped when the calculated sample size was reached. Our analyses were conducted on H&E-stained WSIs of tumor sections. After revie wing the WSIs, we further excluded outlier cases whose tissue section had no tumor . In view of the limited number of cases, randomization w as not used in any experiments. P atient and clinical inf ormation This study in volved two independent cohorts of CRC patients from two institutes. The first cohort consisted of 78 patients initially admitted for CRC treatment during the years 2006 to 2010 at Univ ersity Hospitals Coventry and W arwickshire (UHCW), Cov entry , UK. The second cohort comprised 30 patients admitted during the years 2007 to 2012 at Hamad General Hospital (HGH), Doha, Qatar . For each case, clinical data included tumor histological type, dif ferentiation, stage of the primary tumor (T), lymph node metastasis (N), and distant metastasis (M). The 5-year DMFS data were a vailable only for UHCW cases. All CRC patients were diagnosed with locally adv anced tumors (T3/T4) and negativ e lymph node (N0). Some patients appeared to hav e distant metastatic tumors at the time of diagnosis (M1), b ut the majority did not (M0). The TNM classification was revie wed and conducted according to the AJUCC/UICC-TNM staging system 18 . Summary details of the clinical information are giv en in T able 1 . The data used for this study including the WSIs and clinical information was pro vided after de-identification and informed patient consent was obtained from all subjects. Ethics approv al for this study was obtained from the National Research Ethics Service North W est (REC reference 15/NW/0843). All the experiments were carried out in accordance with approv ed guidelines and regulations. Histological samples and Imaging For each case, tissue sections were prepared from an FFPE tumor tissue block and were then stained with H&E. Each tissue section was prepared in the pathology laboratory of the UHCW hospital. Histological slides were digitally scanned using the Omnyx VL120 Scanner (GE Omnyx, LLC) with an × 40 setting (equiv alent to 0.275 µ m /pixel). The scanned images were manually revie wed to control for failed autofocus. The tumor slides of all the cases were revie wed by the pathologists (DS, YT , and IM) and the slides sho wing the deepest inv asion into the bo wel wall and/or the worst differentiated parts of the tumor , were selected for analysis. Detection and classification of cells based on n uclear appearance T wo separate con volutional neural networks (CNNs) were trained, one for detection and another for classification of cells 22 . A spatially-constrained CNN produced a probability map assigning to each pixel the probability of being the center of a cell. Subsequently , the locations of cells were estimated by the local maxima of the probability map. T o classify a detected cell, multiple small sub-images in the neighborhood of the detected cell were e xtracted and then fed to the neighboring ensemble predictor (NEP). The NEP was trained to classify 4 cell types: malignant epithelial cells, inflammatory cells (including eosinophils, lymphocytes, and neutrophils), spindle-shaped cells (including normal fibroblasts, CAFs, and smooth muscle cells), and necrotic debris. The training and v alidation of the two algorithms were carried out on a dataset consisting of more than 20,000 cells, annotated by an experienced pathologist and a trained observ er . The pixel resolution of images in the dataset was reduced to 0.55 µ m (equi valent to using a × 20 microscope objecti ve). This dataset consisted of certain H&E-stained WSIs from cases that were initially excluded from the study . Based on a 2-fold cross-v alidation, the cell detection algorithm achie ved an F1-score of 0.802 and the cell classification algorithm a multiclass A UC score 59 of 0.917. For more details of the cell detection and classification method, see Sirinukunwattana et al. 22 . Quantifying local tissue characteristic W e first split a WSI into small non-overlapping image tiles of size 200 × 200 µ m 2 (Fig. 1 a), which was within the limit of effecti ve intercellular communication distance 60 . For each image tile, a cell network (in computational terms, a graph) w as constructed based on cell detection and classification results (Fig. 1 b). The vertices of the netw ork represent cells of different types. The network itself is the associated Delaunay triangulation (Fig. 1 c), so that an edge represents a connection between a pair of neighboring cells. The edges connecting cells in one tile with cells in an adjacent tile were not considered. Since there are 4 cell classes, there are 10 possible pairs of cell-cell connections in the network. W e then used the distribution of different cell-cell connection types (Fig. 1 d) to characterize a given image tile. 6/ 16 Tissue phenotyping using cell-cell connection frequencies In order to group image tiles into different phenotypes, we first calculate a feature vector based on cell-cell connection frequencies. W e consider the 4-element set A = { M , I , S , N } , where M denotes the malignant epithelial type, I the inflammatory type, S the spindle-shaped type, and N the necrotic debris type. W e also identify A with 1 , 2 , 3 , 4 and define an indexing set Q = { ( i , j ) | i ≥ j } . Let h = h ( i , j ) | ( i , j ) ∈ Q ∈ R 10 be the ten-dimensional cell-cell connection frequency vector representing the frequencies of all cell-cell connections, where h ( i , j ) ∈ [ 0 , 1 ] denotes the proportion of connection frequencies between cells of types i and j . W e calculated this vector for e very image tile extracted from e very WSI in the dataset. Next, we performed k -medoid clustering on all frequency vectors, calculated as abov e, for all tiles in all WSIs in the dataset in order to group image tiles into dif ferent phenotypes. This unsupervised algorithm (we used the k -medoid algorithm implemented in Matlab 2016b) automatically finds a set of medoids — representati ve frequenc y vectors for tile phenotypes within the data — and assigns a phenotype label to each tile according to its nearest medoid. W e employed the Chi-squared distance between a frequency v ector h and a medoid m gi ven by: d ( h , m ) = ∑ k ∈ Q ( h k − m k ) 2 h k + m k W e initialized the medoids randomly and ran the clustering algorithm 100 times for each trial. W e then used the results from the replicate that yielded the smallest total sum of distances between the frequency v ectors and their corresponding medoids. The criteria used to determine the number of phenotypes k were the similarity between the phenotypes and the correlation between tissue morphometric features deriv ed from the phenotypes (described below). The similarity between a pair of phenotypes was measured in terms of the Chi-squared distance between the pair of medoids representing the phenotypes. Correlation between a pair of features was measured by the Spearman correlation coefficient. In order to find a suitable number of distinct phenotypes k , we chose the maximum number of phenotypes that produced relati vely high v alues of Chi-squared distance and relati vely lo w v alues of correlation between distinct features. A distance v alue less than 0.2 and a correlation coefficient v alue greater than 0.8 were considered undesirable. W e found that k =6 is the maximum number of phenotypes that satisfies both criteria (Fig S4). Examples of image tiles from dif ferent tissue phenotypes discov ered using cell-cell connection frequencies are sho wn in Fig. 1 e. As can be observed in Fig. 1 e, the six connection frequency (CF) based phenotypes found automatically corresponded well with the follo wing distinct tissue phenotypes: smooth muscle, inflammation, tumor-stroma interf ace, tumor , stroma, and necrosis. Tissue phenotyping based on appearance W e also trained a deep learning based CNN for patch-based tissue phenotyping, in which the following 9 categories of image patches were explicitly considered: normal, non-tissue background, loose connectiv e tissue (submucosa), fat (adipose), stroma (desmoplasia), inflammation, necrosis, smooth muscle, and tumor . Each image patch was of size 32 × 32 pixels with a pixel resolution of 2.2 µ m /pixels ( 5 × objecti ve). The architecture of the CNN was a simplified version of that proposed by Simonyan et al . 61 . In dev eloping this appearance (AP) based approach to tissue phenotyping, we used a dataset consisting of 193 sub-images, each of size 1,346 × 982 pixels. These images were extracted from WSIs of cases that were initially e xcluded from the study . A trained observer (KS) annotated all images. W e randomly split the images into three parts with 52.5% for training, 17.5% for validation, and 30% for testing. Each WSI contributed images to only one part of the split. For training and validation, we extracted multiple patches of size 32 × 32 pixels from the training and validation images. W e selected the version of the algorithm that yielded the best performance on the v alidation part. In testing, for each test image, we extracted patches in a sliding-window fashion and classified each of them separately before mer ging the results together to obtain a segmentation result for the whole image. The correct classification accuracies for the 9 tissue phenotypes were as follo ws: normal 98.9%, non-tissue background 99.9%, loose connectiv e tissue (submucosa) 98.4%, fat (adipose) 97.9%, stroma (desmoplasia) 90.4%, inflammation 99.3%, necrosis 98.2%, smooth muscle 97.5%, and tumor 96.0%. W e ran the trained segmentation algorithm on the 108 H&E-stained WSI images, used in the analyses. Examples of the segmentation results can be seen in Fig. S1. Furthermore, as a quality control, se gmentation results of 10 images (out of 108 images) were randomly selected and then revie wed by expert pathologists (DS, IC). A utomatically-derived tissue phenotypic features The CF and AP based tissue phenotypic features were calculated as follows: phenotype ratio = area of the tissue phenotype total tissue area 7/ 16 Here, the tissue area was computed from all tissue types excluding the normal and fat regions. The other tissue phenotypic features were quantified as follows: stroma-tumor ratio = stroma area stroma area + tumor area necrosis-tumor ratio = necrosis area necrosis area + tumor area where stroma, tumor , and necrosis areas were obtained from the AP based phenotyping results. Statistical analyses Our analysis did not distinguish well dif ferentiated from moderately dif ferentiated tumors—as recommended by Compton et al. 62 , 63 , this helps to av oid contradictory labelling by two different observers, or e ven by a single observer , looking at the same sample on two dif ferent occasions. Missing data were filled in with 100 imputed values using the multiple imputation method implemented in the R ‘mice’ library 64 . Analyses were performed on every imputed dataset and the results were combined to yield an ov erall estimate 65 . The significance level w as set to 0.05 for all the tests described below . Association between the tissue phenotypic and standard clinical features was tested by the Mann-Whitney test and the strength of association was determined through coef ficients of determination ( r 2 ) of the test 66 , 67 . The median p-value and r 2 were reported for a variable with multiple imputed values. W e used the ‘rms’ library in R 68 to fit logistic regression models, to calculate the area under the receiv er operating characteristic curve (A UC), and to perform survi val and bootstrap analyses. Logistic regression analysis was performed to assess the predictive po wer of each phenotypic feature in identifying patients with concurrent distant metastasis at the time of diagnosis or a propensity for distant metastasis de velopment. Effects of the automatically-deriv ed features were gauged after adjusting for the standard clinical variables in multi variate logistic re gression models. A total of 108 cases (78 UHCW and 30 HGH) were used in the analysis. The 5-year metastasis status was treated as a binary outcome and features were treated as predictors in re gression models. Estimated odds ratio and its 95% CI were obtained for each feature to quantify the risk of distant metastasis dev elopment associated with the feature. W e reported the factor of change in odds ratio when the v alue of a feature changes from the baseline v alue to the new value. For a continuous feature, the baseline and the changed v alues were set to the 1st and 3rd quartiles of the feature. Furthermore, likelihood ratio p-values were computed to assess goodness of fit of predicti ve models contributed by v arious features. Surviv al analysis was performed to determine the prognostic value for DMFS associated with each feature. Uni variate and multiv ariate Cox proportional hazards regression analyses were conducted on 78 cases from the UHCW cohort for which DMFS data were av ailable. The former was used to e valuate the prognostic impact of each feature separately while the latter was used to assess the prognostic value of image-based tissue phenotypic features while adjusting for the effects of the clinical features. Rao’ s score test and W ald test were employed in the univ ariate and multiv ariate analyses, respectiv ely , to test whether the regression coef ficient corresponding to a particular feature in the Cox proportional hazards model was nonzero. Note that the score test is equiv alent to the log-rank test when only a single categorical feature is considered in the model 69 . Hazard ratio and 95% CI estimates were obtained for each feature. T o internally validate the performance of each fitted Cox proportional hazards model in predicting the surviv al probability , a bootstrap routine 70 with 100 resampling replicates was employed to estimate the A UC. The statistical significance difference between survi val stratifications was determined through the log-rank test using the R ‘surviv al’ library 71 . The cutoff with minimum p-value w as used for stratification, and the p-value was adjusted according to Altman’ s correction 72 in case of a continuous feature. Data A vailability The datasets generated during and/or analyzed during the current study are available from the corresponding author on reasonable request. Extracted image features and codes to perform statistical analyses will be included in the Supplementary Information files once the manuscript has been accepted for publication. References 1. Bissell, M. J. & Hines, W . C. Why don’t we get more cancer? A proposed role of the microenvironment in restraining cancer progression. Nat. medicine 17 , 320–329 (2011). 2. Stoker , A. W ., Hatier , C. & Bissell, M. J. The embryonic en vironment strongly attenuates v-src oncogenesis in mesenchymal and epithelial tissues, but not in endothelia. The J. cell biology 111 , 217–228 (1990). 3. W eaver , V . M. et al. Rev ersion of the malignant phenotype of human breast cells in three-dimensional culture and in vivo by integrin blocking antibodies. The J. cell biology 137 , 231–245 (1997). 4. Whiteside, T . The tumor microen vironment and its role in promoting tumor growth. Oncogene 27 , 5904 (2008). 8/ 16 5. Hanahan, D. & W einberg, R. A. Hallmarks of cancer: the next generation. cell 144 , 646–674 (2011). 6. Quail, D. F . & Joyce, J. A. Microen vironmental regulation of tumor progression and metastasis. Nat. medicine 19 , 1423–1437 (2013). 7. Siegel, Rebecca L and Miller , Kimberly D and Jemal, Ahmedin. Cancer statistics, 2016. CA: a cancer journal for clinicians 66 , 7–30 (2016). 8. Galon, J. et al. T ype, density , and location of immune cells within human colorectal tumors predict clinical outcome. Sci. 313 , 1960–1964 (2006). 9. Mesker , W . E. et al. The carcinoma–stromal ratio of colon carcinoma is an independent factor for survi val compared to lymph node status and tumor stage. Anal. Cell. P athol. 29 , 387–398 (2007). 10. Crispino, P . et al. Role of desmoplasia in recurrence of stage II colorectal cancer within fiv e years after surgery and therapeutic implication. Cancer in vestigation 26 , 419–425 (2008). 11. W est, N. et al. The proportion of tumour cells is an independent predictor for survi val in colorectal cancer patients. Br. journal cancer 102 , 1519 (2010). 12. Huijbers, A. et al. The proportion of tumor-stroma as a strong prognosticator for stage II and III colon cancer patients: validation in the VICT OR trial. Annals Oncol. 24 , 179–185 (2012). 13. Jayasinghe, C., Simiantonaki, N. & Kirkpatrick, C. J. Histopathological features predict metastatic potential in locally advanced colon carcinomas. BMC cancer 15 , 14 (2015). 14. Dvorak, H. F . T umors: wounds that do not heal. New Engl. J. Medicine 315 , 1650–1659 (1986). 15. Sch ¨ afer , M. & W erner, S. Cancer as an overhealing wound: an old hypothesis re visited. Nat. r eviews Mol. cell biology 9 , 628–638 (2008). 16. Pollheimer , M. J. et al. T umor necrosis is a new promising prognostic factor in colorectal cancer. Hum. pathology 41 , 1749–1757 (2010). 17. Richards, C. et al. Prognostic value of tumour necrosis and host inflammatory responses in colorectal cancer. Br. J. Sur g. 99 , 287–294 (2012). 18. Edge, S. B. & Compton, C. C. The American Joint Committee on Cancer: the 7th edition of the AJCC cancer staging manual and the future of TNM. Annals sur gical oncology 17 , 1471–1474 (2010). 19. Punt, C., Koopman, M. & V ermeulen, L. From tumour heterogeneity to advances in precision treatment of colorectal cancer. Nat. Rev. Clin. Oncol 14 , 235–246 (2017). 20. Dalerba, P . et al. Single-cell dissection of transcriptional heterogeneity in human colon tumors. Nat. biotechnolo gy 29 , 1120–1127 (2011). 21. Marusyk, A. & Polyak, K. T umor heterogeneity: causes and consequences. Biochimica et Biophys. Acta (BB A)-Reviews on Cancer 1805 , 105–117 (2010). 22. Sirinukunwattana, K. et al. Locality sensitiv e deep learning for detection and classification of nuclei in routine colon cancer histology images. IEEE transactions on medical imaging 35 , 1196–1206 (2016). 23. Maley , C. C., Koelble, K., Natrajan, R., Aktipis, A. & Y uan, Y . An ecological measure of immune-cancer colocalization as a prognostic factor for breast cancer. Br east Cancer Res. 17 , 131 (2015). 24. Y uan, Y . et al. Quantitative image analysis of cellular heterogeneity in breast tumors complements genomic profiling. Sci. translational medicine 4 , 157ra143–157ra143 (2012). 25. Nawaz, S., Heindl, A., K oelble, K. & Y uan, Y . Beyond immune density: critical role of spatial heterogeneity in estrogen receptor-ne gativ e breast cancer. Mod. P athol. 28 , 766 (2015). 26. Beck, A. H. et al. Systematic analysis of breast cancer morphology uncovers stromal features associated with surviv al. Sci. translational medicine 3 , 108ra113–108ra113 (2011). 27. Y u, K.-H. et al. Predicting non-small cell lung cancer prognosis by fully automated microscopic pathology image features. Nat. communications 7 (2016). 28. K oelzer , V . H. & Lugli, A. The tumor border configuration of colorectal cancer as a histomorphological prognostic indicator. F r ont. oncology 4 (2014). 29. Karamitopoulou, E. et al. T umour border configuration in colorectal cancer: proposal for an alternati ve scoring system based on the percentage of infiltrating margin. Histopathol. 67 , 464–473 (2015). 9/ 16 30. Pages, F . et al. Immune infiltration in human tumors: a prognostic factor that should not be ignored. Oncogene 29 , 1093 (2010). 31. Ohtani, H. Focus on TILs: prognostic significance of tumor infiltrating lymphocytes in human colorectal cancer. Cancer Immun. Ar ch. 7 , 4 (2007). 32. Jass, J. et al. The grading of rectal cancer: historical perspectiv es and a multiv ariate analysis of 447 cases. Histopathol. 10 , 437–459 (1986). 33. Compton, C. C. Pathology report in colon cancer: what is prognostically important? Dig. Dis. 17 , 67–79 (1999). 34. Hyngstrom, J. R. et al. Clinicopathology and outcomes for mucinous and signet ring colorectal adenocarcinoma: analysis from the National Cancer Data Base. Annals sur gical oncology 19 , 2814–2821 (2012). 35. Kim, S. H. et al. Prognostic value of mucinous histology depends on microsatellite instability status in patients with stage III colon cancer treated with adjuvant FOLFO X chemotherapy: a retrospectiv e cohort study. Annals surgical oncology 20 , 3407–3413 (2013). 36. Zeng, Z. et al. Serosal cytologic study to determine free mesothelial penetration of intraperitoneal colon cancer. Cancer 70 , 737–740 (1992). 37. Shepherd, N. A., Baxter , K. J. & Lov e, S. B. The prognostic importance of peritoneal in volv ement in colonic cancer: a prospectiv e ev aluation. Gastr oenter ol. 112 , 1096–1102 (1997). 38. Chapuis, P . et al. A multiv ariate analysis of clinical and pathological variables in prognosis after resection of lar ge bo wel cancer. Br. journal sur gery 72 , 698–702 (1985). 39. Grif fin, M. R., Bergstralh, E. J., Coffey , R. J., Beart, R. W . & Melton, L. J. Predictors of surviv al after curative resection of carcinoma of the colon and rectum. Cancer 60 , 2318–2324 (1987). 40. W iggers, T ., Arends, J. W . & V olovics, A. Regression analysis of prognostic factors in colorectal cancer after curativ e resections. Dis. colon & rectum 31 , 33–41 (1988). 41. Newland, R. C., Dent, O. F ., L yttle, M. N., Chapuis, P . H. & Bokey , E. L. Pathologic determinants of surviv al associated with colorectal cancer with lymph node metastases. A multiv ariate analysis of 579 patients. Cancer 73 , 2076–2082 (1994). 42. Jessup, J. M., Stewart, A. K. & Menck, H. R. The National Cancer Data Base report on patterns of care for adenocarcinoma of the rectum, 1985-1995. Cancer 83 , 2408–2418 (1998). 43. Hamilton, S. R., Aaltonen, L. A. et al. WHO classification of tumours. Pathology and genetics of tumours of the digestive system. Geneva: W orld health or ganization (2000). 44. Kerr , D. et al. A quantitativ e multigene R T -PCR assay for prediction of recurrence in stage II colon cancer: Selection of the genes in four large studies and results of the independent, prospecti vely designed QU ASAR v alidation study. J. Clin. Oncol. 27 , 4000–4000 (2009). 45. Salazar , R. et al. Gene expression signature to improv e prognosis prediction of stage II and III colorectal cancer. J. clinical oncology 29 , 17–24 (2010). 46. Tsikitis, V . L., Larson, D. W ., Huebner , M., Lohse, C. M. & Thompson, P . A. Predictors of recurrence free survi val for patients with stage II and III colon cancer. BMC cancer 14 , 336 (2014). 47. Hartung, G. et al. Adjuv ant therap y with edrecolomab v ersus observ ation in stage II colon cancer: a multicenter randomized phase III study. Oncol. Res. T r eat. 28 , 347–350 (2005). 48. Quasar Collaborativ e Group. Adjuvant chemotherapy versus observ ation in patients with colorectal cancer: a randomised study. The Lancet 370 , 2020–2029 (2007). 49. Schippinger , W . et al. A prospecti ve randomised phase III trial of adjuv ant chemotherap y with 5-fluorouracil and leucovorin in patients with stage II colon cancer. Br. journal cancer 97 , 1021 (2007). 50. Ribic, C. M. et al. T umor microsatellite-instability status as a predictor of benefit from fluorouracil-based adjuvant chemotherapy for colon cancer. New Engl. J. Medicine 349 , 247–257 (2003). 51. Kim, G. P . et al. Prognostic and predictiv e roles of high-degree microsatellite instability in colon cancer: a National Cancer Institute–National Surgical Adjuv ant Breast and Bo wel Project Collaborativ e Study. J. Clin. Oncol. 25 , 767–772 (2007). 52. National Comprehensiv e Cancer Network. NCCN clinical practice guidelines in oncology: colon cancer (2010). URL http://www.nccn.org/professionals/physician_gls/PDF/colon.pdf . 10/ 16 53. W ong, S. L. et al. Hospital lymph node examination rates and surviv al after resection for colon cancer. Jama 298 , 2149–2154 (2007). 54. Moore, J., Hyman, N., Callas, P . & Littenberg, B. Staging error does not explain the relationship between the number of lymph nodes in a colon cancer specimen and surviv al. Sur g. 147 , 358–365 (2010). 55. Snead, D. R. et al. V alidation of digital pathology imaging for primary histopathological diagnosis. Histopathol. 68 , 1063–1072 (2016). 56. Concato, J., Peduzzi, P ., Holford, T . R. & Feinstein, A. R. Importance of ev ents per independent v ariable in proportional hazards analysis I. Background, goals, and general strategy. J. clinical epidemiology 48 , 1495–1501 (1995). 57. Peduzzi, P ., Concato, J., Feinstein, A. R. & Holford, T . R. Importance of ev ents per independent variable in proportional hazards regression analysis II. Accurac y and precision of regression estimates. J. clinical epidemiology 48 , 1503–1510 (1995). 58. Peduzzi, P ., Concato, J., Kemper , E., Holford, T . R. & Feinstein, A. R. A simulation study of the number of events per variable in logistic re gression analysis. J. clinical epidemiology 49 , 1373–1379 (1996). 59. Hand, D. J. & T ill, R. J. A simple generalisation of the area under the ROC curv e for multiple class classification problems. Mach. learning 45 , 171–186 (2001). 60. Francis, K. & Palsson, B. O. Effecti ve intercellular communication distances are determined by the relative time constants for cyto/chemokine secretion and dif fusion. Pr oc. Natl. Acad. Sci. 94 , 12258–12262 (1997). 61. Simonyan, K. & Zisserman, A. V ery deep conv olutional networks for large-scale image recognition. arXiv preprint arXiv:1409.1556 (2014). 62. Compton, C. C. et al. Prognostic factors in colorectal cancer: College of American Pathologists consensus statement 1999. Ar ch. pathology & laboratory medicine 124 , 979–994 (2000). 63. Compton, C. C. Updated protocol for the e xamination of specimens from patients with carcinomas of the colon and rectum, excluding carcinoid tumors, lymphomas, sarcomas, and tumors of the v ermiform appendix: a basis for checklists. Ar ch. pathology & laboratory medicine 124 , 1016–1025 (2000). 64. Buuren, S. & Groothuis-Oudshoorn, K. mice: Multiv ariate imputation by chained equations in R. J. statistical softwar e 45 (2011). 65. Rubin, D. B. Multiple imputation for nonresponse in surve ys , vol. 81 (John W iley & Sons, 2004). 66. Cohen, B. H. Explaining psycholo gical statistics (John W iley & Sons, 2008). 67. Fritz, C. O., Morris, P . E. & Richler , J. J. Ef fect size estimates: current use, calculations, and interpretation. J. e xperimental psychology: Gen. 141 , 2 (2012). 68. Harrell Jr, F . rms: Regression Modeling Strate gies. R package version 4.5-0, 2016 (2016). 69. Therneau, T . & Grambsch, P . Modeling Survival Data: Extending the Cox Model . Statistics for Biology and Health (Springer , 2000). URL https://books.google.co.th/books?id=9kY4XRuUMUsC . 70. Harrell, F . Regr ession modeling strate gies: with applications to linear models, logistic and or dinal r e gr ession, and survival analysis (Springer , 2015). 71. Therneau, T . A package for surviv al analysis in S. R package version 2.38, 2015 (2015). 72. Altman, D. G., Lausen, B., Sauerbrei, W . & Schumacher , M. Dangers of using optimal cutpoints in the ev aluation of prognostic factors. JNCI: J. Natl. Cancer Inst. 86 , 829–835 (1994). Ackno wledgements This paper was made possible by NPRP grant number NPRP5-1345-1-228 from the Qatar National Research Fund (a member of Qatar Foundation). The statements made herein are solely the responsibility of the authors. The authors would like to ackno wledge the contribution by Sean James, Kayleigh Patterson, Dr . Aisha Meskiri, and Dr . Asha Rupani who inv olved in the preparation, staining, and scanning of histology slides of the CRC samples used in this study . 11/ 16 A uthor contributions statement NR, DS, IC, and KS designed the study . ZA and DS collected the clinical data. IM and DS re viewed and graded the histological samples. DS, YT , and IM revie wed and selected slides for analysis. KS and NR dev eloped the image analysis tools. YT and KS generated ground truth data for training the nuclear detection and classification algorithm. YT , DS, and IC revie wed the results of the algorithms. KS conducted all the statistical analyses. NR, DE, and IC supervised the statistical analyses and interpreted the results. KS drafted the manuscript. All authors were in volv ed in discussion of the results and finalization of the manuscript. Additional inf ormation Competing financial interests: The author(s) declare no competing financial interests. Clinical feature UHCW cohort HGH cohort T otal Number of cases 78 30 108 T umor histological type Adenocarcinoma 69 26 95 Mucinous 9 3 12 Not av ailable 0 1 1 T umor differentiation W ell differentiated 6 6 12 Moderately differentiated 39 20 59 Poorly differentiated 17 4 21 Not av ailable 16 0 16 T stage pT3 60 26 86 pT4 18 4 22 5-year metastasis No 52 23 75 Y es 26 7 33 Median metastasis-free surviv al (year) W ith distant metastasis 1.0410 Not av ailable 1.0410 W ithout distant metastasis > 5 Not av ailable > 5 T able 1. A summary of clinical data. 12/ 16 Feature Differentiation Histological type T stage p-value r 2 p-value r 2 p-value r 2 CF smooth muscle ratio 0.711 0.001 0.567 0.003 0.834 0 CF inflammation ratio 0.168 0.018 0.957 0 0.108 0.024 CF tumor-stroma interface ratio 0.339 0.008 0.608 0.002 0.002 0.092 CF tumor ratio 0.033 0.042 0.587 0.003 0.466 0.005 CF stroma ratio 0.655 0.002 0.949 0 0.362 0.008 CF necrosis ratio 0.321 0.009 0.267 0.011 0.973 0 T able 2. Association between the CF tissue phenotypic features and standard clinical features. Mann-Whitney test’ s p-value and coefficient of determination ( r 2 ) are used to assess the association between features. The results with p-value less than 0.05 is considered statistically significant (bold). Feature Univ ariate Multiv ariate Odds ratio factor p-value A UC Odds ratio factor p-value A UC Standard histological features Differentiation (MD → PD) 1.729 (0.622,4.807) 0.298 0.525 Histological type (Adenocarcinoma → Mucinous) 0.752 (0.190,2.984) 0.679 0.491 T stage (pT3 → pT4) 2.283 (0.869,5.995) 0.097 0.559 Connection frequency (CF) based tissue phenotypic features CF smooth muscle ratio (0.167 → 0.372) 2.258 (1.117,4.565) 0.010 0.641 2.350 (1.132,4.876) 0.008 0.638 CF inflammation ratio (0.042 → 0.138) 0.279 (0.119,0.656) 0.009 0.661 0.307 (0.126,0.749) 0.022 0.623 CF tumor-stroma interf ace ratio (0.122 → 0.229) 1.326 (0.722,2.435) 0.644 0.503 1.177 (0.623,2.224) 0.800 0.556 CF tumor ratio (0.079 → 0.229) 0.488 (0.244,0.976) 0.111 0.623 0.520 (0.252,1.070) 0.187 0.607 CF stroma ratio (0.174 → 0.275) 0.567 (0.334,0.962) 0.094 0.595 0.585 (0.340,1.007) 0.139 0.580 CF necrosis ratio (0.022 → 0.053) 0.713 (0.366,1.386) 0.284 0.539 0.738 (0.371,1.469) 0.254 0.539 Appearance (AP) based tissue phenotypic features AP smooth muscle ratio (0.136 → 0.330) 1.449 (0.755,2.779) 0.513 0.511 2.075 (0.970,4.437) 0.125 0.562 AP inflammation ratio (0.025 → 0.070) 0.422 (0.206,0.865) 0.027 0.618 0.472 (0.225,0.987) 0.056 0.585 Other features Morisita index 23 (0.344 → 0.529) 0.973 (0.533,1.775) 0.916 0.494 0.868 (0.461,1.632) 0.866 0.541 Stroma-tumor ratio 9 , 11 , 12 (0.400 → 0.613) 0.898 (0.515,1.567) 0.284 0.571 0.852 (0.481,1.509) 0.329 0.569 Necrosis-tumor ratio 13 , 16 , 17 (0.077 → 0.224) 0.556 (0.274,1.129) 0.247 0.551 0.577 (0.278,1.197) 0.272 0.578 T able 3. Prognostic values of dif ferent features according to the logistic regression analysis. Each morphological feature is adjusted by the standard histological features in the multiv ariate analysis. The statistical significance of each feature is assessed by the likelihood ratio test’ s p-value. An interquartile change for a continuous v ariable or categorical change for a categorical variable is noted by ( x → y ). A 95% confidence interval of the estimate of odds ratio f actor is noted by ( x , y ). A statistically significant result at the 0.05 is highlighted in bold. A UC in the multi variate analysis refers to the A UC of the multiv ariate model rather than an individual feature. 13/ 16 Feature Univ ariate Multiv ariate Hazard ratio factor Score test p-value Log-rank test p-value A UC Hazard ratio factor W ald test p-value A UC Standard histological features Differentiation (MD → PD) 1.275 (0.496,3.281) 0.539 0.539 0.496 Histological type (Adenocarcinoma → Mucinous) 0.580 (0.137,2.449) 0.450 0.450 0.512 T stage (pT3 → pT4) 1.814 (0.787,4.181) 0.156 0.156 0.542 Connection frequency (CF) based tissue phenotypic features CF smooth muscle ratio (0.167 → 0.372) 2.138 (0.922,4.955) 0.016 0.036 0.633 2.467 (1.062,5.730) 0.008 0.623 CF inflammation ratio (0.042 → 0.138) 0.412 (0.204,0.834) 0.039 0.258 0.608 0.413 (0.201,0.849) 0.051 0.582 CF tumor-stroma interface ratio (0.122 → 0.229) 1.120 (0.619,2.029) 0.931 0.445 0.462 1.054 (0.575,1.934) 0.968 0.530 CF tumor ratio (0.079 → 0.229) 0.584 (0.303,1.125) 0.174 0.399 0.584 0.520 (0.304,1.184) 0.276 0.566 CF stroma ratio (0.174 → 0.275) 0.475 (0.252,0.896) 0.032 0.047 0.627 0.469 (0.245,0.895) 0.062 0.616 CF necrosis ratio (0.022 → 0.053) 0.689 (0.343,1.386) 0.233 0.595 0.535 0.619 (0.302,1.267) 0.202 0.552 Appearance (AP) based tissue phenotypic features AP smooth muscle ratio (0.136 → 0.330) 1.515 (0.762,3.010) 0.467 0.759 0.514 2.086 (1.025,4.247) 0.127 0.563 AP inflammation ratio (0.025 → 0.070) 0.401 (0.216,0.742) 0.001 0.003 0.654 0.431 (0.224,0.832) 0.009 0.625 Other features Morisita index 23 (0.344 → 0.529) 0.844 (0.458,1.556) 0.861 0.795 0.507 0.742 (0.397,1.387) 0.646 0.502 Stroma-tumor ratio 9 , 11 , 12 (0.400 → 0.613) 0.880 (0.517,1.498) 0.607 0.529 0.519 0.813 (0.464,1.424) 0.583 0.515 Necrosis-tumor ratio 13 , 16 , 17 (0.077 → 0.224) 0.647 (0.328,1.275) 0.281 0.370 0.554 0.652 (0.331,1.286) 0.216 0.575 T able 4. Prognostic values of dif ferent features according to the Cox proportional hazards regression analysis on the UHCW cohort. Each morphological feature is adjusted by the standard histological features in the multiv ariate analysis. An interquartile change for a continuous variable or cate gorical change for a categorical v ariable is noted by ( x → y ). A 95% confidence interval of the estimate of hazard ratio f actor is noted by ( x , y ). A statistically significant result at the 0.05 significance lev el is highlighted in bold. A UC in the multiv ariate analysis refers to the A UC of the multiv ariate model rather than an individual feature. 14/ 16 Figure 1. Profiling tissue morphometric phenotypes. A WSI was divided into small re gions of size 200 × 200 µ m 2 (a). Cellular components in the image were localized and classified into 4 different cell types, including malignant epithelial cell, inflammatory cell, spindle-shaped cell, and necrotic debris, based on their nuclear morphology and surrounding tissue context (b). A cell network was subsequently constructed from the cell detection and classification results, in which nodes in the network represent cells and edges conceptualize relationships among them (c). A distribution of cell-cell connections was calculated for each small region (d). According to their distributions of cell-cell connections, tissue regions were profiled into 6 different phenotypes (e). 15/ 16 Figure 2. Prognostic values of tissue phenotypes in the uni variate survi val analysis. (Left) A 5-year DMFS estimate with respect to the CF smooth muscle ratio (a), CF stroma ratio (b), and AP inflammation ratio (c). The gray shaded regions indicate the 95% confidence intervals of the estimates. (Right) Kaplan-Meier curves stratified by the CF smooth ratio (a), CF stroma ratio (b), and AP inflammation ratio (c). A log-rank p-value was computed for each pair of Kaplan-Meier estimates. 16/ 16
Original Paper
Loading high-quality paper...
Comments & Academic Discussion
Loading comments...
Leave a Comment