Scalable methods for nonnegative matrix factorizations of near-separable tall-and-skinny matrices
Numerous algorithms are used for nonnegative matrix factorization under the assumption that the matrix is nearly separable. In this paper, we show how to make these algorithms efficient for data matrices that have many more rows than columns, so-call…
Authors: Austin R. Benson, Jason D. Lee, Bartek Rajwa
Scalable methods for nonnegative matrix factorizations of near -separable tall-and-skinn y matrices A ustin R. Benson, Jason D . Lee Stanf ord University Institute f or Computational and Mathematical Engineering {arbenson,jdl17}@stanf ord.edu Bar tek Rajwa Purdue Univ ersity Bindley Biosciences Center brajw a@purdue.edu David F . Gleich Purdue University Computer Science dgleich@purdue.edu ABSTRA CT Numerous algorithms are used for nonnegativ e matrix fac- torization under the assumption that the matrix is nearly separable. In this pap er, w e sho w how to mak e these algo- rithms efficient for data matrices that hav e many more rows than columns, so-called “tall-and-skinn y matrices” . One key component to these improv ed metho ds is an orthogonal ma- trix transformation that preserv es the separabilit y of the NMF problem. Our final methods need a single pass o ver the data matrix and are suitable for streaming, multi-core, and MapReduce architectures. W e demonstrate the efficacy of these algorithms on terab yte-sized synthetic matrices and real-w orld matrices from scien tific computing and bioinfor- matics. Categories and Subject Descriptors G.1.3 [ Numerical Analysis ]: Numerical Linear Algebra; G.1.6 [ Numerical Analysis ]: Optimization General T erms Algorithms K eywords nonnegativ e matrix factorization, separable, QR, SVD, MapRe- duce, heat transfer, flow cytometry 1. NONNEGA TIVE MA TRIX F A CTORIZA- TIONS A T SCALE A nonnegativ e matrix factorization (NMF) for an m × n matrix X with real-v alued, nonne gative entries is X = W H (1) where W is m × r , H is r × n , r < min( m, n ), and both factors ha ve nonnegative en tries. While there are already standard dimension reduction techn iques for general matrices such as Permission to make digital or hard copies of all or part of this work for personal or classroom use is granted without fee provided that copies are not made or distributed for profit or commercial adv antage and that copies bear this notice and the full citation on the first page. T o copy otherwise, to republish, to post on serv ers or to redistrib ute to lists, requires prior specific permission and/or a fee. Copyright 20XX A CM X-XXXXX-XX-X/XX/XX ...$15.00. the singular v alue decomposition and the in terpolative de- composition [10], the adv an tage of NMF is in interpr etability of the data. A common example is facial image decompo- sition [19]. If the columns of X are pixels of a facial im- age, the columns of W may b e facial features such as eyes or ears, and the co efficien ts in H represent the in tensit y of these features. F or this reason, among a host of other rea- sons, NMF is used in a b road range of applications including graph clustering [24], protein sequence motif disco very [23], and hypersp ectral unmixing [20]. An important prop ert y of matrices in these applications and other massive scientific data sets is that they ha ve many more ro ws than c olumns ( m n ). F or example, this matrix structure is common in big data applications with hundreds of millio ns of samples and a small set of features—see, e.g., Section 5.2 for a bioinformatics application where the data matrix has 1.6 billion rows and 25 columns. W e call matrices with many more ro ws than columns tal l-and-skinny . In this pap er, w e are concerned with efficien t NMF al- gorithms for tall-and-skinn y matrices as prior work has not tak en adv antage of this structure for large-scale factoriza- tions. First, in Section 2.2, w e presen t a new dimension re- duction tec hnique using orthogonal transformations. These transformations are particularly effectiv e for tall-and-skinny matrices and lead to algorithms that need only one pass o ver the data matrix. W e compare this metho d with a Gaussian transformation tec hnique from the hyperspectral unmixing communit y [6, 8]. Since tall-and-skinny matrices are amenable to streami ng computations [5, 12], we present a MapReduce implement ation in Section 3. Ho wev er, the algorithms are easily translated to GPUs and distributed memory MPI, since w e just need the TSQR kernel (see the discussion in Section 3.1). W e begin b y showing that our method correctly reco vers the answer hidden in syn theti- cally generated problems in Section 4; and then we test our algorithms on data sets from t wo scien tific a pplications, heat transfer simulations and flo w cytometry , in Section 5. The softw are for our algo rithms and experimen ts is a v ail- able online at https://github.com/arbenson/mrnmf . In the remainder of the introduction, we review the state of the art for computing non-negative matrix factorizations. 1.1 Separable NMF W e first turn to the issue of ho w to practically compute the factorization in Equati on (1). Unfortunately , for a fixed non-negativ e rank r , finding the factors W and H for which the residual k X − W H k is minimized is NP-complete [29]. T o mak e the problem tractabl e, we ma ke assumptions ab out the data. In particular, we require a separabilit y condition on the matrix. A nonnegative matrix X is r -sepa r able if X = X (: , K ) H , where K is an index set with |K| = r and X (: , K ) is Mat- lab notation for the matrix X restricted to the columns in- dexed b y K . Since the coefficients of H are nonnegative, all columns of X live in the conical h ull of the “extreme” columns indexed b y K . The idea of separability was de- v elop ed b y Donoho and Stodden [16], and recen t w ork has produced tractable NMF algorithms b y assuming that X al- most satisfies a separability condition [4, 7, 17]. A matrix X is noi sy r -sep ar able or ne ar-sep ar able if X = X (: , K ) H + N , where N is a noise matrix whose entries are small. Near- separabilit y means that all data p oin ts appro ximately live in the conical hull of the extreme colu mns. The algorithms for near-separab le NMF are t ypically based on conv ex geometry and can b e describ ed by the same t wo- step approach: 1. Determine the extreme columns, indexed b y K , and let W = X (: , K ). 2. Solv e H = arg min Y ≥ 0 k X − W Y k . The bulk of the literature is fo cused on the first step. In Section 3, w e show how to efficiently implem ent b oth steps in a single-pass o ver the data and pro vide the details of a MapReduce implementation. W e note that separabilit y is a severe and restrictiv e as- sumption. The tradeoff is that our algorithms are extremely efficien t and prov ably correct under this assu mption. In big data applications, efficiency is at a premium, and this pro- vides some justification for using separability as a to ol for exploratory data analysis. F urthermore, our experiments on real scien tific data sets in Section 5 under the separability assumption lead to new insigh ts. 1.2 Alternati ve NMF algorithms There are several approac hes to solving Equation (1) that do not assume the separabilit y condition. These algorithms t ypically emplo y blo c k coordinate descen t, optimizing ov er W and H while keeping one factor fixed. Examples include the seminal work b y Lee and Seung [27], alternating least squares [11, 22], and fast pro jection-based least squares [21]. Some of these methods are used in MapReduce arc hitectures at scale [26]. Alternating methods require up dating the entire factor W or H after each optimization step. When one of the factors is large, repeated updated can be prohibitiv ely expensive. The problem is exacerbated in Hado op MapReduce [28], where in termediate results are written to disk. Regardless of the approach or computing platform, the algorithms are not feasible when the matrices cannot fit in main memory . In con trast, we sho w in Sections 2 and 3 that the separabilit y assumption leads to algorithms that do not require up dates to large matrices. This approach is scalable for large tall- and-skinn y matrices in big data problems. 2. ALGORITHMS AND DIMENSION REDUCTION FOR NEAR-SEP ARABLE NMF There are sev eral p opu lar algorithms for near-separable NMF, and they are motiv ated b y con vex geometry . The goal of thi s sec tion is to sho w that when X is tall-and-skinny , w e can apply dimension reduction techniques so that estab- lished algorithms can execute on n × n matrices, rather than the original m × n . Our new dimension reduction technique in Section 2.2 is also motiv ated by con v ex geometry . In Sec- tion 3, we leverage the dimension reduction in to scalable algorithms. 2.1 Geometric algorithms There are tw o geometric strategies typically employ ed for near-separable NMF. The first deals with conical h ulls. A c one C ⊂ R m is a non-empt y c onv ex with C = ( X i α i x i | α i ∈ R + , x i ∈ R m ) , The x i are generating v ectors. In separable NMF, X = X (: , K ) H implies that all columns of X lie in the cone generated by the columns indexed b y K . F or an y k ∈ K , { αX (: , k ) | α > 0 } is an extr eme r ay of this cone. The goal of the XRA Y algorithm [25] is to find these extreme ra ys. In particular, the greedy v ariant of XRA Y selects the maximum column norm arg max j k R T X (: , j ) k 2 / k X (: , j ) k 2 , where R is a residual matrix that gets up dated with each new extreme column. The second approac h deals with conv ex hulls. If D is a diagonal matrix with D ii = k A (: , i ) k 1 and A is separable, then X D − 1 = X (: , K ) D ( K , K ) − 1 D ( K , K ) H D − 1 = ( X D − 1 )(: , K ) ˜ H . Th us, X D − 1 is also separable. Since the columns are ` 1 - normalized, the columns of ˜ H ha ve non-negat ive en tries and sum to one. In other words, all columns of X D − 1 are in the con vex hull of the columns indexed by K . The problem is reduced to finding the extreme points of a con vex h ull. P op- ular approac hes in the con text of NMF include the Succes- siv e Pro jection Algorithm (SP A, [3]) and its generalization [18]. Another alternativ e, based on linear programming, is Hott T opixx [7]. As an example of the particulars of one suc h method, SP A, which we will use in Sections 4 and 5, finds extreme points by computing arg max j k R (: , j ) k 2 2 , where R is a residual matrix related to the data matrix X . In an y algorithm, w e call the columns indexed by K ex- tr eme c olumns . The next tw o subsections are devoted to di- mension reduction tec hniques for finding the extreme columns in the case when X is tall-and-skinny . 2.2 Orthogonal transformations Consider a cone C ⊂ R m and a nonsingular m × m matrix M . It is easily sho wn that x is an extreme ray of C if and only if M x is an extreme ray of M C = { M z | z ∈ C } . Similarly , for any conv ex set S , x is an extreme p oin t of S if and only if M x is an extreme point of M S . W e tak e adv antage of these facts b y applying specific or- thogonal transformations as the in vertibl e matrix M . Let X = Q ˜ R and X = U ˜ Σ V T be the ful l QR fact orization and singular v alue decomp ositio n (SVD) of X , so that Q and U are m × m orthogonal (and hence nonsingular) matrices. Then Q T X = R 0 , U T X = Σ V T 0 , where R and Σ are the top n × n blo c ks of ˜ R and ˜ Σ and 0 is an ( m − n ) × n matrix of zero es. The zero ro ws pro- vide no information on which columns of Q T X or U T X are extreme ra ys or extreme points. Thus, w e can restrict our- selv es to finding the extreme columns of R and Σ V T . These matrices are n × n , and we ha ve significan tly reduced the di- mension of the problem problem. In fact, if X = X (: , K ) H is a separable representation, we immediately hav e separated represen tations for R and Σ V T : R = R (: , K ) H , Σ V T = Σ V T (: , K ) H. W e note that, although any in ve rtible transformation pre- serv es extreme columns, many transformat ions will destro y the geometric structure of the data. How ev er, orthogonal transformations are either rotations or reflections, and they preserv e the data’s geometry . This dimension reduction technique is exact when X is r -separa ble, and the results will be the same for orthogonal transformations Q T and U T . This is a consequence of the transformed data ha ving the same separabilit y as the origi- nal da ta. The SP A and XR A Y algo rithms briefly describ ed in Section 2.1 only depend on computing column 2-norms, whic h are prese rved under orthogonal transform ations. F or these algorithms, applying Q T or U T preserv es the column 2-norms of the data, and the selected extreme columns are the same. How ever, other NMF algorithms do not p ossess this in v ariance. F or this reason, w e present both of the or- thogonal transformations. Finally , w e highligh t an imp ortan t b enefit of this dimen- sion reduction tec hnique. In man y applications, the data is noisy and the separation rank ( r in Equation (1)) is not kno wn a priori . In Section 2.4, we show that the H factor can be computed in the small dimension. Thus, it is viable to try sev eral diff erent v alues of the separation rank and pic k the best one. This idea is extremely useful for the applica- tions presented in Section 5, where we do not ha ve a goo d estimate of the separability of the data. 2.3 Gaussian projection An alternativ e dimension reduction technique is random Gaussian pro jections, and the idea has b een used in hy- persp ectral unmixing problems [6]. In the hypersp ectral unmixing literature, the separabilit y is referred to as the pur e-pixel assumption , and the random pro jections are also motiv ated by con v ex geometry [8]. In particular, given a matrix G ∈ R m × k with Gaussian i.i.d. en tries, the extreme columns of X are taken as the extreme columns of G T X , whic h is of dimension k × n . The algorithm assumes that the columns of X are normalized to sum to one. In other w ords, X (: , i ) ← X (: , i ) / || X (: , i ) || 1 , i = 1 , . . . , n In Section 3.3, we sho w ho w to run the algorithm in one pass o ver the data matrix, even if the colum ns are not nor- malized. Recen t work shows that when X is r -separable and k = O ( r log r ), then all of the extreme columns are found with high probabilit y [14]. The extreme column se- lection is simple: for each ro w of G T X , the indices of the minim um and maxim um en tries are added to the set K . The Gaussian transformation translat es cleanly to streaming and MapReduce algorithms. W e provide an implementatio n in Section 3.2. 2.4 Computing H Selecting the extreme columns indexed b y K completes one half of t he NMF factorization in Equation (1) . How do w e compute H ? W e wan t H = arg min Y ∈ R r × n + k X − X (: , K ) Y k 2 for some norm. Choosing the F robenius norm results in a set of n nonnegative least squares (NNLS) problems: H (: , i ) = arg min y ∈ R r + k X (: , K ) y − X (: , i ) k 2 2 , i = 1 , . . . , n. Let X = Q ˜ R with R the upp er n × n blo c k of ˜ R . Then H (: , i ) = arg min y ∈ R r + k X (: , K ) y − X (: , i ) k 2 2 = arg min y ∈ R r + k Q T ( X (: , K ) y − X (: , i )) k 2 2 = arg min y ∈ R r + k R (: , K ) y − R (: , i ) k 2 2 Th us, w e can solve the NNLS problem with matrices of size n × n . After computing just the small R factor from the QR factorization, we can compute the entire nonnegativ e matrix factorization by working with matrices of size n × n . Analogous results hold for the SVD, where w e replace Q b y U , the left singular v ectors. In Section 3, we sho w that these computations are simple and scalable. Since m n , computations on O ( n 2 ) data are fast, ev en in serial. Finally , note that w e can also compute the residual in t his reduced space, i.e.: min y ∈ R n + k X (: , K ) y − X (: , i ) k 2 2 = min y ∈ R n + k R (: , K ) y − R (: , i ) k 2 2 . This simple fact is significan t in practice. When there are sev eral candidate sets of extreme columns K , the residual error for each set can b e computed quic kly . In Section 5, we compute man y residual errors for different sets K in order to choose an optimal separation rank. W e ha v e now sho wn how to use dimension reduction tec h- niques for tall-and-skinn y matrix data in near-separable NMF algorithms. F ollo wing the same strategy as many NMF algo- rithms, w e first compute extreme colu mns and then solve for the co efficien t matrix H . F ortunately , o nce the upfron t cost of the orthogonal transformation is complete, both steps can be computed using O ( n 2 ) data. 3. IMPLEMENT A TION Remark ably , when the matrix is tall-and-skin ny , we need only one pass o ver the data matrix and a MapReduce imple- men tation suffices to ac hieve optimal communication. While all of the algorithms use sophisticated computation, these routines are only ever in vok ed with matrices of size n × n . Th us, w e get extremely scalable implementations. Algorithm 1 MapReduce Gaussian Pro jection for NMF function Map (key k , matrix ro w x T i ) Sample column v ector g i ∼ N (0 , I k ). for each row r k of g i x T i do emit ( k , r k ) end for end function function Reduce (key k , matrix rows h r k i ) emit ( k , sum( h r k i )) end function 3.1 TSQR and R-SVD The thin QR factorization of an m × n real-v alued matrix A with m > n is A = QR where Q is an m × n orthogonal matrix and R is an n × n upper triangular matrix. This is precisely the factorization w e need in Section 2. F or our purp oses, Q T is applied im- plicitly , and we only need to compute R . When m n , comm unication-optimal algorithms for computing the fac- torization are referred to as TSQR [15]. TSQR is imple- men ted in sev eral en vironments, including MapReduce [5, 12], distributed memory MPI [15], GPUs [2], and grid com- puting [1]. All of these methods a void computing A T A and hence are n umerically sta ble. The dimension reduction tec h- niques from Secti on 2 are indep enden t of the platform. How- ev er, as explained in Sect ion 3.4, we use MapReduce to tar- get data computations. The thin SVD factorization used in Section 2.2 is a small extension of the thin QR factorization. The thin SVD is A = U Σ V T where U is m × n and orthogonal, Σ is diagonal with de- creasing, nonnegative diagonal en tries, and V is n × n and orthogonal. Let A = QR be the thin QR factorization of A and R = U R Σ V T be the SVD of R . Then A = ( QU R )Σ V T = U Σ V T . The matrix U = QU R is m × n and orthogonal, so this is the thin SVD factorization of A . The dimension of R is n × n , so computing its SVD takes O ( n 3 ) floating p oin t op erations (flops), a trivial cost when n is small. When m n , this method for computing the SVD is called the R -SVD [9]. Both TSQR and R -SVD require O ( mn 2 ) flops. Ho wev er, the dominant cost is communication, which w e analyze in Section 3.5. 3.2 Gaussian projection F or implementing the Gaussian pro jection in Section 2.3, w e assume that w e can quickly sample i.i.d. Gaussians in parallel. Under this assumption, the transformation is eas- ily implemen ted in MapReduce. F or each row of the data matrix x T i , the map function computes the outer product g i x T i , where g i consists of n sampled Gaussians. The map function emits a k ey-v alue pair for each row of this outer product, where the key is the row num b er. The reduce fun c- tion simply sums all rows with the same k ey . Algorithm 1 con tains the functions. In theory and practice, all of the outer products on a single map process are summed before emitting k ey-v alue pairs. The function p erforming the ag- gregation is called a com biner. In practice, we can only generate i.i.d. Gaussians on a single pro cessor. While there ma y b e small correlations in samples across pro cessors, this does not affect the p erfor- mance of the algorithm in practice (see Section 4). 3.3 Column normalization The con vex h ull algorithms from Section 2.1 and the Gaus- sian pro jection algorithm from Section 2.3 require the columns of the data matrix X to b e normalized. A naiv e implemen- tation of the column normalization for the con vex hull algo- rithms in a MapReduce or streaming environmen t would do the following: 1. Read X and compute the column norms. 2. Read X , normalize the columns, and write the nor- malized data to disk. 3. Use TSQR on the normalized matrix. This requires reading the data matrix twice times and writing O ( mn ) data to disk once to just normalize the columns. The b etter approach is a single step: 1. Use TSQR on the unnormalized data X and sim ulta- neous compute the column norms of X . Let D b e th e diagonal matrix of column norms. Note that X = QR → X D − 1 = Q ( RD − 1 ) . The matrix ˆ R = RD − 1 is upp er triangular, so Q ˆ R is the thin QR factorization of the column-normalized data. This approac h reads the data once and only writes O ( n 2 ) data. The same idea applies to Gaussian pro jection: G T ( X D − 1 ) = ( G T X ) D − 1 . Th us, our algorithms only need to read the data matrix once in all cases. 3.4 MapReduce motivation F or the experiments in this pap er, w e use a MapReduce implemen tations for the NMF algorith ms presented in Sec- tion 2.1 using the dimension reduction tec hniques in Sec- tion 2.2. Our cen tral computationa l k ernel is the tall-and- skinn y QR factorization (TSQR), which has b een optimized on sev eral arc hitectures (see the references in the Section 3.1). Th us, our ideas in this paper are not restricted to MapRe- duce arc hitectures. That being said, MapReduce remains a popular framework in data-in tensive computing for sev- eral reasons. First, man y large datasets are already w are- housed in MapReduce clusters. Having algorithms that run on the cluster eliminate the need to transfer data to an- other computer. The algorithms in this pap er need only one pass ov er the data. Since running time is dominated b y the cost of loading data from disk to main memory , the time to transfer data can take as long as simply run- ning the algorithm directl y on the cluster. Second, systems lik e Hado op [28] and Spark [30] typically manage the dis- tributed file input-output routines and communication col- lectiv es. This significan tly reduces the soft ware developmen t cycle. Finally , many MapReduce implemen tations pro vide transparen t fault tolerance. 0 5 1 0 1 5 2 0 2 5 S e p a r a t i o n r a n k ( r ) 0 . 0 0 0 . 0 5 0 . 1 0 0 . 1 5 0 . 2 0 0 . 2 5 0 . 3 0 0 . 3 5 0 . 4 0 R e l a t i v e e r r o r S P A X R A Y G P Figure 1: Relativ e error in the separable factor- ization as a function of nonnegativ e rank ( r ) for the three algorithms. The matrix was synthe tically gen- erated to b e separable. SP A and GP capture all of the true extreme columns when r = 20 (where the residual is zero). Since we are using the greedy v ari- an t of XRA Y, it tak es r = 21 to capture all of the extreme columns. 3.5 Communication costs f or NMF on MapRe- duce There are tw o communication costs that we analyze for MapReduce. The first is the time to read the input data. In Hadoop, data is stored on disk and loading the data is frequen tly the dominan t cost in numerical algorithms. The second is t he time spent sh uffling data. This is roughly mea- sured by the n umber and size of the k ey-v alue pairs sorted in the shuffle step. Curren t implementations of TSQR and R -SVD in MapReduce can compute R or Σ V T in a a sin- gle MapReduce iteration [5]. F or the dimension reduction, the data matrix only needs to be read once. Although al- gorithms suc h as Hott T opixx, SP A, and Gaussian pro jec- tion require norma lized columns, we sho w ed th at t he colu mn norms can be computed at the same time as TSQR (see Sec- tion 3.3). F or Gaussian pro jection, w e cannot compute the factor H in the same pro jected space. T o remedy this, w e com bine TSQR with t he Gaussian pro jection in a single pass o ver the data. F ollo wing thi s initial computation, the H ma- trix is computed as in Section 2.4. The map pro cesses in the MapReduce implemen tations for TSQR, R -SVD, and Algorithm 1 emit O ( n · #(map t asks)) k eys to the shuffle stage (one for each ro w of the reduced matrix). The key-v alue pairs are O ( n ) in length—eac h pair represen ts a partial row sum of the resultan t n × n matrix. F or tall-and-skinn y matrices, n may as well b e considered a constan t as it is often incredibly small. Th us, our comm u- nication is optimal. 4. TESTING ON SYNTHETIC MA TRICES In this section, w e test our dimension reduction tec hniques on tall-and-skinny matrices that are synthetically generated 0 5 0 1 0 0 1 5 0 2 0 0 c o l u m n i n d e x S e l e c t e d c o l u m n s S P A X R A Y G P G e n e r a t i o n Figure 2: First 20 extreme columns selected b y SP A, XRA Y, and GP along with the true columns used in the syn thetic matrix generation. A mark er is present for a given column index if and only if that column is a selected extreme column. SP A and GP capture all of the true extreme columns. Since w e are using the greedy v arian t of XRA Y, it do es select all of the true extreme columns (the columns mark ed Generation). to b e separable or near-separable. All experiments w ere con- ducted on a 10-node, 40-core MapReduce cluster at Stan- ford’s Institute for Computational and Mathematical En- gineering (ICME). Eac h no de has 6 2-TB disks, 24 GB of RAM, and a single Intel Core i7-960 3.2 GHz processor. They are connected via Gigabit ethernet. W e test the fol- lo wing three algorithms: 1. Dimension reduction with the SVD follo wed by SP A. 2. Dimension reduction with the SVD follow ed by the greedy v ariant of the XRA Y algorithm. The greedy method is not exact in the separable case but w orks w ell in practice [ 25]. 3. Gaussian pro jection (GP) as described in Section 2.3. Using our dimension reduction techn ique, all three algo- rithms require only one pass ov er the data. The al gorithms w ere selected to be a representativ e set of the approaches in the literature, and we will refer to the three algorithms as SP A, XRA Y, and GP . As discussed in Section 2.2, the c hoice of QR or SVD do es not matter for these algorithms (although it ma y matter for other NMF algorithms). Thus, w e only consider the SVD transformation in the subsequent n umerical experiments. W e generate a separable matrix X with m = 200 million ro ws and n = 200 columns. The nonnegative rank ( r in Equation (1)) is 20. W e generated the separable matrix by X := W I r H 0 Π , where H 0 is a r × ( n − r ) and W is a m × r matrix with entries generated from a Unifo rm [0 , 1] distribution. The perm uta- tion matrix Π swaps columns i and 10 i , i = 2 , . . . , r − 1 = 19. 0 5 0 1 0 0 1 5 0 c o l u m n i n d e x 0 5 0 1 0 0 1 5 0 r o w i n d e x G e n e r a t i o n 0 . 0 0 . 1 0 . 2 0 . 3 0 . 4 0 . 5 0 . 6 0 . 7 0 . 8 0 . 9 1 . 0 0 5 0 1 0 0 1 5 0 c o l u m n i n d e x 0 5 0 1 0 0 1 5 0 r o w i n d e x S P A 0 . 0 0 0 . 1 5 0 . 3 0 0 . 4 5 0 . 6 0 0 . 7 5 0 . 9 0 0 5 0 1 0 0 1 5 0 c o l u m n i n d e x 0 5 0 1 0 0 1 5 0 r o w i n d e x X R A Y 0 . 0 0 0 . 1 5 0 . 3 0 0 . 4 5 0 . 6 0 0 . 7 5 0 . 9 0 0 5 0 1 0 0 1 5 0 c o l u m n i n d e x 0 5 0 1 0 0 1 5 0 r o w i n d e x G P 0 . 0 0 0 . 1 5 0 . 3 0 0 . 4 5 0 . 6 0 0 . 7 5 0 . 9 0 Figure 3: Co efficien t matrix H found by the algorithms when r = 20 , where the test matrix w as syn thet- ically generated to hav e separation rank 20 . The syn thetically generated matrix is in the left plot. Eac h algorithm captures similar co efficien ts. The en tries in H for the original matrix we re generated from uniform random v ariables, so there is no visible structure in the co efficien ts. In real applications, the co efficie nts ha v e significan t structure (see Figures 9 and 13). In other w ords, the extreme columns of X are indexed b y 0 , 1 , 10 , 20 , . . . , 190. The matrix o ccupies 286 GB of storage in the Hadoop Distributed File System (HDFS). Figure 1 shows the relative residual error as a function of the separation rank r . The relativ e error is k X − X (: , K ) H k 2 F / k X k 2 F . As r approac hes 20, the true separation rank, the relative error con ve rges to 0. Figure 2 sho ws the columns selected when r = 20. All algorithms except XRA Y select the correct columns. Since we use the greedy v ariant of XRA Y, it is not guaran teed to select the correct columns. Ho wev er, all 20 extreme columns are in the first 21 extreme columns selected b y XRA Y. Figure 3 sho ws the co efficien t mat rix H computed with eac h algorithm when r = 20. W e see that the NNLS solv er successfully reco vers the correct coefficients. W e also test our algorit hm with a near-sep arable matrix: X := W I r H 0 Π + N , The matrices W , H , and Π are the same as the ab o ve exper- imen t. The en tries of N are chosen uniformly on [0, 1e-3]. Figures 4 5, and 6 sho w the relative errors for v arying sep- aration ranks, the columns selected with r = 20, and the coefficient matrices H for eac h algorithm. The results are iden tical to those in the separable case. 5. APPLICA TIONS W e no w test our algorithms and implementations on sci- en tific data sets, using the same algorithms and compute system configuration describ ed in Section 4. The data are nonnegativ e, but w e do not kno w a priori that the data is separable. 5.1 Heat transfer simulation data The heat transfer sim ulation data contains the sim ulated heat in a high-conductivity stainless steel blo c k with a low- conductivit y foam bubble inserted in the block [13]. Eac h column of the matrix corresponds to simulation results for a foam bubble of a differen t radius. Several simulations for random foam bubble lo cations are included in a column. Eac h row corresponds to a three-dimensional spatial co or- dinate, a time step, and a bubble lo cation. An en try of the matrix is the temp erature of the blo c k at a single spatial lo- cation, time step, bubble lo cation, and bubble radius. The matrix is constructed suc h that columns near 64 hav e far 0 5 1 0 1 5 2 0 2 5 S e p a r a t i o n r a n k ( r ) 0 . 0 0 . 1 0 . 2 0 . 3 0 . 4 0 . 5 0 . 6 R e l a t i v e e r r o r S P A X R A Y G P Figure 4: Relativ e error in the separable factor- ization as a function of nonnegativ e rank ( r ) for the three algorithms. The matrix was synthe tically gen- erated to b e nearly r -separable (exactly separable with small, additive noise). The results agree with the noiseless case (see Figure 1). more v ariability in the data – this is then responsible for ad- ditional “rank-lik e” structure. Thus, we w ould intuivitely ex- pect the NMF algo rithms to select additional columns closer to the end of the matrix. (And indeed, this is what we will see shortly .) In total, the matrix has appro ximately 4. 9 bil- lion ro ws and 64 columns and o ccupies a little more than 2 TB on HDFS. The data set is publicly av ailable. 1 Figure 7 shows the residuals for v arying separation ranks. Ev en a small separation rank ( r = 4) results in a small resid- ual. SP A has the smallest residuals, and XRA Y and GP are comparable. An adv antage of our pro jection metho d is that w e can quickly test many v alues of r . F or the heat transfer sim ulation data, we c hoose r = 10 for further exp erimen ts. This v alue of r is near an “elb o w” in the residual plot for the GP curve. 1 https://www.opensciencedatac loud.org/publicdata/ 0 5 0 1 0 0 1 5 0 c o l u m n i n d e x 0 5 0 1 0 0 1 5 0 r o w i n d e x S P A 0 . 0 0 0 . 1 5 0 . 3 0 0 . 4 5 0 . 6 0 0 . 7 5 0 . 9 0 0 5 0 1 0 0 1 5 0 c o l u m n i n d e x 0 5 0 1 0 0 1 5 0 r o w i n d e x X R A Y 0 . 0 0 0 . 1 5 0 . 3 0 0 . 4 5 0 . 6 0 0 . 7 5 0 . 9 0 0 5 0 1 0 0 1 5 0 c o l u m n i n d e x 0 5 0 1 0 0 1 5 0 r o w i n d e x G P 0 . 0 0 0 . 1 5 0 . 3 0 0 . 4 5 0 . 6 0 0 . 7 5 0 . 9 0 Figure 6: Co efficien t matrix H for SP A, XRA Y, and GP for the synthe tic near-separable matrix when r = 20 . Ov erall, the coefficients are similar to those in Figure 3, where there is no noise. Again, the coefficients are generated from uniform random v ariables, so there is no structure in the co efficien ts themselves. 0 5 0 1 0 0 1 5 0 2 0 0 c o l u m n i n d e x S e l e c t e d c o l u m n s S P A X R A Y G P G e n e r a t i o n Figure 5: First 20 extreme columns selected b y SP A, XRA Y, and GP along with the true columns used in the synthetic matrix generation. In this case, the data is noisy and the matrix is nearly r - separable. Ho w ever, the results are the same as in the noiseless case (see Figure 2). Figure 8 shows the columns selected by eac h algorithm. Columns five th rough 30 are not extreme in any algorithm. Both SP A and GP select at least one column in indices one through four. Columns 41 through 64 hav e the highest den- sit y of extreme columns for all algorithms. Although the extreme columns are different for the algorithms, the coef- ficien t matrix H exhibits remark ably similar characteristics in all cases. Figure 9 visualizes the matrix H for each al- gorithm. Each non-ext reme column is expressed as a conic com bination of only tw o extreme columns. In general, the t wo extreme columns corresponding to column i are j 1 = arg max { j ∈ K| j < i } , j 2 = arg min { j ∈ K| j > i } . In other words, a non-extreme column is a conic com bination of the t w o extreme columns that “sandwic h” it in the data 0 1 0 2 0 3 0 4 0 5 0 6 0 7 0 S e p a r a t i o n r a n k ( r ) 0 . 0 0 0 . 0 5 0 . 1 0 0 . 1 5 0 . 2 0 0 . 2 5 0 . 3 0 R e l a t i v e e r r o r S P A X R A Y G P Figure 7: Relativ e error in the separable factor- ization as a function of nonnegativ e rank ( r ) for the heat transfer simulation data. Because of our di- mension reduction tec hnique, we can quickly com- pute the residuals and c ho ose a v alue of r that mak es sense for the data. In this case, w e c ho ose r = 10 , as there is an “elbow” in the GP curv e there. matrix. F urthermore, when the index i is closer to j 1 , the coefficient for j 1 is larger and the co efficien t for j 2 is smaller. This phenomenon is illustrated in Figure 10. 5.2 Flow cytometry The flo w cytometry (FC) data represents abundances of fluorescen t molecules labeling antibo dies that bind to spe- cific targets on the surface of bloo d cells. The phenotype and function of individual cells can b e iden tified by decod- ing these lab el com binations. The analyzed data set con- tains measuremen ts of 40,000 single cells. The measuremen t fluorescence intensit y con v eying the abundance information w ere collected at five differen t bands corresp ondin g to the FITC, PE, ECD, PC5, and PC7 fluorescent lab els tagging 0 1 0 2 0 3 0 4 0 5 0 6 0 c o l u m n i n d e x 0 1 0 2 0 3 0 4 0 5 0 6 0 r o w i n d e x S P A 0 . 0 0 0 . 1 5 0 . 3 0 0 . 4 5 0 . 6 0 0 . 7 5 0 . 9 0 0 1 0 2 0 3 0 4 0 5 0 6 0 c o l u m n i n d e x 0 1 0 2 0 3 0 4 0 5 0 6 0 r o w i n d e x X R A Y 0 . 0 0 0 . 1 5 0 . 3 0 0 . 4 5 0 . 6 0 0 . 7 5 0 . 9 0 1 . 0 5 0 1 0 2 0 3 0 4 0 5 0 6 0 c o l u m n i n d e x 0 1 0 2 0 3 0 4 0 5 0 6 0 r o w i n d e x G P 0 . 0 0 0 . 1 5 0 . 3 0 0 . 4 5 0 . 6 0 0 . 7 5 0 . 9 0 Figure 9: Co efficien t matrix H for SP A, XRA Y, and GP for the heat transfer simulation data when r = 10 . In all cases, the non-extreme columns are conic com binations of t wo of the selected columns, i.e., eac h column in H has at most tw o non-zero v alues. Sp ecifically , the non-extreme columns are conic com binations of the t wo extreme columns that “sandwich” them in the matrix. See Figure 10 for a closer look at the co efficien ts. 0 1 0 2 0 3 0 4 0 5 0 6 0 7 0 c o l u m n i n d e x S e l e c t e d c o l u m n s S P A X R A Y G P Figure 8: First 10 extreme columns selected b y SP A, XRA Y, and GP for the heat transfer sim u- lation data. The separation rank r = 10 was cho- sen based on the residual curv es in Figure 7. F or the heat transfer simul ation data, the columns with larger indices are more extreme. How ev er, the al- gorithms still select different extreme columns. an tib odies against CD4, CD8, CD19, CD45, and CD3 epi- topes. The results are represented as the data matrix A of size 40 , 000 × 5. Our in terest in the presen ted analysis was to study pairwise interactions in the data (cell vs. cell, and mark er vs. marker). Thus, w e are interested in the matrix X = A ⊗ A , the Kroneck er pro duct of A with itself. Each ro w of X corresponds to a pair of c ells and eac h column to a pair of mark er abundance v alues. X has dimension 40 , 000 2 × 5 2 and o ccupies 345 GB on HDFS. Figure 11 shows the residuals for the three algorithms applied to the FC data for v arying v alues of the separa- tion rank. In con trast to the heat transfer sim ulation data, 0 5 1 0 1 5 2 0 2 5 3 0 3 5 C o l u m n i n d e x 0 . 0 0 . 2 0 . 4 0 . 6 0 . 8 1 . 0 C o e f f i c i e n t m a t r i x ( H ) v a l u e C o l u m n 1 C o l u m n 3 4 Figure 10: V alue of H matrix for columns 1 through 34 for the SP A algorithm on the heat transfer sim- ulation data matrix with separation rank r = 10 . Columns 1 and 34 w ere selected as extreme columns b y the algorithm, while columns 2 through 33 w ere not. The tw o curv es show the v alue of the matrix H in rows 1 and 34 for man y columns. F or these columns of H , the v alue is negligible for other ro ws. the relative errors are quite large for small r . In fact, SP A has large relativ e error un til nearly all columns are selected ( r = 22). Figure 12 sho ws the columns selected when r = 16. XRA Y and GP only disagree on one column. SP A c ho oses differen t columns, which is not surprising giv en the relative residual error. In terestingly , the columns in volvin g the sec- ond mark er defining the phenot ype (columns 2, 6, 7, 8, 9, 10, 12, 17, 22) are underrepresen ted in all the c hoices. This suggests that the informatio n provided by the second marker ma y b e redundan t. In biological terms, it may indicate that the phenoty p es of the individual cells can b e inferred from a smaller num b er of markers. Consequently , this op ens a p os- 0 5 1 0 1 5 2 0 2 5 S e p a r a t i o n r a n k ( r ) 0 . 0 0 . 2 0 . 4 0 . 6 0 . 8 1 . 0 R e l a t i v e e r r o r S P A X R A Y G P Figure 11: Relative error in the separable factor- ization as a function of nonnegativ e rank ( r ) for the flo w cytometry data. Our dimension reduction tec h- nique allows us to compute the errors quickly and c ho ose a v alue of r that mak es sense for the data. In this case, we choose r = 16 since the XRA Y GP curv e lev els for larger r . sibilit y that in mo dified experimental conditions, the FC re- searc hers may omit this particular label, and still b e able to reco ver the complete phenotypic information. Owing to the preliminary nature of these studies, a more in-depth analysis in volving multiple similar blo od sam ples would b e desirable in order to confirm this hypothesis. Finally , Figure 13 shows the coefficient matrix H . The coefficients are larger on the diagonal, which means that the non-extreme columns are composed of nearb y extreme columns in the matrix. 6. DISCUSSION W e ha ve shown ho w to efficiently compute nonnegativ e matrix factorizations for near-separable tall-and-skinny ma- trices. Our main tool was TSQR, and our algorithms only needed to read the data matrix once. By reducing the di- mension of the problem, w e can easily compute the efficacy of factorizations for sev eral v alues of the separation rank r . With these tools, we ha v e computed the largest separa- ble nonnegative matrix factorizations to date. F urthermore, our algorithms pro vide new insigh ts into massive scien tific data sets. The co efficien t matrix H exposed structure in the results of heat tra nsfer simulati ons. Extreme column selec- tion in flow cytometry show ed that one of the labels used in measuremen ts may b e redundant. In future work, we would lik e to analyze additional large-scale scientific data sets. W e also plan to test additional NMF al gorithms. The practical limits of our algorithm are imposed by the tall-and-skinn y requirement where we assume that it is easy to manipulate n × n matrices. The examples we explored used up to 200 columns and w e hav e explored regimes up to 5000 columns in prior work [12]. A rough rule of thum b is that our implemen tations should b e p ossible as long as 0 5 1 0 1 5 2 0 2 5 c o l u m n i n d e x S e l e c t e d c o l u m n s S P A X R A Y G P Figure 12: First 16 extreme columns selected by SP A, XRA Y, and GP for the flow cytometry data. The separation rank of 16 w as selected based on the residual curves in Figure 11. an n × n matrix fits in to main memory . This means that implemen tations based on our work will scale up to 30 , 000 columns on mac hines with more than 8 GB of memory; al- though at this p oin t communication begins to dominate. Solving these problems with more columns is a c hallenging opportunity for the future. 7. A CKNO WLEDGEMENTS Austin R. Benson is supp orted b y an Office of T echnol- ogy Licensing Stanford Gra duate F ello wship. Jason D. Lee is supported by an Office of T echnology Licensing Stan- ford Graduate F ellowship and a National Science F ounda- tion Graduate Research F ello wship. W e thank Anil Damle and Y uek ai Sun for helpful discussions. 8. REFERENCES [1] E. Agullo, C. Coti, J. Dongarra, T. Herault, and J. Langem. QR factorization of tall and skinny matrices in a grid computing environmen t. In Par al lel & Distribute d Pr oc essing (IPDPS), 2010 IEEE International Symp osium on , pages 1–11. IEEE, 2010. [2] M. Anderson, G. Ballard, J. Demmel, and K. Keutzer. Communica tion-av oiding QR decomp osition for gpus. In Par al lel & Distribute d Pro c essing Symp osium (IPDPS), 2011 IEEE International , pages 48–58. IEEE, 2011. [3] M. C. U. Ara ´ ujo, T. C. B. Saldanha, R. K. H. Galv˜ ao, T. Y oneyama, H. C. Chame, and V. Visani. The successive pro jections algorithm for v ariable selection in spectroscopic multicomponen t analysis. Chemometrics and Intel ligent L abor atory Systems , 57(2):65–73, 2001. [4] S. Arora, R. Ge, R. Kannan, and A. Moitra. Computing a nonnegativ e matrix factorization–prov ably . In Pr o c ee dings of the 44th symp osium on The ory of Computing , pages 145–162. ACM, 2012. [5] A. R. Benson, D. F. Gleich, and J. Demmel. Direct QR factorizations for tall-and-skinny matrices in MapReduce architecture s. In 2013 IEEE International Confer enc e on Big Data , pages 264–272, 2013. 0 5 1 0 1 5 2 0 c o l u m n i n d e x 0 5 1 0 1 5 2 0 r o w i n d e x S P A 0 . 0 0 . 2 0 . 4 0 . 6 0 . 8 1 . 0 1 . 2 1 . 4 1 . 6 1 . 8 0 5 1 0 1 5 2 0 c o l u m n i n d e x 0 5 1 0 1 5 2 0 r o w i n d e x X R A Y 0 . 0 0 0 . 1 5 0 . 3 0 0 . 4 5 0 . 6 0 0 . 7 5 0 . 9 0 0 5 1 0 1 5 2 0 c o l u m n i n d e x 0 5 1 0 1 5 2 0 r o w i n d e x G P 0 . 0 0 0 . 1 5 0 . 3 0 0 . 4 5 0 . 6 0 0 . 7 5 0 . 9 0 Figure 13: Co efficien t matrix H for SP A, XRA Y, and GP for the flo w cytometry data when r = 16 . The co efficien ts tend to b e clustered near the diagonal. This is remark ably differen t to the coefficients for the heat transfer sim ulation data in Figure 8. [6] J. M. Bioucas-Dias and A. Plaza. An ov erview on hyperspectral unmixing: geometrical, statistical, and sparse regression based approaches. In Geosc ienc e and R emote Sensing Sympo sium (IGARSS), 2011 IEEE International , pages 1135–1138. IEEE, 2011. [7] V. Bittorf, B. Rech t, C. Re, and J. A. T ropp. F actoring nonnegativ e matrices with linear programs. arXiv preprint arXiv:1206.1270 , 2012. [8] J. W. Boardman et al. Automating sp ectral unmixing of aviris data using conv ex geometry concepts. In Summaries 4th Annu. JPL A irb orne Geoscie nc e Workshop , volume 1, pages 11–14. JPL Publication 93–26, 1993. [9] T. F. Chan. An improv ed algorithm for computing the singular value decomp osition. ACM T rans. Math. Softw. , 8(1):72–83, Mar. 1982. [10] H. Cheng, Z. Gimbutas, P . Martinsson, and V. Rokhlin. On the compression of low rank matrices. SIAM Journal on Scientific Computing , 26(4):1389–1404, 2005. [11] A. Cichocki and R. Zdunek. Regularized alternating least squares algorithms for non-negative matrix/tensor factorization. In Advanc es in Neur al Networks–ISNN 2007 , pages 793–802. Springer, 2007. [12] P . G. Constantine and D. F. Gleich. T all and skinny QR factorizations in MapReduce architectures. In Pr o c ee dings of the se c ond internationa l workshop on MapR e duce and its applicatio ns , pages 43–50. ACM, 2011. [13] P . G. Constantine, D. F. Gleich, Y. Hou, and J. T empleton. Model reduction with mapreduce-enabled tall and skinny singular value decomp osition. arXiv pr eprint arXiv:1306.4690 , 2013. [14] A. Damle and Y. Sun. A randomized algorithm for separable non-negative matrix factorization. T echnical report, Stanford Universit y , 2014. [15] J. Demmel, L. Grigori, M. Ho emmen, and J. Langou. Communica tion-optimal parallel and sequential QR and LU factorizations. SIAM J. Sci. Comp. , 34, F eb. 2012. [16] D. Donoho and V. Sto dden. When do es non-negative matrix factorization give a correct decomp osition into parts? In Advanc es in neur al information pr o cessing systems , page None, 2003. [17] N. Gillis and R. Luce. Robust Near-Separable Nonnegative Matrix F actorization Using Linear Optimization. ArXiv e-prints , F eb. 2013. [18] N. Gillis and S. V av asis. F ast and robust recursive algorithms for separable nonnegative matrix factorization. Pattern Analysis and Machine Intel ligenc e, IEEE T r ansactions on , PP(99):1–1, 2013. [19] D. Guillamet and J. Vitri` a. Non-negative matrix factorization for face recognition. In T opics in Artificial Intel ligenc e , pages 336–344. Springer, 2002. [20] S. Jia and Y. Qian. Constrained nonnegative matrix factorization for hypersp ectral unmixing. Ge oscienc e and R emote Sensing, IEEE T r ansactions on , 47(1):161–173, 2009. [21] D. Kim, S. Sra, and I. S. Dhillon. F ast pro jection-based methods for the least squares nonnegative matrix approxim ation problem. Statistic al Analysis and Data Mining , 1(1):38–51, 2008. [22] J. Kim, Y. He, and H. Park. Algorithms for nonnegative matrix and tensor factorizations: A unified view based on block co ordinate descent framework. Journal of Glob al Optimization , pages 1–35, 2013. [23] W. Kim, B. Chen, J. Kim, Y. Pan, and H. Park. Sparse nonnegativ e matrix factorization for protein sequence motif discov ery . Exp ert Systems with Applic ations , 38(10):13198–13207, 2011. [24] D. Kuang, H. Park, and C. H. Ding. Symmetric nonnegativ e matrix factorization for graph clustering. In SDM , volume 12, pages 106–117, 2012. [25] A. Kumar, V. Sindhw ani, and P . Kambadur. F ast conical hull algorithms for near-separable non-negative matrix factorization. arXiv pr eprint arXiv:1210.1190 , 2012. [26] C. Liu, H.-c. Y ang, J. F an, L.-W. He, and Y.-M. W ang. Distributed nonnegative matrix factorization for web-scale dyadic data analysis on mapreduce. In Pr o c ee dings of the 19th international c onfer enc e on World wide web , pages 681–690. ACM, 2010. [27] D. Seung and L. Lee. Algorithms for non-negative matrix factorization. Advanc es in neur al information pr o cess ing systems , 13:556–562, 2001. [28] V arious. Hado op version 0.21. http://hadoop.apache.org , 2010. [29] S. V av asis. On the complexity of nonnegative matrix factorization. SIAM Journal on Optimization , 20(3):1364–1377, 2010. [30] M. Zaharia, M. Chowdh ury , T. Das, A. Dav e, J. Ma, M. McCauley , M. F ranklin, S. Shenker, and I. Stoica. Resilient distributed datasets: A fault-tolerant abstraction for in-memory cluster computing. In Pr o c ee dings of the 9th USENIX confer enc e on Networke d Sys tems Design and Implementation , pages 2–2. USENIX Asso ciation, 2012.
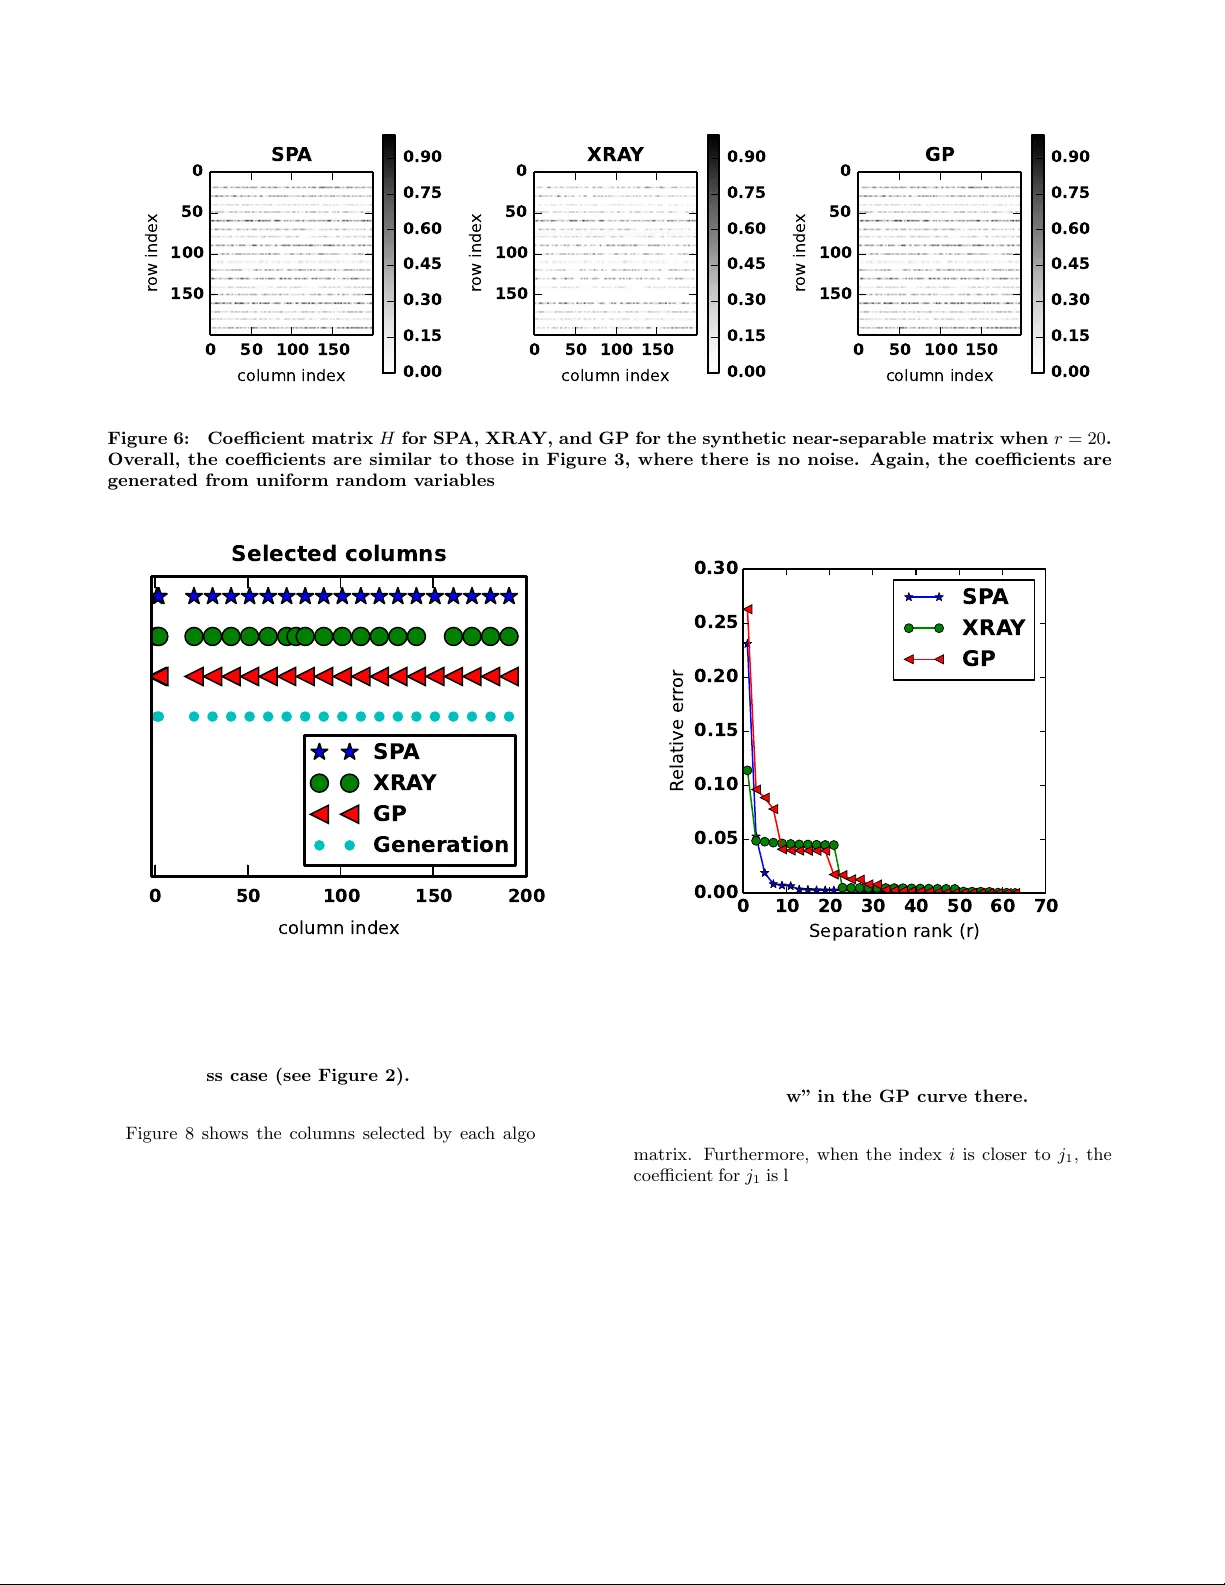
Original Paper
Loading high-quality paper...
Comments & Academic Discussion
Loading comments...
Leave a Comment