Dynamic Stacked Generalization for Node Classification on Networks
We propose a novel stacked generalization (stacking) method as a dynamic ensemble technique using a pool of heterogeneous classifiers for node label classification on networks. The proposed method assigns component models a set of functional coeffici…
Authors: Zhen Han, Alyson Wilson
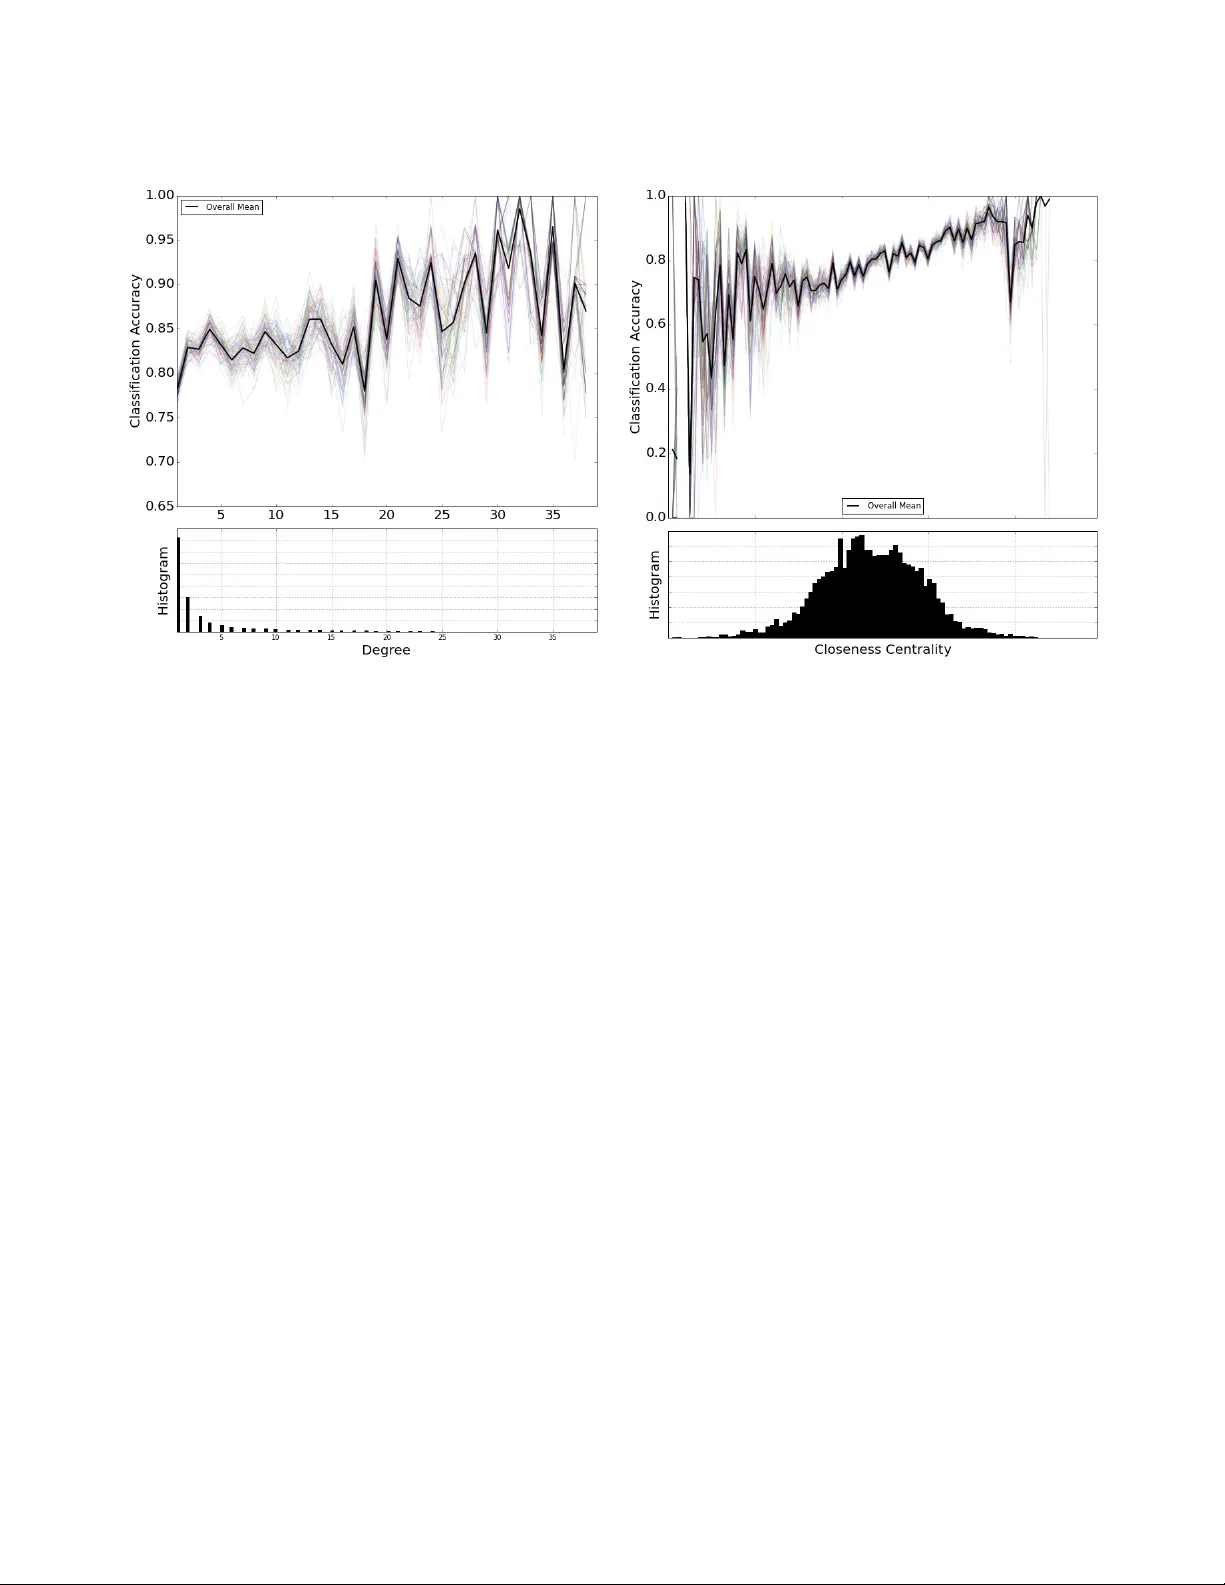
Dynamic Stacked Generalization for Node Classification on Netw orks Zhen Han ∗ Alyson W ilson † Abstract W e propose a nov el stacked generalization (stacking) method as a dynamic ensemble technique using a pool of heterogeneous classifiers for node label classification on networks. The proposed method assigns component models a set of functional coefficients, which can vary smoothly with certain topological features of a node. Compared to the traditional stacking model, the proposed method can dynamically adjust the weights of individual models as we move across the graph and pro vide a more versatile and significantly more accurate stacking model for label prediction on a network. W e demonstrate the benefits of the proposed model using both a simulation study and real data analysis. 1 Introduction Network data and its relational structure have garnered tremendous attention in recent years. A network is composed of nodes and edges, where nodes represent interacting units and edges represent their relationships [7]. Node classification or node labeling on a network is a problem where we observe labels on a subset of nodes and aim to predict the labels for the rest [1]. There are various kinds of labels; for example, demographic labels such as age, gender , location, or social interests; labels such as political parties, research interests, or research affiliations. Collectiv e inference estimates the labels of a set of related nodes simul- taneously gi v en a partially observed network by exploiting the relational auto-correlation of connected units [10], and it has been demonstrated effecti ve in reducing classification er- ror for many applications [3, 17, 11, 20]. Common collectiv e inference methods are the Iterative Classification Algorithm (ICA) [17], Gibbs Sampling (Gibbs), and Relaxation Label- ing (RL) [12, 14]. In man y cases, multiple types of relationships can be observed in the same network. For example, in a citation network, an edge can mean two papers have the same au- thor , or they are published in the same journal, or one paper cites another . W e may also observe additional node-le vel in- formation, such as the title and abstract of a paper , which can potentially help increase the label classification accu- racy . When multiple relations are present on a network, one can merge all the relations and sum the weights of common links to perform a typical collective classification [13]. An ∗ MaxPoint Interactiv e. † Department of Statistics, North Carolina State Univ ersity . alternativ e is to combine all of the information through an en- semble framework. Fürnkranz [6] introduced hyperlink en- sembles for classifying hypertext documents, where he sug- gests first predicting the label of each hyperlink attached to a document and then combining these indi vidual predictions using ensembles to mak e a final prediction for the label of the target document. A dif ferent approach was proposed by Heß and Kushmerick [9], where they suggest training sepa- rate classifiers for the local and relational attrib utes and then combining the local and relational classifiers through voting. A local classifier is trained using only node-lev el, or local, features; for example, title, abstract, or year of publication. A relational classifier infers a node’ s label by using relational features; for example, the labels of the connected neighbors. Cataltepe et al. discussed a similar ensemble approach [2], where they considered dif ferent voting methods, such as the weighted a verage, average, and maximum. Eldardiry and Neville [4] discussed an across-models collectiv e classifica- tion method that formed ensembles of the estimates from multiple classifiers using a voting idea similar to collecti ve inference to reduce variance. The abo v e literature focuses on combining multiple classifiers through some type of aggregation. Preisach and Schmidt-Thieme [18] proposed to use stacking instead of a simple voting as a more robust and po werful generaliz- ing method to combine predictions made by local and re- lational classifiers. They suggest training each classifier in- dependently and combining the predicted class probabilities from a pool of local and relational classifiers through stack- ing, which assigns constant weights to each classifier in a supervised fashion. Stacked generalization (stacking) [22] is a technique for combining multiple classifiers, each of which has been indi- vidually trained for a specific classification task, to achiev e greater overall predictiv e accuracy . The method first trains individual classifiers using cross-v alidation on the training data. The original training data is called lev el-0 data, and the learned models are called level-0 classifiers. The prediction outcomes from the lev el-0 models are pooled for the second- stage learning, where a meta-classifier is trained. The pooled classification outcomes are called lev el-1 data and the meta- classifier is called the lev el-1 generalizer . T ing and W itten [21] showed that for the task of classi- fication, the best practice is to use the predicted class proba- bilities generated by le vel-0 models to construct level-1 data. Essentially , stacking learns a meta-classifier that assigns a set of weights to the class predictions made by indi vidual classi- fiers. The traditional stacking model assumes the weight of each classifier is constant from instance to instance, which does not hold in general for many relational classifiers on a network. For example, the weighted-v ote relational neigh- bor (wvRN) classifier [13] infers a node’ s label by taking a weighted av erage of the class membership probabilities of its neighbors. One expects that its performance might be depen- dent on a node’ s topological characteristics in the graph; for example, the number of connected neighbors. On the other hand, local classifiers that are trained using only a node’ s lo- cal attributes are less dependent on its topological features. Consequently , when we combine local and relational classi- fiers, it is beneficial to ha ve a set of weight functions instead of constant weights for each classifier . There has been some previous w ork on dynamically ensemble local and relational models [16, 23]. Ho we ver , they impose parametric models on the weight functions that are not flexible to capture com- plex weighting functions. In this paper , we de velop a dynamic stacking frame work using a generalized varying coefficient model, which allows the weights for each classifier to vary smoothly with a node’ s topological characteristics in a non-parametric way . W e illustrate the benefits of incorporating a node’ s topological features into stacking. T o the best of our knowledge, this is the first work that considers non-parametric functional weight stacking. 2 Background and Moti vation Network data can be represented by a graph G = ( V , E , Y ) with vertices (nodes) V , edges (connections) E = { v 1 , v 2 } , v 1 , v 2 ∈ V , and labels Y . The graph G is parti- tioned into two sets of vertices, V train and V test , with V train ∪ V test = V and V train ∩ V test = ∅ . W e are giv en a classification problem with C classes. Class labels, y i , are observed for nodes in the training set v i ∈ V train , while the labels of the test set V test are unknown and need to be estimated. A rela- tional classifier uses the attributes and/or labels from a node’ s connected neighbors to make predictions. Ho wev er , unlike a typical classification problem, a node’ s neighbors may have missing attributes and/or labels, which in turn need to be es- timated. Collecti ve inference [11, 20] has been de veloped to make joint inference on the test nodes and produce consistent results. W e examinine the Cora [15] and the PubMed Diabetes [20] data sets, where we e v aluate the collecti v e classification accuracy on nodes with various topological characteristics. W e consider the wvRN classifier as the relational classifier [13], defined as follo ws, and the Iterati v e Classification Algorithm (ICA) [12, 14] for collective inference as defined in Algorithm 1. Algorithm 1 Iterativ e Classification Algorithm (ICA) 1: For v i ∈ V test , initialize the node labels, y i , with a dummy label null . 2: repeat 3: Generate a random sequence of nodes, O , in V test 4: for node v i ∈ O do 5: Apply the relational classifier model, using only non- null labels from N i , the neighborhood of v i , and output an estimated class membership proba- bility vector . W e ignore nodes that have not been classified, so if all labels in N i are null , we assign the label null to v i . 6: Assign the label, c , with the largest class member- ship probability to v i . 7: end for 8: until class assignments for V test stop changing or a maximum number of iterations is reached. D E FI N I T I O N 2 . 1 . For a giv en node v i ∈ V test , the wvRN classifier estimates the class probability P ( y i | N i ) by the weighted average of the class membership probabilities in the neighborhood of v i , N i : (2.1) P ( y i = c | N i ) = 1 Z X v j ∈ N i w i,j P ( y j = c | N j ) , where Z is a normalizing constant and w i,j is the weight associated with the edge between v i and v j . Macskassy and Provost showed that the weighted-vote rela- tional neighbor classifier is equi valent to the Gaussian-field model [14]. The Cora data set is a public academic database com- posed of papers from Computer Science. It contains a ci- tation graph with attributes/labels of each paper (including authors, title, abstract, book title, and topic labels). W e only consider the topics of each paper as its label and ignore the other attributes. W e remove papers with no topic labels and construct the data set by keeping the largest connected com- ponent in the network. The final data set is an unweighed and non-directional network, with 19,355 nodes and 58,494 edges. Labels are 70 topic categories, and each paper is clas- sified into one of the categories. W e randomly sample 80% of nodes from V into V test and set their labels to null . W e then make predictions us- ing ICA on the nodes in V test and calculate the classification accuracy for dif ferent le vels of degrees and closeness cen- trality . W e repeat this experiment 100 times and the results are displayed in Figures (1) and (2). In Figure (1), the classi- fication accuracy of the wvRN classifier is dependent on the degree of v i . As the count of a node’ s neighbor increases from 1 to 10, the av erage classification accurac y jumps from 45% to more than 60%. There are a limited number of nodes with degrees greater than 10, and thus the variance of the av erage classification accurac y goes up considerably . Close- ness centrality is defined as the reciprocal of a node’ s total distance from all other nodes, which relates to the idea of “being in the middle of things. ” Unlike de gree, closeness centrality is a continuous v ariable. W e binned its range into 100 equal-length interv als and calculated classification ac- curacy in each bin. From Figure (2), we observe a steady upward trend in the classification accuracy near the center of the spectrum. There are not many nodes near the two ends of the spectrum, and this contributes to the large v ariation in the classification accuracy . Figure 1: Classification accuracy for the relational classifier at different le vels of node degree in the Cora data set. W e performed the same analysis on the Pubmed Dia- betes data set. The Pubmed data set is a medical database composed of diabetes-related medical papers deri ved from the PubMed database. The graph is a citation network with 19,717 papers and 44,338 edges. Each publication is as- signed one of three categories as its label and a TF/IDF weighted word vector as an extra attribute. Here we ignore the extra attributes and only consider the topic category la- bels. W e observe results similar to those from the Cora data set in Figures (3) and (4). 3 Dynamic Stacking Model Figure 2: Classification accuracy for the relational classifier at different lev els of node closeness centrality in the Cora data set. 3.1 Notation for the Stacked Generalization Model Stacked generalization (stacking) is a general method for combining multiple lower -le vel models to improve overall predictiv e accuracy [22, 21]. Here we follow the notation in [21]. Gi ven data D = { ( y i , x i ) for i = 1 , · · · , N } , let x i be the feature vector and y i the label of the i -th observation. Here we focus on categorical responses for y , and assume y has C categories. W e first randomly partition the data into J roughly equal-sized parts D 1 , D 2 , · · · , D J . Define D j and D − j = D − D j to be the test and training data sets for the j -th fold of a J -fold cross validation. Suppose we hav e K classifiers. W e train each of the K classifiers using the training set D − j with results M k . M 1 , · · · , M K are called level-0 models . W e then apply the K classifiers on the test set D j and denote z ik = M k ( x i ) , x i ∈ D j as the estimated class probability vector from M k for x i ∈ D j . W e repeat this process for j = 1 , · · · , J and collect the outputs from the K models to form the level-1 data as follo ws: (3.2) D lev el 1 = { ( y i , z i 1 , · · · , z iK ) , for i = 1 · · · , N } . z ik is the predicted class probability vector from M K for observation i , and therefore P c z ikc = 1 . W e drop the last element z ikC from vector z ik to avoid multicollinearity issues. W e then fit a supervised classification model, ˜ M , using the level-1 data, which is called the level-1 generalizer . Figure 3: Classification accuracy for the relational classifier at different le vels of node degree in the PubMed data set. For prediction, a new observation x new is input into the K lo w-le vel classifiers, M 1 , · · · , M K . The estimated class probability vectors, z 1 , · · · , z K , are then concatenated and input into ˜ M , which outputs the final class estimate for that observation. For classification on networks, Preisach and Schmidt- Thieme [18] adapted the stacking technique and combined a local classifier with a relational classifier using a logistic regression model as the level-1 generalizer . Howe ver , in their paper , the coef ficients in the logistic regression are constant, meaning the weights of individual component classifier are “static” from node to node. From previous observations in Figures (1), (2), (3), and (4), the accuracy of a relational classifier is often dependent on some topological feature of a node. Therefore, it could be beneficial to “dynamically” allocate the weights of indi vidual classifiers based on some other variable. W e discuss a dynamic stacking model using a generalized varying coef ficient model in the next section to account for this observation. Compared with competing methods that also consider dynamic stacking [16, 23], the proposed model is non-parametric, more flexible, and can learn more complex weighting functions. 3.2 Generalized V arying Coefficient Model through Smoothing Splines Here we develop a dynamic stacking model using a generalized varying coefficient model. Instead of having a set of constant coefficients in the regression, we Figure 4: Classification accuracy for the relational classifier at different levels of node closeness centrality in the PubMed data set. allow the coefficients to vary as smooth functions of other variables. The generalized varying-coef ficient model was proposed by Hastie and Tibshirani [8] and was revie wed in [5]. Similar to traditional stacked generalization, the inputs for the dynamic stacking model are the assembled outputs from multiple lev el-1 classifiers, along with an extra covari- ate: { ( y i , Z i , u i ) , for i = 1 , · · · , N } . y i is the true class la- bel of an observation, Z i is the concatenated predicted class membership vector from a pool of inhomogeneous classifiers with dimension p . Each of the component classifiers could potentially look at a different set of features of an instance and make a prediction from its point of vie w . u i is an “e xtra” cov ariate of a observ ation, which presumably would affect the prediction accuracy made by at least one classifier . Here we focus on the case where y i is binary and u i is continuous. One can easily extend this method to multi-class classifica- tion problems by using a one-vs-all strategy . The regression function is modeled as: g ( m ( U i , Z i )) = β 0 + Z T i β ( U i ) (3.3) = β 0 + p X j =1 Z ij β j ( U i ) where g ( · ) is the logit link function, β ( · ) is the functional coefficient vector that varies smoothly with an extra scalar cov ariate, and β 0 is a constant intercept. Instead of a constant intercept, one can trivially add a functional intercept by appending 1 to Z i . Ho we ver , in this paper , we focus on the constant intercept case. W e assume that each functional coefficient β j ( · ) for j = 1 , · · · , p can be approximated by spline functions: β j ( · ) = K j X k =1 η j k B j k ( · ) , for j = 1 , · · · , p, (3.4) where for each β j , B j k ( · ) for k = 1 , · · · , K j is a set of spline basis functions. Without loss of generality , we use the same set of B-spline basis functions for all β 1 ( · ) , · · · , β p ( · ) . Henceforth, we denote the set of B-spline basis functions as B 1 ( · ) , · · · , B K ( · ) , where K is the number of basis func- tions. W e can then rewrite equation (3.4) as: β j ( · ) = K X k =1 η j k B k ( · ) for j = 1 , · · · , p. (3.5) W e substitute equation (3.5) into equation (3.3) and rewrite the regression function as g ( m ( U i , Z i )) = β 0 + p X j =1 K X k =1 Z ij η j k B k ( U i ) (3.6) = β 0 + Z T i B ( U i ) η , Denote B ∗ ( U ) = ( B 1 ( U ) , · · · , B K ( U )) 1 × K . W e can express B ( U ) as: B ( U ) = B ∗ ( U ) . . . 0 . . . . . . . . . 0 · · · B ∗ ( U ) p × pK and express η as: η = η 11 . . . η pK pK . W e can estimate β 0 , β 1 ( · ) , · · · , β p ( · ) by directly mini- mizing: ˆ β 0 , ˆ β 1 ( · ) , · · · , ˆ β p ( · ) = arg min β 0 ,β 1 ( · ) , ··· ,β p ( · ) (3.7) − N X i =1 ` ( β 0 + p X j =1 Z ij β j ( U i ) , y i ) + λ p X j =1 Z ( β 00 j ( x )) 2 dx where ` ( g ( m ( U i , Z i )) , y i ) is the log-likelihood function of the logistic regression, λ P p j =1 R ( β 00 j ( x )) 2 dx is a smooth- ness penalty term that controls the total curvature of the fit- ted β j ( · ) for j = 1 , · · · , p , and λ is a a smoothing parameter that controls the trade-off between model fit and the rough- ness of the fitted β j ( · ) s. When λ → 0 , we ha ve a set of wiggly β j ( · ) s; as λ → ∞ , the minimization of (3.7) will produce a set of linear β j ( · ) s. For the constant intercept case, one can absorb β 0 into η as: η ∗ = β 0 η 11 . . . . η pK 1+ pK and append a constant 1 to the beginning of the product, Z T i B ( U i ) . W e can write the optimization in equation (3.7) w .r .t. η ∗ as: ˆ η ∗ = arg min η ∗ {− ` ( η ∗ ) + λ η ∗ T H η ∗ } , (3.8) where H is the assembled penalty matrix: H = 0 . . . . . . . . 0 . H 1 0 0 . . . . H j . . . 0 0 0 H p (1+ pK ) × (1+ pK ) H j is the smoothness penalty matrix for β j ( · ) , and { H j } mn = R B 00 m ( x ) B 00 n ( x ) dx for m, n = 1 , · · · , K . Since we are using the same set of basis functions, H 1 = · · · = H p . It can be sho wn that − ` ( η ∗ ) is con ve x w .r .t. η ∗ . Also, one can sho w that H is positi ve semi-definite, so λ η ∗ T H η ∗ is con ve x w .r .t. η ∗ as well. Therefore, there exists a unique ˆ η ∗ that optimizes equation (3.8). Giv en a specified smoothness penalty parameter λ , to estimate η ∗ , we employ an iterative Newton-type optimiza- tion method by directly calculating the deriv atives of the ob- jectiv e function in equation (3.8). The smoothness penalty parameter λ can be chosen by cross-validation, where, for a range of λ v alues, we iterati vely leav e out a subset of the training data, fit the model using the rest of the data, and compute the prediction error on the held out data set. The best λ is set to the one with the smallest objectiv e function value. 4 Simulation Study Here we compare the performance of the dynamic stacking method against standard benchmarks using simulated data sets. [18] used a standard logistic regression model as the lev el-1 generalizer to combine a local and a relational clas- sifier . [19] suggested that re gularization is necessary to re- duce ov er-fitting and increase predicti ve accuracy , and they considered lasso regression, ridge regression, and elastic net regression. In our simulation study , we use lasso regression, ridge regression, and logistic regression as benchmark lev el- 1 generalizers, and for each of the benchmark generalizers, we experiment with adding an additional cov ariate and/or in- teraction terms into the stacking, and compare their perfor- mance with the dynamic stacking model. For the simulation, N = 2000 observ ations are gen- erated for i = 1 , · · · , N . Z 1 i and Z 2 i are the predicted positiv e class probabilities from tw o classifiers, Z 1 and Z 2 , and they are generated independently from a uniform distribution on [0 , 1] . w i is the error term which follows a normal distribution, N (0 , 1) . u i is an extra covariate which may af fect the weight of a classifier , and it is generated from a uniform distribution on [0 , 1] . Finally , the response y i is generated from a Bernoulli distrib ution with p ( y i = 1) specified as one of the following three cases. In case 1, the classifier weights are not dependent on u , while case 2 has linear dependence, and case 3 has non-linear dependence. Case 1: logit ( p ( y i = 1)) = − 3 + 3 Z 1 i + 3 Z 2 i + w i Case 2: logit ( p ( y i = 1)) = − 3 + 3 u i Z 1 i + 3 Z 2 i + w i Case 3: logit ( p ( y i = 1)) = − 3 + 3 sin(6 u i ) Z 1 i + 3 Z 2 i + w i For training and e v aluation, the N observations are evenly split into training and testing sets. W e train the dynamic stacking model and benchmark methods using the training set, where the penalty parameters of the proposed method and benchmarks are selected by 10-fold cross-validation. The fitted models are then applied to predict on the test- ing set, and the final prediction accuracy on the test set is measured by the Area Under the Curve (A UC) from predic- tion scores as shown in T able (1). For methods 1 (Logistic 1 , Lasso 1 , and Ridge 1 ), the inputs to the le vel-1 generalizer are { ( y i , Z 1 i , Z 2 i ) } . For methods 2 , we add the additional co- variate u into the input: { ( y i , Z 1 i , Z 2 i , u i ) } . For methods 3 , in addition to u , we further add its interaction with Z 1 i , Z 2 i into the input: { ( y i , Z 1 i , Z 2 i , u i , Z 1 i u i , Z 2 i u i ) } . From T able (1), the dynamic stacking model performs no worse than the standard methods under all scenarios. It has better performance than the “static” stacking models when there is an underlying non-linear dependency between a classifier’ s performance and the extra cov ariate. In case 1, the dynamic stacking model generalizes to the traditional stacking models and does not ov er fit the data. In case 2, where a linear dependency exists, the proposed model generalizes to methods 3 , where interaction terms with the extra cov ariate are added into the “static” stacking model. In case 3, where a non-linear dependency exists, the dynamic stacking model outperforms all benchmarks. T able 1: A UC score comparison between the proposed method and benchmarks. For le vel-1 generalizers, methods 1 use Z 1 i and Z 2 i as co v ariates, methods 2 contains U i as an extra feature, and methods 3 further include linear interaction terms U i Z 1 i , and U i Z 2 i . The standard de viation of the accuracy score is calculated from 50 repetitions and is sho wn in parenthesis. M E T H O D S C A S E 1 C A S E 2 C A S E 3 R A N D O M G U E S S 0 . 4 9 ( 0 . 0 2 ) 0 . 5 0 ( 0 . 0 2 ) 0 . 5 1 ( 0 . 0 2 ) Z 1 O N LY 0 . 6 8 ( 0 . 0 2 ) 0 . 6 0 ( 0 . 0 2 ) 0 . 5 4 ( 0 . 0 2 ) Z 2 O N LY 0 . 6 8 ( 0 . 0 2 ) 0 . 6 8 ( 0 . 0 2 ) 0 . 6 7 ( 0 . 0 2 ) L O G I S T I C 1 0 . 7 5 ( 0 . 0 2 ) 0 . 7 1 ( 0 . 0 2 ) 0 . 6 7 ( 0 . 0 1 ) L A S S O 1 0 . 7 5 ( 0 . 0 2 ) 0 . 7 1 ( 0 . 0 2 ) 0 . 6 7 ( 0 . 0 1 ) R I D G E 1 0 . 7 5 ( 0 . 0 2 ) 0 . 7 1 ( 0 . 0 2 ) 0 . 6 7 ( 0 . 0 1 ) L O G I S T I C 2 0 . 7 5 ( 0 . 0 2 ) 0 . 7 3 ( 0 . 0 2 ) 0 . 7 5 ( 0 . 0 2 ) L A S S O 2 0 . 7 5 ( 0 . 0 2 ) 0 . 7 2 ( 0 . 0 2 ) 0 . 7 4 ( 0 . 0 2 ) R I D G E 2 0 . 7 5 ( 0 . 0 2 ) 0 . 7 2 ( 0 . 0 2 ) 0 . 7 4 ( 0 . 0 2 ) L O G I S T I C 3 0 . 7 5 ( 0 . 0 1 ) 0 . 7 3 ( 0 . 0 2 ) 0 . 7 6 ( 0 . 0 1 ) L A S S O 3 0 . 7 4 ( 0 . 0 2 ) 0 . 7 3 ( 0 . 0 2 ) 0 . 7 6 ( 0 . 0 1 ) R I D G E 3 0 . 7 4 ( 0 . 0 2 ) 0 . 7 3 ( 0 . 0 2 ) 0 . 7 6 ( 0 . 0 1 ) P R O P O S E D M E T H O D 0 . 7 5 ( 0 . 0 2 ) 0 . 7 3 ( 0 . 0 2 ) 0 . 7 9 ( 0 . 0 1 ) 5 Real Data Analysis Here we revisit the Cora data set [15], where we use paper titles as node attrib utes and topic classification as labels. W e remov e nodes with no title or topic classifications, and the final graph contains 11,187 nodes and 33,777 edges. Sev- enty topic categories are used as labels, and each paper be- longs to one of the cate gories. For simplicity , we conv ert the classification problem into a binary classification prob- lem by giving a positiv e label if the topic falls under the /Artificial_Intelligence/ category . W e then use the closeness centrality of each node in the graph as an addi- tional cov ariate in stacking. W e split all the nodes on the graph into a 20% training set and an 80% testing set. On the training set, we observe the titles and the topic classification label of each paper , while on the test set, we only observ e the titles. W e fit a local classifier using the word vector representation of its T able 2: Mean accuracy score on 100 randomized experiments using Cora and PubMed data set. Xiang McDo well Lasso Ridge Logistic Proposed Cora 0.917476 0.918087 0.917898 0.918106 0.918401 0.919270 PubMed 0.879380 0.879205 0.889090 0.889125 0.889213 0.891499 T able 3: Pairwise accuracy score comparison between the proposed method versus each competing method in 100 randomized experiments. The values sho wn are the mean accuracy difference between the proposed method and each method and the p-value for H 0 : the proposed method is less accurate than that benchmark method. Proposed vs Xiang vs McDo well vs Lasso vs Ridge vs Logistic Cora 0.1794 0.1183 0.1372 0.1164 0.0869 p <0.01 p <0.01 p <0.01 p <0.01 p <0.01 PubMed 1.2119 1.2294 0.2409 0.2374 0.2286 p <0.01 p <0.01 p <0.01 p <0.01 p <0.01 title only (Nai ve Bayes), and a relational classifier (ICA + wvRN) using only the labels from a paper’ s neighbor . W e then fit a dynamic stacking model using the output from the two classifiers with their coefficients being smooth functions of the closeness centrality of a node. The smoothness penalty parameter is chosen by 10-fold cross-validation. One set of fitted coefficient curves for the two classifiers are shown in Figure 5. It allocates a higher weight on the relational classifier when a node has a high closeness centrality value and relies on the local classifier for nodes with a small closeness centrality value. This mirrors our observ ations from the previous discussion. W e compared the dynamic stacking model with the tra- ditional stacking model on multiple standard lev el-1 gener- alizers (lasso, ridge, and logistic re gression), all of which ig- nore the closeness centrality of a node during stacking. The penalty parameters for lasso and ridge regression are chosen by 10-fold cross-validation. W e also implemented ensem- ble classification methods from [23, 16]. In [23], Xiang and Neville proposed a parametric weighting scheme to combine a local classifier and a relational classifier where model pa- rameters are chosen by cross-validation. In [16], outputs from local and relational classifier are combined thorough a concept of label regularization and the model they proposed has no additional parameters. W e repeat the train-test pro- cess 100 times randomly and record the accuracy score for each run. W e also performed model comparison using the PubMed data with the same general setup. Input to the lo- cal classifier is the TF/IDF representation of a paper , and we fit a dynamic stacking model using the output from the local classifier and the relational classifier with their coefficients being smooth functions of the degree centrality of a node. The classification accuracy comparison between the pro- posed method and the benchmarks is sho wn in T able (2) and Figure 5: One set of fitted coefficient curves. T able (3), where the accuracy is defined as P N i =1 I y i = ˆ y i / N where ˆ y i = I ˆ p i > 0 . 5 . By assuming the normality of the classification accuracy difference distribution, the dynamic stacking mode outper - forms all benchmarks at p-v alue < 0 . 01 . For the Cora data set, Figure 6 sho ws the source of the accurac y impro vement. For each of the 100 repetitions, we calculate the difference in the absolute number of correctly classified nodes at dif fer - ent closeness centrality lev els between the proposed model and benchmarks. The dynamic stacking model outperforms (a) (b) (c) (d) (e) (f) Figure 6: For each of the 100 repetitions, we calculate the difference in the number of correctly classified nodes at dif ferent closeness centrality levels between the dynamic stacking model and benchmarks. In (a) – (e), we calculate the group mean and a 95% confidence interval. (f) sho ws a density distribution of the closeness centrality for all nodes in the graph. the benchmarks near the two ends of the closeness centrality spectrum where the balance between the local and relational classifier shifts considerably . For the majority of nodes in this data set, their closeness centrality clusters tightly around a specific value, which lea ves little room for the dynamic stacking model to improve much beyond its static-weight counterparts in terms of the overall accuracy . Howe ver , for the nodes that are near the two e xtremes of the closeness centrality spectrum, we do see a significant improvement by using the dynamic stacking method. 6 Discussion In this paper , by examining two public data sets, Cora and PubMed, we illustrate the motiv ation for incorporating node topological characteristics into stacked generalization for node classification on networks. W e then de velop a nov el dy- namic stacking method with functional weights for compo- nent models, each of which can vary smoothly with an extra cov ariate. Simulation studies show that the proposed method generalizes well to the benchmarks when the data does not present complex patterns, and outperforms all benchmarks otherwise. Real data analysis using Cora and PubMed sho ws the proposed method has a small yet significant improve- ment on the classification accuracy compared with tradi- tional stacking models. Further analysis shows that most of the accuracy improvement comes from nodes near the two extremes of the closeness centrality spectrum where the balance between the local and relational classifier shifts the most. The limited number of nodes in that re gion explains the small improvement on the overall classification accurac y . Howe ver , for the nodes near the extremes of closeness cen- trality , we do see a considerable improv ement on the classifi- cation accuracy using the dynamic stacking method. Overall, the dynamic stacking model allows the composition of the stacking model to change as we mov e across the network, and thus it potentially provides a more versatile and accurate stacking model for label prediction on a network. 7 Future W ork The proposed dynamic stacking model is a direct exten- sion of the traditional stacking model, which uses logis- tic regression as le vel-1 generalizer . As discussed in [19], this model tends to o verfit, especially when combining a large pool of noisy classifiers. T o mitigate this problem, one can add a group-lasso penalty over the model coeffi- cients, η ∗ , into equation (3.8). Coefficients can be naturally grouped if they are the basis coefficients for the same β j ( · ) : {( η j 1 , · · · , η j K ) , for j = 1 , · · · , p } . By adding a group- lasso penalty , the dynamic stacking model is more robust to the noise in the lev el-1 generalizing process. 8 Acknowledgment This material is based upon w ork supported in part with funding from the Laboratory for Analytic Sciences (LAS). Any opinions, findings, conclusions, or recommendations expressed in this material are those of the author(s) and do not necessarily reflect the views of the LAS and/or an y agency or entity of the United States Go vernment. References [1] Smriti Bhagat, Graham Cormode, and S. Muthukrishnan. Node classification in social networks. CoRR , abs/1101.3291, 2011. [2] Zehra Cataltepe, Abdullah Sonmez, Kadriye Baglioglu, and A yse Erzan. Collecti v e classification using heterogeneous classifiers. In Petra Perner , editor , MLDM , volume 6871 of Lectur e Notes in Computer Science , pages 155–169. Springer , 2011. [3] Soumen Chakrabarti, Byron Dom, and Piotr Indyk. Enhanced hypertext categorization using hyperlinks. In Pr oceedings of the 1998 ACM SIGMOD International Confer ence on Management of Data , SIGMOD ’98, pages 307–318, Ne w Y ork, NY , USA, 1998. A CM. [4] Hoda Eldardiry and Jennifer Neville. Across-model collec- tiv e ensemble classification. In in AAAI , 2011. [5] J. F an and W . Zhang. Statistical methods with varying coefficient models. Statistics and its Interface , 1:179–195, 2008. [6] Johannes Fürnkranz. Hyperlink ensembles: A case study in hypertext classification. Information Fusion , 3:299–312, 2001. [7] Anna Goldenberg, Alice X. Zheng, Stephen E. Fienberg, and Edoardo M. Airoldi. A survey of statistical network models. F ound. T r ends Mach. Learn. , 2(2):129–233, February 2010. [8] T re vor Hastie and Robert T ibshirani. V arying-Coefficient Models (with discussion). J ournal of the Royal Statistical Society . Series B (Methodological) , 55(4):757–796, 1993. [9] Andreas Heß and Nick Kushmerick. Iterative ensemble classification for relational data: A case study of semantic web services. In In Pr oceedings of the 15th Eur opean Confer ence on Machine Learning . Springer , 2004. [10] David Jensen, J. Neville, and Jennifer Neville. Linkage and autocorrelation cause feature selection bias in relational learn- ing. In In Pr oceedings of the 19th International Conference on Machine Learning , pages 259–266. Morg an Kaufmann, 2002. [11] David Jensen, Jennifer Neville, and Brian Gallagher . Why collectiv e inference impro ves relational classification. In Pr oceedings of the T enth A CM SIGKDD International Con- fer ence on Knowledge Discovery and Data Mining, Seattle, W ashington, USA, A ugust 22-25, 2004 , pages 593–598, 2004. [12] Qing Lu and Lise Getoor . Link-based classification. In T om Fa wcett and Nina Mishra, editors, ICML , pages 496–503. AAAI Press, 2003. [13] Sofus A. Macskassy and Foster Provost. A simple relational classifier . In Proceedings of the Second W orkshop on Multi- Relational Data Mining (MRDM-2003) at KDD-2003 , pages 64–76, 2003. [14] Sofus A. Macskassy and F oster Provost. Classification in networked data: A toolkit and a uni variate case study . J. Mach. Learn. Res. , 8:935–983, May 2007. [15] Andre w K. McCallum, Kamal Nigam, Jason Rennie, and Kristie Seymore. Automating the construction of inter- net portals with machine learning. Information Retrieval , 3(2):127–163, 2000. [16] Luke McDo well and David W . Aha. Semi-supervised collec- tiv e classification via hybrid label regularization. In ICML . icml.cc / Omnipress, 2012. [17] J. Ne ville and D. Jensen. Iterati ve classification in relational data. pages 13–20. AAAI Press, 2000. [18] Christine Preisach and Lars Schmidt-Thieme. Ensembles of relational classifiers. Knowl. Inf . Syst. , 14(3):249–272, March 2008. [19] Sam Reid and Gre g Grudic. Regularized linear models in stacked generalization. In Multiple Classifier Systems , volume 5519 of Lectur e Notes in Computer Science , pages 112–121. Springer Berlin Heidelberg, 2009. [20] Prithviraj Sen, Galileo Mark Namata, Mustafa Bilgic, Lise Getoor , Brian Gallagher , and T ina Eliassi-Rad. Collectiv e classification in network data. AI Magazine , 29(3):93–106, 2008. [21] Kai Ming Ting and Ian H. W itten. Stacked generalization: when does it work? In in Procs. International Joint Confer- ence on Artificial Intelligence , pages 866–871. Morgan Kauf- mann, 1997. [22] David H. W olpert. Stacked generalization. Neural Networks , 5:241–259, 1992. [23] Rongjing Xiang and Jennifer Neville. Understanding propa- gation error and its effect on collectiv e classification. In 11th IEEE International Confer ence on Data Mining, ICDM 2011, V ancouver , BC, Canada, December 11-14, 2011 , pages 834– 843, 2011.
Original Paper
Loading high-quality paper...
Comments & Academic Discussion
Loading comments...
Leave a Comment