A new selection strategy for selective cluster ensemble based on Diversity and Independency
This research introduces a new strategy in cluster ensemble selection by using Independency and Diversity metrics. In recent years, Diversity and Quality, which are two metrics in evaluation procedure, have been used for selecting basic clustering re…
Authors: Muhammad Yousefnezhad, Ali Reihanian, Daoqiang Zhang
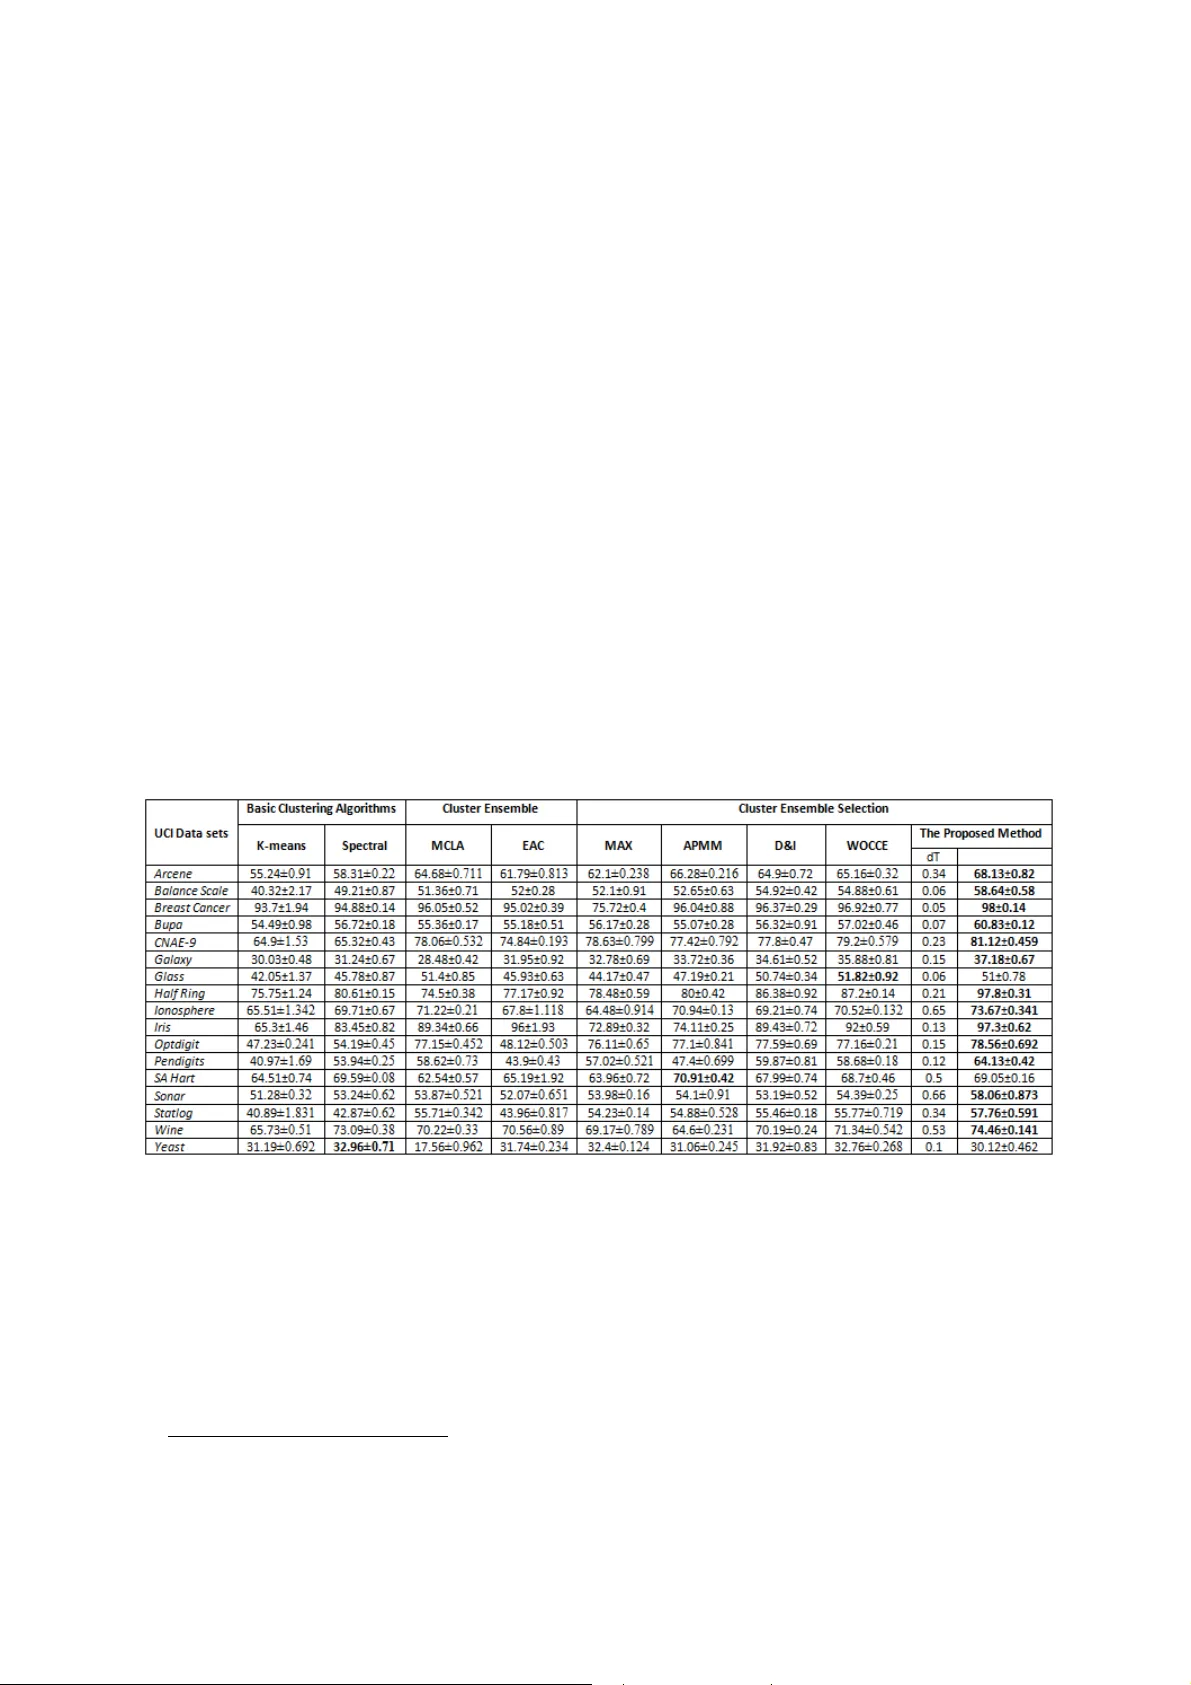
A new se lection st rategy for select ive clust er en sem bl e based on D iversity and Inde p ende n c y Muha m mad Yousefnezh a d a , Ali R e ihanian b , Daoq i ang Zhang a and Behr ouz Minaei- Bidgol i c a Department of C om puter Scie nce , N anji ng Un i versity o f A eronautics and Astro nautics, C h i na. b Depa rtment of Electric a l and Computer En g ineerin g , U n iversit y of Tabriz, Iran. c Depa rtme n t of C o mp u ter E ng i n eeri ng , I r a n U n iversit y o f Sc ie nce and Tec hno logy, I r a n . Abstra ct Th i s research intro d uc es a new st rategy in clu s ter ensemble se lec t i on b y using I ndep e ndency and Div ersi ty met r i cs. In rec ent ye ar s, Diversi ty and Q ual ity, whic h a r e two metri cs in evalua t ion p roc edure, have b een used for sele cting b asic clusterin g resul ts in t he cl u s t e r en s e mb l e s e lecti o n. Al t hough q ua l ity can improve t he final resul ts in clu s ter ensem b le , it cannot control the pr o cedures of g e nerat i ng bas ic result s , whi c h causes a g ap in p re d i ction of the g e nerat e d ba si c result s’ a ccu r ac y. Instead o f q uali t y , this pa per i n tro duces Independency as a supp lem enta ry method to b e used in conjuncti on w ith Dive rsity . Th e refore , thi s p ap e r uses a heuris t i c m etri c, whi ch is b ased on the p roce d u re of conve r ti ng c o de t o grap h in S o f tw are Testing, i n order to calc ulate th e I n dependenc y of two basic c l ustering alg o ri t hm s . Moreover, a new mode li ng languag e , w hich we call ed a s “Clu s t e ring Algorit h m s Independen cy Langu age” (CAI L), is i n tro d uce d in orde r to gener a te g r a ph s wh ich depict I n depe n denc y o f algorithm s . Als o , Uni f o rmi t y , w h i ch i s a n e w s i mi larity metri c, h as be e n introduced for evaluating t h e di v e rsity of b asic r e s u lts. As a crede ntia l , our exp er ime n tal results on v ari ed diffe rent stan dard da ta s e t s s h o w tha t the propo sed frame work improves th e accu ra cy of fi na l result s dramaticall y in comparison wi th other cl ust e r en s e m ble met h ods. Ke ywo rds : In d e p endenc y of algori t hm s , Di versi ty of p ri mary re sults, sele ctive cl us ter e n sem b l e, Alg orithm 's Graph . 1. Introduct i o n C l ustering , one of t h e main ta sks i n data min ing is t o discover m ean i ngful p atter n s in the non-labeled dat a s e t s (Fr e d a nd Louren ç o , 2 00 8 ; S tr e h l a nd G hosh, 2 0 02; Top chy et al., 20 03 ). G ener a l ly , bas ic cl u ste ri n g algori t hm s can not rec o gni z e accurate p att e rns in a co mplex data set because they op ti mize final cl u ste ri n g res u l ts accordi n g to their ob je ctive functions. In ot h er words, pa ttern s o f ea c h dat a s e t are recog n i z e d b y a sp ec ial perspectiv e , a c cording t o the a lg orithm' s ob je ctive func t io n instead of n atural rel a tion s betwee n data p o in t s in eac h data s e t (Jain et al. , 200 4). Combinin g the p ri mary c l ustering results w h i ch a re ge nerated b y bas ic c luster ing a l gorithms w ill cau se cl u ste r ensem b l e to achie v e better final result s . T here are two steps in clu s ter ensemble : i n t he first step, di fferent res u lt s a r e g e n e r ated from th e ba sic c lusteri ng methods by u si ng diff erent a lgo rithms and cha n ging the number of part i tions. In the sec o nd s tep, basic r esults (ensem b l e commi ttee) a re com b i n e d b y using an aggregati ng me cha ni sm whi ch le a ds to the gener a tio n o f t he final result (Al i z adeh et al., 2 01 1, 2 01 4; Ali z adeh et a l ., 2 01 2; Strehl an d Gh os h , 2 00 2). The se con d step is p erf o r med by con s ensus func t i ons . In t rod uced b y Fern a n d Lin , 2 00 8, sele c ti v e clu s ter ensemble is a new a pproa ch whi ch combines a sel ecte d gro up of best pri mary r esu l ts a cc o r d i ng to c o n sensus metr ic (s ) fro m ensem b le com mi t tee in order to improve t h e accuracy of f ina l result s . The sel ection strat egy a i ms to sele c t b etter pa r t it ions of en s e mb le com mi tt e e. In rec ent y ea r s, Diversi ty a nd Quality have been used to selec t the ba sic cl ust e r i ng r esults. A prop er sel ection strategy can refle ct t he i mplici t features of data sets, a n d t h e c l ustering p e rform a nce can be imp r o ve d (Ali z adeh et al., 2 01 1, 2 01 4; Ali z adeh e t al., 20 1 2; Fern an d Lin, 2 00 8 ; Jia et al., 2 01 2; Lim in and Xiaop i ng , 20 12 ). Q uality cannot control t he p roced u r e s of gener a ting b as i c results an d the predicti on of the sa me res u l ts' accur a cy. I n order to eva l u ate the ba sic resul ts a c cording to t he process of ba sic cl ustering alg o ri t hm s , Yo u s e f n ezhad (2 01 3) in t r o duc ed I ndep e n de ncy metri c in D&I 1 me tho d. With the same idea, Alizadeh et al., 20 15 introduce d a new me t hod wh ich is call ed WOC CE 2 in w h i ch the In dep end ency is used a s a cri t er ion t o map WOC 3 , a theory in social scie nce, t o Cluster Ensemble Sel ection. Al thou g h, the p er formances and processe s of D&I and WOCC E ar e the same (Al iza deh et a l ., 20 15 ; Yousef n e z had et al. , 2 013 ), Al izadeh et al., 20 15 use d the concepts of WOC for he uris t ic proving of each components i n D &I . In additi o n, th e y integr a ted the mai n a s s um p tions of D&I i nto a new metric w h i ch i s c a l led “ De centrali za tion”. I n the p r o c ess of D&I a nd WOC CE, two a l go r ithms whic h a r e o f two diff erent t y p es are considere d t o b e completel y independent, and the In dep end ency d e g r ee of two algori t hm s whic h are t he same t y pe is ca l cu la ted by a ra ndom values ma t ri x o f those algorithm s . For instance, t he random values of k-me an s are the ran dom v alues of cl u ste rs ’ cente r s in the first ite r ation of the algorithm (Al iza de h e t al., 2 01 5; Yousefn ez h a d e t a l ., 20 13 ). S i n c e the performance a nd m a ny conce p ts of D &I and W OC CE are t he same, o n ly D&I is used in t h is pa per. T his pa per propo ses a new method for c alculati ng I n dependency wh ich is b ased on the p rocedu re of convert ing code to grap h in “ So ftw a re T es t ing ” . In thi s method b oth the sa m e t y p e algorithm s an d the algori t hm s whi ch a re in diff erent types co u l d h ave t he Independen cy degree. Th e I n d ependency d e g r ee is a value b et we e n z e ro and one whic h show s the p roba bil ity of the generated result's accuracy b ased on analyzing the p roblem solvi n g p roce du r es o f the a l go r ithms. In additi on , a ne w m od e ling language named as CAI L 4 , is introduced in this p ap er wh ich n o r m alizes cluster ing a l g o r i th m s' co des a nd ps e u do codes. Moreover , this pa per p r o poses a new me t r ic bas e d on APMM 5 for eval u ati ng the divers ity of bas i c results. Als o , a new method for com b ing b asic results wh ich is ba sed on EAC 6 (Fred an d Ja i n, 20 05 ), w h i ch is call ed WE AC 7 , is intr o duced i n thi s p aper. The m ain c ont r ib uti o ns o f this p ap e r are: 1 . In this pa per, a n ew s trategy fo r ev a luating a nd sele cting the best b asi c results in Clus ter Ensemble S e lect ion is introduc ed. This new strategy is b ased o n the Ind e penden cy an d D iversi t y m etrics . 2 . Unli k e th e p re v i ous calcul a ti on of I ndepe n dency wh ich consid e r ed the two same type a l gori thms to b e c omplete ly independent, t hi s p aper introduces a n ew method for ca l culating t he real value of In d e p endenc y degre e b e t w een tw o same typ e algori thms. Also, this method c a n ca l c u lat e the In d e p endenc y d e gree betw e e n two differ ent typ e s of algor it h ms using t he p revi ous ca l culation of In d e p endenc y. 3 . F o r eva l uat i ng I ndep e n den cy metric , th i s p ape r introdu c e s a n e w mode ling l a ngua g e na me d a s C A I L w h i ch is designed for es t im at i ng Independency degree in Clusteri n g problems. 1 D ive r s ity and I ndep e ndenc y 2 Wisdom Of Cro wds Clust er Ensem b le 3 T he Wisdom o f Cr owd s 4 C l u s terin g Al g o rit h m s Independency La ngua g e 5 A l iza deh-Parvin-Mosh k i -Minae i 6 E vid ence A ccumul atio n Cl u s tering 7 Weight ed Evide n c e Accum ulati on Cluste ring 4 . T his p ap e r introduce s Un i formi ty whi ch is a gree d y me t ri c for eva l uat in g diver s it y o f two b asic results. T hi s metri c is b ased on APMM . 5 . T his pa per introduce s WE AC whic h is a new me t ho d for combini ng wei ght e d bas i c results ba sed on EAC. Whil e t hi s p ap er uses Independency degre e a s a w eight in WEAC for generating f i nal clus tering result , any other metric c an b e used as a w eight in WEAC for dif ferent c lusteri n g solutions i n futu r e wor k s. T he M ai n goa l s o f thi s pa per a re to improve the p er formance of D&I (Yousefnezhad, 2 01 3; Yousefne z had e t a l ., 2 01 3 ) , or WOCC E (Ali za deh et a l ., 2 01 5) b y p ropos i ng the new ca l culation of In dep end ency and Di versity me t ri cs; an d also to om it the thr e s h old ing p roce dures of Independency in the two mentione d methods (D&I & WOCCE). T his pa per is organized as f o ll ows . Secti o n 2 desc r i b e s p re vious works on s e lecti ve c luster ensemble. Section 3 p re s e n ts o ur p roposed method. In S ect ion 4 , our ex perim ental results on 1 7 dif ferent sca l ed sta nd a rd data sets are p resente d . Finally , c o ncl usions are give n in Secti on 5. 2. Bac kgr ound 2.1. Clust e ring analys i s T he major aim of data cl usteri n g i s t o find groups of pa tterns (cl ust e rs) i n such a w ay th at p atterns in one c lust e r can be more sim il a r to each other than to pa ttern s of oth e r cl ust e rs (Akba ri et a l. , 2 01 5). A cl u ste ri n g alg o r it h m deci des each inpu t da ta b e longs to w hich clu s ter (Bah r o l oloum et a l ., 2 01 5). Thus, Clusteri ng can b e consi d e red a s a powerf u l tool to r e v e a l an d visuali z e st ruc tu r e of data (I z aki a n et a l . , 20 15 ). Ba si c clusteri ng a lgori th m s opt im ize th e final cluster ing r e s u lt s a c cordin g to t hei r objecti v e functi o ns . In o t her w ords, pa tterns of each d ata set a r e recogni zed by a sp e cial p erspective a c cording to the ob je ctive fun c t i ons o f algorit h m s instead of natural rel a tions between d ata po i nts in each dat a set. Analy z i n g si milarit y an d p r o perti es of clu st e ring algori t h ms' ob j ective f u ncti ons is necessary for gener a tin g b e st result s in cluster ensemble s e lecti o n. Jain et a l ., 2 00 4 p roposed ta xonomy of cl us teri ng algori t hm s a ccord ing t o th e ir ob j ective functions. T h e y proved that the methods whi ch a re in a group (w ith the same objecti v e function) ha ve al most th e same p er formances on a part i cular data s e t . Moreover, many algorithm s can be found whi ch are devel op ed b ased on a s pecif ic algori t hm such as , a l gorithms w h i ch a re t he ex ten s io n of k-means (Ja i n, 2 0 10), or lin k ages (Go s e , 1 99 7). T hes e fa ct s moti vat e research ers to prop ose cluster ensemble m et ho d s. C l uster ens e mb l e p r o ved that b etter final r esul t s c a n be generated b y combinin g b asic results inste a d of onl y choosing t h e b est one. Generall y, a cl ust e r ensem b l e has two important step s (Jain et al., 1 99 9; Strehl and Ghosh , 20 0 2): 1. Generating di fferen t result s from p r imary cl us te r i ng metho ds using diffe rent algorithm s and changing t he numb e r of thei r part i tions. T his step i s c alled g e n e rat i ng diver sity o r v ari ety. 2. Combinin g the primary r esults an d generating the fin a l ensem b le . T hi s s t e p is p er forme d b y consensus f u n c t ions (aggregating m e chanism). It is clear that an ensemble w ith a set of i d e n t ical model s doesn't hav e any ad vantages. T hus, the aim i s to comb i ne mod e l s whi ch predict diff eren t outcom es. In order to a chi eve thi s goal, t her e a re four com po n ents to b e ch a nged w hich a re dat a set, clu steri ng a l gorithms , eva l u ation me t ri cs, and combine met h ods. A set of m od e ls can b e cre a ted fro m two app roaches: Choosing data repr e s e n t a tion, and Choosing c lusteri n g algor ithms or algori t h mi c p arameter s. S t r e h l a nd Gho s h, 20 0 2 prop o s e d the Mu tual Info rmation (MI ) f o r me a suri ng the c onsistency of dat a pa r titions; Fred and Jain, 20 05 propo sed Normali ze d Mutual I nform a tion (NMI) , whi ch is indep e n de nt of cl u ste r size. This me t ri c can b e u sed to eva l ua te cluster s and the p artiti o ns in many a pp l icat i ons. For instance, Zhong and Gho s h, 20 05 use d NMI for evaluating clu ste r s in docume n t cl ust e r i ng and K an dy las et a l ., 2 0 08 used it for comm unity knowl edge ana l ysis. Fern a nd Lin, 2 00 8 devel op ed a m e t h od w h i ch effe ctively us e s a sele ct i on of b asi c p artitions to pa rtic ipa te i n the ensem b l e, and c o ns e q uentl y in the final dec is i on. T hey also u sed the Sum NMI (SNMI ) and Pai r w ise NMI a s qua li ty and d i versity me t r ics bet w een part i tions, respective ly . Jia et a l. , 2 01 2 p r o posed S I M for diver sity measure ment whic h w orks ba sed on the NMI. Az i mi and Fern, 2 00 9 us e d clu s ter ensem b l e s e lecti o n to a void c o ns e n sus part i tions w h i ch are excessive ly dif ferent from t he b ase p artitio ns t h ey result from . They demo ns trated that t h e i r met h od can result in p artition s wi t h e n hanced SNMI. Limin and Xi a o p i ng, 2 012 used Compactness an d Sepa ration for choosing the ref erence part i tion in cluster ens e mb l e s e lecti on . T hey also used new div e rs ity a nd qua l ity m etri cs as a selec t i on st rategy . Al iza deh et al., 20 11 , 2 01 4 a n d Al iza deh et al., 2 01 2 exp lo red the disadva n tag e s of NMI a s a sym metri c criteri on. They used t he AP MM a nd MAX me trics to measure div ersity an d stab il ity, respectivel y, a nd suggest e d a new method for buildi ng a co- a ssoci a tion matri x from a subs e t of b ase cluster results. Th i s p ap e r introduces Uniform i t y f o r dive rsity me a surem ent, w h i ch work s b ased o n the A PM M m etri c. Algori thm's Indep e ndency degree in cl u s ter e n sem b le sel ection is i ntroduce d in (Ali z adeh et al., 20 1 5; Yousefne z had, 2 0 13 ; Y ousefne z had et al. , 20 13 ). In t heir method, the prim a ry cl us te ri n g a l go r ithms w ith diff erent typ e s a re consider ed to b e complete ly independent. F urtherm ore, the In d e p endenc y d e grees of cl u ste ri n g algorithm s with the sa m e types are cal culated b y “ BPI” functi o n. Also, Yousefnezhad et a l. , 20 13 a ch ieved final resul t by threshol d i ng on generated b asic result s . Algor ithm 1 show s B PI function’s ps e u do code ( Yousefnezhad, 201 3 ; Y ou sefnezhad et al. , 2 013 ). Algo rit hm 1 : Basic Primary I n depe n dency function (Yousef n e z had, 20 13 ; Y ou s efne z h a d et al. , 201 3 ) Fu nct ion BPI (C1 , C 2 , P1 , P 2) Return [Re sult] If C1 and C 2 ar e eq u al T h en Distan ce-Mat rix i s dis tance bet ween P1 and P2 Do u nti l Dista nc e-Mat rix is not nul l F ind mini mum c ell of Dista nce- Matrix Store ce ll in Tem p-Array Re move Row and C olu mn of f ound e d cell Cr eate new Dist ance - M at r i x End loop Return Result =Averag e of T e mp - A r r a y Else Return Result = 1 f or depicti ng t wo a lgorith ms a re independe n t End If End Function In Algorit h m 1 , C1 a nd C2 represent t h e t y p es o f cluster ing a lgo rithms . A c cording to A l gori thm 1, BP I returns “ Result = 1 ” when the algorithm s are of tw o d i ffere n t types. I n d eed, BPI consider s ea ch two diff erent type s of a l gorithms to b e ful l y i ndependent. Also in Algori t hm 1, P1 and P2 a r e b asic par am eters of the algorithm s such a s t he initi a l see d p oi nts i n k-me an s. Actuall y, an y random values or p arameters w h i ch can change the fi n al result in b asi c cluste r i ng algorithm s c a n be represented by P1 and P 2 (Yousef n e z had, 20 13; Yo u sef n e z had et a l ., 20 13 ). In t hi s pa per, tw o parts of t he a pp roach whic h is introdu ced b y Yousef n e z had et a l ., 2 01 3 , have b een im p roved . F i rst, in order to mode l a nd evaluate the Ind ep enden cy of clu s teri ng a lgori thms, a new techni q ue w hich is b ased on alg orit hms’ graph codes is presented. Second, the algorit h m s' Independency degre es are u s e d as wei ghts to eva l uat e di versity in the process of gene rating the final result . Afte r mo d if yi n g t h e s e tw o pa rts, the threshold ing for I ndep e n d ency m etric (Yo u sef n e z had, 2 013 ; Yo u sefne z had et a l ., 2 0 13) in the p roce s s of clu s ter ensemble select ion is omi t ted . A s a resul t , t her e wil l b e no init ial value fo r “ iT ” (inde p endenc y Threshold) pa r a me t e r as an input of t h e algor it h m whi ch wi ll be p roposed in the nex t sectio n. I n additi on, in this algorithm , the Independency de g r e e b etw een each t w o bas ic cl u ste ri n g algor ithms wi ll b e calcul at e d b y grap h-ba sed m odeli ng. 2.2 . G raph so f twa re tes t ing S o f t ware te s t i ng i s a n i mp ortant p art o f s oftw are d e v e lop m ent to w hich alm ost 60% of t h e t otal production cos t i s a ssi gned. “ Softw ar e m odeli ng” , o n e of the main tasks i n software testing, can b e im p le mented wi th the h e l p of syntax , input sp ace, logic, or grap h . A graph-b ased m odeli n g ca n p rovi de a grap hi ca l represe n tation of t h e source code, soft w are design, use ca s es, a nd etc. (Amm ann and O ffutt, 20 08 ). It can be a u sef u l me cha ni sm for evaluation of p roce d ure s in cluster ing a lg orithms. T his p aper intr o duce s C l ustering Al gori thms I nd e p ende ncy La nguage (CAI L) whi ch is a ne w m o de ling language for norm a li z i ng codes a nd p seu do codes in w hich the conce p ts of graph -based model ing a re used for calcu la ti ng t he degree of In d e p endency for b as i c clu s ter ing a l gorithms. Also, a new instructi on, w h i ch is ba sed on the requirem ents in Independency evaluation, i s p roposed for trans fo rmi ng CAI L codes into grap hs. 3. Pro po sed m ethod T his sec tion in t r o d uc es a supp le mentary me t h o d, using diver sity and Indep e ndency metri cs, for sele cting b e s t partitions in an ense mb l e c ommi t te e. Figure 1 ill ust rates our p r o posed f r am ework . Fig . 1 . T he f r amew ork o f the proposed m e t hod F i gure 1 s ho ws how a final resul t is gene rat ed i n our p ropo s ed m ethod. Generally , it can be said t h a t in the prop o sed method, a da ta set is divi ded i n to non-ali gn e d cl usters in 3 stages; in t he firs t stag e , a b asic cl u ste ri n g algor ithm g e n e r ates a result from t he dat a set. In t he sec o nd sta ge , th i s generated result is evaluated b y di v e rsity me t r ic a nd t he evaluated res u l t i s a dded to ensemble comm i t tee only i f it has a n acceptab l e divers ity degre e. Th e abo ve two sta ge s are repeat e d u nti l the num b er of ensemble comm ittee mem b e rs rea c h to enough amount. Th e n , the final r e s u lt is cre a t e d b y using t h e mem b e rs of ensemble com mi tt e e and their in dependence degre es. T he rest of t hi s s e ction is organized as foll o w s: Fir st, diversi ty metri c is introduced. After t hat, the conce p t of Independency in cluste r i ng alg o r it h ms is exp lai ned. Then, a new met h od for trans f ormi ng the cl u ste ri n g algorit h m 's code s a nd p seudo codes i n to grap hs is pr e s e nted. Next , CAIL code a naly zer, softw a re for automatical ly c o m p arin g the Independenc y of cl u ste ring algor ithms, is i nt r o d uced. After tha t, the p seudo code of our p ropos e d method is p re s e nted. F i n all y, the summ a ry of the p roposed method is giv e n . 3.1. Diver sity After generating indiv idual clusterin g r esults in Cluster E nsem b l e Select ion methods, a consensus functi o n must be used to evaluate them . NMI is used as the c o ns ensus functi o n by most o f the classical met h ods. Since NMI is a sym metric m ethod, Alizadeh et al., 20 11, 2 01 4 a nd Alizadeh et al. , 201 2 concl uded t he di s adva n tages of it an d t h e r efore, they p roposed AP MM an d MAX for solvi ng th e sym metry prob l em in t he NMI. T he AP MM is calcul a ted as foll ows (Ali zad e h et a l ., 2 01 1 , 2 014 ): kp i p i p i c c c c n n n n n n n n n P C AP MM 1 log log log 2 ) , ( (1) In Eq . 1, c n , p i n , and n are the size o f cluster C, th e size of t he i-th cluster of p artitio n P , and the number of samp l es whi ch a re a v a i lab le i n t he p artiti o n o f clu s ter C, respectiv e l y. k p is the numb e r of cl u ste rs in the part i tion P. As a matter of fact, the only diff erence betwee n NMI and APMM is that th e fi rst one (NMI) com p ares t w o pa rtiti ons w hile the sec ond one (APMM) compares a pa rtit ion wi t h a cl u ste r. T o calcu lat e the sim il a rity of p artiti o n P wi t h resp e ct to a pa rtit ion o f the refe rence set (ensemble com mi tt e e), this pa per u s e s AAPM M whic h i s calcu la ted as fol low s (Al izad e h et a l ., 2 01 1, 2 014 ): N i i P C APM M N P P AAPM M 1 * * ) , ( 1 ) , ( (2) In Eq . 2, P * is a p artiti on from re ferenc e s e t , C i is t he i- th cl uster of p artiti o n P, a nd N is the number of cl u ste rs in the pa r t it ion P. T his p ap e r p r o poses a redefi ned ver sion of APMM, because the o r iginal versio n only me as ure s t he div e rs ity b e t w een a cl u s t e r in the first pa rtit ion and a l l of clusters in the s e cond pa rti t i on (Al izadeh e t al., 20 14 ). T his redef ined metr ic whi ch i s c al led Unifo rmi ty is used for eva l uat i ng the diver s it y b etw een a pa r tition a nd a refe r e n c e set a s ensem ble comm ittee. I n o the r words, this metric i s u sed to s atisfy the Div ersi ty cr it e rion i n the propo s e d method. The U ni form it y i s define d as foll ow s : )) , ( ( max ) ( Uniformity 1 i n i P P AAPMM P (3) In Eq . 3 , P i is the i-th pa rtit ion in ensem ble com mittee. n is the num b e r o f me mb e rs in ref erence set. Uni f o r m ity rep r esents the max i mum v alu e o f simi larity betwee n p artiti on P a nd t he o t her p artitions of ensem b le com mittee . S i nce Uni formity is normal ized b etw een zero a nd one, w e consi d e r 1 – U ni for mity to represe n t the divers it y a s follow s: ) ( U ni f ormity 1 ) ( P P DI V (4) As m entione d b efore , o ne of the condi tio n s th at should be esta bli shed i n o r der t o a ppend a pa rti t i on to the en s e mble comm ittee (wh ich is know n as the di versity condi t i on) is as foll ows : dT P DIV ) ( (5 ) T his means tha t i f the diver s i ty of a generated p artiti o n satisfie s d T (diversi ty threshol d), it wil l b e added to the r efere nce set. 3.2. Indep endency B e fore this pap er st arts to ex plain t h e d e t ail s of I n d e pe ndency , tw o questions m ust b e answ ered: F i rst, it sho u l d be clear w hat the main g oal of usin g I ndep en d e n c y is. I n the p roposed me t hod, the corre ctness of the gener a ted indiv idual cl u ste r i ng resul t s can b e estim at ed b y I nd e p ende n c y. As a matter of fa ct , In dep end ency tr ie s to estimate the corre ctn e s s by comp ari ng the sim ilari t y of cl us t e r ing a lg orithms i n the process of solvi ng a clusteri ng p roble m. I n other wo rds , this p aper considers the correctne s s of two same (l o w -value in the diversit y est i mation) indiv idual cl u ste ring result s . T he indi vidual cluster ing results a re consi d e red to b e l o w , when they are generated by the cluster ing a l gori thms wi t h simi lar ob je ctive functi o ns ; on the ot he r hand, the corre ctness of two same i n di vidual cluster ing results are conside red to b e hig h , whe n they are generated by t w o cl u s tering a l g ori thms w ith d iff erent objecti v e functio n even i f those result s don ’ t have a signi ficant dive rsity . T hi s comparison is consider e d to b e rel ia ble for com p le x d ata sets, p ractical ly. I ndeed, i n real-w orld da ta s e ts , t h ere is no cl a ss-l a bel. T he re f ore, t hi s is one o f the b es t w a y s for estimati n g the co rrectne s s of t he gener a ted results, especiall y the sa m e ‘indi vidual cl usteri ng result s ’ (Fr ed and Lourenço, 2 00 8). T he second question is th at how this t e chniq ue c a n b e use d in softw a re such as SAS o r SPS S, in wh ich the code o f cl u steri ng algorithm s cannot b e fi nd ? For ea ch cl u ste ri n g algori thm, t h e p roces s o f so l ving p roblem is uni q ue. Th e refore, if the imple men tat i on s of a n algori t hm in tw o diffe r e n t progra m mi n g languag e s a re co n ver t e d a nd n orm ali z ed b as e d on the p ro po s ed met h od of thi s p ap er, t he results must be the same. Th e refore , each op en s ource codes o f that algori t hm can be used. F i gure 2 shows how a n a lgo rithm's graph a rray is gene r ated for eva l uat in g c lusteri n g a lgo rithm' s In dep end ency degre e. Acc ording to F i g ure 2 , it ca n b e said t hat a cl usteri ng a l gorithm' s code i s converted to graph arra y in 4 stages. First, Standard Cod e Ma pp in g T ab le (SCMT ) , whi ch is a consens u s table, is prep are d b y looking in a l go r ithms' codes . In other w ords, t h is ta ble contains ma t h e ma ti cal, sta ti st i cal, heuris t i c, a n d other k i nds o f functi ons w hich are us e d in the algorithm s . Al so , this tab l e, whi c h i s u ni q ue for each clusteri ng prob l em, contains a l l me n ti on e d functions whi ch a re used in t he b asic clusteri ng algori t hm s. After that, t he clusterin g al go r ithms’ codes a r e manu all y conve r te d to C AI L scripts with consi d e ring the SCM T t ab l e. T he n , the a l gorithms ’ grap hs ar e generated by using the CA I L codes wh ich are gener a ted i n the p revi ous st age. F i n all y, the wei ghted edges a re stored in an a r ray for evaluat i n g algori t hm 's Independency degre e. This arr a y is ca l led th e grap h's array. Fig . 2. The f ramework of th e cluste r ing algorithms' In d e p en d e n cy e valuation 3.2.1 . C lu s t e rin g Algo rit h m s I nde pendency L angua ge In CAIL mode ling, sym b ol s are us ed i n ste a d of ori g i nal codes or ps e u d o-c o des of c lust e ring algori t hm s. T he main reasons a re th at: firs t , Codes or ps e u do -codes are us u ally wr itten in a s tandard language structure , so they ne ed to be converted in a homo genous form i n orde r to b e c o m p ared wi th each other. What's mo re, the codes h ave many u sel ess details such a s d i ffere n t variab l es' defin itions. Also, many math e matical eq uations and pseudo cod e s , used in algori thms, are not cle a r in p ap e rs. T his pap er p r o poses a m odelin g m ethod w ith consi d e ring SCMT's sym b ol s . Thi s met h od is not sensiti ve t o imple mentation detail s . Th e p roc edu r e o f converting codes to CAIL format is p e r f o r med in fi v e stages. These sta ge s are li sted as f o l lows : 1 . F i rst, all additional codes suc h a s t he defin itions of differ ent v ariable s and constants , d e s c r i p ti ons, input a nd outp ut c o mmands, a nd ea c h code tha t is n ot involv ed i n the cl u ste r i ng p roce s s are omitte d . Also, t h e imple mentations of the sp ec ific f u nct i ons w h i ch are used in mai n function ar e omitte d . For examp l e, the im p l ementation of evaluation m etrics such as N MI, APMM and etc. ca n b e om itted becaus e they are s ho w n in the SCMT tab le as s y mb o ls. 2 . T he logical op er a tors i n conditi ons an d l o ops are re moved b ecause they do not a ffe ct the shap e of the algori th m 's grap h. 3 . All condi tions, such as if, case, a n d etc., are convert ed t o a unique for ma t such as “ i f, e l se, end”. Also, the loops like for, w hil e, repeat, an d etc., a re converte d to a uniq u e format such as “ w hile b r e ak end”. Inde ed, a l l formats o f conditi o n s a nd loo p s are used for q uic k l y im p le mentation of a l gorithms ' codes by p rogramm ers. T hey are not i mp ort a nt because algorithm s ' processes are im p lem ented in clusteri ng a lgori th m 's Inde p e ndency mode ling instead o f imple mentat i ons of indivi dua l codes. T hes e proces ses m ust aff ect the I ndependency . T hi s pap er uses “ if , e lse, end” f o r a l l for ms of conditions and “whil e, b reak, e nd” for a ll forms of loops. 4 . T he key word “ Begi n” is ad d e d at the b egi n ni ng a nd the key wor d “ End” is ad de d a t the end of a C A I L code for cl a ri ty of our defi nitions. 5 . Generat i ng SCMT tab l e. This consensus tab le c o ntains all mathematical , st atisti cal, h e u r istic and other func t i on s w hich a r e used in basic clu s teri ng algori th m s. In orde r t o name s y mbols in S CMT tab le, t hi s p ap er rec o m men d s the foll o w ing instructio ns: first, a l l func t io n s should be grouped a c cording to their types. Each group can be shown by a single Engli sh w ord. For inst an ce, th e R shows random function group , M shows mathematic a l functio n group and H show s heuris t ic function group. E ach function ca n b e shown b y the n am e of its group along wi th a number in a b r a cket ( s e e Ta ble 3 a s an ex ample o f the SCMT t ab l e). Algori thm 2 and Algorit h m 3 show tw o examples of CAIL scr ip ts for k - means and FCM algorithm s, respecti v e ly. T hes e a l g ori thms are g e n e r a ted ac c o r d i ng to the SCMT ta ble whi ch i s i llustrated in Ta ble 3 . Acc ording to these two a l gorithms, o ne of t he a d vantag e s of the CAIL code is tha t it d oe s not contain any im p le mentation details. Al s o, a nother adva ntage of usin g CAI L a nd SC MT is that the codes and p seu d o codes ca n be used togethe r f o r mo d e ling c lusteri n g algorithm s. Algorithm 2 : K - me a ns in the CAIL format B e g i n R(1 ) Wh il e F(1 ) M(1 ) End End Algorithm 3 : FCM in t h e CAI L f orma t B e g i n R(1) Whil e M (2) M (3) End End 3.2.2 . C onv erting CAI L to Independenc y Gr aph In d e p endenc y grap h is a sp eci al-purp ose ap p l icati o n g r a ph . I n ad d it i on, t he CAI L c o des model algori t hm s’ I ndependency to a sta ndard fo rma t . T hus, th i s pa per does not u se t h e same g r a ph - b as e d model structure, whi ch is used in softw are testing, for con v e rting CAI L to an a lg orithm’ s gra ph. Ho we ver, th i s pa per uses a custom format of grap h-b ased m odeli n g accordi ng t o the evaluation o f a lg orithms' In dep end ency requirem ents. In th i s met hod, the cod e co n j unctions, w h ic h are the “ Begin”, “ En d ”, condi t i ons, loop s a nd t he ir sub- sec to r s a re converted to nodes. T he codes b etwe en each two nodes are consi d e red as thei r edge. Like softw a re testi n g ap proaches, t hi s m et ho d uses dir ected graph for mo deli n g algori t hm s. In the gene rat ed graph s in software testing, codes o f ea c h s e g m ent are wri tt e n insi d e of its node. Also, t he logical op er a tio n of condition s o r loop s is usually wri tt e n on the edges. Unl ike s o f t ware testing, in our prop osed m ethod, the code s o f each segme n t are placed on the cor r e s pondin g edges. Th e mai n rea sons for t h is can b e menti o ne d a s fol lows ; first, the logic a l op e rat i ons a r e o m i t ted. T h e n , the evaluation p rocess is important i n t hi s method. After that , the CAIL code s a re pruned in the p revi ous sec t io n. These pruned codes use sta ndard codes accordin g to the SC MT ta ble. Fi nally , the proc e s s of each algori t hm c a n c learly b e vi sib l e in this s t a t u s. In our prop osed method, the codes on each edge are consi d e red as a non-num er i cal weig ht. An arra y of w eighted e d ge s , whi ch is calle d the I n de p endenc y graph ' s array, is used for storing the I n dependen c y grap h i n mem ory. Arrays are compa r ed in order to calcul a te the I ndependenc y degree of t he algorit h m s. Figure 3 and Figure 4 show t w o ex am p les o f CAIL code s and their converted grap h. Fig . 3. An ex ample o f a CAIL c od e Fig . 4. An e xample o f a CAIL code when it contains a lo o p a n d a conditio n when it c ont a ins two c onditi o ns 3.2.3 . Eva l uat i ng Indep endency Gra ph F i gure 5 show s the general structure of the Code Dependence Degr ee Mat r ix (CDDM) w hich is used for evaluat i ng the Ind e penden cy of two cl u ste r i ng algori t hm s . Fig. 5. The Co d e Dependenc e Degree M atri x (CD D M) Accor d i ng to Figure 5, ea c h cell of CDD M matri x is c a lc ulated by the “ Compare” fu n c t i on. Al g ori thm 4 gi ves the p se udo co d e of the “ Compare” fun c tion. As this fi g ure show s, this functio n com p ares the ce lls of In d e p endency gra ph arrays. T hi s figure show s h ow each cell of the fi rst a l gori t hm 's a rray com p ared w ith a ll cel ls o f the secon d algorit h m 's arr a y . In this functi on, the “ Count ” variab le i s i ncrem ented if it c an fi n d one same s y mbol in th e s e cond a l gori thm’ s a r ra y for each symbol in t he fi rst a lg orithm’ s a r ray. MSymbol repre sents the m a ximum number of sy mb ol s (blocks ) i n cell 1 and cel l 2 . Fo r instance, if cel l 1 contains 5 b l o c k s an d cel l 2 c onta ins 6 blocks, t he v alue of Max sy m wil l be 6 . Final re s u lt is norm a li z e d by di v i ding the “Co unt” b y M Sy mbol. Th e norm alized va l ue, whic h is cal led CDD, is stored in CDDM matri x cell w h i ch repre s e nts t he intersec t io n of two men t i oned cell s. T his functi on finds the max im um value of CDDM’s cel ls (the max i mum values of CDDs), w hic h i s call ed the Ma xCell i , and s t ore s them for cal c u lat in g the I ndepend e n c y d e g r e e o f a n alg orithm accordi ng to its corr esp onding C DD M matrix. After that, t hi s functi on remov e s the MaxC el l's row and col u m n in C D DM matrix. I n o t h e r wor d s, for ea c h block - each s y mb ol i n a ce ll is call e d a block - of the fi rst al gori thm, the most sim il a r block in the second algori t hm is found. F ro m the second algorithm 's b l o c ks , t he functi o n f inds t h e most sim ilar b l o c k to the next b loc k of the first algorithm by rem oving the row a nd column s o f this block (Max Cel l) from the CCDM matri x . Then, the functi on c alculates t he new Max Cell for new generated CDDM ma t r i x . Finall y, w hen t he s i ze of the CDDM matri x re a ches to zer o , this p roce ss is fini shed. Algorithm 4 : Co m p are Function Fu nct ion Com p are ( Ce ll1, Cel l2) Return [CDD] Count = 0 Wh i le w e h ave S y m b ol in Cell 1 Sy m1 = S e lect an S y mbol i n Cel l1 Foreach Sy m2 in Cel l2 If Sy m2 = Sy m1 is f ound Then Count++ Brea k End I f End Fo rea c h End w h i le MSy m b ol = Max- S y m ( Ce ll1, Cel l2 ) R e tu rn CDD = Count / MSy mbol End Function Eq . 6 s how s the Algori thms' In d e p endenc y Degre e (AI D) w hich is calcul at e d a t each s tep. In thi s equa ti on , n is t he mi n i mum number of c e lls i n t he fi rs t and s e con d a lgori th m 's a rray s, and m is the maximum number of ce lls in the f irst and second al go r ithm's arr ay s. n i i j i MaxCe l l m A A AID 1 1 1 ) lg , lg ( (6) T he calculated resul t s of Eq. 6 are stored in the Alg orithm In d e p endenc y Degree Ma tri x (AI DM) in order to be used i n clu ster e n s e m b l e selecti on. The size of AI DM matrix is n n in w h i ch n i s the number of alg o r it h ms in the cl u ste r en s e mb le . The Eq. 7 shows how the AI DM ce ll s are ca l culated. j i j i A A AID a j i ij 1 ) lg , lg ( (7) S i nce t hi s pa per uses B PI f u nct i on (Yousefnezhad, 20 13 ; Yous e fnezha d et a l. , 2 01 3) f o r calc u l a ti n g the I ndependency degree of a l g o ri t hm s wi th the s am e type, Eq. 7 assig ns “-1” to I n depe n dency degr ee of each algorithm in c o mpa ri s on w ith itsel f. The final I n dependency de g r e e is calcul at ed b y Eq . 8 dur ing the runni n g p roce s ses of alg o r ithms. j i k i BPI m j i A A AIDM A A AI m k i i j i 1 ] , [ 1 ] l g , lg [ ] lg , l g [ (8) In Eq . 8 , Alg i is a mem b er of the sel ected a l gorithms in ensemble comm ittee. m i s t he number of algori t hm s in the ensem b le com mittee whi ch are i n the same type of Algi or Algj. Fu r t herm ore, AI DM is calcu la ted by Eq. 7 ; and B PI is calcul a ted by the p seud o code whi ch is rep r esented in Al gorit h m 1 (The ba sic p arameter s Independency function). Fi g ure 6 i llu s trates an example of CDDM mat r ix for co mparing k-m eans ( K) and FCM ( F ) al gori thms, w hich are def ined b y CA I L s c ript i n Al gorithm 2 and Algori t hm 3. Furtherm o r e, the Ma xCell values a r e { Max Cell 1 =1, Max Cell 2 =0} , an d also A I [K ,F] = AI D[K, F ] = 0.5 (see Figur e 9). Fig. 6. The C DDM f or c o mparin g k- m eans and FC M bas ed on Alg orithm 2 and Algor i thm 3 3.3. Weig h ted Evidence A ccum ulati o n Cl ustering In order t o sel ect t he eva l uat e d indi v i dua l result s in cluster ensemble sele ct i on, thresholdi ng is used. Th e n, wit h u s ing the consensus fu ncti o n o n the sel ecte d re s ul t s, th e co-associatio n m a trix is ge n e rat ed. At last, b y app ly ing l inkage me t ho d s on the c o - a ssoci a ti o n m a tri x , the fi n al result is ge n e rat e d . T hese met h ods generate the Dendrogram. After t h a t , they cut the Dendrogram ba sed on the number o f cl us t e r s in the re s ul t (Al izadeh e t al ., 20 15 ; F re d and Jain, 20 0 5). I n recent y ea r s , Evidenc e Accum u l a ti o n Clusteri ng (EA C ) has b een u s e d in m an y researche s as a high perf ormance consensus functi on for com bining indivi dua l result s (Ali za de h et al., 20 1 1, 2 01 4; Alizadeh et a l ., 2 01 2; Ali z adeh et al., 2 0 15; Azim i and F ern , 2 0 09 ; Fern a nd Lin, 20 0 8; F r e d and Ja i n, 20 0 5). EAC div id e s t he number sha re d b y ob j ects over the number of p artiti o n s in w hich each sele cted p ai r o f ob j ects is si multaneously presented. EAC uses E q . 9 for generating t h e co- a ssoci a tion m at r ix . j i j i m n j i C , , ) , ( (9) In the ab o ve equat i on, m i,j is t h e number of partition s in whi ch thi s pa i r of objec t s (i and j) is sim u l tan e o u sly p r esented a nd n i,j represents the number of clu s ters shared b y objects wi th i nd i ces i and j . As a matter of fa ct , EAC conside rs that t he we ights o f a l l a l g ori thms’ result s are the sa m e. T his p ap e r prop oses Eq . 10 for g e n e rat i ng the co-association matrix w ith consideri ng the In dependency degre e of algori t hm s as a wei ght of co mbini n g the ba sic results. In this eq uation, AI i s calculated b y Eq. 8: j i n j i m A A AI j i C j i , , ] lg , lg [ ) , ( (10) F i gure 7 show s the proce s s of generating fi n al resul t by usin g WEA C. Fig. 7. The pr oc ess o f genera ti ng final result As Figure 7 d e p ict s , t h e p r o c e s s of g ener a t ing the AI DM m a tri x is done befo re runni n g t he algori t h m. In deed, it decreases the runti me o f the al g ori thm, whi ch wi ll be dis cus s e d later i n sect ion 4 . 2 . 3.4. Summ ar y o f th e Pr op osed Method Algori thm 5 dep ic ts t h e ps e u do code o f t he p roposed method. I n Algorithm 5 , Kb is the n um b er of cl u ste rs i n t he final result, an d dT i s the diversi ty t hre sho l d. T he d i st ance s a re a l so m easured b y a Eucli dean metri c. The Generate-Bas i c-Al g ori thm f u ncti on b uil ds the p arti t io n s of ba se cluste rs (b asic result s ) , G e nerate-AI -Matrix b uil ds the co-association matrix a c cording t o Eq. 9 b y using the AIDM matri x a nd the res u l ts o f BPI f u ncti on. T h e Average-Link a ge and Cluster f u nc t i ons build the final ensem b le accordi n g to the A ve rag e Linkage method. Th e p ara m eter Result is the final ensem b le result, and nCE is t h e num b er o f mem b er s in the ense mb l e com mittee . Algorithm 5 : T he Proposed Me t hod Fu nct ion CES (Datas et, Kb, dT) Ret urn [Resu lt, n CE] Ini tial ize nCE to z ero Wh i le w e h ave b a se cl uster [I DX, Basi c-Param e ter] = G enera te-B asic- A l gorithm (D at ase t, K b ) If (D iv ersit y (IDX) >dT ) th e n Find the Alg o ri thms AID f rom AI D M Inse r t idx, AI D, a nd Bas ic - Para met er to En s emb l e-Comm itte e nCE = nCE + 1 End if End w h i le AI = Gener ate-AI -Matrix (AI D M, BPI) W-Co-Ac c = W E AC ( E nse mb le -Commi tte e, AI) Z = Av erag e-Li nkage (W -Co-Acc ) Resul t = Cl u s ter (Z, Kb) End Function T he re a r e t hre e q uestions, whi ch must b e a n swere d b efore this p aper sta r t s to exp l a in the em p iri cal result s . First, “w h at i s the main goal of using Inde p endency e s ti mation?” . I n the prop osed met h od , In dep end ency tr ie s to estimate th e cor rectness of gen erated indi vidual cl u ster ing resul t s by compa r ing the sim ilari t y of clusteri ng a l gorithm s in the p roce s s of solvin g a clusterin g prob l e m . In other wo rds, this pa per consi d e rs t he corre ct ne ss of tw o same (lo w-value in the diver s i ty estim a tion) indi v i dua l clu st e ring result s to b e l o w when they a re ge n e r ated b y the cl u ste r i ng al go r ithms wi th si milar object ive f u n ction; and also, it consi d e rs t h e c o r rectness of two sa m e i n di vid u al cl u steri ng results to b e high w h e n they are gener a ted by two cl u steri ng a l go r ithms wi th diff erent o bject ive f unctions even if those results don’t h ave a si g ni fic a nt di ver s i ty. I n pra c tice , this comparison can be reli ab le for complex data s e t s. I ndeed, there is no class-l a bel i n r eal-worl d data sets; a nd this is one of the b est way s f o r e st i mating t he corre c t n e s s o f the gener a ted resul ts , especiall y the sa m e “ in dividual cl us t eri ng results” (Ali z adeh et al., 20 1 5). T he N e x t qu e s t ion to be answer ed is “ how can we u s e t hi s t e chnique in ap pli cations such as S AS or S PSS , whi c h do not h ave the code of clusteri ng algorithm s ?”. T he p r ocess of solvi n g p r o ble ms for each clu s teri ng algori t hm is unique. So, i f one a lgo rithm, w h i ch is im p l emented by two diff erent p r o g r am ming la ng u age or ev en t w o diffe rent structures of implem enta ti on , is converted and normali z e d b ased on the p roposed met h od, the resul t s must b e the sa m e. Furtherm ore, th e p ropos e d “ Compa r e” function can calcul a te the same resul ts f o r two dif fere n t structures of im p lem entat i on because it only uses the contents of cel ls. For instance, t he results a re the same w h e n you c ha nge the b l o c k s (“ THEN” and “ELSE” ) in the “ I F ” condi t i on. As a result, w e can use other op en source codes for t h ose a l gorit h m s f rom the I nternet. Th e last qu e s t ion to b e answ ered is that “ w hich l evel of ab straction must b e used for co nverting the codes to CAIL scri p ts?” . As w e can s e e in t he examp le s (Al gorithm 2 , Al gorithm 3 a nd Figure 8), the CAI L code s are gener a ted ba sed on gen eral st r u c t ure s of clusteri ng algori thms. We mo s tl y desi re t o compa r e t he ob j ect iv e functi o ns , distance m etrics, ge n e r al proce s ses of sol ving p roblem , and every thing whi ch ca n mathem a tic a l ly o r tec h nic a l ly change the p erform ance of clu s ter ing results. Indeed, it is importan t to use a unique s tructure (and a commo n SC MT tab le ) for all clu st e ring algorithm s in an indi v i dua l clu s teri ng prob l em, whi le a given algorit h m can b e implem ented i n dif fere nt ways . I n fact, we c an report the employ ed C A IL scr ip ts li k e ot h er p arame ters in the exp eri me n t , s uch as distance me t ri c, t y pes of bas ic cl u ste ri n g algor ithms, etc. 4. Exp erim ents T his s e c ti o n descri b es a ser ie s of e m p i ri ca l studi e s a n d reports th e ir resul t s. In real w o r ld, unsupe r v i sed methods a r e us e d t o find me a ni ngful p atterns in n o n-lab e led data sets such as w eb docume nts . Sinc e rea l data sets d on' t have cl a ss lab e ls, there is no dire ct ev a l u ati o n m ethod for evalu a ting the p er formance in u nsupervis ed methods. Like many previous researche s (Ali z adeh et a l ., 20 1 4; Ali z adeh e t al., 20 1 2; Al iza deh et a l ., 2 01 5; Fern a nd Lin, 20 0 8; F r ed an d J ain , 2 00 5; Yousefnezhad, 20 13 ; Yousef n e z had e t a l ., 2 01 3), this pa per c o m p ares the perfo rma nc e of its p roposed m eth o d wi th othe r ba sic a nd e n sem b l e m ethods b y usi n g standa r d dat a sets a nd thei r real classes. Although t h is evaluat i on cannot g u a rantee that t h e propos e d method leads to hi g h perform a nces in all da ta set s in compar i son w ith other methods, it can b e consi d e r e d as an exa m p l e to dem on s t r a te the superiori ty o f t he p ropos e d method. Table 1 L ist o f data s e ts a nd th e i r relat e d informati o n No. Name Feature Class Sample 1 Half R i n g 2 2 400 2 Ir i s 4 3 150 3 Bala n c e Sc al e 4 3 625 4 Brea st Cancer 9 2 683 5 Bu p a 6 2 345 6 Gala xy 4 7 323 7 Gl as s 9 6 214 8 I onosp her e 34 2 351 9 S A Heart 9 2 462 10 W ine 13 2 178 11 Yeas t 8 10 1484 12 P e ndigits 16 1 0 10992 13 Sta tlog 36 7 6435 14 Optdigit s 64 1 0 5620 15 Arc ene 10000 2 900 16 CN A E-9 857 9 1 0 80 17 So n a r 6 0 2 208 4.1. Data sets T he prop osed me t hod is app li e d to 1 7 d i ffere n t st andard UCI da ta sets. Lik e many ot h er pa pers a nd res e arc h e s s uc h as (Ali z adeh et al., 201 1 , 20 14; Alizadeh et a l ., 20 12 ; A l izadeh et al., 2 015 ; Yousef n e z had, 2 01 3; Yousefnezhad et al., 2 01 3), we h ave u s e d the stan d a rd da t a s e t s t o evaluate our nume rous exp e rime nt s. Th e s e standard data sets hav e no negative or po si t i ve effec t s on the performance of an algori t hm . As a matter of fact, the reason of using the s tandard dat a sets i s to conduct an evaluation w ith no art i fic ial n e g ati ve/po si tive bias and to c o m p are d if fere nt algori t hm s fai r l y. We h ave chosen data s e t s whi ch a r e as div er s e as p ossi b le in their n um b er s of t r u e classes, features, and sa m p le s, because thi s variety b e t ter vali d ates the o btained resul t s. These da ta sets ar e exp l a ine d in Ta ble 1. Mo r e information ab out th e s e da ta sets is ava i lab le in (Alizadeh et al., 20 1 5; Azimi a nd Fern, 20 09 ; Jain et al. , 20 0 4; New man et a l ., 1 99 8; Yousefnezhad, 2 01 3; Yousefnezha d et a l ., 20 13 ). T he feature s of the data sets are n o r m ali z ed to a mean o f 0 and variance o f 1, i.e. N (0 , 1 ). 4.2. CAIL co de a n a l y zer As me ntion ed ear l ier, this pap er devel o ps an app li cation for evaluating I ndep e n de n cy degree by using CAIL codes. Figure 8 sh o w s a snap s h o t o f this application. T h is tool is de velop e d b y M icrosoft C # .Net 2013. Fi rst, this app li cation converts C AI L co des to grap h s. Aft er t hat, the graph s' arrays are stored in the mem o ry. F in a lly, the arra y s a r e c ompared with each other, and the Independency degr e e is s how n in a me s s a ge b ox. T h is appli cat io n can work wi t h a ny S CM T table that is prepared in formats which are descr ibed in s e c tion 3.2.1. As it is cl ear i n Figure 8, two CAIL code s a re giv en a s inputs. I n this fig ure, Code 1 i mp l eme nts K - m ea n s w hile Code 2 im p l e me n ts Spectral clusterin g us in g a sparse simil ar i t y matri x . A lso , t he messag e bo x represe nt s t he I ndependency degr e e o f the two m ent io ned algorithms. Fig. 8. The CA IL c o de ana ly zer 4.3 . Per f o rm a nce A nalys is T his p ap e r u sed MAT LAB R2 01 4b ( 8.4) in order t o ge n e ra te exp er ime n tal r e s u lts. T he algori thms w hich are descri b ed i n T able 2 were use d to generate the e ns e mb le comm ittee . T able 2 The standar d code mapp i ng ta b le No. Algorit h m N a me ID 1 K -Mean s K 2 F u z zy C-Me ans F 3 Me dian K-F lat s M 4 Gau ssia n M ix t ure G 5 Subtrac t Clust ering SUB 6 Singl e-L inkage Eucli d e an SLE 7 Singl e-L inkage Hamm ing SLH 8 Singl e-L inkage Cosine SLC 9 Av er a ge-L inka g e Eucli dean ALE 10 Av er a ge-L inka g e Ha mmi n g ALH 11 Av er a ge-L inka g e Cosin e ALC 12 Co mplet e-L inkage Euc lidea n CL E 13 Co mplet e-L inkage H amm ing CLH 14 Co mplet e-L inkage Cos in e CL C 15 Wa rd-L inkage Eu c lidea n WL E 16 Wa rd-L inkage Hamm ing WL H 17 Wa rd-L inkage Cosine WL C 18 Sp e ctra l c lu s terin g usi ng a sparse si mila rity mat rix SPS 19 Sp e ctra l c lu s terin g usi ng N y str o m met ho d wit h o rthogona liza tion SPN 20 Sp e ctra l c lu s terin g usi ng N y str o m met ho d wit hout o rt hogo n aliz ati o n SPW T able 3 il lustrates the SCMT tab le whi ch is us e d i n this p ap er . Tab le 3 The s tandard c ode ma p p in g table Desc ription S y m b o l No. Ge n e rate x ra n d om numbe r R ( 1 ) 1 R a n d om Selecti on R ( 2 ) 2 Y = E u c lidianDi stance(A , B) M(1 ) 3 N i m ij N i i m ij j u x u c 1 1 M(2 ) 4 C k m k i j i ij c x c x u 1 1 2 1 M(3 ) 5 D o ex p functio n : )) 2 / ( 1 ( 2 2 A e S M(4 ) 6 D o laplaci an functio n : 2 1 2 1 D S D L M(5 ) 7 Large st magnit u d e M(6 ) 8 Small est mag n it u d e M(7 ) 9 Normali zing A a n d B M(8 ) 10 Y=Ham min g Dist an c e(A, B) M(9 ) 11 Y= C o s i nD i stance (A, B) M(10) 12 ) , ( m in ) , ( , b a d C C D j i c b c a j i SL M(11) 13 ) , ( max ) , ( , b a d C C D j i C b C a j i cl M(12) 14 j i n b n a j i j i A L b a d n n C C D , ) , ( 1 ) , ( M(13) 15 j i n b n a j i j i j i W L b a n n n n C C D , 2 ) , ( 2 ) , ( M(14) 16 ) ˆ , | ) ; ( ( ) ˆ , ( ) ( 0 ) ( j j z t E Q M(15) 17 ) , ( * * ) , ( min ar g ) , ( m m d m M(16) 18 Z=X/Y M(17) 19 2 1 ) ( x P P P xx P xx P P d i i T i T i T i i x M(18) 20 x P i i K i 1 * max arg M(19) 21 Assi gn each obje ct to close st centroid/ sub s pace F(1) 22 Ge n e rate ( t- n ear est- n eighbo r) sparse dis tance ma tr ix F(2) 23 Co n ve rt dis tance matri x to si m ila rity ma tr i x F(3) 24 Do orthogali zation F (4) 2 5 R e store cl u s ter labels in orginal order F(5) 26 Comp u te the p r oxi m i ty m atri x F(6) 27 Mer ge two c lo s e st c l uster F(7) 28 Y=S u bcl as s (X) F(8) 29 Up date * * * * * : i x i i i P dtd P P P F(9) 30 F i gure 9 shows AID M matri x ca l culated by t he S CMT t able, whic h is descr ibed in T ab le 3 , and the CAI L c o de analyzer . Fig. 9. The AI DM matrix In this pa rt, the resul t of the AI DM matrix i s anal yzed: T he result s of the linkage fami ly a l gor i thms ar e partici p ated i n t he fi na l res u l t b ased on their In de pendency d e g r ees . Ac cord in g to Figure 9 , the differ enc e s b etwe en the I n dependency de g rees of t he s e algorithm s a r e 0 .25 or 0 . 5. T h e di ff e rences are based on the p roble m solving mechanisms of t he algo r ithm s a nd t he di s tance me t rics. Also, k - mea ns is consi d e r ed indep e nd e n t w here th e linkages don't use the Eucli d e a n dista nc e metric. On the other h a nd, sinc e the spectral algori t h ms use k-means t o generate the final resu l t s after lap l a ci an t r an s f o rmati o n , the In dep end enc y de g rees of t h e spectral al gorithms t ow a rd k-means is considered s pecial. As mentioned earlier, th e results of th e p roposed me t ho d a r e compared w ith well- known b ase algori t hm s such as K - means a nd Sp e ct r a l , as w e l l as MCLA (St r ehl a nd G hosh, 2 002), EAC (Fred and Jain, 2 00 5 ), MAX (Ali z adeh et a l ., 2011) , AP M M (Al iza deh et a l ., 2 014; Ali z adeh et al., 2012 ), D&I (Yousef nezh ad et al., 2013) , a nd W OCCE (Ali z adeh et al., 2015 ) w h ic h are t h e sta te- o f -t he -a r t cluster ensem b le (selec t io n) methods. All of the s e algorithm s a r e i mp l e m ented in the MATLAB R2014b (8. 4 ) b y aut ho rs in order to gener a te exp e rime nta l resul t s. All res u l ts a re rep orted by averaging th e resul t of 10 ind e penden t runs of the al g ori thms w hich a re used in the exp er iment. I n t h is pap e r , dT is cho s e n such that each p ro posed a l gori thm rea ches to a runni n g tim e of app roxim at e l y 2 mi n on a P C w it h a certain sp e cific a ti on s 8 . T he experime nta l res u l ts a r e given in Table 4. The r e s u lts a r e in a form of a ccu ra cy (percen t age) ± standard devi a tion w h i ch i s achie v ed b a s e d o n the 10 time s run n ing of ea c h al g ori th m. The best resul t s o n e a c h d ata set are b olded . Table 4 The acc ur ac ies (i n perce n tage) a long w i th the stan d ard devi a ti ons ac h ie v e d in the experime n t s bas ed o n the 10 t im es r u nn i ng o f e a ch algorit h m . Accor d in g to Tab l e 4, although ba sic c lust e ring algori t hm s ha ve shown hi g h perfo rmance in some data sets, t hey cannot recognize t r u e p atterns in all o f th e m. As me n t ioned earlie r i n this pa per, in order t o solve the cl ust e ring prob l em, each b asic a l go r ithm co n si ders a sp ec ia l p er s pecti ve of a dat a set w h i ch is ba sed on i ts objec t i ve function. The achieve d results of b asic clu stering algori t h ms whi ch a r e d e p ict ed in Ta ble 4 are good evi dences f o r this cl a i m. Furtherm ore, the res ults generated b y MCLA and EAC show the ef fect of the aggregation m ethod on improving a cc u r a cy in t he f i nal r esults. Accor d in g to Ta ble 4 , WOCCE a nd the pr o p osed a lgori thm have gener a ted b etter r esults in com pa r ison wi th othe r b as i c and ens e mb l e algorithm s . Even t houg h the prop osed method was 8 App le Ma c Book Pro, CPU = I ntel Core i 7 ( 4 * 2.4 G Hz), RA M = 8GB, OS = OS X 10 . 1 0 outp e rformed by a numbe r of a l gorithms i n three data sets (Glass, S A Hart and Yaes t), the majori t y o f th e result s dem o nstrate t h e s u p er ior accuracy of t he p roposed me tho d i n c o mpa ri s on w ith o ther algori thms . To accurately cl arif y t he sup e ri o r ity of o ur p rop o s e d method in comparison w ith its p ower ful ensemble ri v als , the last row of T able 4 (Aver a ge) show s the average of a c curacy w hic h i s achi eved i n each method. In deed, a s a classic ensem ble m ethod, EAC doesn't hav e any e va lu at io n and sele ction in its p roc ess. Th is met h od cannot omi t err o r s whic h a r e made in t h e process of recognizi ng p atterns of the ba si c clu s teri ng result s b y using the corre ct inform at i on of other bas i c alg o r it h ms' res u lt s. The resul t s o f EAC w hich are giv e n in Tab l e 4 show the ef fects of eva l uat i on and sel ection in cluster ensem b l e sele c ti o n methods. 4.4. Par ameter Ana l y sis In t hi s sec t io n , the effect of dive rs i ty threshold on th e perform an c e and runtim e are a naly z e d . He re by , the main goal o f our exp e r i ment is to show the relation betwee n p e rformance and runtime in the propo sed met h od an d to ill ustrat e how the o ptim iz e d va l ues f o r the diver sity t hre s h old are d e t e rmi n e d . T hus, thi s pa per em p l o y s mul tiple da t a sets, tw o low dimen sional dat a sets (H a l f Ri ng, Iri s) as we ll as t w o h i gh dim ensional data sets (B r eas t C ancer , Wi ne), for this exp erim ent. F i g ure 10 il lust r a tes the relati o nshi p bet w een the runtim e of the propo s e d me tho d, bas e d on the number of corre ctly cl a ssi fied samp l es, and the div e rs ity t hresh o ld s. T h e v e r ti cal ax is refe rs to t he runtim e a nd t h e hori z o n tal a xis ref ers to the dive r s it y threshol d. Fig. 10. T h e effect of diversit y Thr es h ol d (dT) on t he runtime o f t h e p roposed a lgorit hm F i gure 11 il lustrates t he relation s hi p between th e perform ance of the propo s e d me t hod, b ased o n the number of co r r ectl y cl a ssifi ed samples, and the diver sity threshold s . The vertical a xis ref ers to the perform a nce w hil e the horizontal axis re fers to the diversi ty. Fig. 11. T h e effect of diversit y Thr es h o ld (dT) on t h e perf or m ance of the proposed a lgorithm As y o u can see i n Figu r e 10 a nd Figure 1 1 , al though increasin g the di v e rsity threshold can im prove t he perform a nce of the pr o p osed method, i t can increase the runtime of the a l g o r i thm, too. T he refore, this pa per use s a ti me c o n stant (2 mi n) to establish a balan c e b e t w een t he performance and the r unt i me. 4.5. Nois e an d M issing-Va lu e An aly sis In this section , a few exp eri ments are conduc t ed i n o r d e r t o a naly z e th e eff ect of noi s e and mis s i ng values on the performanc e of the prop osed me t hod. T his pap er employs Arce n e and CANE-9 for th i s exp er ime n t, since these two data set s are high-di mensio n al, large ( s ample) da ta sets. Figure 1 2 i llustrates the performanc e of t he prop osed method, WOC CE, APMM , M AX , a nd MCLA on the da ta sets wi th mi ss i ng val u e s . For this cause, some attributes of the mention ed data sets are randoml y chose n and their values are set to n ul l. Accordi ng to Figure 1 2, WOC CE and the p ropos e d me thod generate more st able result s . As it is clear in this Fig u r e, the p ropos e d method c an effe ctiv el y handle the missi n g va l ues. T he reason i s tha t, i t use s the grap h based I n de p endenc y and Unifor mi t y f o r div e r sity evaluation. a . T he perfor mance of the p ropose d me th o d, b. Th e per fo rma n c e of t h e p r oposed m ethod , WO C CE , A P MM, MA X, a n d MCL A o n W O CC E, A P MM, MAX, a n d MCLA o n A rce n e w i th missi ng v a l u e s CNAE 9 w i th mi s si n g v alues Fig . 12 . Mi ssing-Val ue Anal y s i s a . T h e perfo rmance of th e proposed method, b . Th e perfo rmance of the p r oposed m e tho d , WOC C E, A PMM, MAX, and MCLA on W OC CE, A PMM, MA X, and MCLA o n Noi s y Arce n e n o isy C NA E 9 Fig . 13 . Nois e Anal y sis F i gure 13 ill u str a tes the p erf o r mance of t he p r o posed method, WOCCE, APMM, M A X, and MCLA on the dat a sets whic h contain noi s e s . For this cau se, some at tri bu t e s of t he menti o n ed d ata sets a re randoml y changed. Accordi n g to Figur e 1 3, WOCCE a nd the prop osed me tho d generate mo re sta ble result s . It was claim ed earli e r that the g oal of In d e p endenc y is t o a c h i eve high-perform an c e a s we ll a s gener a tin g r o bust and sta ble results. T hi s e x perim ent c a n be t he be s t evidence for the m ent i oned cl aim. 5. Conclusi o n T r a diti on al cl us t e r ens emble methods c o nc entrat e on the d i versity and q uali t y of the b asic re sults. T his pa per su g gests a new method for employ ing t he graph-b ased mo d e ling, whic h is a concept i n s oftw are testing, for evaluation of basic c lusteri n g a l gorithm’ s Independenc y i n the clu ste r ensemble sele ction. The mo s t importan t ad vantage of thi s employm ent is the addi t io n of n e w asp ec t s, such as In dep ende ncy, w h i ch is b as e d on the gra ph of clusterin g algorithm s , as wel l as a n e w fram e w ork for s e lecti ng high qu ali ty b as i c clusterin g results. T he d e gree of In d e p endency w h i ch is ob tained from t he p roposed method is used a s a w eight t o evaluate diversit y in t he processes of gene rating t he fi n al result. Als o , t hi s pa per prop oses a p roc edure to as sess the Inde p endenc y of the ba se algori th m s. T his procedure i s b ased on the CAI L, w hich is a new modeli ng language for ca l cu la tin g the I nd e p ende ncy of clu s teri ng algorit h m s. We also i ntroduce t h e U n i formi ty c r iteri o n to m easure the di versity of the basic r esults. T o prove the claim s of this pa per, the resu lts of t he propo s e d method are compa r ed wi th the resul ts of ba sic cl u s t e ring methods, cluster ense mble me tho d s, and cluster ensem b le sele ction methods. T he results w ere a c h i eved by a pp l yin g the me ntioned methods on 1 7 stan dard dat a set s p ri ma r ily taken f rom the UCI repository . I n our ex peri ment, da ta sets wi t h differ ent s c a l es (smal l, a ver a ge, and l a rge ) we r e used s o that the accur a cy cou l d b e evaluated reg a rd less o f th e scale of a data s e t . I n ad di tion, in order to b e ensured ab out t h e accuracy of all results, t he exp e rime nt has been repeat e d 1 0 tim es. Sim ilar to oth e r p i oneeri n g ideas, the p roposed framewo rk can be im proved l a ter. This pa per suggests employ ing mo re ba sic cl u ste ri n g algor ithm s in o r d e r to be tter sa ti s f yi n g the diversi ty in the b as i c res ults. Ref e rences Akbari, E ., Dahlan, H .M., I b rahim , R., Alizadeh, H., 20 1 5. Hi era r chical clu s ter ensem b le selec t i on. Enginee ring App l icat i ons of Artifi ci a l In tell igence 3 9, 1 46-15 6 . Ali z adeh, H., Minaei -Bidgoli , B., Parvin, H., 2 01 1. A new asym metri c cri t e r i on for clu s ter v al i d ation , Ibe r o a me rican Congre s s on P atter n Recogni tion. Sp r inger, p p. 3 20-33 0 . Ali z adeh, H., M i naei -Bidgoli , B., P arvi n , H., 2 01 4. C l uster en s e mb le sel ection ba sed on a new cluste r sta bil ity me a sure. In t e lli g e n t Data Analy sis 1 8, 389 -40 8. Ali z adeh, H., Parvin, H., P arvi n, S . , 20 12 . A frame work for cluster ensem b le b ased on a max me t r ic a s cl u ste r evaluator. IA ENG I nternational J o urnal of C om p uter S c ie n c e 3 9 , 1 0-19 . Ali z adeh, H., Yousefne z had, M., Bidgoli , B.M., 2 01 5 . Wi sd om of Crow d s cluster ensemble. Inte ll igent Data A nal ysis 19 , 48 5 -503 . Am ma nn , P., Offut t , J., 2 008 . I ntroducti o n to s o f t w are testi n g. Ca m b rid ge Univ ersity Press. Azim i, J., F er n , X ., 2 00 9 . Adap tive C l uster Ense mble S e lecti on, I JCAI , pp. 9 92 -997 . Ba hro loloum, A., Nez am ab ad i -po ur, H., Sary a zdi , S . , 2 01 5 . A d ata clusteri ng ap pr o a ch b ased on uni v e r s a l g r a vit y rul e . Enginee ring App l ications of Arti fici al Inte lli gence 4 5 , 4 15- 42 8. Fern, X.Z., Lin, W., 2 0 08. Cluster ensemble sele ction. S tatistic a l Analysi s a n d D ata Mi n i ng 1 , 1 28 - 1 41. Fred, A., Lourenço, A., 2 0 08. Cluster e n sem b le methods: from single clusteri ngs to combined sol u t ions, Sup er v i sed and unsupervise d ensemble me t hods a nd thei r app l ications. S pringe r , pp . 3 -30 . Fred, A.L., Jain, A.K. , 2 00 5. Combini n g multi p le cluster ings usi n g eviden ce a c c u mulation. I E EE transa ct ions o n p at t e rn analy sis a nd m a c h i ne inte lli g e nce 27 , 83 5-85 0. Go se , E., 1 99 7. Pat ter n reco g ni tion and im a ge a nal ysis. Izakian, H., P e dryc z , W., Jamal, I ., 20 15. F u z zy clu s teri ng of tim e seri es data using dyn a mi c ti m e w a rping di sta nc e. En g ineeri ng App li cat i ons of Arti fici a l In t e lli g e n c e 39 , 23 5-24 4. Jain, A . K., 2 0 10 . Da ta cl us t ering: 5 0 years b ey ond K-m eans. Pattern re cog ni tion letters 31 , 65 1-66 6 . Jain, A.K ., Murty, M.N ., F l ynn, P.J., 1 999 . Data clusteri ng: a revi e w . ACM computing survey s (CSUR) 31 , 26 4-32 3. Jain, A.K ., To pchy, A., La w , M.H., Buhmann, J.M., 2 00 4 . La nd s c a pe o f cluster ing a lgo r i th m s, Patt e rn Recogni t i on, 2 00 4. I CPR 20 04 . Proceedin g s of the 1 7 t h I nternat i onal Confer ence on. IEEE , p p. 26 0-26 3 . Jia, J., X i a o, X., L i u, B., 2 0 12. Sim ilarit y-ba se d s pectr a l clusteri ng ensemble sel ection, Fuz zy System s and K no w le dge Di scovery (FSKD ), 2 012 9th I nt er n ati o nal Con f erence on. I EEE, pp . 10 71 -10 74 . K a ndyl as, V., Up h a m, S.P., Ungar, L.H., 20 08 . Findin g cohesi ve cl u sters for an aly z i ng k no wled g e com mu n i ties. K n ow le d ge and I nformation Systems 17, 33 5 - 3 54 . Lim in, L . , Xi a oping, F., 2 01 2 . A new s e lecti v e clu sterin g ensemble a l g ori thm, e-Bu s ine ss Engine ering (I CE BE), 2 0 12 IEEE Ninth I nt e rna ti o nal Confer ence on. I EEE, pp. 4 5-4 9. New man, D.J., He t ti ch, S . , Bla k e, C . L . , M er z , C.J., 1 9 98. { UCI} R e p ository o f machi ne learning dat aba ses . Strehl, A., G hosh, J ., 20 0 2. Cluster ense mb l es---a k no wled ge reuse framew ork for combinin g multiple pa r titions. Jo u rnal o f m achine learni n g res earch 3 , 5 83 -61 7. To pchy , A., Jain, A. K., Pun c h, W., 2 0 03 . C ombin ing mul t i p l e weak clusteri ngs, Data Mining, 20 03. ICD M 20 03 . T hir d IEEE Internati o nal C onfe rence on. I EEE, p p . 33 1 -33 8. Yousefne z had, M., 2 01 3. Cluster ensem b l e se lecti o n ba sed on the wi s d o m of crow ds. M . S c . f ina l t hes is in Maz andara n Uni versi t y of Sci ence an d Technolo g y , I ran, Bab ol. Yousefne z had, M., Al iza deh, H., Mi n ae i-Bidgol i, B., 201 3 . Ne w cluster ense mb l e selec tion me t hod ba s ed on d i versity a nd independent metri cs, 5 th Confere n c e on In f o r m at i on and K n ow le d ge T ec hn ol ogy (I KT’1 3), p p . 22 -2 4. Zhong, S., G h o sh, J., 2 00 5 . G e n e rat iv e mode l- b as e d docum ent cl u ste r i ng: a compa r a tiv e stu dy . K n ow le d ge a n d Info rmati o n Systems 8, 3 74-3 84 .
Original Paper
Loading high-quality paper...
Comments & Academic Discussion
Loading comments...
Leave a Comment