StruClus: Structural Clustering of Large-Scale Graph Databases
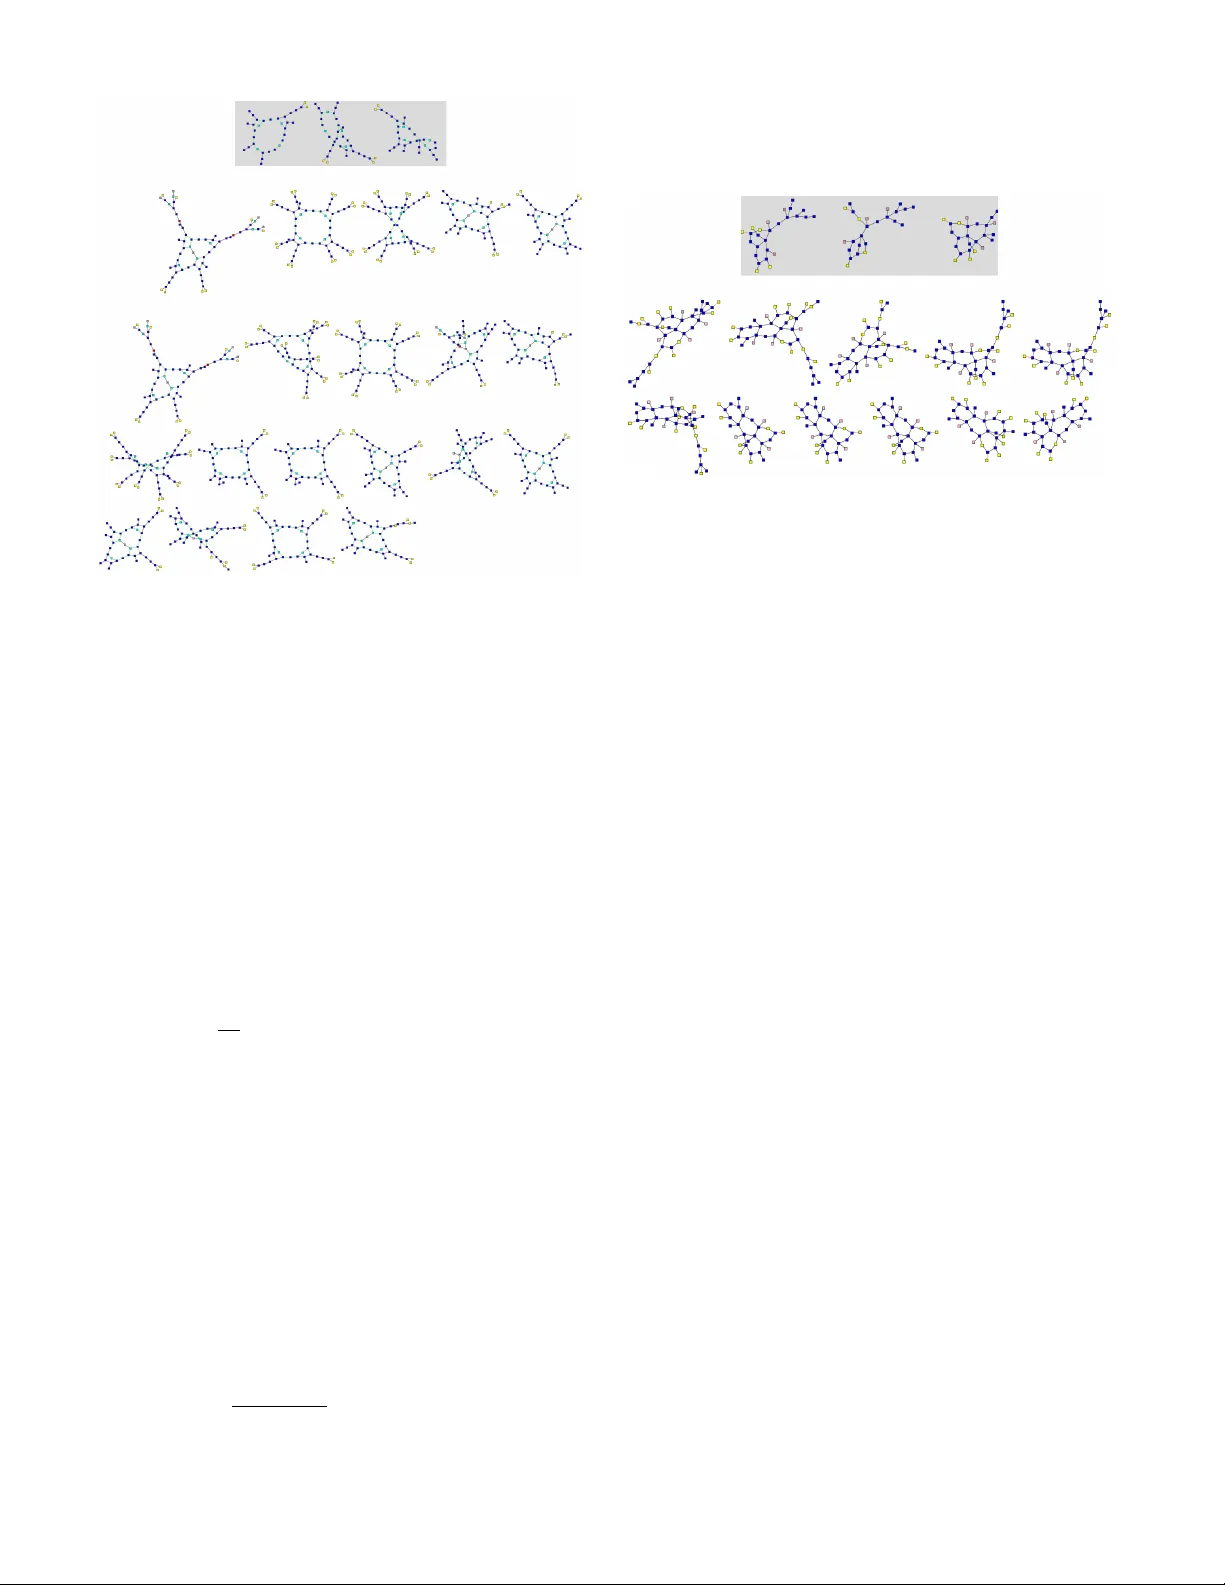
We present a structural clustering algorithm for large-scale datasets of small labeled graphs, utilizing a frequent subgraph sampling strategy. A set of representatives provides an intuitive description of each cluster, supports the clustering proces…
Authors: Till Sch"afer, Petra Mutzel
StruClus: Structural Clustering of Lar ge-Scale Graph Databases T ill Sch ¨ afer TU Dortmund Univ ersity Dept. of Computer Science 44227 Dortmund, Germany Email: till.schaefer@cs.tu-dortmund.de Petra Mutzel TU Dortmund Univ ersity Dept. of Computer Science 44227 Dortmund, Germany Email: petra.mutzel@cs.tu-dortmund.de Abstract —W e present a structural clustering algorithm for large-scale datasets of small labeled graphs, utilizing a frequent subgraph sampling strategy . A set of r epresentativ es provides an intuitive description of each cluster , supports the cluster - ing pr ocess, and helps to interpret the clustering results. The projection-based natur e of the clustering approach allows us to bypass dimensionality and feature extraction pr oblems that arise in the context of graph datasets reduced to pairwise distances or feature vectors. While achieving high quality and (human) interpr etable clusterings, the runtime of the algorithm only grows linearly with the number of graphs. Furthermore, the approach is easy to parallelize and therefor e suitable f or very large datasets. Our extensive experimental evaluation on synthetic and real world datasets demonstrates the superiority of our approach over existing structural and subspace clustering algorithms, both, from a runtime and quality point of view . I . I N T R O D U C T I O N Molecules, protein interaction networks, XML documents, social media interactions, and image se gments all hav e in com- mon that they can be modeled by labeled graphs. The ability to represent topological and semantic information causes graphs to be among the most versatile data structures in computer science. In the age of Big Data, huge amounts of graph data are collected and the demand to analyze them increases with its collection. W e focus on the special case of clustering large sets of small labeled graphs. Our main moti vation stems from the need to cluster large-scale molecular databases for drug discov ery , such as PubChem 1 , ChEMBL 2 , ChemDB 3 or synthetically constructed de-novo databases [1], which contain up to a billion molecules. Howe ver , the presented approach is not limited to this use case. Clustering techniques aim to find homogeneous subsets in a set of objects. Classical approaches do not interpret the objects directly , but abstract them by utilizing some intermediate representation, such as feature vectors or pairwise distances. While the abstraction ov er pairwise distances is beneficial in terms of generality , it can be disadvantageous in the case of intrinsic high dimensional datasets [2, 3]. In this case the concentration effect may cause the pairwise distances to loose their relati ve contrast; i.e. the distances con verge tow ards a 1 https://pubchem.ncbi.nlm.nih.gov/ 2 https://www .ebi.ac.uk/chembl/ 3 http://cdb .ics.uci.edu/ common value [4]. The concentration ef fect is closely related to a bad clusterability [5]. Sets of graphs are usually clustered by transforming the graphs to feature vectors or by using graph theoretic similarity measures. T ypical feature extraction methods for graphs are: counting graphlets , that is, small subgraphs [6, 7], counting walks [8], and using eigen vectors of adjacency matrices (spectral graph theory) [9]. The enumeration of all subgraphs is considered intractable ev en for graphs of moderate size, because there exist up to exponentially many subgraphs wrt the graph size. Many efficient clustering algorithms have been proposed for vector space. Therefore, the transformation to feature vec- tors might look beneficial in the first place. Howe ver , the abov e mentioned feature extraction methods tend to produce a large amount of distinct and often unrelated features. This results in datasets with a high intrinsic dimensionality [10, 11]. Additionally , the extracted features only approximate the graph structure, which implies that feature vectors cannot be transformed back into a graph. Hence, the interpretability of clustering algorithms which perform vector modifications (e.g. calculating centroids) is limited. Besides the utilization of various feature extraction tech- niques, it is possible to compare graphs directly using graph theoretic distances such as (maximum) common subgraph deriv ed distances [12–14] or the graph edit distance [15]. The computation of the previously mentioned graph theoretic distances is NP-hard and as shown in [11] their application results in datasets with a high intrinsic dimensionality as well. High quality clustering methods for arbitrary (metric) and high dimensional datasets furthermore require a superlinear number of exact distance computations. These factors render graph theoretic distance measures in combination with generic clustering algorithms infeasible for large-scale datasets. Subspace and projected clustering methods tackle high dimensional datasets by identifying subspaces in which well separated clusters exist. Howe ver , generic subspace algorithms come with a high runtime burden and are often limited to an euclidean vector space. Our structural pr ojection clustering algorithm approaches the dimensionality problems by explicitly selecting cluster representativ es in form of common subgraphs. Consider a feature mapping to binary feature vectors that contain one feature for each subgraph that is found in the complete dataset. For each graph, its feature vector has binary entries encoding the presence of the associated substructure graph. Selecting a common subgraph S as cluster representativ e is another way of selecting a subspace in these feature v ectors consisting of all features associated with subgraphs of S . Our main contributions in this paper are: W e present a nov el structural projection clustering algorithm for datasets of small labeled graphs which scales linearly with the dataset size. A set of representati ves provides an intuitiv e description of each cluster , supports the clustering process, and helps to interpret the clustering results. Up to our knowledge, this is the first approach activ ely selecting representativ e sets for each cluster based on a ne w ranking function. The candidates for the representativ es are constructed using frequent subgraph sampling. In order to speed up the computation, we suggest a new error bounded sampling strategy for support counting in the context of frequent subgraph mining. Our experimental ev aluation shows that our new approach outperforms competi- tors in its runtime and quality . The paper is structured as follo ws: Section II provides an ov erview of related clustering algorithms. Basic definitions are giv en in Section III. Section IV presents the main algorithm and a runtime analysis. Our experimental e valuation in which we compare our new algorithm to SCAP [16], PROCLUS [17] and Kernel K-Means [18] is presented in Section V. I I . R E L A T E D W O R K Sev eral clustering algorithms for graph and molecule data hav e been proposed in the last years. Tsuda and Kudo [10] presented an EM algorithm using a binomial mixture model ov er very high dimensional binary vectors, indicating the pres- ence of all frequent substructures. T wo years later , Tsuda and Kurihara [19] presented a similar graph clustering algorithm using a Dirichlet Process mixture model and pruning the set of frequent substructures to achie ve smaller feature v ectors. A K-Median like graph clustering algorithm has been presented by Ferrer et al. [20], that maps each graph into the euclidean space utilizing the edit distance to some piv ot elements. A median graph is then selected based on the distance to the euclidean median. Furthermore, a parallel greedy overlapping clustering algorithm has been presented by Seeland et al. [21]. It adds a graph to a cluster whenev er a common substructure of a user-defined minimum size exists. Howe ver , none of the previously mentioned algorithms are suitable for large datasets as a result of their high computational complexity . XProj [22] uses a projection-based approach by selecting all (enumerated) frequent substructures of a fixed size as cluster representativ es. The approach scales well with the dataset size but is limited to trees. A generalization to graphs would result in a huge performance degradation. Furthermore, there exist some hybrid approaches, that pre-cluster the dataset by using a vector-based representation and refine the results using structural clustering algorithms. The most rele vant with respect to large-scale datasets is the SCAP algorithm proposed by Seeland et al. [16]. Of course many subspace algorithms are also applicable af- ter using a feature e xtraction method. Giving a comprehensi ve ov erview on subspace techniques is out of the scope of this article. Howe ver , there are two algorithms that are of special interest for this w ork: In [23] it is sho wn that frequent pattern mining can be used for feature selection in vector space. This relates to XProj and our approach in the way , that the selection of a graph representative—with the help of frequent substructure mining—is another way of selecting a subspace in the feature space of substructures. In the later ev aluation we will compare ourself to the PR OCLUS [17] algorithm. It is a fast projected clustering algorithm with noise detection, that selects features by minimizing variance. The algorithm has been studied intensi vely and performed well in various subspace clustering comparisons [24, 25]. I I I . P R E L I M I N A R I E S An undir ected labeled graph G = ( V , E , l ) consists of a finite set of vertices V ( G ) = V , a finite set of edges E ( G ) = E ⊆ {{ u, v } ⊆ V | u 6 = v } and a labeling function l : V U E → L , where L is a finite set of labels . | G | is used as a short term for | V ( G ) | + | E ( G ) | . A path of length n is a sequence of vertices ( v 0 , . . . , v n ) such that { v i , v i +1 } ∈ E and v i 6 = v j for i 6 = j . Let G and H be two undirected labeled graphs. A (label pr eserving) subgraph isomorphism from G to H is an injection ψ : V ( G ) → V ( H ) , where ∀ v ∈ V ( G ) : l ( v ) = l ( ψ ( v )) and ∀ u, v ∈ V ( G ) : { u, v } ∈ E ( G ) ⇒ { ψ ( u ) , ψ ( v ) } ∈ E ( H ) ∧ l ( { u, v } ) = l ( { ψ ( u ) , ψ ( v ) } ) . If f there exists a subgraph isomorphism from G to H we say G is supported by H , G is a subgraph of H , H is a super graph of G or write G ⊆ H . If there exists a subgraph isomorphism from G to H and from H to G , the two graphs are isomorphic. A common subgraph of G and H is a graph S , that is subgraph isomorphic to G and H . Furthermore, the support sup ( G, G ) of a graph G ov er a set of graphs G is the fraction of graphs in G , that support G . G is said to be fr equent , iff its support is larger or equal than a minimum support thr eshold minSup . A frequent subgraph G is maximal , iff there exists no frequent supergraph of G . For a set of graphs G , we write F ( G ) for the set of all frequent subgraphs and M ( G ) for the set of all maximal frequent subgraphs. A clustering of a graph dataset X is a partition C = { C 1 , . . . , C n } of X . Each cluster C ∈ C consists of a set of graphs and is linked to a set of cluster repr esentatives R ( C ) = { R 1 , . . . , R k } which are itself undirected labeled graphs. Please note, that we consider each graph in our dataset to be a distinct object. As a result, it is possible to hav e isomorphic graphs in a single set. I V . T H E StruClus A L G O R I T H M A high lev el description of the StruClus algorithm is giv en in Algorithm 1. Initially , it partitions the dataset using a lightweight pre-clustering algorithm. Afterwards, the cluster- ing is refined using an optimization loop similar to the K- Means algorithm. In order to fit the number of clusters to the dataset structure (i.e., to achiev e a good cluster separation and homogeneity , see Sections IV -B and IV -D), we use a cluster splitting and merging strategy in each iteration. Algorithm 1 StruClus Algorithm 1: apply pre-clustering { Section IV -E } 2: while not con ver gent { Section IV -F } do 3: split clusters { Section IV -D } 4: merge clusters { Section IV -D } 5: update representativ es { Section IV -B } 6: assign graphs to closest cluster { Section IV -C } 7: end while An important ingredient of our algorithm is the set of representativ es R ( C ) for each cluster C ∈ C . Representativ es serve as an intuitive description of the cluster and define the substructures o ver which intra cluster similarity is measured. The set R ( C ) is chosen such that for ev ery graph G ∈ C there exists at least one representative R ∈ R ( C ) which is subgraph isomorphic (i.e., supported by G ). W ith the exception of a single noise cluster the following in variant holds after each iteration: ∀ C ∈ C : ∀ G ∈ C : ∃ R ∈ R ( C ) : R ⊆ G. (1) The representativ e set R ( C ) of a cluster C ∈ C is constructed using maximal frequent subgraphs of C (see Section IV -A). Having a representati ve set instead of a single representativ e has the advantage, that graphs composed of multiple common substructures can be represented. In order to be meaningful and human interpretable, the cardinality of R ( C ) is limited by a user defined value R max . Figure 1 shows two example clusters and their representati ves of a real world molecular dataset generated with StruClus . A. Stochastic Representative Mining W e construct the representativ e set R ( C ) of a cluster C ∈ C using maximal frequent subgraphs of C . Since the set M ( C ) may have exponential size wrt the maximal graph size in C , we restrict ourselves to a subset of candidate represen- tativ es S ( C ) ⊆ M ( C ) using a randomized maximal frequent connected subgraph sampling technique from ORIGAMI [26] combined with a new stochastic sampling strategy for support counting. In a second step, the final representativ e set R ( C ) ⊆ S ( C ) is selected using a ranking function (see Section IV -B1). ORIGAMI constructs a maximal frequent connected sub- graph S ∈ S ( G ) ov er a set of graphs G by extending a random frequent vertex with frequent paths of length one leading to a graph S 0 . In a first step, all frequent vertices N ( G ) and all frequent paths of length one P ( G ) are enumerated with a single scan of G . Then, for each extension, a random verte x of S 0 is chosen and a random, label preserving path p ∈ P ( G ) is connected to it in a forward (creating a new verte x) or backward (connecting tw o existing v ertices) fashion. After each extension, the support sup ( S 0 , G ) is ev aluated by solving a subgraph isomorphism test for all graphs in G . If sup ( S 0 , G ) ≥ minSup , the e xtension is permanently added to S 0 or otherwise remov ed. If no further e xtension is possible without violating the minimum support threshold, a maximal frequent subgraph S has been found. This process is justified by the monotonicity pr operty of subgraphs G ⊆ of graphs in G : ∀ G, H ∈ G ⊆ : G ⊆ H ⇒ sup ( G, G ) ≥ sup ( H , G ) (2) While ORIGAMI greatly improv es performance in comparison with enumeration algorithms, the |G | subgraph isomorphism tests for each extension remain a major performance bottle- neck for StruClus . For this reason, we have added a stochastic sampling strategy for support counting. Initially , we draw a random sample H ⊆ G . Then ˆ θ = sup ( S 0 , H ) is an estimator for the parameter θ of a bino- mial distrib ution B ( · , θ ) , where θ = sup ( S 0 , G ) is the true probability of the underlying Bernoulli distribution. W e are interested if the true v alue of sup ( S 0 , G ) is smaller than the minimum support threshold. W ithout loss of generality , let us focus on the case ˆ θ < minSup in the following. W e can take advantage of a binomial test under the null hypothesis, that θ ≥ minSup and thereby determine the probability of an error , if we assume sup ( S 0 , G ) < minSup . W ith a predefined significance lev el α we can decide if the sample gives us enough confidence to justify our assumption. If we cannot discard our null hypothesis, we continue by doubling the sample size |H| and repeat the process. In the e xtreme case we will therefore calculate the exact value of sup ( S 0 , G ) . The statistical test is repeated for each extension and each sample size doubling. As a consequence, a multiple hypothesis testing correction is necessary to bound the real error for S to be a maximal frequent substructure of G . Proposition IV -A.1. Let G be a set of undir ected labeled graphs, |H min | the minimal sample size, P ( G ) the set of all fr equent paths of length one, minSup a minimum support thr eshold, and V max the (1 − minSup ) -quantile of the sorted (incr easing order) graph sizes of eac h graph in G . Then the maximal number of binomial tests to construct a maximal fr equent substructur e over G is bounded by: log |G | |H min | ( V 2 max + V max ) | P ( G ) | Pr oof. The sample size is doubled l log |G | |H min | m times if the test never reaches the desired significance lev el. The size of some S ∈ M ( G ) is bounded by the size of each supporting graph. In the worst case S is supported by the ( |G | minSup )- largest graphs of G . The graph size of the smallest supporting graph is then equal to the (1 − minSup ) -quantile of the sorted graph sizes in increasing order . The number of backward extensions is bounded by the number of vertex pairs times the number of applicable extensions p ∈ P ( G ) . Additionally , we need to check | P ( G ) | forward extensions for each vertex to conclude that S is maximal. Finally , with the v alue of Proposition IV -A.1 we are able to apply a Bonferroni correction to our significance lev el. W e can afford a relative high error, because the selection of the Fig. 1. T wo real world clusters generated with StruClus . The grey boxes show the cluster representatives. final representati ves will filter out bad candidates. Ho wev er, the used significance level has an influence on the runtime. On the one hand a high error leads to many bad candidates and we need to increase the number of candidates to mine. On the other hand a low error will lead to larger sample sizes to reject the null hypothesis. A maximal error of 50% has turned out to be a good choice during our experimental ev aluation. B. Update Repr esentatives 1) Repr esentative Selection: In its role as a cluster de- scription, a good representati ve R ∈ R ( C ) explains a large portion of its cluster . Accordingly , it should (a) be supported by a large fraction of C and (b) cov er a large fraction of vertices and edges of each graph G ∈ C supporting R . W e define the coverage of a graph G by a representativ e R as cov ( R, G ) := | R | | G | . The two criteria are closely related to the cluster homogeneity . A uniform cluster , that is, a cluster that contains only isomorphic graphs, can achiev e optimal values for both criteria. V ice v ersa, the monotonicity property (2) implies non-optimal values for inhomogeneous clusters for at least one of the two criteria. As homogeneous clusters are desired, we use a product of the two criteria for our ranking function. In order to discriminate clusters from each other, a cluster representativ e should be cluster specific as well. Thus, its support in the rest of the dataset should be lo w . For this reason, we use the following ranking function for a dataset X , cluster C and representative R ∈ R ( C ) : C R := { G ∈ C | R ⊆ G } rank ( R ) := | C R | | R | P G ∈ C R | G | ( sup ( R, C ) − sup ( R , X )) (3) Finally , we select the R max highest ranked sampled subgraphs from S ( C ) as cluster representativ es R ( C ) . 2) Balancing Cluster Homogeneity: Besides the represen- tativ e selection, the choice of the minimum support threshold for representati ve mining has an influence on the cluster homogeneity . The fraction of unsupported graphs for a clus- ter C after updating the cluster representativ es is bounded by ( 1 − minSup ). The bound clearly relates to criteria (a) from the representative ranking (see Section IV -B1). Howe ver , unsupported graphs are removed from the cluster and will be assigned to a different cluster at the end of the current iteration (see Section IV -C). Due to the monotonicity property (2), this process of sorting out graphs by choosing a minimum support threshold belo w 1 , will increase the size of the representativ es and therefore our coverage v alue, i.e criteria (b). A decrease of the minimum support threshold will lead to an increase in the size of the representati ves. Subsequently , this process will also reduce the cluster cardinality . Therefore, increasing the homogeneity to an optimal v alue will result in a clustering with uniform or singleton clusters, which is clearly not the desired behavior . T o get around this, we will aim to wards a similar homogene- ity for all clusters and choose the minimum support threshold cluster specific. Howe ver , choosing a fixed homogeneity lev el a priori is not an easy task, as an appropriate v alue depends on the dataset. Therefore we will calculate an average coverage score ov er all clusters and use this as a baseline adjustment. For the ease of computation, we choose a slightly simplified cov erage approximation: aCov ( C ) = 1 |R ( C ) | P R ∈R ( C ) | R | 1 | C | P G ∈ C | G | (4) relCov ( C, C ) = aCov ( C ) 1 |C | P C 0 ∈C aCov ( C 0 ) (5) Finally , we can define a linear mapping from the relati ve co v- erage relCov to a cluster specific minimum support threshold with the help of two predefined tuples ( ls , lr ) and ( hs , hr ) , where ls < hs and lr < hr . The parameter ls ( hs ) denotes the lowest (highest) support value and lr ( hr ) the relati ve cov erage value mapped to the lowest (highest) minimum support: f ( C, C ) := relCov ( C, C ) hs − ls hr − lr + ( ls − lr hs − ls hr − lr ) minSup ( C, C ) := ls if relCov ( C, C ) < lr hs if relCov ( C, C ) > hr f ( C, C ) otherwise. (6) T o result in a minimum support threshold of 1 for all clusters (i.e. stopping the process of sorting out graphs if the clustering is balanced), we will set the values of the parameters hs very close or equal to 1 and hr < 1 . C. Cluster Assignment Each graph G in the dataset is assigned to its most similar cluster in the assignment phase. As a measure for similarity , we are summing up the squared sizes of the representativ es of a cluster , which are subgraph isomorphic to G . This choice of similarity is once more justified by the representativ e ranking criteria. W e square the representativ e sizes, to prefer a high cov erage over a high number of representatives to be subgraph isomorphic to the assigned graph. As mentioned in Section IV -B2 it is possible that a graph G ∈ C will no more be supported by any representativ e R ∈ R ( C ) of its cluster C after updating the representatives. In this situation we will create a single noise cluster , where all graphs (of all clusters) that are not supported by any representativ e are collected. As the minimum support threshold is bounded by the fix ed value ls (see Section IV -B2) and the number of representatives is limited by R max , it is not guaranteed that we can find an appropriate set of representatives for this most likely largely inhomogeneous noise cluster . It is therefore excluded from the inv ariant (1). The problem of finding all subgraph isomorphic graphs in a graph database is also known as the subgraph sear ch pr oblem and was extensi vely studied in the past. W e apply the finger- print pre-filtering technique CT -Index [27], which has emerged from this research topic, to speed up the assignment phase. CT -Index enumerates trees and circles up to a specified size for a giv en graph and hashes the presence of these subgraphs into a binary fingerprint of fixed length. If the fingerprint of a graph G has a bit set that is unset in the fingerprint of a graph H we can conclude that no subgraph isomorphism from G to H exists, because G contains a subgraph that is not present in H . W e calculate a fingerprint for each graph and representativ e and only perform a subgraph isomorphism test in our assignment phase if the fingerprint comparison cannot rule out the presence of a subgraph isomorphism. D. Cluster Splitting and Mer ging W ithout the operation of cluster splitting, the abov e men- tioned process of creating noise clusters would create at most one extra cluster in each iteration of our main loop. A large difference in the initial and final number of clusters therefore would lead to a slow conv ergence of the StruClus algorithm tow ards its final result. As mentioned before, it is also possible that no representati ve is found at all for the noise cluster , and therefore the process of sorting out graphs from the noise cluster to increase its homogeneity is stopped completely in the worst case. A similar situation can occur for regular clusters. For example, if a cluster is composed of uniform sets T ∈ T of graphs, we will require a minimum support threshold less than or equal to 1 − 1 min T ∈T {| T |} to sort the smallest possible number of graphs out. For this reason, a cluster splitting step is necessary (see Algorithm 1). In this step, all clusters that hav e a relati ve co verage v alue below an a priori specified threshold relCov min will be merged into a single set of graphs and the pre-clustering algorithm is applied on them. The resulting clusters are added back to the clustering. On the contrary to cluster splitting, which focuses on cluster homogeneity , cluster mer ging ensures a minimum separation between clusters. Separation can be measured on different le v- els. Man y classical measures define separation as the minimum distance between two cluster elements. Howe ver , this type of definition is not suitable for projected clustering algorithms, because the comparison does not take the cluster specific subspace into account. As mentioned in the introduction, the cluster representativ es in StruClus define the subspace of the cluster . Additionally , they serve as a description of the graphs inside the cluster itself. A high cov erage value leads to an accurate cluster description. Thus, we will define separation between two clusters C and C 0 solely over the representativ es sets R ( C ) and R ( C 0 ) . This definition is also beneficial from a runtime perspecti ve, as separation calculation is independent of the cluster size. W ithout cluster merging it is possible that clusters with very similar representati ves do exist. Although the pre-clustering will ensure that the initial clusters will ha ve dissimilar representatives (see Section IV -E) it may happen that two clusters conv erge to wards each other or that newly formed clusters are similar to an already e xisting one. Therefore, we will merge two clusters whene ver their representativ es are too similar . T o compare two single representativ es R, R 0 we calculate the size of their maximum common subgraph (MCS) and use its relativ e size as similarity: sim ( R, R 0 ) := | mcs ( R, R 0 ) | max {| R | , | R 0 |} (7) The maximum of the representatives sizes is chosen as denom- inator to support different clusters with subgraph isomorphic representativ es, which dif fer largely in size. Finally , we will merge two clusters C and C 0 if the following condition holds: |{ ( R, R 0 ) ∈ R ( C ) × R ( C 0 ) | sim ( R, R 0 ) ≥ sim min }| ≥ sim num (8) where sim num is a minimum number of representati ve pairs which hav e a similarity greater than or equal to sim min . Note that the calculated MCS between two representatives R ∈ R ( C ) , R 0 ∈ R ( C 0 ) is supported by all the graphs G ∈ C ∪ C 0 , that support either R or R 0 , because the subgraph isomorphism relation is transitive. The coverage for these graphs in the merged cluster is furthermore bounded by max { cov ( G, R ) , cov ( G, R 0 ) } sim ( R, R 0 ) if we reuse the MCS as representati ve. For this reason, we recommend to set sim num close to the number of representativ es per cluster to support a large fraction of graphs in the merged cluster . The parameter sim min is furthermore an intuitiv e knob to adjust the granularity of the clustering. Finally , the representati ves for the merged clusters are up- dated. W e do not use the calculated MCSs as representati ves, because better representatives may exist and the decision problem “Does an MCS larger than some threshold exist?” is computationally less demanding than calculating the MCS itself. E. Pr e-Clustering The pre-clustering serves as an initial partitioning of the dataset. A random partitioning of all graphs would be problem- atic as representati ves may not be found for all partitions and the found representativ es are most likely not cluster specific. This will result in a high number of clusters to be merged to a few inhomogeneous clusters and in a slow con ver gence of the StruClus algorithm. T o pre-cluster the dataset X , we compute maximal frequent subgraphs S ( X ) ⊆ M ( X ) , as described in Section IV -A with a fixed minimum support. These frequent subgraphs serve as representativ e candidates for the initial clusters. T o av oid v ery similar representati ves we will first greedily construct maximal sets of dissimilar graphs. As a measure of similarity we re- use the similarity (7) and the threshold sim min from cluster merging. In other words, we are picking all graphs G from S ( X ) in a random order and add G to our dissimilar set D , if @ H ∈ D with sim ( G, H ) < sim min . This process is repeated sev eral times and the largest set D max is used to create one cluster for each H ∈ D with H as single representativ e. Afterwards we run a re gular assignment phase as described in Section IV -C. As a result of re-using sim min we can expect, that we have well separated cluster and no cluster merging is necessary in the first iteration of the main loop (excluding the noise cluster). F . Con ver gence StruClus optimizes cluster homogeneity while maintaining a minimal cluster separation. As described in Section IV -B2, homogeneity is defined by two criteria wrt the cluster rep- resentativ es. W ith an exception of the noise cluster, the representativ e support criteria (a) can be dismissed, because not represented graphs will be sorted out of the cluster . It was further discussed, that an optimal homogeneity can be achiev ed for singleton clusters. Howe ver , the later introduced cluster separation constraint will limit the granularity of the clustering, because two similar representativ es will be merged. Nev ertheless, there might exist se veral clusterings with dif fer- ent granularity that respect the separation constraint. For this reason the objective function balances the cov erage criteria (b) of the homogeneity and the granularity of the clustering. The parameter α adjusts this granularity: z ( C ) := P C ∈C | C | aCov ( C ) |C | α (9) As a consequence of the cluster splitting and merging, the objectiv e function will fluctuate and contain local optima. W e will therefore smooth the objectiv e function. Let C i be the clustering after the i -th iteration. Algorithm 1 will terminate after the first iteration c for which the following condition holds: c ≥ s + w ∧ P c − w 60 vertices) representativ es. The high runtime of the SCAP algorithm on the AnchorQuery dataset is a bit surprising, as the common substructures processed by SCAP are limited in their size (maximum 8 v ertices). W e consider a larger frequent pattern search space to be the reason for this runtime increase. Kernel K-Means was surprisingly slo w on the Heterocyclic dataset and took more than 24 hours for a single run. W e have therefore created a random subset with a size of 5000 graphs for it. StruClus always outperforms the competitors wrt the quality scores. F or the AnchorQuery dataset StruClus created 26 clusters on av erage. The high score for the Purity measure shows, that StruClus splitted some of the real clusters, but keeps a well inter cluster separation. ChemDB was clustered by StruClus in ≈ 19 hours with ≈ 117 clusters. As a consequence of the high runtime of the ChemDB measurement and the lack of competitors, we repeated the test only 3 times. The aCov value for the final clustering was 0 . 49 on average. This highlights the ability of StruClus to cluster large-scale real-world datasets. V I . C O N C L U S I O N In this paper we have presented a new structural clustering algorithm for large scale datasets of small labeled graphs. W ith the help of explicitly selected cluster representatives, we were able to achieve a linear runtime in the worst case wrt the dataset size. A nov el support counting sampling strategy with multiple hypothesis testing correction was able to accelerate the algorithm significantly without lo wering the clustering quality . W e ha ve furthermore sho wn, that cluster homogeneity can be balanced with a dynamic minimum support strategy for representati ve mining. A cluster merging and splitting step was introduced to achieve a well separated clustering ev en in the high dimensional pattern space. Our experimental ev aluation has shown that our new approach outperforms the competitors wrt clustering quality , while attaining significantly lower runtimes for large scale datasets. Although we have shown that StruClus greatly improves the clustering perfor- mance compared to its competitors, de-novo datasets with sev eral billion of molecules are still outside the scope of this work. For this reason, we consider the development of a distributed variant of the algorithm to be future w ork. Another consideration to further improve the quality of the algorithm is to integrate a discriminativ e frequent subgraph miner for representativ e mining. The integration of the discriminativ e property into the mining process has the advantage, that higher T ABLE II R E SU LT S F O R T H E S Y N TH E T I C DAT A S E TS . R UN T I M ES A RE G I V E N I N H O U RS . B E S T R E S U L T S A R E M A R KE D B O L D . C V I S T H E C O E FFIC I E NT O F V A R IATI O N . T H E C V V A L UE I S G I V E N A S T H E M A X I MU M F O R E AC H C O LU M N . A L L OT H E R VAL U E S A R E A V E RA GE D . Q UA L IT Y M E A S UR E S A R E : N O RM A L I ZE D V A R IAT IO N O F I N F OR M A T I O N ( N V I) , F O WL K E S - M A L LO W S I N D EX ( FW ) , A N D P U R I TY . Size StruClus StruClus (Exact Support) SCAP PROCLUS Ker nel K-Means Runtime NVI FM Purity Runtime NVI FM Runtime Purity Runtime NVI FM Runtime NVI FM CV < 0 . 08 < 0 . 03 < 0 . 07 < 0 . 03 < 0 . 07 < 0 . 02 < 0 . 04 < 0 . 06 < 0 . 02 < 0 . 32 < 0 . 11 < 0 . 22 < 0 . 01 < 0 . 01 < 0 . 01 1 000 0 . 05 0 . 90 0 . 75 0 . 90 0 . 05 0 . 90 0 . 77 7 . 5 × 10 − 4 0 . 83 0 . 13 0 . 58 0 . 26 0 . 02 0 . 77 0 . 54 5 000 – – – – – – – – – 4 . 99 0 . 50 0 . 24 2 . 87 0 . 84 0 . 67 10 000 0 . 19 0 . 95 0 . 87 0 . 99 0 . 59 0 . 93 0 . 85 0 . 03 0 . 83 11 . 91 0 . 49 0 . 24 10 . 32 0 . 86 0 . 78 50 000 0 . 33 0 . 94 0 . 87 0 . 99 2 . 69 0 . 92 0 . 85 0 . 38 0 . 83 – – – – – – 100 000 0 . 47 0 . 93 0 . 86 0 . 99 – – – 1 . 21 0 . 86 – – – – – – 500 000 1 . 35 0 . 93 0 . 86 0 . 99 – – – 18 . 15 0 . 83 – – – – – – 1 000 000 2 . 73 0 . 91 0 . 84 0 . 98 – – – – – – – – – – – T ABLE III R E SU LT S F O R T H E R E A L W O RL D D A TAS E T S . R U N TI M E S A R E G I V EN I N H O U RS . B E S T R E S U L T S A R E M A R KE D B O L D . C V I S T H E C O EFFI C I E NT O F V A R IATI O N . T H E C V V A L UE I S G I V E N A S T H E M A X I MU M F O R E AC H C O LU M N . A L L OT H E R VAL U E S A R E A V E RA GE D . T H E C H E M DB M EA S U R EM E N T WAS R E PE ATE D O N L Y 3 T I M E S . W E H A V E N O T C A L CU L A T E D T H E — OT H E RWI S E M E A NI N G L ES S — C V F O R I T . R E S U L T S F O R K E R NE L K - M E AN S A R E A R E G I VE N F O R A R A N DO M S U B SE T O F T H E H E TE RO C Y L CI C D A T A S E T . Q UA L I T Y M E A SU R E S A R E : N O R M AL I Z E D V A R IATI O N O F I N F OR M A T I O N ( N V I) , F OW L K ES - M AL L OW S I N D E X ( F W ), A ND P UR I T Y . dataset StruClus SCAP PROCLUS Ker nel K-Means Runtime NVI FM Purity Runtime Purity Runtime NVI FM Runtime NVI FM CV < 2 . 91 < 0 . 09 < 0 . 12 < 0 . 08 < 0 . 02 < 0 . 01 < 0 . 03 < 0 . 05 < 0 . 08 < 0 . 01 < 0 . 01 < 0 . 01 AnchorQuery 2 . 47 0 . 44 0 . 63 0 . 89 – – – – – – – – Heterocyclic 1 . 07 0 . 46 0 . 53 0 . 66 0 . 01 0 . 58 0 . 01 0 . 29 0 . 29 3 . 03 (Subset) 0.27 0 . 29 ChemDB ≈ 19 – – – – – – – – – – – quality representative candidates are mined. This will result in a lower number of necessary candidate patterns, which has a positiv e ef fect on the runtime. Furthermore, it allo ws to mine highly discriminant, non-maximal subgraphs. Howe ver , it is non-trivial to extend the support counting sampling strategy to such miners. Additionally , discriminati ve scores are usually non-monotonic on the subgraph lattice [34, 35], which imposes another runtime burden. A C K N O W L E D G M E N T This work was supported by the German Research Foun- dation (DFG), priority programme Algorithms for Big Data (SPP 1736) . W e would like to thank Nils Kriege for providing a fast subgraph isomorphism and Madeleine Seeland, Andreas Karwath, and Stef an Kramer for providing their SCAP imple- mentation. R E F E R E N C E S [1] C. Kalinski, M. Umkehrer, L. W eber, J. Kolb, C. Burdack, and G. Ross, “On the industrial applications of mcrs: molecular diversity in drug discovery and generic drug synthesis, ” English, Molecular Diversity , vol. 14, no. 3, pp. 513–522, 2010. [2] E. Ch ´ avez and G. Navarro, “A probabilistic spell for the curse of dimensionality , ” in Algorithm Engineering and Experimentation, Thir d International W orkshop, ALENEX 2001, W ashington, DC, USA, J anuary 5-6, 2001, Revised P apers , A. L. Buchsbaum and J. Snoeyink, Eds., ser . Lecture Notes in Computer Science, vol. 2153, Springer, 2001, pp. 147–160. [3] A. Gupta, R. Krauthgamer, and J. R. Lee, “Bounded geometries, fractals, and low-distortion embeddings, ” in F oundations of Computer Science, 2003. Pr oceedings. 44th Annual IEEE Symposium on , IEEE, 2003, pp. 534–543. [4] K. S. Beyer, J. Goldstein, R. Ramakrishnan, and U. Shaft, “When is ”nearest neighbor” meaningful?, ” in Proceedings of the 7th Interna- tional Confer ence on Database Theory , ser . ICDT ’99, London, UK, UK: Springer-V erlag, 1999, pp. 217–235. [5] M. Ackerman and S. Ben-David, “Clusterability: A theoretical study, ” in Pr oceedings of the T welfth International Confer ence on Artificial Intelligence and Statistics, AIST A TS 2009, Clearwater Beach, Florida, USA, April 16-18, 2009 , D. A. V . Dyk and M. W elling, Eds., ser . JMLR Proceedings, vol. 5, JMLR.org, 2009, pp. 1–8. [6] N. W ale, I. A. W atson, and G. Karypis, “Comparison of descriptor spaces for chemical compound retriev al and classification, ” Knowl. Inf. Syst. , vol. 14, no. 3, pp. 347–375, 2008. [7] N. Shervashidze, S. V . N. V ishwanathan, T . Petri, K. Mehlhorn, and K. M. Borgwardt, “Efficient graphlet kernels for large graph comparison, ” in Pr oceedings of the T welfth International Confer ence on Artificial Intelligence and Statistics, AIST A TS 2009, Clearwater Beach, Florida, USA, April 16-18, 2009 , D. A. V . Dyk and M. W elling, Eds., ser . JMLR Proceedings, vol. 5, JMLR.org, 2009, pp. 488–495. [8] S. V . N. V ishwanathan, N. N. Schraudolph, R. I. K ondor, and K. M. Borgwardt, “Graph kernels, ” J ournal of Machine Learning Researc h , vol. 11, pp. 1201–1242, 2010. [9] P . Foggia, G. Percannella, and M. V ento, “Graph matching and learning in pattern recognition in the last 10 years, ” IJPRAI , vol. 28, no. 1, 2014. [10] K. Tsuda and T . Kudo, “Clustering graphs by weighted substructure mining, ” in Proceedings of the 23r d international confer ence on Machine learning , ACM, 2006, pp. 953–960. [11] N. Kriege, P . Mutzel, and T . Sch ¨ afer, “Practical sahn clustering for very large data sets and expensive distance metrics, ” Journal of Graph Algorithms and Applications , v ol. 18, no. 4, pp. 577–602, 2014. [12] H. Bunke and K. Shearer, “A graph distance metric based on the maximal common subgraph, ” P attern Recognition Letters , vol. 19, no. 3-4, pp. 255–259, 1998. [13] W . D. W allis, P . Shoubridge, M. Kraetzl, and D. Ray, “Graph distances using graph union, ” P attern Recognition Letters , vol. 22, no. 6/7, pp. 701–704, 2001. [14] M.-L. Fern ´ andez and G. V aliente, “A graph distance metric combining maximum common subgraph and minimum common supergraph, ” P attern Recognition Letters , v ol. 22, no. 6–7, pp. 753 –758, 2001. [15] H. Bunke, “On a relation between graph edit distance and maxi- mum common subgraph, ” P attern Recognition Letters , vol. 18, no. 8, pp. 689–694, 1997. [16] M. Seeland, A. Karwath, and S. Kramer, “Structural clustering of millions of molecular graphs, ” in Symposium on Applied Computing, SAC 2014, Gyeongju, Republic of Kor ea - Mar ch 24 - 28, 2014 , Y . Cho, S. Y . Shin, S. Kim, C. Hung, and J. Hong, Eds., A CM, 2014, pp. 121–128. [17] C. C. Aggarwal, C. M. Procopiuc, J. L. W olf, P . S. Y u, and J. S. Park, “Fast algorithms for projected clustering, ” in SIGMOD 1999, Pr oceedings ACM SIGMOD International Confer ence on Management of Data, June 1-3, 1999, Philadelphia, P ennsylvania, USA. , A. Delis, C. Faloutsos, and S. Ghandeharizadeh, Eds., A CM Press, 1999, pp. 61–72. [18] M. A. Girolami, “Mercer kernel-based clustering in feature space, ” IEEE T rans. Neural Networks , vol. 13, no. 3, pp. 780–784, 2002. [19] K. Tsuda and K. Kurihara, “Graph mining with variational dirichlet process mixture models, ” in Proceedings of the SIAM International Confer ence on Data Mining, SDM 2008, April 24-26, 2008, Atlanta, Geor gia, USA , SIAM, 2008, pp. 432–442. [20] M. Ferrer , E. V alveny , F . Serratosa, I. Bardaj ´ ı, and H. Bunke, “Graph- based k -means clustering: A comparison of the set median versus the generalized median graph, ” in Computer Analysis of Images and P atterns, 13th International Confer ence, CAIP 2009, M ¨ unster , Germany , September 2-4, 2009. Pr oceedings , X. Jiang and N. Petkov, Eds., ser . Lecture Notes in Computer Science, vol. 5702, Springer, 2009, pp. 342–350. [21] M. Seeland, S. A. Berger, A. Stamatakis, and S. Kramer, “Parallel structural graph clustering, ” in Machine Learning and Knowledge Discovery in Databases - European Confer ence, ECML PKDD 2011, Athens, Greece, September 5-9, 2011, Pr oceedings, P art III , 2011, pp. 256–272. [22] C. C. Aggarwal, N. T a, J. W ang, J. Feng, and M. J. Zaki, “Xproj: a framew ork for projected structural clustering of xml documents, ” in Pr oceedings of the 13th ACM SIGKDD International Conference on Knowledge Discovery and Data Mining, San Jose , California, USA, August 12-15, 2007 , P . Berkhin, R. Caruana, and X. W u, Eds., A CM, 2007, pp. 46–55. [23] M. L. Y iu and N. Mamoulis, “Frequent-pattern based iterati ve pro- jected clustering, ” in Data Mining, 2003. ICDM 2003. Third IEEE International Conference on , 2003, pp. 689–692. [24] E. M ¨ uller, S. G ¨ unnemann, I. Assent, and T . Seidl, “Ev aluating cluster- ing in subspace projections of high dimensional data, ” in Pr oc. 35th International Confer ence on V ery Large Data Bases (VLDB 2009), Lyon, F rance, PVLDB J ournal, V ol. 2, No. 1, , VLDB Endowment, 2009, pp. 1270–1281. [25] A. Patrikainen and M. Meila, “Comparing subspace clusterings, ” IEEE T rans. Knowl. Data Eng. , vol. 18, no. 7, pp. 902–916, 2006. [26] M. A. Hasan, V . Chaoji, S. Salem, J. Besson, and M. J. Zaki, “ORIGAMI: mining representative orthogonal graph patterns, ” in Pr o- ceedings of the 7th IEEE International Conference on Data Mining (ICDM 2007), October 28-31, 2007, Omaha, Nebraska, USA , IEEE Computer Society , 2007, pp. 153–162. [27] K. Klein, N. Kriege, and P . Mutzel, “CT-Index: fingerprint-based graph indexing combining cycles and trees, ” in Data Engineering (ICDE), 2011 IEEE 27th International Confer ence on , 2011, pp. 1115–1126. [28] M. R. Garey and D. S. Johnson, Computers and Intractability: A Guide to the Theory of NP-Completeness . W . H. Freeman, 1979. [29] M. Meil ˘ a, “Comparing clusterings—an information based distance, ” Journal of multivariate analysis , vol. 98, no. 5, pp. 873–895, 2007. [30] E. B. Fowlkes and C. L. Mallows, “A method for comparing two hier- archical clusterings, ” J ournal of the American Statistical Association , vol. 78, no. 383, pp. 553–569, 1983. [31] X. Hui and L. Zhongmon, “Clustering validation measures, ” in Data clustering: algorithms and applications , C. C. Aggarwal and C. K. Reddy, Eds., New Y ork: CRC Press, 2013, ch. 23, pp. 571–605. [32] J. H. Chen, E. Linstead, S. J. Swamidass, D. W ang, and P . Baldi, “Chemdb update—full-text search and virtual chemical space, ” Bioin- formatics , vol. 23, no. 17, pp. 2348–2351, 2007. [33] N. Shervashidze, P . Schweitzer, E. J. van Leeuwen, K. Mehlhorn, and K. M. Borgwardt, “Weisfeiler-lehman graph kernels, ” J ournal of Machine Learning Researc h , vol. 12, pp. 2539–2561, 2011. [34] X. Y an, H. Cheng, J. Han, and P . S. Y u, “Mining significant graph patterns by leap search, ” in Pr oceedings of the ACM SIGMOD International Confer ence on Management of Data, SIGMOD 2008, V ancouver , BC, Canada, June 10-12, 2008 , J. T . W ang, Ed., ACM, 2008, pp. 433–444. [35] M. Thoma, H. Cheng, A. Gretton, J. Han, H. Kriegel, A. J. Smola, L. Song, P . S. Y u, X. Y an, and K. M. Borgwardt, “Discriminative frequent subgraph mining with optimality guarantees, ” Statistical Analysis and Data Mining , vol. 3, no. 5, pp. 302–318, 2010. [36] D. A. V . Dyk and M. W elling, Eds., Pr oceedings of the T welfth Inter- national Conference on Artificial Intelligence and Statistics, AIST ATS 2009, Clearwater Beach, Florida, USA, April 16-18, 2009 , vol. 5, ser. JMLR Proceedings, JMLR.org, 2009.
Original Paper
Loading high-quality paper...
Comments & Academic Discussion
Loading comments...
Leave a Comment