EXTRACT: Strong Examples from Weakly-Labeled Sensor Data
Thanks to the rise of wearable and connected devices, sensor-generated time series comprise a large and growing fraction of the world's data. Unfortunately, extracting value from this data can be challenging, since sensors report low-level signals (e…
Authors: Davis W. Blalock, John V. Guttag
EXTRA CT : Strong Examples from W eakly-Labeled Sensor Data Davis W . Blalock, John V . Guttag Computer Science and Artificial Intellegence Laboratory Massachussetts Institute of T echnology Cambridge, MA, USA { dblalock, guttag } @mit.edu Abstract —Thanks to the rise of wearable and connected de- vices, sensor -generated time series comprise a large and growing fraction of the world’ s data. Unf ortunately , extracting value from this data can be challenging, since sensors report low-level signals (e.g., acceleration), not the high-lev el e vents that are typically of interest (e.g ., gestures). W e introduce a technique to bridge this gap by automatically extracting examples of real-world events in low-lev el data, given only a r ough estimate of when these events hav e taken place. By identifying sets of features that repeat in the same temporal arrangement, we isolate examples of such diverse e vents as human actions, power consumption patter ns, and spoken words with up to 96% precision and recall. Our method is fast enough to run in real time and assumes only minimal knowledge of which variables are relevant or the lengths of events. Our evaluation uses numerous publicly a vailable datasets and over 1 million samples of manually labeled sensor data. Index T erms —Sensor data; Semi-supervised learning 1 I . I N T RO D U C T I O N The rise of wearable technology and connected de vices has made av ailable a vast amount of sensor data, and with it the promise of impro vements in ev erything from human health [1] to user interfaces [2] to agriculture [3]. Unfortunately , the raw sequences of numbers comprising this data are often insufficient to offer value. F or example, a smart watch user is not interested in their arm’ s acceleration signal, but rather in having their gestures or actions recognized. Spotting such high-lev el events using low-le vel signals is challenging. Giv en enough labeled examples of the e vents taking place, one could, in principle, train a classifer for this purpose. Unfortunately , obtaining labeled examples is an arduous task [4]–[7]. While data such as images and text can be culled at scale from the internet, most time series data cannot. Furthermore, the uninterpretability of raw sequences of numbers often makes time series dif ficult or impossible for humans to annotate [4]. It is often possible, ho wev er, to obtain appr oximate labels for particular stretches of time. The widely-used human action dataset of [8], for example, consists of streams of data in which a subject is known to hav e performed a particular action roughly a certain number of times, but the exact starts and ends of each action instance are unknown. Furthermore, the 1 This work to appear in IEEE International Conference on Data Mining 2016, ©IEEE 2016. recordings include spans of time that do not correspond to any action instance. Similarly , the authors of the Gun-Point dataset obtained recordings containing dif ferent gestures, but had to expend considerable effort extracting each instance [6]. This issue of knowing that there are examples within a time series but not knowing where in the data the y begin and end is common [4]–[6], [8], [9]. T o leverage these weak labels , we developed an algorithm, EXTRA CT , that efficiently isolates examples of an e vent given only a time series known to contain several occurrences of it. A simple illustration of the problem we consider is given in Figure 1. The various lines depict the (normalized) current, voltage, and other po wer measures of a home dishwasher . Shown are three instances of the dishwasher running, with idleness in between. W ith no prior kno wledge or domain- specific tuning, our algorithm correctly determines not only what this repeating event looks like, but also where it begins and ends. True instances of appliance running Event instances inferred by [10], given prior knowledge 0 200 400 600 800 1000 1200 Minutes Event instances inferred by EXTRACT (proposed) a) b) c) Fig. 1: a ) T rue instances of the dishwasher running (shaded). b ) Ev en when told the length and number of ev ent instances, the r ecent algorithm of [10] returns intervals with only the beginning of the event. c ) Our algorithm retur ns accurate intervals with no such prior knowledge. This is a challenging task, since the variables af fected by the ev ent, as well as the number, lengths, and positions of ev ent instances, are all unkno wns. Further, it is not even clear what objectiv e should be maximized to find an e vent. F or e xample, finding the nearest subsequences using the Euclidean distance yields the incorrect ev ent boundaries returned by [10] (Fig 1b). T o overcome these barriers, our technique leverages three observations: 1. Each subsequence of a time series can be seen as having representativ e features; for example, it may resemble dif fer- ent shapelets [11] or hav e a particular lev el of variance. 2. A repeating e vent will cause a disproportionate number of these features to occur together where the event happens. In Figure 1, for e xample, these features are a characteristic arrangement of spikes in the values of certain variables. 3. If we can identify these features, we can locate each instance of the ev ent with high probability . This holds ev en in the presence of irrelev ant variables (which merely fail to contribute useful features) and unknown instance lengths (which can be inferred based on the interv al over which the features occur together). Our contributions consist of: • A formulation of semi-supervised ev ent discov ery in time series under assumptions consistent with real data. In par - ticular , we allow multiv ariate time series, events that af fect only subsets of variables, and instances of varying lengths. • An O ( N log ( N )) algorithm to discover ev ent instances under this formulation. It requires less than 300 lines of code and is fast enough to run on batches of data in real time. It is also considerably faster , and often much more accurate, than similar existing algorithms [10], [12]. For example, we recognize instances of the abov e dishwasher pattern with an F1 score of ov er 90 %, while the best-performing comparison [10] achiev es under 30 %. • Open source code and labeled time series that can be used to reproduce and e xtend our work. In particular , we believ e that our annotation of the full dishw asher dataset [13] makes this the longest av ailable sensor-generated time series with ground truth ev ent start and end times. I I . D E FI N I T I O N S A N D P RO B L E M Definition II.1. Time Series . A D -dimensional time se- ries T of length N is a sequence of r eal-valued vectors t 1 , . . . , t N , t i ∈ R D . If D = 1 , we call T “univariate” or “one-dimensional, ” and if D > 1 , we call it “multivariate” or “multi-dimensional. ” Definition II.2. Region . A re gion R is a pair of indices ( a, b ) , a ≤ b . The value b − a + 1 is termed the length of the re gion, and the time series t a , . . . , t b is the subsequence for that r e gion. If a re gion reflects an occurrence of the event, we term the re gion an event instance . A. Pr oblem Statement W e seek the set of regions that are most likely to ha ve come from a shared “ev ent” distribution rather than a “noise” distribution. This lik elihood is assessed based on the subset of features maximizing ho w distinct these distributions are (using some fixed feature representation). Formally , let x 1 , . . . , x K be binary feature representations of all K possible regions in a given time series and x j i denote feature j in the region i . W e seek the optimal set of regions R ∗ , defined as: R ∗ = argmax R max F p ( R ) X j ∈F c j ( log ( θ 1 j ) − log ( θ 0 j )) (1) where θ 0 j and θ 1 j are the empirical probabilities for each fea- ture j in the whole time series and the regions R respectiv ely , and c j is the count of feature j , P i ∈R x j i . F is the set of features that best separate the event. The prior p ( R ) is 0 if regions overlap too heavily or violate certain length bounds (see below) and is otherwise uniform. Equation 1 says that we would like to find regions i and features j such that x j i happens both many times (so that c j is large) and much more often than would occur by chance (so that log ( θ 1 j ) − l og ( θ 0 j ) is lar ge). In other words, the best features F are the largest set that consistently occurs across the most regions, and R ∗ is these regions. Giv en certain independencies, this objectiv e is a MAP esti- mate of the regions and features. Because of space constraints, we defer the details to [14]. B. Assumptions W e do not make any of the follo wing common assumptions: • A known number of instances. • A known or constant length for instances. • A known or regular spacing between instances. • A known set of characteristics shared by instances. In particular , we do not assume that all instances hav e the same mean and variance, so we cannot bypass normalization when making similarity comparisons. • That there is only one dimension. • That all dimensions are affected by the ev ent. • Anything about dimensions not affected by the event. So that the problem is well-defined, we do assume that: • The time series contains instances of only one class of e vent. It may contain other transient phenomena, but we take our weak label to mean (only) that the primary structure in the time series comes from the ev ents of the labeled class and that there are no other repeating ev ents. • There are at least two instances of the ev ent, and each instance produces some characteristic (b ut unknown) pattern in the data. • There exist bounds M min and M max , M min > M max / 2 on the lengths of instances. These bounds disambiguate the case where pairs of adjacent instances could be viewed as single instances of a longer ev ent. Similarly , no tw o instances overlap by more than M min − 1 time steps. W e also do not consider datasets in which instances are rare [15]—all time series used in our experiments hav e instances that collectiv ely comprise ∼ 10% of the data or more (though this exact number is not significant). C. Why the T ask is Difficult The lack of assumptions means that the number of possible sets of regions and relev ant dimensions is intractably large. Suppose that we have a D -dimensional time series T of length N and M min ≤ M ≤ M max . There are up to O ( N/ M ) instances, which can collectively start at (at most) N N/ M positions. Further, each can be of O ( M ) dif ferent lengths. Finally , the ev ent may affect any of 2 D − 1 possible subsets of dimensions. Altogether , this means that there are roughly O ( N N/ M · M N/ M · 2 D ) combinations of regions and dimensions. Moreov er , while there may be heuristics or engineered features that could allow isolation of any particular ev ent in any particular domain, we seek to develop a general-purpose tool that requires no coding or tuning by humans. W e therefore do not use such event-specific knowledge. This generality is both a conv enience for human practitioners and a necessity for real-world deployment of a system that learns new e vents at runtime. Lastly , because our aim is to extract examples for future use, we seek to locate full ev ents, not merely the pieces that are easiest to find. I I I . R E L AT E D W O R K Sev eral authors hav e built algorithms to address the diffi- culty of obtaining labeled time series for various tasks. The authors of [6] and [7] cluster univ ariate time series when much of the data in each time series is irrelev ant. They do this by discovering informative shapelets [11] in an unsupervised manner . Their goal is to assign entire time series to various clusters. In contrast, we are interested in assigning a subset of the regions within a single time series to a particular “cluster . ” The Data Dictionaries of [5] are closer to sharing our problem formulation in that they too find class-related sub- sequences within a weakly-labeled time series. Ho wev er , they are interested in frame-le vel, rather than event-le vel, classifi- cation. They also assume a user-specified query length, that all classes are known, and that all variables are relev ant. Methodologically , the algorithms of [16] and [17] are sim- ilar to our own. Howe ver , the former technique assumes all regions of a time series reflect various ongoing phenomenon, and the latter relies on instances sharing a common mean and variance. In terms of representation, the dot plots of [18] are similar to our work, but the authors use them only for human inspection, rather than algorithmic mining. They also require the setting of multiple user-specified parameters. There is also a vast body of work on unsupervised discovery of repeating patterns in time series, typically termed “motif discov ery . ” Most of these works consider uni variate time series and/or the task of finding only the closest pair of regions under some distance measure [19], [20]. Others consider the task of finding multiple motifs and/or refining motif results produced by other algorithms [2], [9], [10], [12], [21], both of which are orthogonal to our work in that they could employ our algorithm as the basic motif-finding subroutine. A fe w motif discovery works seek to find all instances of a giv en event as we do, albeit under different assumptions. The techiques of [10], [22], and [23] do so by finding closest pairs of subsequences at different lengths and then extracting subsequences that are sufficiently similar under an entropy- based measure. Those of [12] and [9] do much the same, although with a distance-based generalization heuristic. All except [23] assume that event instances share a single length, and all but [9] assume that all dimensions are relev ant. W e discuss [10], [12], and [23] further in Section VI. I V . M E T H O D O V E RV I E W In this section we of fer a high-level overvie w of our tech- nique and the intuition behind it, deferring details to Section V. The basic steps are given in Algorithm 1. In step 1, we create a representation of the time series that is in variant to instance length and enables rapid pruning of irrelev ant dimensions. In step 2, we find sets of regions that may contain ev ent instances. In step 3, we refine these sets to estimate the optimal instances R ∗ . Since the main challenge ov ercome by this technique is the lack of information regarding instance lengths, instance start positions, and relev ant dimensions, we elaborate upon these steps by describing how they allow us to deal with each of these unknowns. W e be gin with a simplified approach and build to a sketch of the full algorithm. In particular , we begin by assuming that time series are one-dimensional, instances are nearly identical, and all features are useful. Algorithm 1 EXTRACT 1. T ransform the time series T into a featur e matrix Φ a) Sample subsequences from the time series to use as shape features b) Transform T into Φ by encoding the presence of these shapes across time c) Blur Φ to achie ve length and time w arping inv ariance 2. Using Φ , generate sets of “candidate” windows that may contain event instances a) Find “seed” windows that are unlikely to have arisen by chance b) Find “candidate” windows that resemble each seed c) Rank candidates based on similarity to their seeds 3. Infer the true instances within these candidates a) Greedily construct subsets of candidate windows based on ranks b) Score these subsets and select the best one c) Infer exact instance boundaries within the selected windows A. Unknown Instance Lengths Like most e xisting work, we find e vent instances by search- ing ov er shorter regions of data within the ov erall time series (Fig 2a). Since we do not know how long the instances are, this seemingly requires exhausti vely searching regions of man y lengths [10], [12], [22], so that the instances are sure to be included in the search space. Howe ver , there is an alternativ e. Our approach is to search ov er all regions of a single length M max (the maximum possible instance length) and then refine these approximate regions. For the moment, we defer details of the refinement process. W e refer to this set of regions searched as windows , since they correspond to all positions of a sliding window over the time series. This single-length approach presents a challenge: since windows longer than the instances will contain extraneous data, only parts of these windo ws will appear similar . As an example, consider Figure 2. Although the two windows shown contain identical sine wa ves, the noise around them causes the windows to appear different, as measured by Euclidean distance (the standard measure in most motif discov ery work) (Fig 2b). W orse, because the data must be mean-normalized for this comparison to be meaningful [24], it is not ev en clear what portions of the regions are similar or different—because the noise has altered the mean, ev en the would-be identical portions are offset from one another . Fig. 2: a) A time series containing two ev ent instances. b) Including extra data yields large distances (grey lines) between the windows i and j around the event instances. c) Comparing based on subsequences within these windows allows close matches between the pieces of the sine wav es. Howe ver , while the windows appear different when treated as atomic objects, they hav e many sub-regions (namely , pieces of the sine wav es) that are similar when considered in isolation (Fig 2c). This suggests that if we were to compare the windows based on local characteristics, instead of their global shape, we could search at a length longer than the ev ent and still determine that windows containing event instances were similar . T o enable this, we transform the data into a sparse binary feature matrix that encodes the presence of particular shapes at each position in the time series (Fig 3). Columns of the feature matrix are shown at a coarse granularity for visual clarity–in reality , there is one column per time step. W e defer e xplanation of how these shapes are selected and how this feature matrix is constructed to the next section. Fig. 3: Feature matrix. Each ro w is the pr esence of a particular shape, and each column is a particular time (shown at reduced granularity). Similar regions of data contain the same shapes in roughly the same temporal arrangement. Using this feature matrix, we can compare windows of data without kno wing the lengths of instances. This is because, ev en if there is extraneous data at the ends of the windows, there will still be more common features where the ev ent happens (Fig 4a) than would be expected by chance. Once we identify the windows containing instances, we can recov er the starts and ends of the instances by e xamining which columns in the corresponding windows look suf ficiently similar—if a start or end column does not contain a consistent set of 1s across these windows, it is probably not part of the ev ent, and we prune it (Fig 4b). Unfortunately , this figure is optimistic about the regularity of shapes within instances. In reality , a giv en shape will not necessarily be present in all instances, and a set of shapes may not appear in precisely the same temporal arrangement more than once because of uniform scaling [19] and time warping. W e defer treatment of the first point to a later section, but the second can be remedied with a preprocessing step. Fig. 4: Because the values in the feature matrix are independent of the window length, a window longer than the event can be used to search for instances. T o handle both uniform scaling and time w arping simultane- ously , we “blur” the feature matrix in time. The ef fect is that a giv en shape is counted as being present over an interval, rather than at a single time step. This is shown in Figure 5, using the intersection of the features in two windo ws as a simplified illustration of how similar they are. Since the blurred features are no longer binary , we depict the “intersection” as the elementwise minimum of the windows. B. Dealing with Irrele vant F eatur es Thus far , we ha ve assumed that the shapes encoded in the matrix are all characteristic of the e vent. In reality , we do not know ahead of time which shapes are relev ant, and so there will also be many irrelev ant features. Fortunately , the combination of sparsity and our “intersec- tion” operation causes us to ignore these extra features (Fig 6). T o see this, suppose that the probability of an irrelev ant feature being present at a particular location in an instance-containing window is p 0 . Then the probability of it being present by chance in k windows is ≈ p k 0 . Feature matrices for real-world Fig. 5: Blurring the feature matrix. Despite the second sine wav e being longer and warped in time, the two windows still appear similar when blurred. data are over 90 % zeros, since a given subsequence can only resemble a few shapes. Consequently , p 0 is small (e.g., 0 . 05 ), and p k 0 ≈ 0 ev en for small k . C. Multiple Dimensions The generalization to multiple dimensions is straightfor- ward: we construct a feature matrix for each dimension and concatenate them row-wise. That is, we tak e the union of the features from each dimension. A dimension may not be relev ant, but this just means that it will add irrelev ant features. Thanks to the aforementioned combination of sparsity and the intersection operation, we ignore these features with high probability . Fig. 6: Most irrele vant features are ignor ed after only tw o or thr ee examples, since it is unlik ely f or them to r epeatedly be in the same place in the window . A few “false positives” may remain. D. F inding Instances The previous subsections ha ve described how we construct the feature matrix. In this section, we describe how to use this matrix to find ev ent instances. A summary is giv en in Algorithm 2. The idea is that if we are giv en one “seed” window that contains an instance, we can generate a set of similar “candidate” windo ws and then determine which of these are likely event instances. Since we cannot generate seeds that are certain to contain instances, we generate many seeds and try each. W e defer explanation of how seeds are generated to the next section. Algorithm 2 F indI nstances ( S , X ) 1: Input: S , “seed” windows; X , all blurred windows 2: I best ← {} 3: scor e best ← −∞ 4: for each seed window s ∈ S do 5: // Find candidate windows C based on 6: // dot product with seed window s 7: P ← [ s · ˜ x i , ˜ x i ∈ X ] 8: C ← local M axima ( P ) 9: C ← enf or ceM inimumS pacing ( C , M min ) 10: C ← sortB y D escendingD otP rod ( C , P ) 11: // assess subsets of C 12: for k ← 2 , . . . , |C | do 13: I ← { c 1 , ..., c k } // k best candidates 14: scor e ← computeS cor e ( I , c k +1 ) 15: if scor e > scor e best then 16: scor e best ← score 17: I best ← I retur n I best The main loop iterates through all seeds s and generates sets of candidate windows for each. These candidates are the windows whose dot products with s are local maxima— i.e., they are higher than those of the windo ws just before and after . T o prevent excess overlap, a minimum spacing is enforced between the candidates by only taking the best relativ e maximum in any interv al of width M min (the instance length lo wer bound). If s contains an e vent instance, the resulting candidates should be (and typically are) a superset of the true instance-containing windows. In the inner loop, we assess subsets of the candidates to determine which ones contain instances. Since there are 2 |C | = O (2 N/ M min ) possible subsets, we use a greedy approach that tries only |C | = O ( N/ M min ) subsets. Specifically , we rank the candidates based on their dot products with s and assess subsets that contain the k highest-ranking candidates for each possible k . The final set returned is the highest-scoring subset of candidates for any seed. See Section V -D for an explanation of the scoring function. V . M E T H O D D E TA I L S W e no w describe how the ideas of the pre vious section translate into a concrete algorithm. Throughout this section, let T denote a D -dimensional time series of length N , M min and M max denote the instance length bounds, S denote the set of seed indices, Φ = { φ 1 , . . . , φ N } , φ i ∈ R J denote the feature matrix, and X = { x 1 , . . . , x N − M max +1 } denote the data in Φ for each possible sliding window position; i.e., x i = Φ : ,i : i + M max . Further, let e Φ denote the blurred feature matrix and e X denote the windows of data in e Φ . A. Structure Scor es W e select shape features and seed re gions that appear most likely to hav e been generated by some latent ev ent. Since we lack domain-specific knowledge about what distinguishes such regions, we use the common approach of modeling “non- ev ent” time series as random w alks [10], [15]. Specifically , let T be a univ ariate time series of length N , and W 1 , . . . , W 100 be a collection of 100 Gaussian random walks 2 of length N with σ 2 = E [( t i − t i − 1 ) 2 ] . W e define: str ucture ( T ) = min W 1 N N X i =1 (( t i − µ T ) − ( w i − µ W )) 2 (2) where µ T and µ W are the means of the time series. The score is the minimum squared Euclidean distance to any of the random walks, normalized by mean and length. For multiv ariate time series, we sum the scores for each dimension. This is an approximation to the negati ve log likelihood of T being a random walk, using the optimal σ 2 . B. Constructing the F eatur e Matrix The first step in b uilding the feature matrix is selecting the lengths of the shapes to use as features. Since we do not kno w what length is best, we employ all lengths that are powers of two within the interval [8 , M max ] samples. 8 is used because 2 or 4 samples are not enough to define a meaningful shape. For each length M and each dimension, we select shapes by randomly sampling from the data. T o limit the algorithm’ s complexity to O ( N log( N )) , we select log( N ) subsequences. The probability of each subsequence being selected is propor- tional to its structure score. For each shape j , we construct its row in the feature matrix Φ j by sliding it ov er the data in its dimension and setting the v alue to 1 iff the distance between the shape and the subsequence centered at each position is less than some threshold. This threshold is fixed at 0.25 since this robustly rejects random walk data and consistently worked better than .125 or .5 in preliminary experiments. 3 If a shape has no subsequences within the threshold (other than itself), its ro w is discarded to save computation. The row is also discarded if it is more than half nonzeros, which happens in constant signals. Distances are gi ven by the mean-normalized Euclidean distance squared between the shape and subsequence, di vided by their length and the variance of the shape. T o construct the blurred feature matrix e Φ , we con volve each row with a Hamming filter of length M min . W e then di vide 2 The exact number of walks is unimportant; using larger values (e.g., 1000 or 10,000) has no effect. 3 On small sets of time series not used in the reported experiments. Note too that an all-zero subsequence yields a distance of 1, so the threshold must be a number below this. each entry by the largest value within M min / 2 time steps in its row , so that the maximum value in e Φ remains 1. C. Generating Seed W indows W e generate seeds by finding the start indices associated with the highest structure scores. Concretely , we score each start index t as the sum of the structure scores of the sub- sequences of all power-of-tw o lengths M ∈ [8 , M min ] that begin at t . W e then take the two best start indices at least M min apart. One could use an y constant number of seeds without af fecting the complexity , and we choose two because using more has little or no impact on accuracy . Since these two seeds are unlikely to be e xact instance starts, we add 10 additional seeds on either side of each, spaced M max / 10 apart. 4 This seed generation scheme is a heuristic, b ut we found that it worked better in practice than other heuristics. For example, using the two indices with the best structure scores yielded higher accuracy than using the indices of the closest pair of subsequences under the z-normalized Euclidean distance, as in [10], [12], [22]. If the data contained many subsequences that appeared to be non-random but were not instances, a different heuristic would be required. One could also supply a single known instance start as the lone seed to bypass the need for seed generation entirely . D. Scoring Sets of W indows Recall that we ev aluate sets of candidate windows using a scoring function. The function used is given in Algorithm 3. This returns the value of the objective function (Eq 1), with three alterations: • W e set the probabilities in the “ev ent” model θ 1 using the blurred windows. • W e disallow features for which θ 1 < . 5 , which is the minimum v alue that prev ents the learning of two or more unrelated but frequent sets of features. This resembles a soft “intersection” operation and can be seen as a prior p ( F | θ 1 ) . • W e subtract the log odds of the windows being generated by noise or a “riv al” event ex emplified by the best candidate excluded. See [14] for a probabalistic interpretation of this operation. In lines 1-3, we compute the counts of each feature and con- struct θ 1 based on the data in I . In lines 4-5, we determine the optimal set of features to include assuming irrelev ant features are distributed according to θ 0 . In line 6, we construct a set of weights w for the features. These weights are 0 for features that are not in F and equal to the dif ference between log( θ 1 ) and log( θ 0 ) for those that are. The introduction of w is merely a con venience so that w · c = P j ∈F c j (log( θ 1 j ) − log ( θ 0 j )) , the original objectiv e function. Line 7 computes the value of this objectiv e, which can be seen as the increase in log likelihood from generating the ones in I using θ 1 instead of θ 0 . Line 8 4 If one of the initial two seeds is within M max of an instance start, adding α more seeds M max α apart on either side guarantees that one of them will be within M max 2 α of an instance start. α = 10 is an arbitrary value large enough to av oid overly-spaced seeds missing the start as a source of error . Algorithm 3 computeScore( I , nextI dx ) 1: c ← P i ∈I x i // feature counts 2: e c ← P i ∈I e x i // blurred feature counts 3: θ 1 ← e c / |I | // feature probabilities 4: ∆ ← log θ 1 − log θ 0 // feature weights 5: F ← { j | ∆ j > 0 ∧ θ 1 j > . 5 } // optimal features 6: w ← h ∆ j if j ∈ F else 0 i // feature weight vector 7: odds ev ent ← w · c 8: odds next ← w · x nextI dx · |I | 9: odds noise ← P j ∈F w j · E [ e Φ] · |I | 10: return odds ev ent − max( odds noise , odds next ) computes this increase in odds for the next window excluded, instead of for the supposed instances. Line 9 computes the increase in odds for an average “noise” window . The returned score corresponds to the log odds of a set of instances being generated by an event model versus either ran- dom noise or another e vent ex emplified by the best candidate excluded. See [14] for a more detailed analysis. E. Recovering Instance Bounds Giv en an estimated set of instance-containing window posi- tions I , we compute R by discarding columns in the windows that are no more similar than chance. Let V be the feature weights w in the abo ve algorithm associated with I and reshaped to match the J × M max shape of the window , where J is the number of ro ws in Φ . W e sum the entries in each column of V to produce a set of column scores, and subtract from each score the number of ones that would be expected by chance. This number is equal to J · E [ e Φ] |I |− 1 . W e then extract the maximum subarray of the scores to find the start and end offsets of the “ev ent” within v . W e add these of fsets to the indices in I to get R . This scheme is simple to implement, but does not guarantee optimal offsets. F . Runtime Complexity W e state the following without proof. The deriv ations are av ailable at [14]. Lemma 1. Computing the structure scores for all subse- quences requir es O ( DM max N ) time. Lemma 2. Constructing the featur e matrix r equires O ( DM max N log ( N )) time. Lemma 3. Optimizing the objective given the feature matrix and seeds r equires O ( D M max log( M max ) N log ( N )) time. Since these steps are sequential, the total running time of our algorithm is O ( DM max log( M max ) N log ( N )) . V I . R E S U LT S W e implemented our algorithm, along with baselines from the literature [10], [12], using SciPy [25]. F or the baselines, we JIT -compiled the inner loops using Numba [26]. All code and raw results are publicly available at [14]. Our full algorithm, including feature matrix construction, is under 300 lines of code. T o our kno wledge, our experiments use more ground truth ev ent instances than any similar work. A. Datasets W e used the following datasets (Fig 7), selected on the basis that they were both publicly a vailable and contained repeated instances of some ground truth event, such as a repeated gesture or spoken word. Some of these e vents could be isolated with simpler tech- niques than those considered here—e.g., an appropriately- tuned edge detector could find many of the instances in the TIDIGITS time series. Howe ver , the goal of our work is to find events without requiring users to design featur es and algorithms for each domain or e vent of interest . Thus, we deliberately refrain from exploiting dataset-specific features or prior kno wledge. Moreov er, such kno wledge is rarely suf ficient to solve the problem—even when one knows that ev ents are periodic, contain peaks, etc., isolating their starts and ends programmatically is still challenging. T o aid reproducibility , we supplement the source code with full descriptions of our preprocessing, random seeds, etc., at [14], and omit the details here for brevity . 0 200 400 600 800 1000 1200 4 3 2 1 0 1 2 3 Dishwasher 0 100 200 300 400 500 600 700 800 600 400 200 0 200 TIDIGITS 0 200 400 600 800 1000 0.5 0.0 0.5 1.0 1.5 2.0 2.5 3.0 MSRC-12 0 500 1000 1500 2 0 2 4 6 UCR Fig. 7: Example time series from each of the datasets used. 1) MSRC-12: The MSRC-12 dataset [8] consists of (x,y ,z) human joint positions captured by a Microsoft Kinect while subjects repeatedly performed specific motions. Each of the 594 time series in the dataset is 80 dimensional and contains 8-12 ev ent instances. Each instance is labeled with a single marked time step, rather than with its boundaries, so we use the number of marks in each time series as ground truth. That is, if there are k marks, we treat the first k regions returned as correct. This is a less stringent criterion than on other datasets, but fav ors existing algorithms insofar as they often fail to identify exact ev ent boundaries. 2) TIDIGITS: The TIDIGITS dataset [27] is a large collec- tion of human utterances of decimal digits. W e use a subset of the data consisting of all recordings containing only one type of digit (e.g., only “9”s). W e randomly concatenated sets of 5- 8 of these recordings to form 1604 longer recordings in which multiple speakers utter the same word. As is standard practice [28], we represented the resulting audio using Mel-Frequenc y Cepstral Coefficients (MFCCs) [29], rather than as the raw speech signal. Unlike in the other datasets, little background noise and few transient phenomena are present to elicit false positiv es; ho wever , the need to generalize across speakers and rates of speech makes avoiding false neg ativ es difficult. 3) Dishwasher: The Dishwasher dataset [13] consists of energy consumption and related electricity metrics at a power meter connected to a residential dishwasher . It contains twelve variables and two years worth of data sampled once per minute, for a total of 12.6 million data points. W e manually plotted, annotated, and verified e vent instances across all 1 million+ of its samples. 5 Because this data is 100x longer than what the comparison algorithms can process in a day [10], we follo wed much the same procedure as for the TIDIGITS dataset. Namely , we ex- tracted sets of 5-8 e vent instances, along with the data around them (sometimes containing other transient phenomena), and concatenated them to form shorter time series. 4) UCR: Follo wing [10], we constructed synthetic datasets by planting examples from the UCR Time Series Archiv e [30] in random walks. W e took examples from the 20 smallest datasets (before the 2015 update), as measured by the lengths of their examples. For each dataset, we created 50 time series, each containing fiv e examples of one class. This yields 1000 time series and 5000 instances. B. Evaluation Measur es Let R be the ground truth set of instance re gions and let ˆ R be the set of re gions returned by the algorithm being e valuated. Further let r 1 = ( a 1 , b 1 ) and r 2 = ( a 2 , b 2 ) be two regions. Definition VI.1. I O U ( r 1 , r 2 ) . The Intersection-Over-Union (IOU) of r 1 and r 2 is given by | r 1 ∩ r 2 | / | r 1 ∪ r 2 | , where r 1 and r 2 ar e tr eated as intervals. Definition VI.2. M atch ( r 1 , r 2 , τ ) . r 1 and r 2 ar e said to Match at a thr eshold of τ iff I OU ( r 1 , r 2 ) ≥ τ . Definition VI.3. MatchCount ( ˆ R , R , τ ) . The MatchCount of ˆ R given R and τ is the greatest number of matches at thr eshold τ that can be pr oduced by pairing r e gions in ˆ R with re gions in R such that no re gion in either set is present in more than one pair . 6 Definition VI.4. Precision, Recall , and F1 Score . P r ecision ( ˆ R , R , τ ) = M atchC ount ( ˆ R , R , τ ) / | ˆ R| (3) Recal l ( ˆ R , R , τ ) = M atchC ount ( ˆ R , R , τ ) / |R| (4) F 1( ˆ R , R , τ ) = 2 · P r ecision · Recall P r ecision + Recall (5) C. Comparison Algorithms While none of the techniques we revie wed both seek to solve our problem and operate under assumptions as relaxed as ours, we found that two existing algorithms solving the univ ariate version of the problem could be generalized to the multiv ariate case: 5 See our supporting website [14] for details. 6 Since regions (and their possible matches) are ordered in time, this can be computed greedily after sorting ˆ R and R . 1. Finding the closest pair of subsequences under the z- normalized Euclidean distance, and returning as instances all subsequences within some threshold distance of this pair [9], [12]. In our case, distance is defined as the sum of the distances for each dimension, normalized indi vidually . W e find the closest pair efficiently using the MK algorithm [24] plus the length-pruning technique of Mueen [12]. W e determine the distance threshold using Minnen’ s algorithm [31]. W e call this algorithm Dist . 2. The single-motif-finding subroutine of [10], with distances and description lengths summed over dimensions. This amounts to closest-pair motif discov ery to find seeds, candi- date generation based on Euclidean distance to these seeds, and instance selection using a Minimum Description Length (MDL) criterion. 7 W e call this algorithm MDL . In both cases, we consider v ersions of the algorithms that carry out searches at lengths from M min to M max and use the best result from any length. This means lowest distance in the former case and lowest description length in the latter . In other words, we gi ve them the prior kno wledge that there is exactly one type of e vent to be found, as well as its approximate length. This replaces the heuristics for determining the number of ev ent classes described in the original papers. W e tried many variations of these two algorithms re garding threshold function, description length computation, and other properties, and use the above approaches because they worked the best. D. Instance Discovery Accuracy The core problem addressed by our work is the rob ust location of multiple ev ent instances within a time series kno wn to contain a small number of them. T o assess our effecti veness in solving this problem, we e valuated the F1 score on each of the four datasets, v arying the threshold τ for ho w much ground truth and reported instances needed to ov erlap in order to count as matching. In all cases, M min and M max were set to 1 / 20 and 1 / 10 of the time series length. As sho wn in Figure 8, we outperform the comparison algorithms for virtually all match thresholds on all datasets. Note that MSRC-12 values are constant because instance boundaries are not defined in this dataset (see Section VI-A1). Further , the dataset on which we perform the closest to the comparisons (UCR) is synthetic, univ ariate, and only contains instances that are the same length. These last two attributes are what Dist and MDL were designed for , so the similar F1 scores suggest that EXTRA CT ’ s superiority on other datasets is due to its rob ustness to violation of these conditions. V isual examination of the errors on this dataset suggests that all algorithms have only modest accurac y because there are often regions of random walk data that are more similar in shape to one another than the instances are. The dropof fs in Figure 8 at particular IOU thresholds indicate the typical amount of overlap between reported and 7 In the case of a single e vent type, this maximizes the same objecti ve as [23], but requires fewer closest-pair searches. W e therefore compare only to the subroutine of [10]. 0.0 0.2 0.4 0.6 0.8 1.0 0.0 0.2 0.4 0.6 0.8 1.0 F1 Score Dishwasher 0.0 0.2 0.4 0.6 0.8 1.0 0.0 0.2 0.4 0.6 0.8 1.0 TIDIGITS 0.0 0.2 0.4 0.6 0.8 1.0 Overlap to Match (IOU) 0.0 0.2 0.4 0.6 0.8 1.0 F1 Score MSRC-12 0.0 0.2 0.4 0.6 0.8 1.0 Overlap to Match (IOU) 0.0 0.2 0.4 0.6 0.8 1.0 UCR F1 Score vs Match Threshold EXTRACT MDL Dist Fig. 8: The proposed algorithm is more accurate for virtually all “match” thresholds on all datasets. Shading corresponds to 95% confidence intervals. true instances. E.g., the fact that existing algorithms abruptly decrease in F1 score on the TIDIGITS dataset at a threshold near 0.3 suggests that many of their reported instances only ov erlap this much with the true instances. Our accuracy on real data is not only superior to the com- parisons, but also high in absolute terms (T able 1). Suppose that we consider IOU thresholds of 0.25 or 0.5 to be “correct” for our application. The former might correspond to detecting a portion of a gesture, and the latter might correspond to detecting most of it, with a bit of extra data at one end. At each of these thresholds, our algorithm discovers ev ent instances with an F1 score of over . 9 on real data. T able 1: EXTRA CT F1 Scores are High in Absolute T erms Overlap ≥ . 25 Overlap ≥ . 5 Ours MDL Dist Ours MDL Dist Dishwasher 0.935 0.786 0.808 0.910 0.091 0.191 TIDIGITS 0.955 0.779 0.670 0.915 0.140 0.174 MSRC-12 0.947 0.943 0.714 0.947 0.943 0.714 UCR 0.671 0.593 0.587 0.539 0.510 0.504 An example of our algorithm’ s output on the TIDIGITS dataset is shown in Figure 9. The regions returned (shaded) closely bracket the individual utterances of the digit “0. ” The “Learned P attern” is the feature weights V from Section V -E, which are the increases in log probability of each element being 1 when the window is an ev ent instance. E. Speed In addition to being accurate on both real and synthetic data, our algorithm is also fast. T o assess performance, we recorded the time it and the comparisons took to run on increasingly long sections of random walk data and the raw Dishwasher data. In the first column of Fig 10, we vary only the length of the time series ( N ) and keep M min and M max fixed at 100 and 150. In the second column, we hold N constant at 5000 and vary M max , with M min fixed at M max − 50 0 100 200 300 400 500 600 700 -600 -200 200 Time Series 0 100 200 300 400 500 600 700 Time 0 50 100 150 200 250 Feature Feature Matrix 0 85 0 50 100 150 200 250 Learned Pattern Fig. 9: T op ) Original time series, with instances inferred by EXTRA CT in gray . Bottom ) The feature matrix Φ . Right ) The learned feature weights. These resemble a “blurred” version of the features that occur when the word is spoken. so that the number of lengths searched is constant. In the third column, we fix N at 5000 and set ( M min , M max ) to (150 , 150) , (140 , 160) , . . . , (100 , 200) . 1 0 - 2 1 0 - 1 1 0 0 1 0 1 1 0 2 1 0 3 Dishwasher Dataset 2000 4000 6000 8000 Time Series Length 1 0 - 2 1 0 - 1 1 0 0 1 0 1 1 0 2 1 0 3 Random Walk Dataset 150 250 350 Max Search Length Runtime (min) 20 40 60 80 100 Number of Lengths Searched Runtime (min) Runtime vs Dataset and Search Attributes EXTRACT MDL Dist Fig. 10: The proposed algorithm is one to two orders of magnitude faster than comparisons. Our algorithm is at least an order of magnitude faster in virtually all experimental conditions. Further , it shows little or no increase in runtime as M min and M max are v aried and increases only slowly with N . This is in line with what would be expected giv en our computational complexity , except with ev en less dependence on M max . This deviation is because D log( M max ) log( N ) is an upper bound on the number of features used—the actual number is lower since shapes that only occur once are discarded. This is also why our algorithm is faster on the Random W alk dataset than the Dishwasher dataset; random walks have few repeating shapes, so our feature matrix has few rows. Both Dist and MDL sometimes plateau in runtime thanks to their early-abandoning techniques. Dist ev en decreases because the lo wer bound it employs [12] to prune similarity comparisons is tighter for longer time series. Since they are O ( N 2 ) , they are also helped by the decrease in the number of windows to check as the maximum window length M max increases. This decrease benefits EXTRA CT as well, but to a lesser extent since it is subquadratic. As with accuracy , our technique is fast not only relativ e to comparisons, b ut also in absolute terms—we are able to run the abov e experiments in minutes and search each time series in seconds (even with our simple Python implementation). Since these time series reflect phenomena spanning many seconds or hours, this means that our algorithm could be run in real time in many settings. V I I . D I S C U S S I O N A N D C O N C L U S I O N W e have described an algorithm to ef ficiently and accurately locate instances of an event within a multiv ariate time series giv en virtually no prior information about the nature of this ev ent. In particular, we assume no knowledge of how many times the ev ent has occurred, what features distinguish it, or which v ariables it affects. Using a div erse group of publicly av ailable datasets, we showed that this technique is fast and accurate both in absolute terms and compared to existing algorithms, despite its limited assumptions. Moreov er , while this work has focused on a feature matrix reflecting the presence of particular shapes in the data, our technique could be applied e ven when signals are not described well by shapes—our learning algorithm requires only a sparse feature matrix with entries between 0 and 1. In particular , one could one-hot encode categorical variables such as “day of week” or “user gender” and add these features with no change to the algorithm. W e consider this adaptability a major strength of our approach, since mixed real and categorical variables are common in many domains. In short, by applying our technique to low-le vel signals of various kinds, one can isolate segments of data produced by high-lev el ev ents as div erse as spoken words, human actions, and household appliance usage. V I I I . A C K N OW L E D G E M E N T S This work was supported by NSF Grant 020772-00001. R E F E R E N C E S [1] M. Moazeni, B. Mortazavi, and M. Sarrafzadeh, “Multi-dimensional signal search with applications in remote medical monitoring, ” IEEE BSN 2013 , pp. 1–6, 2013. [2] D. Minnen, T . Starner , I. Essa, and C. Isbell, “Discovering Characteristic Actions from On-Body Sensor Data, ” pp. 11–18, 2006. [3] Y . Chen, A. Why , G. Batista, A. Mafra-Neto, and E. Keogh, “Flying Insect Classification with Inexpensiv e Sensors, ” arXiv .org , Mar. 2014. [4] H. T . Cheng, F . T . Sun, M. Griss, P . Davis, and J. Li, “Nuactiv: Rec- ognizing unseen new activities using semantic attribute-based learning, ” ICMS 2013 , 2013. [5] B. Hu, Y . Chen, and E. Keogh, “Time series classification under more realistic assumptions, ” in SDM 2013 . Philadelphia, P A: Society for Industrial and Applied Mathematics, 2013, pp. 578–586. [6] J. Zakaria, A. Mueen, and E. Keogh, “Clustering time series using unsupervised-shapelets, ” Data Mining (ICDM) , 2012. [7] L. Ulanova, N. Begum, and E. Keogh, “Scalable Clustering of Time Series with U-Shapelets, ” SDM 2015 , pp. 900–908, 2015. [8] S. Fothergill, H. M. Mentis, P . K ohli, and S. Nowozin, “Instructing people for training gestural interactive systems, ” in CHI , J. A. K onstan, E. H. Chi, and K. H ¨ o ¨ ok, Eds. ACM, 2012, pp. 1737–1746. [9] D. Minnen, C. Isbell, I. Essa, and T . Starner, “Detecting Subdimensional Motifs: An Efficient Algorithm for Generalized Multiv ariate Pattern Discovery , ” in ICDM 2007 . IEEE Computer Society , 2007, pp. 601– 606. [10] S. Y ingchareonthawornchai and H. Siv araks, “Efficient proper length time series motif discovery, ” Data Mining (ICDM) , 2013. [11] L. Y e and E. Keogh, “T ime series shapelets: a ne w primiti ve for data mining, ” in ACM SIGKDD 2009 . New Y ork, New Y ork, USA: ACM Request Permissions, Jun. 2009, pp. 947–956. [12] A. Mueen, “Enumeration of T ime Series Motifs of All Lengths, ” in ICDM 2013 . IEEE, 2013, pp. 547–556. [13] S. Makonin, F . Popo wich, L. Bartram, B. Gill, and I. V . Bajic, “AMPds: A public dataset for load disaggregation and eco-feedback research, ” in Electrical P ower & Energy Confer ence (EPEC), 2013 IEEE . IEEE, 2013, pp. 1–6. [14] EXTRACT Homepage. [Online]. A vailable: http://smarturl.it/extract [15] N. Begum and E. Keogh, “Rare time series motif discovery from unbounded streams, ” Pr oceedings of the VLDB Endowment , vol. 8, no. 2, Oct. 2014. [16] J. Serra, M. Muller , P . Grosche, and J. L. Arcos, “Unsupervised Music Structure Annotation by Time Series Structure Features and Segment Similarity, ” IEEE Tr ansactions on Multimedia , vol. 16, no. 5, pp. 1229– 1240, May 2016. [17] M. T oyoda, Y . Sakurai, and Y . Ishika wa, “Pattern discovery in data streams under the time warping distance, ” The VLDB Journal , vol. 22, no. 3, pp. 295–318, Sep. 2012. [18] D. Y ankov , E. Keogh, and S. Lonardi, “Dot plots for time series analysis, ” 17th IEEE International Conference on T ools with Artificial Intelligence (ICTAI’05) , pp. 10 pp.–168, 2005. [19] D. Y ankov , E. K eogh, J. Medina, B. Chiu, and V . Zordan, “Detecting time series motifs under uniform scaling, ” in ACM SIGKDD 2007 . Ne w Y ork, New Y ork, USA: A CM Request Permissions, Aug. 2007, p. 844. [20] J. Lin, E. Keogh, J. Lonardi, and P . Patel, “Finding motifs in time series, ” KDD 02 , 2002. [21] Y . Mohammad, Y . Ohmoto, and T . Nishida, “G-SteX: Greedy Stem Extension for Free-Length Constrained Motif Discovery , ” in Advanced Resear ch in Applied Artificial Intelligence . Berlin, Heidelberg: Springer Berlin Heidelberg, 2012, pp. 417–426. [22] P . Nunthanid, V . Niennattrakul, and C. A. Ratanamahatana, P arameter - fr ee motif discovery for time series data . IEEE, 2012. [23] T . Rakthanmanon, E. J. K eogh, S. Lonardi, and S. Ev ans, “Time Series Epenthesis: Clustering Time Series Streams Requires Ignoring Some Data, ” in ICDM ’11: Proceedings of the 2011 IEEE 11th International Confer ence on Data Mining . IEEE Computer Society , Dec. 2011, pp. 547–556. [24] A. Mueen, E. J. K eogh, Q. Zhu, S. Cash, and M. B. W estover , “Exact Discovery of T ime Series Motifs.” SDM , 2009. [25] E. Jones, T . Oliphant, and P . Peterson, “SciPy: Open source scientific tools for Python, ” 2014. [26] T . Oliphant, “Numba python bytecode to LL VM translator , ” in Proceed- ings of the Python for Scientific Computing Conference (SciPy) , 2012. [27] R. G. Leonard and G. Doddington, “T idigits speech corpus, ” T exas Instruments, Inc , 1993. [28] D. Minnen, C. L. Isbell, I. Essa, and T . Starner, “Discovering multi- variate motifs using subsequence density estimation and greedy mixture learning, ” in AAAI 07 . AAAI Press, Jul. 2007. [29] B. McFee, C. Raf fel, D. Liang, D. P . Ellis, M. McV icar, E. Battenberg, and O. Nieto, “librosa: Audio and Music Signal Analysis in Python, ” in Pr oceedings of the 14th Python in Science Conference , 2015. [30] E. J. Keogh, Q. Zhu, B. Hu, Y . Hao, X. Xi, L. W ei, and C. A. Ratanamahatana. (2011) The UCR T ime Series Classification/Clustering Homepage. [Online]. A vailable: http://www .cs.ucr.edu/ ∼ eamonn/time series data/ [31] D. Minnen, T . Starner, I. Essa, and C. Isbell, “Improving Activity Discovery with Automatic Neighborhood Estimation, ” pp. 1–6, Nov . 2006.
Original Paper
Loading high-quality paper...
Comments & Academic Discussion
Loading comments...
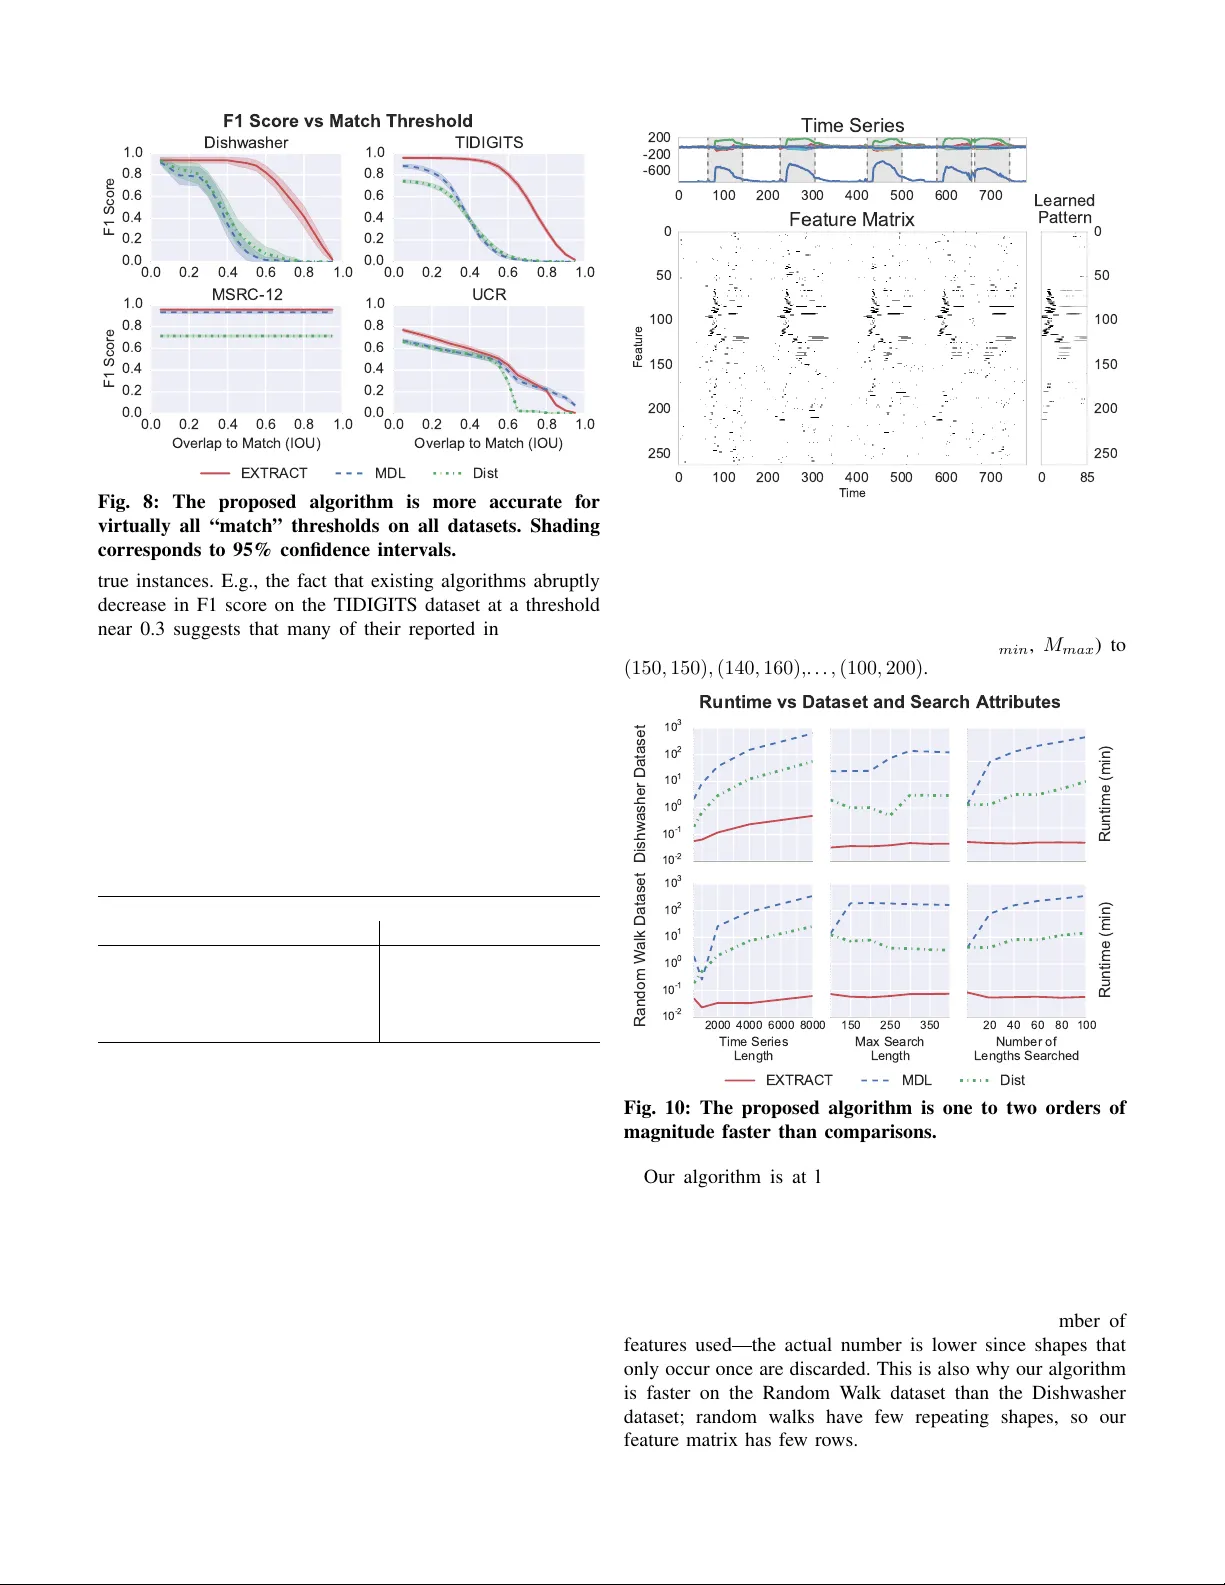
Leave a Comment