Missing Data Estimation in High-Dimensional Datasets: A Swarm Intelligence-Deep Neural Network Approach
In this paper, we examine the problem of missing data in high-dimensional datasets by taking into consideration the Missing Completely at Random and Missing at Random mechanisms, as well as theArbitrary missing pattern. Additionally, this paper emplo…
Authors: Collins Leke, Tshilidzi Marwala
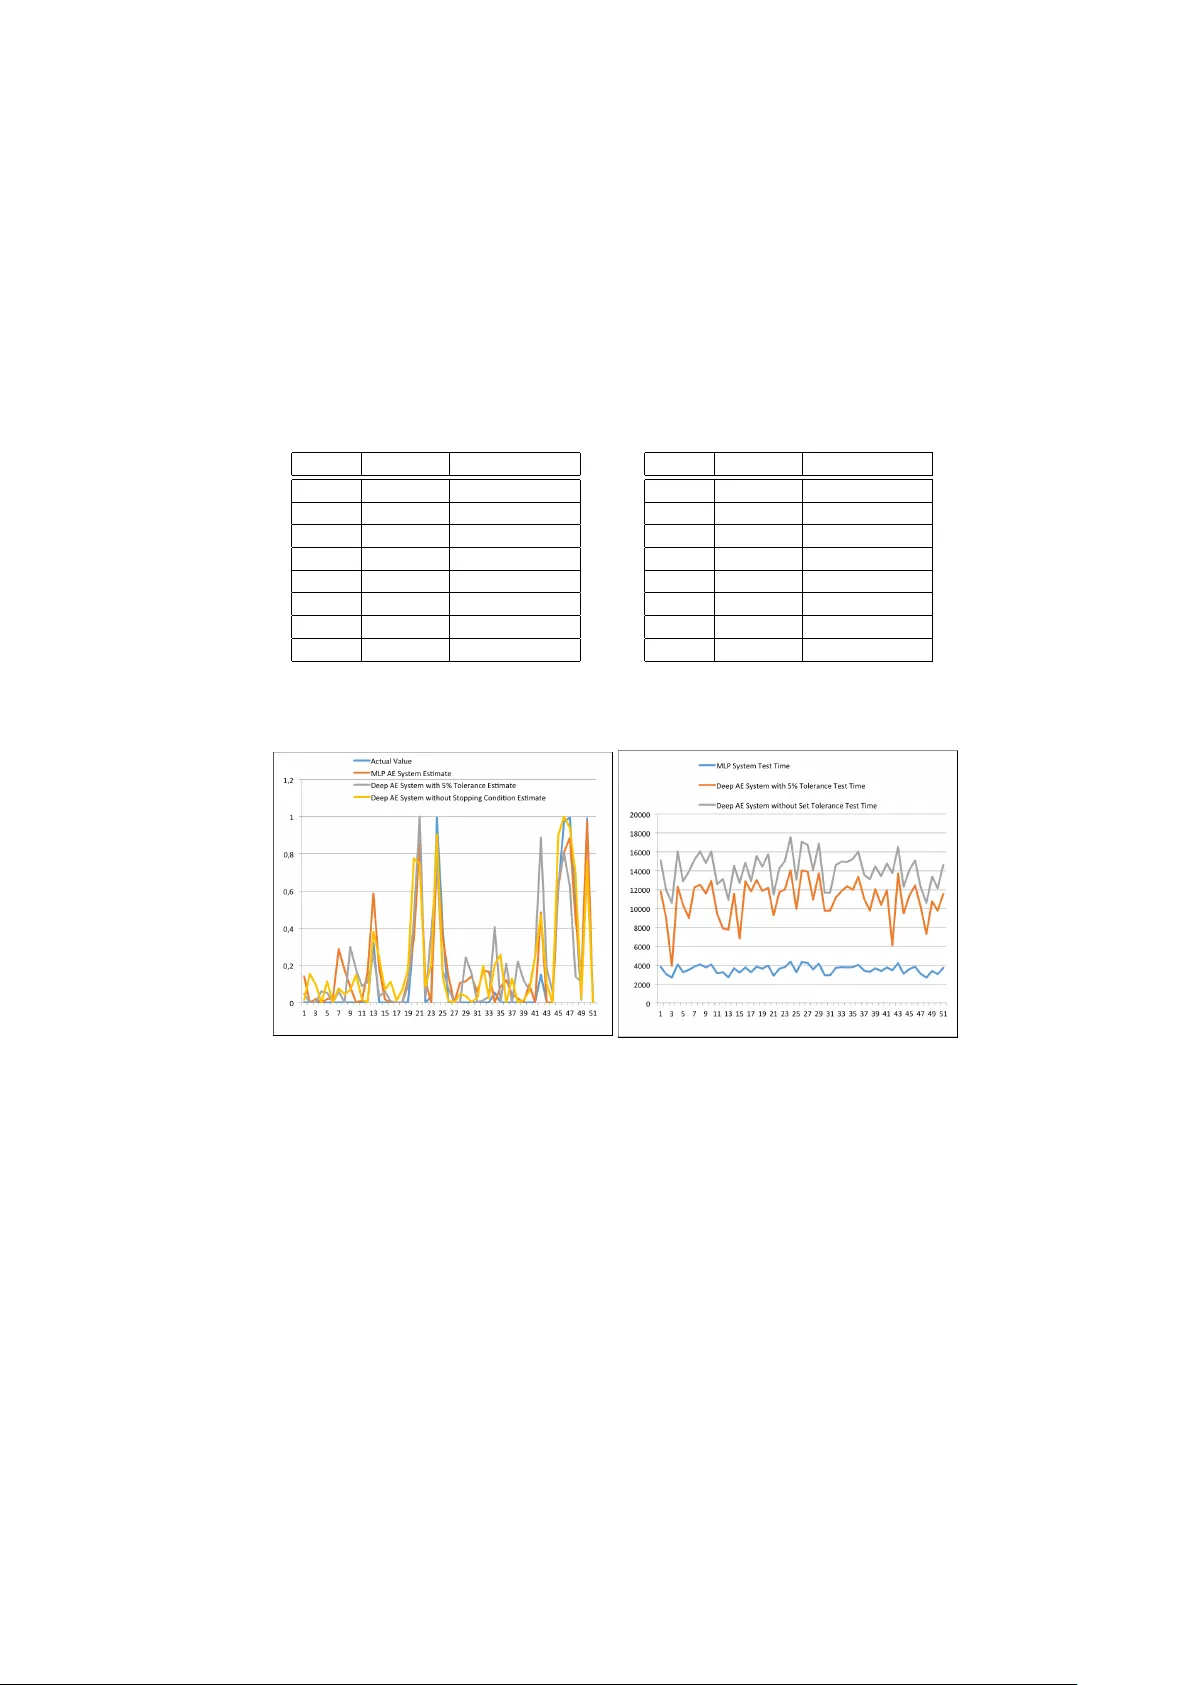
Missing Data Estimation in High-Dimensional Datasets: A Sw arm In telligence-Deep Neural Net w ork Approac h Collins Lek e and Tshilidzi Marwala Univ ersity of Johannesburg, Johannesburg, South Africa {collinsl, tmarwala}@uj.ac.za Abstract. In this pap er, w e examine the problem of missing data in high-dimensional datasets b y taking in to consideration the Missing Com- pletely at Random and Missing at Random mechanisms, as well as the Arbitrary missing pattern. Additionally , this pap er employs a metho dol- ogy based on Deep Learning and Sw arm In telligence algorithms in order to provide reliable estimates for missing data. The deep learning tec h- nique is used to extract features from the input data via an unsup ervised learning approach b y modeling the data distribution based on the input. This deep learning technique is then used as part of the ob jective func- tion for the swarm intelligence tec hnique in order to estimate the missing data after a sup ervised fine-tuning phase by minimizing an error func- tion based on the interrelationship and correlation b et ween features in the dataset. The in vestigated metho dology in this paper therefore has longer running times, how ever, the promising p oten tial outcomes justify the trade-off. Also, basic kno wledge of statistics is presumed. Keyw ords: Missing Data, Deep Learning, Swarm In telligence, High- Dimensional Data, Sup ervised Learning, Unsup ervised Learning 1 In tro duction Previous researc h across a wide range of academic fields suggests that decision- making and data analysis tasks are made nontrivial by the presence of missing data. As suc h, it can b e assumed that decisions are likely to be more accurate and reliable when complete/represen tative datasets are used instead of incom- plete datasets. This assumption has led to a lot of research in the data mining domain, with nov el techniques b eing dev elop ed to p erform this task accurately [1]-[9]. Research suggests that applications in v arious professional fields such as in medicine, manufacturing or energy that use sensors in instruments to rep ort vital information and enable decision-making processes may fail and lead to in- correct outcomes due to the presence of missing data. In suc h cases, it is v ery imp ortan t to ha ve a system capable of imputing the missing data from the failed sensors with high accuracy . The imputation pro cedure will require the approx- imation of missing v alues taking in to account the in terrelationships that exist b et w een the data from sensors in the system. Another instance where the pres- ence of missing data poses a threat in decision-making is in image recognition systems, whereb y the absence of pixel v alues renders the image prediction or classification task difficult and as such, systems capable of imputing the missing v alues with high accuracy are needed to make the task more feasible. Fig. 1. Sample of MNIST Dataset. T op Row - Real Data: Bottom Row - Data With Missing Pixel V alues Consider a high dimensional dataset such as the Mixed National Institute of Standards and T ec hnology (MNIST) dataset with 784 feature v ariables b eing the pixel v alues as shown in Fig. 1 abov e. Assuming that pixel v alues are missing at random as observ ed in the b ottom ro w and a statistic analysis is required to classify the ab o ve dataset, the questions of interest would b e: (i) Can we impute with some degree of certaint y the missing data in high dimensional datasets with high accuracy? (ii) Can new techniques be introduced for appro ximation of the missing data when correlation and interrelationships b et ween the v ari- ables are considered? This pap er therefore aims to use a Deep Learning (DL) tec hnique built with Restricted Boltzmann machines stac k ed together to form an autoenco der in tandem with a swarm intelligence (SI) algorithm to estimate the missing data with the mo del created which would cater to the mechanisms of interest and the arbitrary pattern. The dataset used is the MNIST database of handwritten digits by Y ann LeCun [10]. It has a training set of 60,000 sample images and a test set of 10,000 sample images with 784 features. These images sho w handwritten digits from 0 to 9. Due to the fact that the research discussed in this paper w as conducted at a time when there was little or no in terest in the DL-SI missing data predictors on high dimensional data, this pap er seeks to exploit the use of this tec hnique on the MNIST dataset. The remainder of this pap er is structured as follows, Section 2 in tro duces missing data, the deep learning tec hniques used as w ell as the swarm in telligence algorithm implemented. This section also presents related work in the domain. Section 3 presents the exp erimen tal design and pro cedures used, while Section 4 fo cuses on the results and key findings from the exp erimen ts conducted in this article. Discussions, concluding remarks and suggestions for future research are further presen ted in Section 5. 2 Bac kground This article implements a Deep Learning technique referred to as a Stack ed Auto encoder built using Restricted Boltzmann machines, all of which ha ve b een individually trained using the Con trastive Divergence algorithm and stac ked together in a b ottom-up manner. The estimation of missing v alues is p erformed b y using the Firefly Algorithm, whic h is the sw arm in telligence method. Ho wev er, this article will first briefly discuss the metho ds used and the problem it aims to solv e. 2.1 Missing Data and Deep Learning Missing data is a situation whereby some features within a dataset are lack- ing comp onen ts [11]. With this ensues problems in application domains that rely on the access to complete and quality data which can affect ev ery aca- demic/professional fields and sectors. T echniques aimed at rectifying the prob- lem hav e b een an area of researc h in several disciplines [11]-[13]. The manner in whic h data p oin ts go missing in a dataset determines the approac h to b e used in estimating these v alues. As p er [13], there exist three missing data mec ha- nisms. This article fo cuses on inv estigating the Missing Completely at Random (MCAR) and Missing at Random (MAR) mechanisms. Previous research sug- gests that MCAR scenario arises when the chances of there being a missing data en try for a feature is not dep enden t on the feature itself or on any of the other features in the dataset [4]. This implies a lack of correlation or cross-correlation b et w een features including the feature of interest [11]. MAR on the other hand arises when missingness in a sp ecific feature is reliant up on the other features within the dataset, but not the feature of interest itself [4]. According to [13], there are t wo main missing data patterns. These are the arbitrary and monotone missing data patterns. In the arbitrary pattern, missing observ ations may o ccur an ywhere and the ordering of the v ariables is of no imp ortance. In monotone missing patterns, the ordering of the v ariables is of imp ortance and o ccurrence is not random. Based upon this realization, this article will go on to fo cus on the arbitrary missing pattern. Deep Learning comprises of sev eral algorithms in mac hine learning that make use of a cataract of nonlinear processing units organized in to a num b er of lay ers that extract and transform features from the input data [14], [15]. Each of the la yers use the output from the previous lay er as input and a sup ervised or unsu- p ervised algorithm could b e used in the training phase. With these come appli- cations in sup ervised and unsup ervised problems like classification and pattern analysis, resp ectiv ely . It is also based on the unsup ervised learning of m ultiple lev els of features or representations of the input data whereb y higher-level fea- tures are obtained from lo wer lev el features to yield a hierarc hical represen tation of the data [15]. By learning multiple levels of representations that depict differ- en t levels of abstraction of the data, w e obtain a hierarch y of concepts. In this article, the Deep Learning tec hnique used is the Stack ed AutoEnco der. 2.2 Restricted Boltzmann Machine (RBM) Firstly , a Boltzmann machine (BM) is an undirected net work with no des p os- sessing sto c hastic traits that can b e described as a neural netw ork. It is used amongst other things to extract vital information from an unknown probability distribution using samples from the distribution, whic h is generally a difficult pro cess [16]. This learning pro cess is made simple by implementing restrictions on the net work structure leading to Restricted Boltzmann mac hines (RBMs). An RBM can b e describ ed as an undirected, probabilistic, parameterized graphical mo del also known as a Marko v random field (MRF). RBMs b ecame techniques of interest after b eing suggested as comp onen ts of m ulti-lay er top ologies termed deep net works [16]. The idea is that hidden no des extract vital information from the observ ations, which subsequen tly represen t inputs to the next RBM. Stac king these RBMs together has as ob jectiv e, obtaining high lev el represen- tations of data b y learning features from features. An RBM which is also an MRF asso ciated with a bipartite undirected graph consists of m visible no des, V = ( V 1 , ..., V m ) representing input data, and n hidden no des, H = ( H 1 , ..., H n ) capturing interdependencies b et w een features in the input lay er [16]. In this article, the features V ha ve as v alues, v ∈ [0 , 1] m + n , while H hav e as v alues, h ∈ { 0 , 1 } m + n . The distribution giv en b y the Gibbs distribution has as energy function [16]: E ( v , h ) = − h T W v − b T v − c T h . (1) In scalar form, (1) is expressed as [16]: E ( v , h ) = − n X i =1 m X j =1 w ij h i v j − m X j =1 b j v j − n X i =1 c i h i . (2) In (2), w ij , which is the most imp ortan t part of an RBM mo del is a real v alued w eight b et ween units V j and H i , while b and c are the bias terms for the visible and hidden v ariables, respectively . If w ij is negative, and v j and h i are equal to one, the probability decreases leading to a high energy . On the contrary , if w ij is p ositiv e, and v j and h i are equal to zero, the probability increases leading to a lo wer energy . If b j is negativ e and v j = 1, E increases leading to a lo w probabilit y . Therefore, there is a preference for v j = 0 instead of v j = 1. How ev er, if b j is p ositiv e and v j = 0, E decreases leading to a high probability , and a preference for v j = 1 instead of v j = 0. A negative b j v alue decreases the second term in (2), while a p ositiv e v alue for b j increases this second term. The same applies for c i and the third term in (2). The Gibbs distributions or probabilities from (1) or (2) are then obtained b y [16]: p ( v , h ) = e − E ( v,h ) Z = e ( h T W v + b T v + c T h ) Z = e ( h T W v ) e ( b T v ) e ( c T h ) Z . (3) Here, the exp onen tial terms are factors of a mark ov netw ork with vector no des, while Z is the intractable partition function. It is intractable courtesy of the exp onen tial num ber of v alues it can take. F or an RBM, Z = P v ,h e − E ( v,h ) . Another key aspect of RBMs is that h is conditionally indep enden t of v and vice v ersa, due to the fact that there are no connections b et w een no des in the same la yer. This prop ert y is expressed mathematically as [16]: p ( h | v ) = n Y i =1 p ( h i | v ) and p ( v | h ) = m Y i =1 p ( v i | h ) . (4) 2.3 Con trastive Div ergence (CD) The ob jective in training an RBM is to minimize the av erage negative log- lik eliho od (loss) without regularization using a sto c hastic gradient descent algo- rithm as it scales well with high-dimensional datasets. Achieving this ob jectiv e requires the partial deriv ativ e of any parameter, θ , of the loss function as p er the follo wing equation: ∂ − log p v ( t ) ∂ θ = E h " ∂ E v ( t ) , h ∂ θ | v ( t ) # − E v ,h ∂ E ( v , h ) ∂ θ . (5) The first term in (5) is the exp ectation ov er the data distribution and is referred to as the positive phase, while v and h represent the same v ariables as in (1)- (4). The second term, whic h is the exp ectation o ver the mo del distribution is termed the negative phase. This phase is hard to compute and also intractable b ecause an exp onen tial sum is required ov er b oth h and v . F urthermore, many sampling steps are needed to obtain unbiased estimates of the log-lik eliho od gradien t. Ho wev er, it has been shown recen tly that running a mark ov c hain for just a few steps leads to estimates that are sufficien t for training a mo del [16]. This approac h has led to the con trastive divergence (CD) algorithm. CD is a training metho d for undirected probabilistic graphical mo dels with the idea b eing to do aw ay with the double exp ectations in the negative phase in (5) and instead fo cus on estimation. It basically implements a Monte-Carlo estimate of the exp ectation ov er a single input data p oin t. The idea of k -step CD (CD- k ) is that rather than the second term b eing approximated in (5) by a sample from the mo del distribution, k steps of a Gibbs c hain is run, with k frequently set to 1 [16]. The Gibbs chain starts with a training sample v (0) of the training data and returns v ( k ) after k steps [16]. Eac h step, t , entails sampling h ( t ) from p ( h | v ( t ) ), then obtaining samples v ( t +1) from p ( v | h ( t ) ) [16]. F or one training pattern, v (0) , the log-lik eliho od gradient w.r.t. θ is approximated b y [16]: C D k ( θ , v (0) ) = − X h p ( h | v (0) ) ∂ E ( v (0) , h ) ∂ θ + X h p ( h | v ( k ) ) ∂ E ( v ( k ) , h ) ∂ θ . (6) Due to the fact that v ( k ) is not a obtained from the stationary mo del distribution, the approximation (6) is biased. The bias in effect fades aw a y as k − → ∞ [16]. Another aspect that p oin ts to CD b eing biased is that it maximizes the difference b et w een tw o Kullbac k-Liebler (KL) divergences [16]: K L ( q | p ) − K L ( p k | p ) . (7) Here, the exp erimen tal distribution is q and the distribution of the visible v ari- ables after k steps of the Marko v chain is p k [16]. If stationarity in the execution of the chain is already attained, p k = p holds, and therefore K L ( p k | p ) = 0, and the error of the appro ximation by CD fades aw ay [16]. 2.4 Auto encoder (AE) An Autoenco der is an artificial neural netw ork that attempts to repro duce its input at the output lay er. The basic idea b ehind auto encoders is that the map- ping from the input to the output, x ( i ) 7→ y ( i ) rev eals vital information and the essen tial structure in the input v ector x ( i ) that is otherwise abstract. An autoen- co der takes an input vector x and maps it to a hidden representation y via a deterministic mapping function f θ of the form f θ ( x ) = s ( W x + b ) [17]. The θ parameter comprises of the matrix of weigh ts W and the vector of offsets/biases b . s is the sigmoid activ ation function expressed as: s = 1 1 + e − x . (8) The hidden representation y is then mapp ed to a reconstructed vector z whic h is obtained b y the functions [16]: z = g θ 0 ( y ) = s ( W 0 y + b 0 ) or z = g θ 0 ( y ) = W 0 y + b 0 . (9) Here, the parameter set θ 0 comprises of the transpose of the matrix of weigh ts and v ector of biases from the enco der prior to the fine-tuning phase [17]. When the aforementioned transp osition of weigh ts is done, the auto encoder is said to ha ve tied w eights. z is not explained as a rigorous regeneration of x but instead as the parameters of p ( X | Z = z ) in probabilistic terms, which may yield x with high probabilit y [17]. This thus leads to: p ( X | Y = y ) = p ( X | Z = g θ 0 ( y )) . (10) F rom this, we obtain a reconstruction error which is to b e optimized by the optimization technique and is of the form L ( x, z ) ∝ − l og p ( x | z ). This equation as p er [18] could also b e expressed as: δ AE ( θ ) = X t L x ( t ) , g θ f θ x ( t ) . (11) 2.5 Firefly Al gorithm (F A) F A is a nature-inspired metaheuristic algorithm based on the flashing patterns and b eha vior of fireflies [19]. It is based on three main rules b eing: (i) Fireflies are unisex so all fireflies are attracted to all other fireflies, (ii) Attractiv eness is prop ortional to the brightness and they b oth decrease as the distance increases. The idea is the less brighter firefly will mov e tow ards the brighter one. If there is no obvious brighter firefly , they mov e randomly , and, (iii) Brightness of a firefly is determined by the landscap e of the ob jective function [19]. Considering that attractiv eness is prop ortional to light in tensity , the v ariation of attractiveness can b e defined with resp ect to the distance as [19]: β = β 0 e − γ r 2 . (12) In (12), β is the attractiveness of a firefly , β 0 is the initial attractiveness of a firefly , and r is the distance b et ween tw o fireflies. The mov emen t of a firefly to wards a brighter one is determined b y [19]: x t +1 i = x t i + β 0 e − γ r 2 ij x t j − x t i + α t t i . (13) Here, x i and x j are the p ositions of tw o fireflies, and the second term is due to the attraction b et w een the fireflies. t and t + 1 represent differen t time steps, α is the randomization parameter controlling the step size in the third term, while is a v ector with random n umbers obtained from a Gaussian distribution. If β 0 = 0, the mo v ement is then a simple random w alk [19]. If γ = 0, the mo vemen t reduces to a v arian t of the particle swarm optimization algorithm [19]. The parameters used in this research are: (i) n = num b er of missing cases p er sample, (ii) 1000 iterations, (iii) α = 0 . 25, (iv) β = 0 . 2 and (v) γ = 1. The parameters were selected as they yielded the more optimal results after exp erimem tation with differen t p erm utations and combinations of v alues. The F A algorithm is used b ecause although it has b een successfully applied in a num ber of domains such as digital image compression, eigen v alue optimization, feature selection and fault detection, sc heduling and TSP , etc., its efficiency has not been inv estigated in missing data estimation tasks on high-dimensional datasets. 2.6 Related W ork W e present some of the work that has b een done by researchers to address the problem of missing data. The research done in [1] implements a hybrid genetic algorithm-neural net work system to perform missing data imputation tasks with v arying num b er of missing v alues within a single instance while [2] creates a h y- brid k-Nearest Neigh b or-Neural Net work system for the same purp ose. In [4], a h ybrid Auto-Asso ciativ e neural netw ork or auto encoder with genetic algorithm, sim ulated annealing and particle sw arm optimization model is used to impute missing data with high lev els of accuracy in cases where just one feature v ari- able has missing input entries. In some cases, neural netw orks were used with Principal Comp onen t Analysis (PCA) and genetic algorithm as in [5]-[6]. In [7], they use robust regression imputation for missing data in the presence of outliers and in vestigate its effectiveness. In [8], it is suggested that information within incomplete cases, that is, instances with missing v alues b e used when estimat- ing missing v alues. A nonparametric iterativ e imputation algorithm (NIIA) is prop osed that leads to a ro ot mean squared error v alue of at least 0.5 on the imputation of contin uous v alues and a classification accuracy of at most 87.3% on the imputation of discrete v alues with v arying ratios of missingness. In [9], the shell-neigh b or method is applied in missing data imputation b y means of the Shell-Neigh b or Imputation (SNI) algorithm which is observ ed to p erform b etter than the k-Nearest Neighbor imputation metho d in terms of imputation and classification accuracy as it takes into accoun t the left and right nearest neigh- b ors of the missing data as well as v arying n umber of nearest neighbors contrary to k-NN that considers just fixed k nearest neighbors. In [20], a multi-ob jectiv e genetic algorithm approac h is presen ted for missing data imputation. It is ob- serv ed that the results obtained outp erform some of the w ell kno wn missing data metho ds with accuracies in the 90 p ercen tile. Nov el algorithms for missing data imputation and comparisons betw een existing techniques can be found in pap ers suc h as [20]-[27]. 3 Exp erimen tal Design and Pro cedure In the design of the exp erimen ts, MA TLAB R2014a softw are was used on a Dell Desktop computer with Intel(R) Core(TM) i3-2120 CPU @ 3.30GHz pro cessor, 4.00 GB RAM, 32 GB virtual RAM, 64-bit Op erating System running Windows 8.1 Pro. Additionally , the MNIST database was used and it contains 60,000 training images and 10,000 test images. Each of these images is of size 28 × 28 = 784 pixels. This results in a training set of size 60000 × 784 and a test of size 10000 × 784. Data prepro cessing was p erformed normalizing all pixel v alues in the range [0, 1]. The individual netw ork lay ers of the Deep AE were pretrained using RBMs and CD to initialize the w eights and biases in a goo d solution space. The individual lay ers pretrained were of size 784 − 1000, 1000 − 500, 500 − 250, and 250 − 30. These are stack ed and subsequen tly transposed to obtain the enco der and deco der parts of the autonco der netw ork, resp ectiv ely . The resulting netw ork architecture is of size, 784 − 1000 − 500 − 250 − 30 − 250 − 500 − 1000 − 784, with an input and output lay er with the same num b er of no des, and seven hidden la yers with v arying num b er of no des. The netw ork is then fine-tuned using bac kpropagation, minimizing the mean squared net work error. The error v alue obtained after training is 0.0025. The training is done using the entire training set of data that are divided into 600 balanced mini-batches. The w eight and bias up dates are done after ev ery mini-batc h. T raining higher la yers of weigh ts is achiev ed by having the real-v alued activ ations of the visible no des in preceeding RBMs being transcrib ed as the activ ation probabilities of the hidden no des in lo wer level RBMs. The Multilay er P erceptron (MLP) AE has an input and output la y er, both consisting of 784 no des, and one hidden la yer consisting of 400 no des obtained by experimenting with different n umbers of no des in the hidden lay er, and observing which architecture leads to the low est mean squared netw ork error. A 784 − 400 − 784 netw ork architecture led to the lo west mean squared net work error v alue of 0.0032. The hidden and output la yer activ ation function used is the sigmoid fun tion. The training is done using the scaled conjugate gradient descen t algorithm for 1000 ep ochs. Missingness in the test set of data is then created at random according to the MAR and MCAR mechanisms, as w ell as the arbitrary pattern, and these missing v alues are approximated using the swarm intelligence algorithm which has as ob jective function minimizing the loss function of the fine-tuned netw ork. The tolerance error is intially set to 0.05 (5% ) in one of the netw orks, and is considered reasonable for a first time inv estigation of the prop osed metho d. The ov erall approac h consist of four consecutive steps b eing: 1. T rain the individual RBMs on a training set of data with complete records us- ing the greedy la yer-b y-la yer pre-training algorithm described in [28] starting from the b ottom lay er. Each lay er is trained for 50 epo c hs with the learning rate for the w eights, visible unit biases and hidden unit biases set to 0.1. The initial and final momentum are set to 0.5 and 0.9, resp ectiv ely . The final parameter is the w eight cost which is set to 0.0002. 2. Stac k the RBMs to form the Enco der and Decoder phases of a Deep Au- to encoder with tied weigh ts. 3. Fine-tune the Deep Auto encoder using bac k-propagation for 1000 ep ochs through the en tire set of training data. 4. Estimate the missing data with the fine-tuned deep netw ork as part of the ob jective function in the Firefly Algorithm parsing the kno wn v ariable v alues to the ob jectiv e function, while first estimating the unknown v alues b efore parsing these estimates to the ob jective function. The estimation pro cedure is terminated when a stopping criterion is achiev ed, which is either an error tolerance of 5% (0.05), or the maxim um n umber of function ev aluations b eing attained. 4 Exp erimen tal Results In the inv estiagtion of the imputation technique, w e used the test set of data whic h con tained missing data entries accounting for approximately 10% of the data. W e present in T ables 1 and 2, Actual, Estimate and Squared Error v alues from the prop osed Deep Auto encoder system without tolerance (T able 1), and from MLP Auto encoder system (T able 2). The distance, , from the estimate to the actual v alue, added to the squared error are parameters that determine the p erformance of the metho d. In all cases presented in b oth tables, the Deep Au- to encoder system sho ws d = 0 , 0 . 0608 , 0 , 0 . 0275 , 0 , 0 . 0922 , 0 . 0009 , 0 . 0283, while for the same entries (actual v alues), the MLP Autoenco der sho ws that m = 0 . 0246 , 0 . 2646 , 0 . 0149 , 0 . 1643 , 0 , 0 . 1982 , 0 . 0509 , 0 . 0473, resp ectiv ely . They sho w b et- ter performance of the prop osed technique without a set error tolerance when compared to the existing MLP Auto encoder. This knowledge is v alidated by the squared error which is alwa ys smaller for the prop osed tec hnique, for all cases presen ted in T ables 1 and 2. W e could consider this enough to conclude of on the p erformance of b oth compared tec hniques, but w e need to analyse the pro cessing time, which seems to be better for the existing method when compared to the prop osed Deep Auto enco der system. This is demonstrated by Fig. 3, where we compare pro cessing times for b oth techniques. It is evident that setting an error tolerance v alue mak es the estimation pro cess faster as observed in Fig. 3. How- ev er, this is at the exp ense of accuracy which is the main asp ect in such a task as seen in Fig. 2. The bigger the error tolerance v alue, the faster the estimation of the missing data. T able 1. Actual, Estimated and Squared Error V alues from Deep Auto encoder Sys- tem without Set T olerance. Actual Estimate Squared Error 0 0 0 0.3216 0.3824 0.0037 0 0 0 0.9725 1 0.0008 0 0 0 0.9961 0.9039 0.0085 0.0509 0.0500 8.38e-07 0.5765 0.6048 0.0008 T able 2. Actual, Estimated and Squared Error V alues from MLP Autoenco der Sys- tem without Set T olerance. Actual Estimate Squared Error 0 0.0246 0.0006 0.3216 0.5862 0.0700 0 0.0149 0.0002 0.9725 0.8082 0.0270 0 0 0 0.9961 0.7979 0.0393 0.0509 0 0.0026 0.5765 0.5292 0.0022 Fig. 2. Actual vs Estimated V alues. Fig. 3. T est Times p er Sample. 5 Discussion and Conclusion This pap er inv estigates the use of a deep neural netw ork with a swarm intelli- gence algorithm to impute missing data in a high-dimensional dataset. According to the arbitrary missing data pattern, MAR and MCAR mechanisms, missing data could o ccur anywhere in the dataset. The experiment in this paper con- siders a scenario in which 10% of the test set of data is missing. These v alues are to b e estimated with a set error tolerance of 5%, as well as no set error tolerance. Also, the prop osed metho d is compared to an MLP Auto enco der esti- mation system. The results obtained reveal that the prop osed system yields the more accurate estimates, esp ecially when there is no set error tolerance v alue. This is made evident when the distance and squared error v alues are considered. The AE systems both yield b etter estimates than the MLP system. Ho wev er, with these accurate estimates come longer running times which are observed to b ecome smaller when error tolerance v alues are set. The bigger the tolerance v alue, the smaller the running time. Based on the findings in this article, we in tend to p erform an in-depth parameter analysis in an y future research in order to observ e which parameters are optimal for the task and we will generalize this asp ect using several datasets. Another obstacle faced in this researc h w as the computation time to estimate the missing v alues and to address this, we will parallelize the pro cess on a multi-core system to observe whether parallelizing the task do es indeed sp eed up the pro cess and main tain efficiency . References 1. Ab della, M., Marw ala, T.: The use of genetic algorithms and neural net works to ap- pro ximate missing data in database. 3r d International Confer enc e on Computational Cyb ernetics, ICCC 2005 , pp. 207-212. IEEE (2005) 2. Aydilek, I.B., Arslan, A.: A nov el hybrid approach to estimating missing v alues in databases using k-nearest neighbors and neural netw orks. International Journal of Innovative Computing, Information and Contr ol , v ol. 7, no. 8, pp. 4705-4717 (2012) 3. Kok o, E.E.M., Mohamed, A.I.A.: Missing data treatment metho d on cluster anal- ysis. International Journal of A dvanc e d Statistics and Prob ability . v ol. 3, no. 2, pp. 191-209 (2015) 4. Lek e, C., Twala, B., Marw ala, T.: Mo deling of missing data prediction: Computa- tional in telligence and optimization algorithms. International Confer enc e on Sys- tems, Man and Cybernetics (SMC) . pp.1400-1404. IEEE (2014) 5. Mistry , F.J., Nelw amondo, F.V., Marw ala, T.: Missing Data Estimation Using Prin- ciple Component Analysis and Autoassociative Neural Netw orks. Journal of Sys- temics, Cyb ernatics and Informatics . v ol. 7, no. 3, pp. 72-79 (2009) 6. Nelw amondo, F.V., Mohamed, S., Marwala, T.: Missing data: A comparison of neural net work and expectation maximisation techniques. arXiv pr eprint arXiv:0704.3474 . (2007) 7. Rana, S., John, A.H., Midi, H., Imon, A.: Robust Regression Imputation for Missing Data in the Presence of Outliers. F ar East Journal of Mathematic al Scienc es . vol. 97, no. 2, pp. 183. Pushpa Publishing House (2015) 8. Zhang, S., Jin, Z., Zh u, X.: Missing data imputation by utilizing information within incomplete instances. Journal of Systems and Softwar e . vol. 84, no. 3, pp. 452-459. Elsevier (2011) 9. Zhang, S.: Shell-neighbor metho d and its application in missing data imputation. Applie d Intel ligenc e . v ol. 35, no. 1, pp. 123-133. Springer (2011) 10. LeCun, Y. The MNIST database of handwritten digits http://yann.le cun.c om/exdb/mnist/ . last accessed: 1 January 2016. 11. Rubin, D.B.: Multiple imputations in sample surv eys-a phenomenological Bay esian approac h to nonresp onse. Pr o c e e dings of the survey r ese ar ch metho ds se ction of the Americ an Statistic al Association . vol. 1, pp. 20-34. American Statistical Asso ciation (1978) 12. Allison, P aul D.: Multiple imputation for missing data: A c autionary tale. Philadel- phia (1999) 13. Little, R.J., Rubin, D.B.: Statistic al analysis with missing data. John Wiley & Sons (2014) 14. Deng, L ., Li, J., Huang, J.-T., Y ao, K., Y u, D., Seide, F., Seltzer, M., Zw eig, G., He, X., Williams, J.: Recen t adv ances in deep learning for sp eec h research at Microsoft. International Confer enc e on A c oustics, Sp e e ch and Signal Pr o c essing (ICASSP) . pp. 8604-8608. IEEE (2013) 15. Deng, L., Y u, D.: Deep learning: methods and applications. F oundations and T r ends in Signal Pr o c essing . vol. 7, no. 3-4, pp. 197-387. Now Publishers Inc (2014) 16. Fisc her, A., Igel, C.: An Introduction to Restricted Boltzmann Mac hines. Pr o- c e e dings Pr o gr ess in Pattern R e c o gnition, Image A nalysis, Computer Vision, and Applic ations: 17th Ib er o americ an Congr ess, CIARP . isbn: 978-3-642-33275-3, pp. 14-36. Springer Berlin Heidelb erg (2012). 17. Isaacs, J.C.: Representational learning for sonar A TR. Pr o c e e dings SPIE 9072, Dete ction and Sensing of Mines, Explosive Obje cts, and Obscur e d T ar gets XIX . 907203 (June 9, 2014), h ttp://dx.doi.org/10.1117/12.2053057 (2014) 18. Bengio, Y., Courville, A., Vincen t, P .: Representation learning: A review and new p erspectives. T r ansactions on Pattern Analysis and Machine Intel ligenc e , vol. 35, no. 8, pp. 1798-1828. IEEE (2013) 19. Y ang, X.-S.: Firefly algorithm, Levy flights and global optimization In: R ese ar ch and Development in Intel ligent Systems XXVI (Eds M. Br amer, R. El lis, M. Petridis) . pp. 209-218. Springer London (2010) 20. Lobato, F., Sales, C., Araujo, I., T adaiesky , V., Dias, L., Ramos, L., San tana, A.: Multi-Ob jective Genetic Algorithm F or Missing Data Imputation. Pattern R e c o gni- tion L etters . Elsevier (2015) 21. Jerez, J.M., Molina, I., Garc ´ ıa-Laencina, P .J., Alba, E., Rib elles, N., Mart ´ ın, M., F ranco, L.: Missing data imputation using statistical and machine learning methods in a real breast cancer problem. Artificial intel ligenc e in me dicine . vol. 50, no. 2, pp. 105-115. Elsevier (2010) 22. Kala ycioglu, O., Copas, A., King, M., Omar, R.Z.: A comparison of multiple- imputation methods for handling missing data in repeated measurements obser- v ational studies. Journal of the R oyal Statistical So ciety: Series A (Statistics in So ciety) . Wiley Online Library (2015) 23. Lee, K.J., Carlin, J.B.: Multiple imputation for missing data: fully conditional sp ec- ification v ersus multiv ariate normal imputation. Americ an journal of epidemiolo gy . v ol. 171, no. 5, pp. 624-632. Oxford Univ Press (2010) 24. Liew, A.W.-C., Law, N.-F., Y an, H.: Missing v alue imputation for gene expression data: computational techniques to recov er missing data from av ailable information. Briefings in bioinformatics . vol. 12, no. 5, pp. 498-513. Oxford Univ Press (2011) 25. My ers, T.A.G.: Listwise deletion: Presenting hot deck imputation as an easy and effectiv e to ol for handling missing data. Communic ation Metho ds and Me asures . vol. 5, no. 4, pp. 297-310. T aylor & F rancis (2011) 26. Sc hafer, J.L., Graham, J.W.: Missing data: our view of the state of the art. Psycho- lo gic al methods . v ol. 7, no. 2, pp. 147. American Psychological Asso ciation (2002) 27. V an Buuren, S.: Flexible imputation of missing data. CRC pr ess . (2012) 28. Hin ton, G.E., Salakhutdino v, R.R.: Reducing the dimensionality of data with neu- ral net w orks. Scienc e . vol. 313, no. 5786, pp. 504-507. American Association for the Adv ancemen t of Science (2006)
Original Paper
Loading high-quality paper...
Comments & Academic Discussion
Loading comments...
Leave a Comment