Empirical Reference Distributions for Networks of Different Size
Network analysis has become an increasingly prevalent research tool across a vast range of scientific fields. Here, we focus on the particular issue of comparing network statistics, i.e. graph-level measures of network structural features, across mul…
Authors: Anna Smith, Catherine A. Calder, Christopher R. Browning
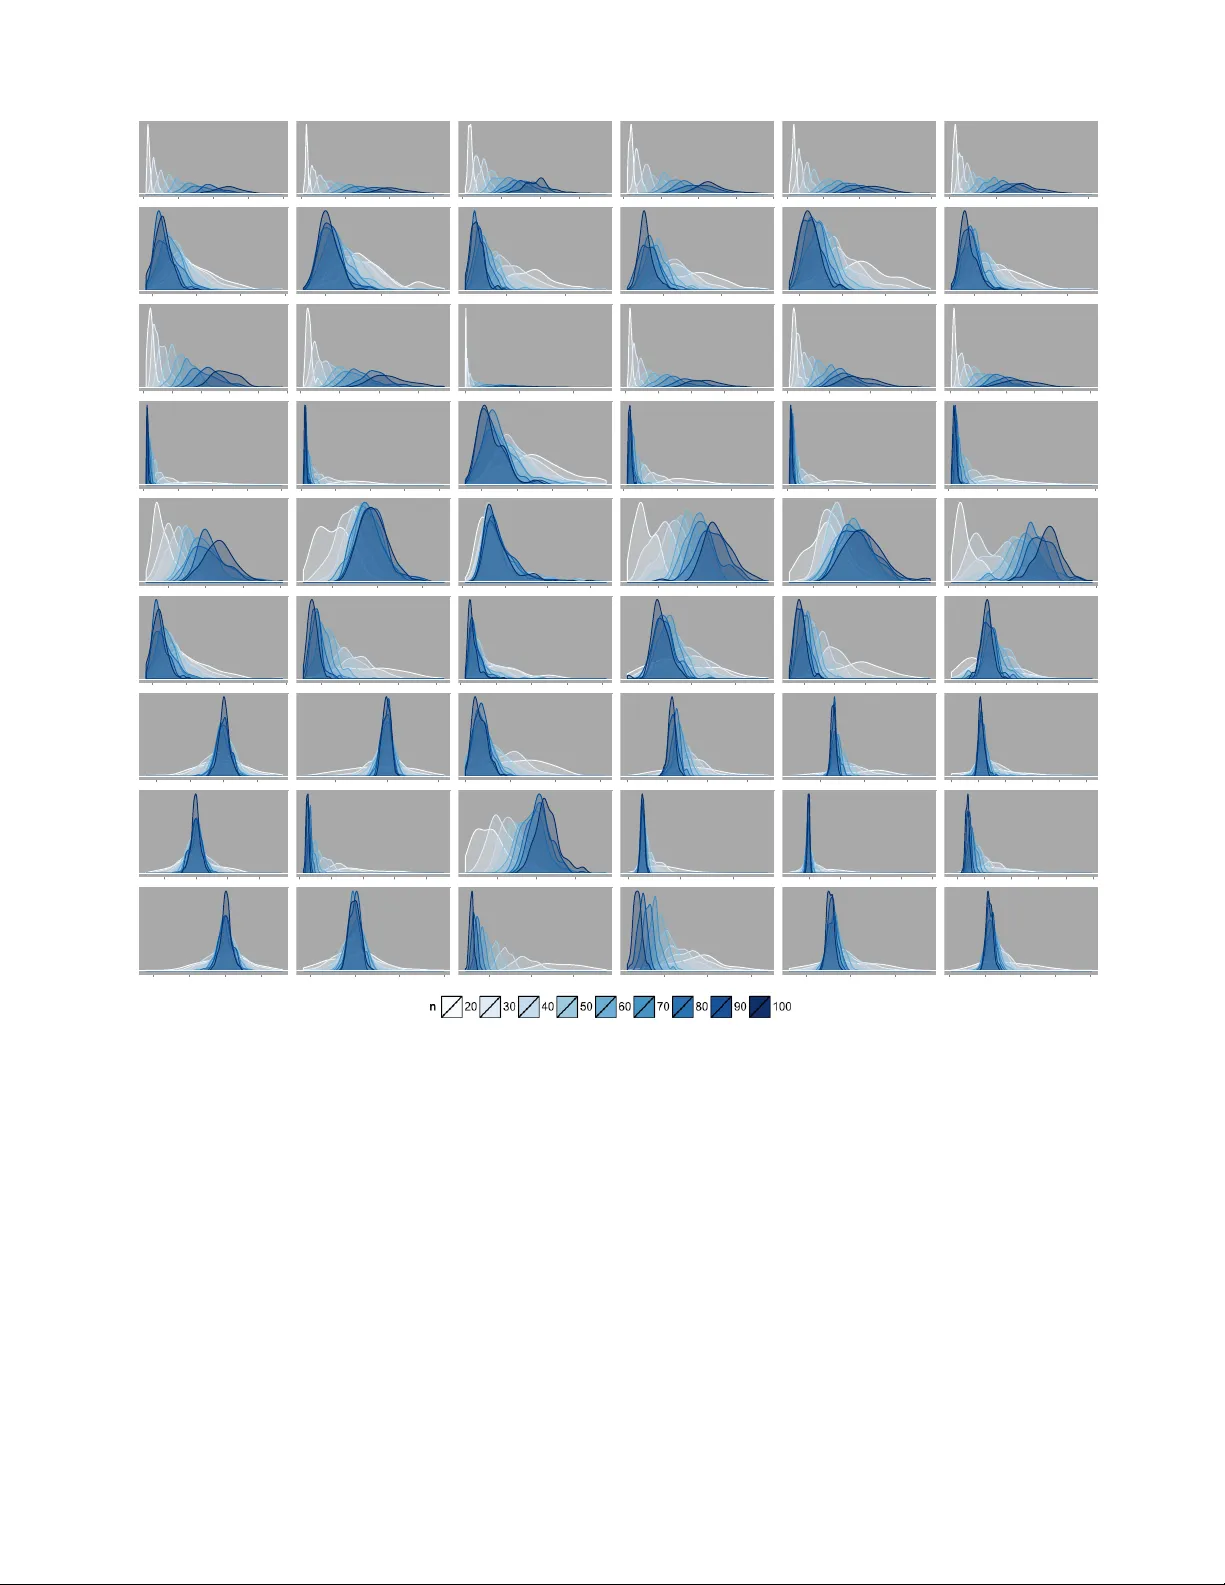
Empir ical Reference Distr ibutions for Netw orks of Dif ferent Size A nn a S mith a, , C a therine A. C alder a ∗ , C hristopher R. B r owning b a Department of Statistics, The Ohio State University b Department of Sociology , The Ohio State University July 2, 2021 Abstract Netw ork analysis has become an increasingly prev alent research tool across a vast range of scientific fields. Here, we focus on the particular issue of comparing netw ork statistics, i.e. graph-lev el measures of network structural features, across multiple netw orks that differ in size. Although “normalized” v ersions of some network statistics exist, w e demonstrate via simulation why direct comparison is often inappropriate. W e consider normalizing netw ork statistics relativ e to a simple fully parameterized reference distribution and demonstrate via simulation how this is an impro vement ov er direct comparison, but still sometimes problematic. W e propose a new adjustment method based on a reference distribution constructed as a mixture model of random graphs which reflect the dependence structure exhibited in the obser v ed netw orks. W e show that using simple Ber noulli models as mixture components in this reference distribution can pro vide adjusted network statistics that are relatively comparable across different network sizes but still describe interesting features of networks, and that this can be accomplished at relativ ely low computational expense. Finally , w e apply this methodology to a collection of ecological netw orks derived from the Los Angeles Family and Neighborhood Sur v ey activity location data. Keyw ords: ERGM, L.A.F ANS, mixture model, network comparison, normalized network statistics 1. Introduction Netw orks hav e become ubiqutous as a tool for analysis in many areas of applied research. Here, w e focus on the situation where the researcher is interested in considering and comparing multiple netw orks. Often the netw orks under consideration consist of differing numbers of nodes, and the comparison of statistics across these netw orks is not straightforward. That is, the distribution of a netw ork statistic across netw orks may be v er y different, depending on the size of the netw ork. This holds ev en when the networks are generated from a single model, as shown in Figure 1. A tool for network comparisons w ould be useful in many fields - from traditional social netw ork analysis to brain netw ork studies in biomedical research. For example, many researchers ha v e compared friendship netw orks within different classrooms in an effort to infer patterns of friendship formation and their role in academic perfor mance (Lubbers, 2003; Lubbers and Snijders, 2007). Similarly , a growing area of study in biomedical research attempts to draw inference about patterns of disease, illness, and treatment effectiv eness from brain netw orks by comparing netw orks across affected and unaffected patients (e.g. Bassett et al., 2008; He et al., 2008). Of course, many similar potential applications exist: comparing e-mail communication networks among emplo yees in different departments of a company , comparing citation netw orks among researchers in different fields, comparing v oting netw orks among politicians from different state congresses, etc. Further , it would be advantageous to ha ve measures of netw ork structural features that can be included as cov ariates in typical regression models. For example, it might be interesting to relate the a v erage shortest path length of an individual’s brain network to his/her stage of Alzheimer ’s disease, or to relate the degree of transitivity (proportion of times the co-votee of my co-v otee also co-v otes with me) in a state congress’ v oting netw ork to the number of bipartisan legislative acts passed in that state. In order to include such netw ork measures in a regression-style analysis, the measures must be on the same scale and ha v e the same meaning across the v arious netw orks. How ev er , when the netw orks being compared vary in size, often the v alues of these network statistics can be dominated by size effects. W e first demonstrate via simulation why direct comparison of network statistics across networks of different si zes is often inappropriate. W e then investigate the use of an absolute reference distribution which is fully parameterized a priori, here ∗ Corresponding author: calder@stat.osu.edu 1 Figure 1: Realizations from a Single Model 0 500 1000 1500 2000 Deg. Cent. Erdos − Ren yi 0 500 1000 1500 Ber noulli 0 300 600 900 Kr ivitsky 0 300 600 900 1200 Mar k o v 0 500 1000 1500 2000 H Mar k o v 0 500 1000 1500 H Ber noulli 0.1 0.2 0.3 0.4 Deg. Cent. (N) 0.1 0.2 0.3 0.1 0.2 0.3 0.1 0.2 0.1 0.2 0.3 0.4 0.1 0.2 0.3 0 500 1000 1500 2000 2500 Betw. Cent. 0 2500 5000 7500 0 50000 100000 150000 0 5000 10000 15000 20000 0 2500 5000 7500 0 5000 10000 15000 20000 25000 0.000 0.025 0.050 0.075 0.100 Betw. Cent. (N) 0.0 0.1 0.2 0.3 0.4 0.0 0.2 0.4 0.6 0.0 0.2 0.4 0.0 0.1 0.2 0.3 0.0 0.2 0.4 0.6 2.5 5.0 7.5 10.0 Clos . Cent. 2 4 6 0 2 4 6 8 2.5 5.0 7.5 10.0 2 4 6 0.0 2.5 5.0 7.5 10. 0 0.1 0.2 0.3 0.4 0.5 Clos . Cent. (N) 0.1 0.2 0.3 0.4 0.0 0.1 0.2 0.3 0.4 0.1 0.2 0.3 0.1 0.2 0.3 0.4 0.5 0.1 0.2 0.3 0.4 0.40 0.45 0.50 0.55 T r ansitivity 0.1 0.2 0.3 0.0 0.1 0.2 0.3 0.0 0.1 0.2 0.3 0.2 0.4 0.6 0.0 0.1 0.2 0.3 0.4 0.5 1.45 1.50 1.55 1.60 A vg. P ath Length 1.75 2.00 2.25 2.50 2.75 3 4 5 6 2 3 4 1.75 2.00 2.25 2.50 2.75 2.0 2.5 3.0 3.5 4.0 4.5 0.40 0.45 0.50 0.55 Density 0.15 0.20 0.25 0.30 0.05 0.10 0.15 0.12 0.16 0.20 0.2 0.3 0.4 0.05 0.10 0.15 0.20 0.25 The distribution of a netw ork statistic (her e, closeness centrality) across a range of netw ork sizes (number of nodes, n ). choosing to compare to completely random graphs, or Erd ˝ os-Rényi graphs, of the appropriate size (e.g. V an W ijk et al., 2010; Stam, 2004; S chindler et al., 2008; Smit et al., 2008). W e demonstrate via simulation why this is an improv ement ov er direct comparison, but still sometimes problematic. W e argue that a more appropriate method of comparison w ould both adjust for netw ork size as w ell as incorporate some degree of appropriate netw ork dependence structure. W e propose utilizing a new reference distribution which comes fr om a mixture model, where w e ar e mixing ov er the dependence structure demonstrated in a random subset of the empirically obser v ed netw orks. T o accomplish this, w e consider three models for reference distribution simulations: the simple Ber noulli model, a mean degree preserving Bernoulli model (Krivitsky et al., 2011), and a Hierarchical Ber noulli model, where the latter is a special case of the HERGM, or Hierarchical ERGM, proposed by S chw einberger and Handcock (2015). W e consider the perfor mance of these methods in a series of simulation studies. Finally , w e apply these techniques to neighborhood network data from the Los Angeles Family and Neighborhood Surve y (L.A.F ANS) to demonstrate the type of substantiv e statements that these methods can facilitate. 2. Background and Motiv ation W e consider netw orks or graphs, G , that consist of n nodes or v ertices and represent them b y their n × n adjacency matrix, Y . Each element of this matrix, Y i j , is a tie indicator variable such that Y i j = 1 if nodes i and j are tied 0 otherwise for i , j = 1, ... n For simplicity , w e consider only one-mode, undirected and unw eighted netw orks, and so w e let Y ii = 0 b y definition. Certainly , the methodology proposed here could be extended to other types of netw orks. W e refer to the number of nodes, n , as netw ork size, but note that others denote this property as the order of the graph (e.g Kolaczyk and Csárdi, 2014). Generally , the issue of network comparisons has reciev ed little methodological attention, despite the popularity of netw ork analysis. Further , much of researchers’ attention has been focused on building methods to model multiple netw orks simultaneously and using this modeling framew ork as a wa y to proceed with any questions of netw ork comparison, similar to a traditional meta-analysis approach (Snijders and Baerveldt, 2003; An, 2015). This style of analysis requires faith in the individual micro-lev el analyses themselv es. How ev er , working with existing netw ork models can sometimes be difficult since these models (ev en in the simplest cases): often suffer from degeneracy (for some discussion, see Snijders et al., 2006; Chatterjee et al., 2013), can ha v e dependence structures that are difficult to inter pret (such as the ERGM ter ms suggested b y Snijders et al., 2006), face computational issues, and, most importantly , can exhibit a rather striking lack of connection betw een model parameters and the specific structural features of netw orks generated from these models. In particular , many common network model parameters are often highly correlated so that individual parameters pla y different roles under different contexts. Consider the example highlighted by Snijders et al. (2006) of an ERGM with parameters for only edges and triangles: “for a fixed positive transitivity parameter , as the edge parameter becomes more negativ e there is a point at which... [simulated netw orks] change dramatically ... from only complete graphs to only lo w density graphs”. In this simple ERGM, the edges parameter does not seem to affect netw ork density in the wa y that w e might think, or at least the strength and smoothness of its effect appears to depend on the particular model specification itself. Thus, ev en in simple v ersions of existing netw ork models, there are cases where model parameters do not appear to characterize the structural aspects of netw orks which they seem designed to describe. For this reason, when comparing multiple networks, w e propose comparing direct measures of netw ork structure itself - network or graph statistics - as a simple alter nativ e to comparing 2 fitted model parameter values whose inter pretations are often not straight for w ard. The methodology we propose here could also be v aluable as an additional viewpoint in combination with the existing meta-analysis style technique (e.g. as decribed by Snijders and Baerveldt, 2003; An, 2015), where our proposed methodology could perhaps guide the specification of micro-lev el analyses and help to impro v e ov erall inter pretability . 2.1. Common Network Statistics W e consider netw ork statistics that are popular in the applied netw ork science literature (Anderson et al., 1999; Smith and Moody, 2013). The statistics we consider here can be thought of as describing tw o different aspects of a netw ork: centralization and topology . W e consider degree, closeness, and betw eenness as measures of centralization while our considered measures of topology are av erage path length and transitivity . W e also consider netw ork density . All statistics are computed (and compared) at the graph lev el. For the centralization measures, w e use Freeman’s for mula (Freeman, 1979): C ( G ) = n ∑ j = 1 max 1 ≤ i ≤ n s ( i ) − s ( j ) for any vertex-le v el statistic, s ( i ) . Note that at the graph lev el, C ( G ) is a measure of the dispersion of the distribution of s ( i ) , across all v ertices in the graph. W e consider this “unnormalized” v ersion of our centralization measures as well as the “normalized” v ersion in which C ( G ) is divided by the maximum possible value attainable b y C ( G ) for a graph of the same size. Unfortunately , the normalized v ersion proposed by Butts (2006) which adjusts for both the size and density of G has not yet been implemented in standard softw are to our knowledge and so it will not be considered here. Degree Centrality at the vertex lev el is simply a node’s degree, or the number of other nodes to which that node is tied: s deg ( i ) = ∑ j 6 = i Y i j . Thus, at the vertex lev el, this statistic reports the size of the i th node’s personal or immediate network so that at the graph lev el, w e measure the dispersion in personal netw ork size. Closeness Centrality at the v ertex lev el is the reciprocal of the sum of the shortest path lengths from that node to all other nodes: s clo ( i ) = 1 ∑ j 6 = i d i j where d i j is the length of the shortest path from node i to node j . Intuitiv ely , s cl o ( i ) captures the speed or efficiency with which infor mation, disease, etc. could be spread from v ertex i to the rest of the nodes in G . At the graph lev el, we measure the amount that this efficiency varies across all nodes. Betw eenness Centrality at the v ertex lev el is the proportion of shortest paths betw een all pairs of nodes that pass through the node of interest: s btw ( i ) = ∑ k 6 = j ; k , j 6 = i g ki j ˜ g k j where g ki j is the number of paths from node k to node j that pass through node i , while ˜ g k j counts all paths from k to j . Adding an additional degree of complexity to closeness centrality , betw eenness centrality at the v ertex lev el measures the importance of the i th node as a central node in efficient communication or spread across G . Again, at the graph lev el, w e get the degree of variation in this measure of a node’s importance. A verage Path Length is a graph-lev el measure and is defined as the a v erage of the shortest path lengths betw een all pairs of nodes: P ( G ) = 1 n − 1 n ∑ i = 1 ∑ j 6 = i d i j . Similar to closeness centrality , w e again are interested in the speed or efficiency with which nodes are able to transmit information across G . Recall that at the graph lev el, closeness centrality measures the dispersion of these efficiencies. A v erage path length, how ev er , instead captures the “a verage efficiency”, where graphs with larger P ( G ) are considered less efficient than graphs with smaller P ( G ) . T ransitivity , also called Clustering, at the v ertex lev el is the proportion of 2-stars centered at node i which are closed 3 Figure 2: Subgraphs included in T ransitivity Network Statistic T riangle 2-star triangles. At the graph lev el, w e simply report the av erage: T ( G ) = # of closed triangles # of 2-stars where triangles and 2-stars are the subgraph types depicted in Figure 2. This statistic is extremely popular in applied social netw ork research, largely due to its relev ance to much of social theor y . Intuitiv ely , T ( G ) reflects the a v erage amount of local clustering in G . Density is a graph-lev el measure of the proportion of all possible ties that are realized in the observed network: D ( G ) = 1 ( n 2 ) ∑ i < j Y i j . Sometimes treated as a fixed attribute, similarly to the number of nodes, w e instead prefer to treat density in the same manner as all other netw ork statistics examined here. Note that other w ork sometimes uses the ter ms density and mean degree interchangeably (e.g Anderson et al., 1999; V an W ijk et al., 2010), where mean degree is 1 n ∑ n i = 1 ∑ j 6 = i Y i j = ( n − 1 ) D ( G ) . Despite the popularity of these common netw ork statistics, there has been v er y little research that addresses their dependence on netw ork size. Anderson et al. (1999) examine the distributions of a v ariety of graph-lev el network statistics (including degree and betw eenness centrality) across a range of netw ork sizes. How ev er , they consider only netw orks generated from one particular model: the conditional unifor m graph (CUG), where they allow both the netw ork size and mean degree to v ar y . Generally , a CUG model is a unifor m distribution across all possible graphs that share some common feature, such as degree distribution, density , etc. Using a CUG model conditional on shared network size and mean degree, Anderson et al. pro vide evidence that the distributions of these netw ork statistics clearly depend on network size, and that they are also influenced by network density . Continuing in this line of w ork, we will examine distributions of these common network statistics across a range of generativ e netw ork models, including some that better mimic real w orld netw ork data than conditional unifor m graphs. Faust (2006) examines a wide range of real world networks (across a variety of applications and settings) to show that the triad census can be largely described by low er order graph properties, including size and density . The triad census is an example of a subgraph census, a commonly used measure of local graph structure. More specifically , the triad census is the collection of counts for each possible configuration of three (unlabeled) nodes across all triads in the graph of interest. Faust’s result that the triad census can be explained by low er order graph properties implies that other , higher-order netw ork properties (perhaps such as the common network statistics mentioned here) might also be heavily influenced b y netw ork size. Here, w e will be primarily building off of the work of V an W ijk et al. (2010). The authors provide a detailed summary of the problems faced in comparing netw ork statistics across multiple netw orks as well as a brief summar y of a range of possible solutions, all through the lens of neuroscience research. They focus solely on the topological measures, a v erage path length and transitivity , as those capture netw ork features important in brain netw ork theory . In fact, the authors pro vide closed form adjustments for these two statistics for netw orks simulated from particular netw ork models (V an W ijk et al., 2010, T able 1). Ho w ev er , as V an W ijk et al. point out, the underlying generative model is typically unknown for empirical, real w orld networks. Besides these few w orks, the issue of comparing netw ork statistics across netw orks has reciev ed little methodological attention. Perhaps this is the result of simply ignoring a lesser-kno wn issue. In fact, many of the netw ork statistics examined here appear to be “normalized” in some w ay that incorporates netw ork size, so that it is certainly plausible that a reasearcher might assume that these statistics ought to be comparable across sizes. In the case of the centralization measures, “normalized” v ersions are acheived by dividing by the largest possible v alue attainable on a graph of that size . The topological measures are versions of a v erages and are thus at least roughly adjusted for size effects. Ho w ev er , as w e will see in the following section, these simple adjustments are not enough to account for what appears to be a complicated 4 dependence betw een these common netw ork statistics and network size. 2.2. Generative Models for Networks One might hope that statistics computed on networks that come from the same generativ e model w ould ha v e comparable v alues, regardless of network size. How ev er , as has been shown for relativ ely simple classes of generativ e models (Anderson et al., 1999; V an W ijk et al., 2010) and as w e will see for a range of other models, this is certainly not the case. T o examine this issue, we simulate groups of netw orks that cov er a range of sizes from the same model and examine the distribution of the common netw ork statistics across the range of network sizes. In an effort to capture the v ariety in structure, density , topology , etc. which is demonstrated in real w orld networks, we consider six network models of increasing complexity: the Erd ˝ os-Rényi model, a Ber noulli model, a mean degree preser ving Bernoulli model (Krivitsky et al., 2011), a Marko v ERGM, a Hierarchical Ber noulli model and a Hierarchical Markov ERGM. For simplicitly , we will represent each model as a probability distribution for a random adjacency matrix, Y . Alter nativ ely , note that this giv es us a joint distribution for the set of possible edges, Y i j : i < j ; i , j = 1, ... n . Since w e are dealing exclusiv ely with undirected graphs, w e need only model 1 2 of the ( n 2 ) possible edge variables, given that Y ji = Y i j ∀ i , j b y definition in undirected netw orks. Before describing these generativ e models in detail, we briefly outline how they will be used in the simulation studies in Section 2.3, where w e monitor the perfor mance of directly comparing statistics across netw orks of different size. For each generativ e model, w e simulate N n = 200 replicates of graphs with n = 20, 30, ..., 100 nodes, so that each model giv es rise to a total of N = 1800 graphs. This approach of using simulated netw ork data allows us much greater lev els of replication within netw ork sizes than w ould working with any collection of real w orld networks. Erd ˝ os-Rényi Model . This model is included as a simple baseline. Although there are a few formulations (Erdös and Rényi, 1960; Gilbert, 1959), we focus on the version that is equivalent to a Bernoulli graph with the probability of a tie, p , set to 0.50. In a Ber noulli graph, each tie indicator v ariable is modeled as an independent, identically distributed Ber noulli random v ariable, with P ( Y i j = 1 ) = p . This implies that P ( Y = y | θ ed g e ) = exp n θ ed g e h ed g e ( y ) − ψ ( θ ed g e ) o (1) where θ ed g e = log p 1 − p , h ed g e ( y ) counts the number of edges in the obser v ed network, and ψ ( θ ed g e ) is the nor malizing term, which is calculated as follo ws: ψ ( θ ed g e ) = ∑ y ∗ ∈Y exp n θ ed g e h ed g e ( y ∗ ) o where Y is the set of all possible graphs of size n . Although much is known about the properties and behavior of this model, it does not tend to reproduce the type of structure or topological features that w e typicaly obser v e in real w orld networks. Ber noulli Model . W e can generalize the Erd ˝ os-Rényi model by changing the tie density , so that it better reflects what w e often see in real w orld networks. Here, w e set the probability of a tie, p , to be 0.20. Although we obtain reasonable density under this model, w e w ould still not expect to see the type of topological structure that w e associate with real w orld netw orks. This follows from the Bernoulli model’s (unrealistic) assumption that all tie v ariables are independent. Mean Degree Preser ving Bernoulli Model . W e implement the offset ter ms suggested b y Krivitsky et al. (2011), which results in an reparameterized v ersion of the traditional Ber noulli model: P ( Y = y | θ de g ) = exp θ de g h ed g e ( y ) + log 1 n h ed g e ( y ) − ψ ( θ de g ) (2) where h ed g e ( y ) counts the number of edges in the observ ed netw ork as before, and ψ ( θ de g ) is the nor malizing constant: ψ ( θ de g ) = ∑ y ∗ ∈Y exp θ de g h ed g e ( y ∗ ) + log 1 n h ed g e ( y ∗ ) The authors sho w that without an offset ter m, a Ber noulli model preser v es density as netw ork size increases and argue that this is not an appropriate effect for many real-w orld social netw orks (e.g. w e would not expect the obser v ed av erage number of friendships per person to increase at the same rate as the sample size). Instead, models that include the proposed 5 Figure 3: Realizations from Simulated Datasets, n = 20 Erdos-Renyi p = 0.50 Bernoulli p = 0.20 Mean Degree Bernoulli e θ = 3 Markov θ = {− 1.55, − 0.05, 0.25 } Hierarchical Bernoulli p wit hin = 0.20, p btw = 0.10 Hierarchical Markov θ = {− 1.55, − 0.05, 0.25 } , p btw = 0.25 offset are designed to maintain mean degree 1 as n increases. Krivitsky et al. (2011) show that under this model, the degree distribution conv erges to a Poisson distribution as n → ∞ , with av erage degree exp( θ de g ). W e choose θ de g such that the a v erage degree is three. Markov ERGM . Exponential random graph models (ERGMs) pro vide an easy wa y to introduce dependence betw een tie v ariables. Here, we use the Markov version of an ERGM which specifies that all tie v ariables which share a node are dependent (Frank and Strauss, 1986). The triad version of this model is for mulated as follows: P ( Y = y | θ ) = exp { < θ , h ( y ) > − ψ ( θ ) } (3) where < x 1 , x 2 > denotes the inner product of x 1 and x 2 , the elements of h ( y ) are counts for the number of edges, 2-stars, and triangles in the obser v ed network y , respectiv ely , i.e. h ( y ) = n h ed g e ( y ) , h 2 − st ar ( y ) , h tr i an gl e ( y ) o , θ are the corresponding parameters, i.e. θ = n θ ed g e , θ 2 − st ar , θ tr i an gl e o , and ψ ( θ ) is the normalizing constant: ψ ( θ ) = ∑ y ∗ ∈Y exp { < θ , h ( y ∗ ) > } . W e base parameter values for our generative Markov ERGM off of the w ell-known Florentine marriage netw ork (Padgett, 1994) 2 . Specifically , w e fit the triad model to this netw ork and use the resulting parameter estimates for our simulations: θ ed g e = − 1.55, θ tw o − st ar = − 0.05, and θ tr i an gl e = 0.25. This allo ws us to repr esent some of the structural and topological features that w e often obser v e in real world netw orks. Ho we v er , there are many w ell-known issues with ERG models, particularly the fact that all nontrivial specifications form non-projectiv e families (Shalizi and Rinaldo, 2013). This indicates that parameter v alues do not ha v e the same meaning across networks of different size. Y et w e include the Markov ERGM here due to its widespread popularity in netw ork analysis. Note that w e do not incor porate any of the latest modifications to ERGM statistics, such as the geometrically w eighted terms dev eloped by Snijders et al. (2006). These are largely solutions to model-fitting issues and not necessarily required for the generative models w e specify here. Further , the relationship betw een these tuning parameter values and netw ork size is unclear and potentially complicated. Hierarchical Ber noulli Model . Both the Hierarchical Ber noulli Model and hierarchical Markov ERGM are special cases of the more general HERGM, or Hierarchical ERGM (S chw einberger and Handcock, 2015). Generally , this model utilizes a Ba yesian approach to identify plausible partitions of the netw ork into smaller sub-netw orks (or “neighborhoods”) and enforces strong dependence (e.g. a Markov ERGM) within neighborhoods with w eak dependence (i.e. the Ber noulli model) betw een neighborhoods. In this wa y , this model av oids the ERGMs’ issue with non-projectability . Thus, w e consider these generativ e models our best attempt to mimic real world networks that vary in size. For both of our HERGM simulated datasets, w e consider the number of neighborhoods, K , to be fixed (although neigh- borhood membership, Z , is still assumed unknown) and we set K = n 5 so that neighborhood size remains relativ ely small while the number of neighborhoods varies smoothly with netw ork size. Let Y k , k denote the subgraph of Y corresponding to the k th neighborhood and let A k represent the set of nodes belonging to the k th neighborhood. Then, the probability 1 Note that mean degree scales linearly with density by a factor of n − 1 2 This netw ork was chosen arbitrarily , except for the requirement that the triad Markov ERGM could be successfully fit to it. Our primar y goal is to create simulated networks that in some wa y resemble real world networks, but not to recreate the dynamics of this particular network per se. 6 distribution for Y can be written as follows: P ( Y = y | Z , θ ) = K ∏ k = 1 P ( Y k , k = y k , k | Z , θ ) × k − 1 ∏ l = 1 ∏ i ∈ A k , j ∈ A l P ( Y i j = y i j | Z , θ ) where the node membership vectors are dsitribtued as Z i | π ii d ∼ Multinomial ( 1; π ) for i = 1, ..., n . Notice that the probability distribution for Y is conditional on the model parameters as well as the membership vectors: the set of Z i ’s. From (3), w e can see that this model induces local dependence, since the probability mass function factorizes into within-neighborhood and between-neighbor hood pieces. Further , as suggested by S chw einberger and Handcock, w e make the following simplifying assumptions: First, w e assume that the betw een-neighborhood probability mass function depends only on the presence of edges: P ( Y i j = y i j | Z , θ ) = exp θ bt w y i j − ψ ( θ bt w ) and secondly , that the within-neighborhood probability mass function resembles a generic ERGM: P ( Y k , k = y k , k | Z , θ ) = exp < θ W , h W ( y k , k ) > − ψ ( θ W ) (4) where ψ ( θ bt w ) and ψ ( θ W ) are normalizing constants, calculated similarly as for Equations (1) and (2). As suggested by S chw einberger and Handcock, we specify a multivariate nor mal prior for θ with parameters µ and Σ , and chose a Dirichlet prior for π , with parameter α 1 K , where 1 K is a 1 × K v ector of ones. For our simulations, we set α = 10 and consider θ bt w fixed. For all models we consider elements of θ uncorrelated and without loss of generality set the diagonal elements of Σ equal to one. For the Hierarchical Bernoulli Model, the within-neighborhood ERGM depends only on tie density (i.e. h W ( y k , k ) in Equation (4) consists of an edge count for the k th neighborhood subgraph of y ). S o, for this model, note that θ W is one-dimensional and we use the v alue corresponding to a within-neighborhood density of 0.20. W e set θ bt w so that the probability of connections betw een neighborhoods is 0.10. Hierarchical Markov ERGM . This is another special case of the HERGM, where h W ( y k , k ) is composed of subgraph counts for edges, 2-stars, and triangles, v ery similar to the setup for the Marko v ERGM (see Equation (2)). W e use the same parameter values as in our traditional Marko v ERGM - those estimated from the Florentine marriage netw ork. That is, w e set θ W = { θ ed g e , θ 2 − st ar , θ tr i an gl e } = { − 1.55, − 0.05, 0.25 } to gov er n the Markov ERGM within neighborhoods. W e set θ bt w so that the probability of connections betw een neighborhoods is 0.25. Examples of realizations from these generativ e netw ork models are shown in Figure 3. W e plot randomly selected netw orks of the smallest size examined here, n = 20, so that structural differences are more readily visible. 2.3. Direct Comparison Recall that for each of these generativ e models, we simulate N n = 200 replicates with n = 20, 30, ..., 100 nodes. All netw orks are simulated using standard functions from the statnet (Handcock et al., 2015) and hergm (Schweinber ger et al., 2015) packages for R . For each netw ork in each of these simulated datasets, we compute each of the common network statistics described in S ection 2.1. Then w e consider the distribution of each of these common network statistics where the netw orks come from the same generative model, pa ying specific attention to how the distribution v aries according to the size of the netw ork. T o examine this, consider the following three metrics. First, perhaps the most intuitiv e method for examining differences in distributions is using histograms. In Figure 4, we ha v e plotted the histograms for each common netw ork statistic under each generative model. In each plot, the color of the histogram indicates the size of the netw ork, with the smallest netw ork size ( n = 20) shown in white and the largest netw ork size ( n = 100) shown in dark blue. Ideally , w e would like the histograms to stack up neatly on top of each other with little difference in ov erall shape. S econd, we attempt to quantify the difference in these distributions b y considering 2-sample Kolmogoro v-Smir no v statistics. Generically , let F M , η , n i denote the empirical distribution function (EDF) for a netw ork statistic, η ( G ) , calculated on networks from Model M of size n i , for M = 1, ..., 5 denoting the generative models discussed in Section 2.2, η ( G ) from the set of common netw ork statistics described in S ection 2.1, and i = 1, ..., 9 corresponding to n i = 20, 30, ..., 100. Note that for all 7 T able 1: k-Sample Anderson-Darling Statistics for Unadjusted Statistics S imula ted D a taset Erd ˝ os-Rényi Bernoulli Mean Degree Markov Hierarchical Hierarchical Bernoulli Markov Bernoulli S t atistic Deg. Cent. 694.16 680.85 609.90 642.89 667.88 638.90 Deg. Cent. (N) 209.65 194.63 391.44 329.30 266.07 226.86 Betw . Cent. 633.16 580.17 694.14 639.21 591.44 600.95 Betw . Cent. (N) 637.46 609.14 179.13 568.19 617.07 564.86 Clos. Cent. 409.44 215.38 31.77 465.80 192.43 467.63 Clos. Cent. (N) 229.20 452.93 304.60 146.13 439.05 130.31 T ransitivity 67.84 81.18 186.36 238.35 225.82 121.85 A v g. Path Length 60.09 558.74 356.51 228.62 171.51 430.91 Density 58.08 57.62 682.59 533.56 127.57 132.75 M , η , and n i , the number of samples from F M , η , n i will be the same, precisely N n = 200. W e use the Kolmogorov-Smirno v statistic to compare empirical distributions of a statistic calculated on networks from the same model across tw o different netw ork sizes: sup x ∈ R | F M , η , n i ( x ) − F M , η , n j ( x ) | i 6 = j . This method allows us to compare only tw o network sizes simultaneously , so w e calculate this statistic pairwise for each possible pair of netw ork sizes. The Kolmogorov-Smirnov statistic is naturally bounded betw een zero and one, and so w e can easily compare across different models and netw ork statistics. In Figure 5, we present heatmaps where the cells of each heatmap correspond to the Kolmogoro v-Smir no v statistic computed as the difference betw een empirical distributions for netw orks of tw o different sizes. Dark blue cells correspond to distributions that are v ery similar , while violet cells correspond to distributions that are quite different. Note that these plots are symmetric, so it is sufficient to examine only the upper left or low er right triangle. Third, w e consider further reducing our summar y information by computing k-Sample Anderson-Darling statistics (S cholz and Stephens, 1987). For a particular generativ e model and netw ork statistic, w e use this k-Sample statistic to summarize the difference across distributions of all netw ork sizes simultaneously . The k-Sample Anderson-Darling statistic is for mulated as follows: 9 ∑ i = 1 N n Z B M , η { F M , η , n i ( x ) − H M , η ( x ) } 2 H M , η ( x ) { 1 − H M , η ( x ) } where H M , η ( x ) = ∑ 9 i = 1 F M , η , n i ( x ) is the empirical distribution function of the pooled sample across all netw ork sizes and B M , η = { x ∈ R : H M , η ( x ) < 1 } . Note that the typical equations simplify here since, as mentioned previously , the number of samples from F M , η , n i is the same for all M , η , and n i . The Anderson-Darling statistic is a quadratic empirical distribution function statistic (the Cramer-v on Mises statistic is another special case) and measures the weighted distance between the empirical distributions under consideration. The k-Sample Anderson-Darling statistics for our netw ork data are provided in T able 1. W e see that in most cases, statistics across netw orks of different sizes clearly ha v e v er y different distributions and comparing them directly is generally not appropriate. Not surprisingly , in many of the heat maps and histogram plots, w e notice that direct comparison is least appropriate when the difference betw een network sizes is large. Also notice that, giv en a fixed difference in netw ork sizes, direct comparison appears to be less appropriate when the netw ork sizes themselves are small. For example, comparing a network statistic across netw orks of sizes n = 20 and n = 30 appears to be more problematic than across networks of sizes n = 90 and n = 100. This is not sur prising, since in the for mer case the difference in netw ork size constitutes a much larger proportion of the absolute netw ork sizes themselves. Ho we v er , there are cases where directly comparing netw ork statistics is not terribly inappropriate. For example, the distributions of the topological measures appear to be rather comparable across different sizes. Y et, this statement does not appear to hold (nearly as well) if w e are considering av erage path length in a group of Bernoulli graphs or density from a group of Markov graphs. Of course, in practice, the generativ e model is unknown. Thus, w e w ould advise a voiding direct comparison if possible, ev en for these relativ ely stable topological measures. In terms of the centralization measures, w e notice that using the normalized versions appears to greatly lessen the issue, though it is not entirely solv ed. Notably , in the case of betw eenness, normalization appears to be less effectiv e (this is particularly evident in the heat maps in Figure 5 and the Anderson-Darling statistics in T able 1), except for networks from the mean degree preser ving Bernoulli model. Further , in the case of closeness centrality , nor mlization appears to offer impro v ements only in combination with particular types of graphs. Particularly , if w e examine the 2-Sample Kolmogoro v- Smirnov statistics in Figure 5 for the two versions of the closeness centrality measure, w e see that the normalized v ersion 8 Figure 4: Histograms of Unadjusted Statistics 0 500 1000 1500 2000 Deg. Cent. Erdos−Renyi 0 500 1000 1500 Bernoulli 0 250 500 750 Mean Deg. Bernoulli 0 300 600 900 120 0 Markov 0 500 1000 1500 2000 H Markov 0 500 1000 1500 H Bernoulli 0.1 0.2 0.3 0.4 Deg. Cent. (N) 0.1 0.2 0.3 0.1 0.2 0.1 0.2 0.1 0.2 0.3 0.4 0.1 0.2 0.3 0 500 1000 1500 2000 250 0 Betw. Cent. 0 2500 5000 7500 0e+00 5e+04 1e+05 0 5000 10000 15000 20000 0 2500 5000 7500 0 5000 10000 15000 20000 25000 0.000 0.025 0.050 0.075 0.100 Betw. Cent. (N) 0.0 0.1 0.2 0.3 0.4 0.1 0.2 0.3 0.4 0.0 0.2 0.4 0.0 0.1 0.2 0.3 0.0 0.2 0.4 0.6 2.5 5.0 7.5 10.0 Clos. Cent. 2 4 6 0 2 4 6 2.5 5.0 7.5 10 .0 2 4 6 0.0 2.5 5.0 7.5 10. 0 0.1 0.2 0.3 0.4 0.5 Clos. Cent. (N) 0.1 0.2 0.3 0.4 0.0 0.1 0.2 0.3 0.4 0.1 0.2 0.3 0.1 0.2 0.3 0.4 0.5 0.1 0.2 0.3 0.4 0.40 0.45 0.50 0.55 T ransitivity 0.1 0.2 0.3 0.0 0.1 0.2 0.3 0.0 0.1 0.2 0.3 0.2 0.4 0.6 0.0 0.1 0.2 0.3 0.4 0.5 1.45 1.50 1.55 1.60 Avg. P ath Length 1.75 2.00 2.25 2.50 2.75 3 4 5 2 3 4 1.75 2.00 2.25 2.50 2.75 2.0 2.5 3.0 3.5 4.0 4.5 0.40 0.45 0.50 0.55 Density 0.15 0.20 0.25 0.30 0.05 0.10 0.15 0.12 0.16 0.20 0.2 0.3 0.4 0.05 0.10 0.15 0.20 0.25 The columns indicate different simulated datasets while the rows represent the different network statistics of interest. is superior only in the cases where the simulated data are generated from an Erd ˝ os-Rényi model, Marko v ERGM, or Hierarchical Bernoulli model. In the other simulated datasets, the unnor malized statistics are more comparable across netw ork sizes. Perhaps the normalization for closeness centrality is sensitiv e to particular types of topological netw ork structure. How ev er , it is unclear from these preliminary results what the sensitivity might be and/or how to adjust for it. In short, this simulation study has clearly demonstrated that across a range of popular and reasonable generativ e network models, network statistics are not directly comparable across netw orks of different size, ev en when the networks under consideration are generated from the same model. It follo ws then that statistics calculated on real w orld networks (say from the same data generating process) are not directly comparable either . Thus, w e turn to a brief literature revie w of proposed adjustments to our common network statistics which should allow for comparison across netw orks of different size. 9 Figure 5: Heat Maps of Kolmogorov-Smirno v Statistics for Unadjusted Statistics 20 30 40 50 60 70 80 90 100 20 30 40 50 60 70 80 90 100 Deg. Cent. Erdos−Renyi 20 30 40 50 60 70 80 90 100 20 30 40 50 60 70 80 90 100 Bernoulli 20 30 40 50 60 70 80 90 100 20 30 40 50 60 70 80 90 100 Mean Deg. Bernoulli 20 30 40 50 60 70 80 90 100 20 30 40 50 60 70 80 90 100 Markov 20 30 40 50 60 70 80 90 100 20 30 40 50 60 70 80 90 100 H Markov 20 30 40 50 60 70 80 90 100 20 30 40 50 60 70 80 90 100 H Bernoulli 20 30 40 50 60 70 80 90 100 20 30 40 50 60 70 80 90 100 Deg. Cent. (N) 20 30 40 50 60 70 80 90 100 20 30 40 50 60 70 80 90 100 20 30 40 50 60 70 80 90 100 20 30 40 50 60 70 80 90 100 20 30 40 50 60 70 80 90 100 20 30 40 50 60 70 80 90 100 20 30 40 50 60 70 80 90 100 20 30 40 50 60 70 80 90 100 20 30 40 50 60 70 80 90 100 20 30 40 50 60 70 80 90 100 20 30 40 50 60 70 80 90 100 20 30 40 50 60 70 80 90 100 Betw. Cent. 20 30 40 50 60 70 80 90 100 20 30 40 50 60 70 80 90 100 20 30 40 50 60 70 80 90 100 20 30 40 50 60 70 80 90 100 20 30 40 50 60 70 80 90 100 20 30 40 50 60 70 80 90 100 20 30 40 50 60 70 80 90 100 20 30 40 50 60 70 80 90 100 20 30 40 50 60 70 80 90 100 20 30 40 50 60 70 80 90 100 20 30 40 50 60 70 80 90 100 20 30 40 50 60 70 80 90 100 Betw. Cent. (N) 20 30 40 50 60 70 80 90 100 20 30 40 50 60 70 80 90 100 20 30 40 50 60 70 80 90 100 20 30 40 50 60 70 80 90 100 20 30 40 50 60 70 80 90 100 20 30 40 50 60 70 80 90 100 20 30 40 50 60 70 80 90 100 20 30 40 50 60 70 80 90 100 20 30 40 50 60 70 80 90 100 20 30 40 50 60 70 80 90 100 20 30 40 50 60 70 80 90 100 20 30 40 50 60 70 80 90 100 Clos. Cent. 20 30 40 50 60 70 80 90 100 20 30 40 50 60 70 80 90 100 20 30 40 50 60 70 80 90 100 20 30 40 50 60 70 80 90 100 20 30 40 50 60 70 80 90 100 20 30 40 50 60 70 80 90 100 20 30 40 50 60 70 80 90 100 20 30 40 50 60 70 80 90 100 20 30 40 50 60 70 80 90 100 20 30 40 50 60 70 80 90 100 20 30 40 50 60 70 80 90 100 20 30 40 50 60 70 80 90 100 Clos. Cent. (N) Erdos−Renyi 20 30 40 50 60 70 80 90 100 20 30 40 50 60 70 80 90 100 Bernoulli 20 30 40 50 60 70 80 90 100 20 30 40 50 60 70 80 90 100 Mean Deg. Bernoulli 20 30 40 50 60 70 80 90 100 20 30 40 50 60 70 80 90 100 Markov 20 30 40 50 60 70 80 90 100 20 30 40 50 60 70 80 90 100 H Markov 20 30 40 50 60 70 80 90 100 20 30 40 50 60 70 80 90 100 H Bernoulli 20 30 40 50 60 70 80 90 100 20 30 40 50 60 70 80 90 100 T ransitivity 20 30 40 50 60 70 80 90 100 20 30 40 50 60 70 80 90 100 20 30 40 50 60 70 80 90 100 20 30 40 50 60 70 80 90 100 20 30 40 50 60 70 80 90 100 20 30 40 50 60 70 80 90 100 20 30 40 50 60 70 80 90 100 20 30 40 50 60 70 80 90 100 20 30 40 50 60 70 80 90 100 20 30 40 50 60 70 80 90 100 20 30 40 50 60 70 80 90 100 20 30 40 50 60 70 80 90 100 Avg. P ath Length 20 30 40 50 60 70 80 90 100 20 30 40 50 60 70 80 90 100 20 30 40 50 60 70 80 90 100 20 30 40 50 60 70 80 90 100 20 30 40 50 60 70 80 90 100 20 30 40 50 60 70 80 90 100 20 30 40 50 60 70 80 90 100 20 30 40 50 60 70 80 90 100 20 30 40 50 60 70 80 90 100 20 30 40 50 60 70 80 90 100 20 30 40 50 60 70 80 90 100 20 30 40 50 60 70 80 90 100 Density 20 30 40 50 60 70 80 90 100 20 30 40 50 60 70 80 90 100 20 30 40 50 60 70 80 90 100 20 30 40 50 60 70 80 90 100 20 30 40 50 60 70 80 90 100 20 30 40 50 60 70 80 90 100 20 30 40 50 60 70 80 90 100 20 30 40 50 60 70 80 90 100 20 30 40 50 60 70 80 90 100 20 30 40 50 60 70 80 90 100 The columns indicate different simulated datasets while the rows represent the different network statistics of interest. Each cell in a plot represents the 2-sample Kolmogorov-Smirno v statistic for the comparison of a network statistic’s distribution across two different netw ork sizes. The network sizes are indicated on both the x- and y-axes. Cells that are dark blue indicate that the distributions are very similar while those that are violet indicate that the distributions differ . 3. Compar ing Netw ork Statistics 3.1. Review of Existing Approaches Anderson et al. (1999) suggest specifying a baseline network model and using the distribution of the desired statistic calculated on a set of netw orks simulated from this model as a reference distribution, which can be used to standardize the observed statistic. Based on the observation that many common netw ork statistics depend on both the size and density of the underlying network, they suggest using a model which adjusts for these characteristics. How ev er , when comparing netw orks that vary in both size and density , this means making comparisons across netw orks based on reference distributions that also v ar y across the netw orks. Instead, comparisons w ould be more straight for w ard and more readily interpretable if the comparisons across netw orks are made relativ e to a single reference distribution that is common across all the networks under consideration and represents some kind of absolute baseline model. In this sense, not only can one compare netw orks within a dataset but across datasets where the adjustments w ere perhaps perfor med by different researchers. Of course, choosing a realistic fully parameterized reference distribution for comparison a priori is certainly not a straight for w ard task. A simple choice might be a completely random graph, or the Erd ˝ os-Rényi model. W e inv estigate this option as a special case of our more general method in S ection 4. Intuitively , standardizing relative to the Erd ˝ os-Rényi model might be an impro vement ov er direct comparison, but could remain problematic in some cases since Erd ˝ os-Rényi netw orks simply fail to exhibit the type of structural detail and topological features that w e typically obser v e in real w orld netw orks. Of course, w e could consider different v ersions of an a priori fully parameterized reference distribution, but as V an W ijk et al. (2010) point out, this requires complete trust in the validity of whichev er baseline model is used. 3.2. A New Mixture Model Reference Distribution W e propose a new reference distribution which is for med by a mixture of random graph models, where w e mix ov er the dependence and structural features actually manifested in the obser v ed dataset. Specifically , w e suggest mixing ov er the dependence structure exhibited in a subset of netw orks randomly selected from the entire collection of obser v ed netw orks. In this wa y , the refer ence distribution is common across all netw orks being considered and will, by design, mimic the structure of the networks being compared as well as reflect the natural v ariability among the observ ed netw orks. Our proposed methodology hopes to dra w on the historical success of mixture models as a class of flexible models which are particularly advantageous in situtations where it is dif ficult or undesirable to fully specify a traditional model a priori, such as in Newcomb (1886)’s model for outliers or Pearson (1894)’s w ork with ev olutionar y populations. Ho w ev er , note that our proposed methodology will result in relative comparisons across netw orks, since the reference distribution is empirically-based rather than for med a priori. 10 This type of relativ e comparison is not unique to the methodology w e propose here. Consider the familiar case in which a set of correlated v ariables are considered for inclusion as cov ariates in a regression analysis. Including the full set directly w ould lead to unstable coefficient estimates due to multicollinearity . Instead, a dimension-reduction technique like principal components analysis (PCA) can be used; PCA uses an orthogonal transfor mation to conv ert a set of possibly correlated v ariables into a set of linearly uncorrelated transfor mations of these variables, called principal components. And it does so in such a w ay that the first principal component accounts for the largest v ariance in the original set of variables, the second principal component accounts for the second largest amount of v ariance and so on. Although the v alue of the principal components themselves do not ha ve the same physical meaning as the orginal set of variables which w ere first considered, they still capture (most of) the variability and the underlying content of the original set. Similarly , the value of a network statistic adjusted via the mixture model adjustment will not ha v e meaning in and of itself, but will be v er y meaningful relativ e to statistics calculated on other netw orks that are adjusted in the same wa y . Thus, similar to a PCA style analysis, results from the mixture model adjustment will pick out differences among the set of obser v ed networks, rather than relativ e to some absolute scale. The procedure for this method can be divided into two main components: Again, suppose w e observe a collection of netw orks Y = { Y 1 , Y 2 , ... Y N } with corresponding sizes n = { n 1 , n 2 , ... n N } . Let η ( · ) be our network statistic of interest. Component 1: Mixture Model Parameter Selection 1. Randomly select N M netw orks from Y 2. Fit a graph model separately to each of these networks. Let the obtained parameter estimates be denoted b y b θ = n b θ 1 , b θ 2 , ... b θ N M o where b θ j is the v ector of parameter estimates from fitting the model to the j th network selected in step one. Component 2: Mixture Model Simulation and Adjustment For i = 1, ... N , 1. For j = 1, ... N M , simulate N S N M graphs of size n i setting θ = b θ j . 2. Call the entire collection of simulated netw orks e Y ( i ) = n e Y ( i ) 1 , e Y ( i ) 2 , ... e Y ( i ) N S o . 3. Compute η Y ( i ) k for k = 1, ... N s and find the sample mean, m ( i ) η , and sample standard deviation, s ( i ) η , of this distribution. 4. Finally compute the z-score: z i = z Y i | e Y ( i ) , N S , N M = η ( Y i ) − m ( i ) η s ( i ) η . where N M ≤ N and N S is some large positiv e integer divisible by N M . Note that the computational efficiency of this algorithm can be improv ed by letting i index only the unique elements in n . Here, w e ha v e chosen to use a v er y intuitiv e standardization measure, a z-score, though other measures ha v e been suggested (V an W ijk et al., 2010). While distributions of network statistics for Erd ˝ os-Rényi graphs are known in some special cases, the distribution of a giv en statistic for some arbitrar y netw ork model is generally unknown. Ho w ev er , from past obser v ations and Figure 4, a normal distribution might be a relativ ely w ell-fitting approximation in some cases, and so, a z-score is a plausible standardization measure here. Notice that in this algorithm, we hav e intentionally left the for m of the network model used for simulating the reference distribution in this procedure unspecified. There ma y be situtations in which a researcher thinks one model is appropriate giv en the type of netw orks under consideration, or perhaps certain network statistics are more amenable to adjustments utilizing a particular class of network models. One particular special case is w orth pointing out: If the Erd ˝ os-Rényi model is utilized, note that Component 1 of the abo ve algorithm is no longer necessary since ˆ θ j = logit ( 0.50 ) ∀ j = 1, ... N M and the 11 reference distribution is not only common across all netw orks but also an absolute reference distribution (i.e. it is no longer a mixture distribution and does not depend on the data in any wa y). Finally , note that this procedure requires fitting N M separate network models and thus network models in which obtaining parameter estimates can be more easily automated will be preferred. 4. Simulation Study: n -dependence 4.1. Methods T o consider the efficacy of this method, w e tur n to a simulation study . T reating the raw statistics from S ection 2.3 as our observed datasets, we apply this standardization method with N M = 30 and N S = 1000 to each network statistic and generativ e model pairing. Note that for each generative model considered, N = 1800 netw orks. In ter ms of the network model used for simulating the mixture reference distribution in this adjustment, we consider four options: the special case of a fully parameterized reference distribution utilizing the Erd ˝ os-Rényi model, the traditional Ber noulli model, the mean degree preserving Ber noulli model, and the Hierarchical Ber noulli model. For each resulting v ersion of the Mixture Model Adjustment, the netw ork models will be fit using standard functions in the statnet (Handcock et al., 2015) and hergm (Schweinber ger et al., 2015) packages for R . Recall that the Erd ˝ os-Rényi model is simply a special case of the Ber noulli model, where w e fix the probability of a tie to be 0.50. Thus, w e might expect to see improv ements o v er results from an Erd ˝ os-Rényi adjustment, if we simply allow the density of the graphs in the reference distribution to vary , in a wa y that matches the empirical distribution of densities of our obser v ed networks. This is precisely what we allow by utilizing the Ber noulli model in our Mixture Model Adjustment 3 Similarly , using the mean degree preserving v ersion of the Ber noulli model will mix ov er graphs that mimic the av erage degree of our obser v ed networks. Since density and a v erage degree are closely related, w e might expect these tw o v ersions of the approach to perfor m similarly . How ev er , recall that the main difference between these tw o models is their behavior as network size increases: the Ber noulli model maintains density , while adding Krivitsky et al. (2011)’s offset preser v es mean degree. W e might expect that whichev er regime is present in the obser v ed dataset, that it’s corresponding model might prov e a better fit for the mixture model adjustment procedure. Perhaps the next more complicated graph model w ould be some ERG-type model which includes not only a density effect but also some structural statistics, such as triangles or k-stars. Ho w ev er , due to Shalizi and Rinaldo’s result, w e do not believ e that ERGM parameters ha v e the same meaning across different netw ork sizes (2013). So, using an ERGM to simulate the mixture reference distribution w ould most likely be inappropriate. Further , ERGMs are notoriously dif ficult to fit, particularly when model ter ms are exclusiv ely structural, and thus further unsuited for this methodology . As mentioned earlier , the Hierarchical ERGMs dev eloped b y S chw einberger and Handcock do not face such issues. In fact, the authors sho w that HERGMs do for m a type of pr ojective family , although this type of consistency is a w eaker condition than that considered by Shalizi and Rinaldo (S chw einberger and Handcock, 2015). Ho w ev er , HERGMs in their current implementation take much longer to fit than traditional ERGMs (hours rather than minutes, ev en for relativ ely small netw orks), though the resulting model fits are significantly more stable and reliable. Since our proposed method requires fitting N M netw ork models, w e use only the Hierarchical Ber noulli v ersion of the HERGM, rather than the more complex Hierarchical Markov model described in S ection 2.2. In this implementation, when we fit the Hierarchical Bernoulli to the N M randomly selected obser v ed netw orks, w e assume the number of neighborhoods is unknown and use a nonparametric stick-breaking prior for the neighborhood membership parameters, π . W e set the maximum number of neighborhoods to be K = n 5 . When w e simulate the reference distribution for med from the parameter estimates obtained abov e, w e follo w the same model set up as for the simulated Hierarchical Ber noulli netw orks (described in S ection 2.2), letting α = 10 and setting K , θ , θ bt w , and the diagonal entries of Σ equal to the estimates from the model fitting step in the first component of the algorithm. 3 Note that the term “Mixture” in the name for our proposed methodology refers to the distribution of simulated networks in step one of Component 2 of our algorithm. These networks are simulated according to a mixture of different specifications of a particular netw ork model where the components of this mixture are for med in step tw o of Component 1. For example, w e might simulate networks from a Ber noulli model, mixing ov er the log odds of a tie betw een -2, 1.4, and 0.2. Note that our proposed methodology does not (currently) incor porate any of the so-called mixture models for random graphs (e.g. Daudin et al., 2008) in which a single netw ork is modeled as a mixture of random graphs. 12 Figure 6: Perfor mance of Mixture Model Adjustments Erdos&Renyi, Bernoulli, Mean,Degree, Bernoulli, Markov, Hierarchical, Markov, Hierarchical, Bernoulli, Simulated, Dataset:, 0.00, 0.02, 0.04, 0.06, 0.08, 0.10, D e g r e e , C e n tr al i ty , C l o s e n e s s , C e n tr al i ty , A v e r ag e , P ath , L e n g th , No#Adjustment# Degree, Centrality, Closeness, Centrality, Betweenness, Centrality, TransiJvity, Average,Path, Length, Density, 0.00, 0.02, 0.04, 0.06, 0.08, 0.10, D e g r e e , C e n tr al i ty , C l o s e n e s s , C e n tr al i ty , A v e r ag e , P ath , L e n g th , Erdos/Renyi#Adjustment# Degree, Centrality, Closeness, Centrality, Betweenness, Centrality, TransiJvity, Average,Path, Length, Density, 0.00, 0.02, 0.04, 0.06, 0.08, 0.10, D e g r e e , C e n tr al i ty , C l o s e n e s s , C e n tr al i ty , A v e r ag e , P ath , L e n g th , Bernoulli#Adjustment# Degree, Centrality, Closeness, Centrality, Betweenness, Centrality, TransiJvity, Average,Path, Length, Density, 0.00, 0.02, 0.04, 0.06, 0.08, 0.10, D e g r e e , C e n tr al i ty , C l o s e n e s s , C e n tr al i ty , A v e r ag e , P ath , L e n g th , Mean#Degree#Bernoulli#Adjustment# Degree, Centrality, Closeness, Centrality, Betweenness, Centrality, TransiJvity, Average,Path, Length, Density, 0.00, 0.02, 0.04, 0.06, 0.08, 0.10, D e g r e e , C e n tr al i ty , C l o s e n e s s , C e n tr al i ty , A v e r ag e , P ath , L e n g th , Hierarchical#Bernoulli#Adjustment# Degree, Centrality, Closeness, Centrality, Betweenness, Centrality, TransiJvity, Average,Path, Length, Density, Each plot represents a different version of the mixture model approach, including no adjustment. The height of the bar corresponds to the inv erse of the Anderson-Darling statistics, so that taller bars correspond to distributions that are more similar across varying network sizes. For simplicityj, values abov e 0.10 are not shown here; the maximum is 0.13. 4.2. Results As before, w e use the three metrics from S ection 2.3 to examine the results of these mixture model adjustments: histograms, heat maps of Kolmogoro v-Smir no v statistics, and k-Sample Anderson-Darling statistics. Intuitiv ely , if the method is effectiv e, then, relativ e to the comparison metrics for the ra w statistics, w e expect the histograms to o verlap each other , the heat maps to ha v e more dark blue cells, and the Anderson-Darling statistics to be smaller . Note that the nor malized v ersions of the centralization measures are excluded here since the normalization adjustment is linear for a fixed network size and thus z-scores for the nor malized and unnormalized v ersions of these statistics are equiv alent. These figures are av ailable in the Supplementary Materials. As a summar y of these results, w e provide bar charts in Figure 6 of the recipr ocal of the Anderson-Darling statistics across each adjustment method, so that taller bars correspond to better performance (i.e. adjusted distributions of netw ork statistics that are more similar across netw ork sizes). Not sur prisingly , the Erd ˝ os-Rényi adjustment w orks strikingly w ell when the data are actually generated from the Erd ˝ os- Rényi model. How ev er , problems occur when the obser v ed netw orks more strongly resemble real w orld netw ork data, i.e. are simulated from the other generativ e models considered here. In particular , this adjustment performs v ery poorly for all of the topological measures computed on non-Erd ˝ os-Rényi simulated netw orks. Ho we v er , w e do see that using the Erd ˝ os-Rényi adjustment for the centralization measures appears to be an improv ement o ver direct comparison. Thus, the Erd ˝ os-Rényi adjustment method described here is certainly an impro v ement ov er direct comparison, but is still sometimes problematic (especially in the case of topological measures). Note also that this adjustment method is v ery easily implemented, computationally inexpensiv e (for graphs similar in size to those examined here - the computational burden increases with network size), and is an example of a fully parameterized reference distribution. Considering the first nontrivial v ersion of the Mixture Model Adjustment, where the Ber noulli model is used, w e see many impro v ements relative to adjustment using the Erd ˝ os-Rényi model. Recall that the Erd ˝ os-Rényi adjustment seemed most suited for centralization scores. How ev er , we see ev en further improv ements in the results based on this Ber noulli v ersion of the Mixture Model Adjustment. The results from this mixture model adjustment are more comparable across all simulated datasets. Recall also that the Erd ˝ os-Rényi adjustment perfor med quite poorly for the topological measures, so it is more appropriate 13 to compare the results of the Mixture Model Adjustments to the ra w topological netw ork statistics themselves. Here w e see significant impro vements, particularly for the simulated datasets where the netw orks are generated from the Bernoulli model and both v ersions of the HERGMs implemented here. Ho we v er , the Bernoulli v ersion of the Mixture Model Adjustment for the network statistics calculated on Markov graphs does not appear to offer any adv antanges ov er direct comparison of the statistics themselv es. This is not too alar ming, giv en the previously mentioned result which sho ws that ERG-type models like this one do not form projectiv e families (Shalizi and Rinaldo, 2013). This result implies that parameters in such models are not comparable across different network sizes and so, the dataset of simulated Markov graphs that w e ha v e used here might not be particularly meaningful, i.e. it might not exhibit the same type of structure across different network sizes. If this is the case, w e w ould not expect any type of adjustment method to be able to “fix” such an issue. The simulation results examined here demonstrate that our proposed mixture model adjustment, where w e use the Ber noulli model to for m the simulated mixture reference distribution, offers a computationally inexpensiv e w ay to make reliable comparisons of both centralization and topological network statistics across netw orks of different size (see T able 5 in the Appendix for a comparison of computation times across methods). As expected, the version of the Mixture Model Adjustment which uses the mean degree preser ving Ber noulli model performs w ell for datasets where netw ork degree is preserv ed as network size grows, i.e. on netw orks generated from the mean degree preservng Ber noulli model. How ev er , if this is not the case, the original Ber noulli version of the Mixture Model Adjustment appears to offer more comparable adjusted network statistics. Further , note that using the original Bernoulli v ersion of the Mixture Model Adjustment for netw orks generated from the mean degree preserving v ersion (and vice v ersa) appears to be a poor choice. Thus, in choosing a parametric model to implement in the Mixture Model Adjustment, it is v ery important to examine (both empirically and theoretically) whether density or a v erage degree is presev ered as netw ork size grows. Surprisingly , when w e increase the complexity and flexibility of the reference model in the Mixture Model Adjustment algorithm to the Hierarchical Bernoulli model, w e do not see much impro vement and, in fact, the adjusted statistics look slightly less comparable across network sizes in many cases. Although the centrality measures look relativ ely comparable across network sizes, the topological network statistics’ distributions still sho w evidence of some dependence on n , particularly when calculated on non-Ber noulli graphs. There are two plausible explanations for this behavior . First, perhaps this model is simply too complex to fit and simulate from in an automated w a y , as is required b y the Mixture Model Adjustment. That is, perhaps the adjusted statistics w ould benefit from more model fine-tuning, such as tr ying different values of K m ax or respecifying prior parameter v alues. S econdly , while the Hierarchical Ber noulli model is logically appealing and perhaps more suited to real-w orld netw ork data than the simple Bernoulli model, it ma y be a poor model for the simulated datasets examined here. How ev er , its mediocre performance f or network statistics calculated on networks simulated from the Hierarchical Bernoulli distribution itself is curious. 5. Simulation Study: Feature Detection W e ha v e demonstrated that the mixture model adjustment can be used to produce adjusted network statistics that are amenable to comparison across netw orks of different size. In this section, w e design and implement a small simulation study to confir m that the adjusted netw ork statistics can still be used in much the same wa y as the original, raw network statistics themselv es: to indentify relev ant structural features of observed networks. W e simulate netw orks from tw o slightly different models, use the Mixture Model Adjustment to produce adjusted v ersions of our common network statistics, and examine these statistics to check that our adjusted statistics are able to detect the difference betw een the netw orks generated from different models, at least to the extent that the unadjusted statistics are capable of detecting the difference. W e use our most realistic generativ e model, the Hierarchical Markov ERGM, under the same settings described in S ection 2.2 but change θ bt w to create a second v ersion of this model. More specifically , w e consider tw o v ersions of the Hierarchical Marko v ERGM here: one where the probability of connections betw een neighborhoods is 0.10 and one where this probability is 0.25. W e simulate N n = 250 replicates from these two Hierarchical Marko v ERGMs with network sizes n = 20, 30, ...100, for a total of N = 2250 simulated netw orks per generativ e model. Giv en its superior perfor mance in the simulation studies in the previous section, we use the Bernoulli model to produce the mixture reference distribution and obtain adjusted netw ork statistic values. W e provide boxplots of the results in Figure 7. W e are primarily concerned with whether perceiv able differences betw een the 14 Figure 7: Boxplots of Netw ork Statistics from T w o Hierarchical Markov ERGMs ● ● ● ● ● ● ● ● ● ● ● ● ● ● ● ● ● ● ● ● ● ● ● ● ● ● ● ● ● ● ● ● ● ● ● ● ● ● ● ● ● ● ● ● ● ● ● ● ● ● ● 0.1 0.2 0.3 0.4 Degree Centrality − Raw n 20 30 40 50 60 70 80 90 100 ● ● ● ● ● ● ● ● ● ● ● ● ● ● ● ● ● ● ● ● ● ● ● ● ● ● ● ● ● ● ● ● ● ● ● ● ● ● ● ● ● ● ● ● ● ● ● ● ● ● ● ● ● ● ● ● ● ● ● ● ● ● ● ● ● ● ● ● ● ● ● ● ● ● ● ● ● ● ● ● ● ● ● ● ● ● ● ● ● ● ● ● ● ● ● ● ● ● ● ● ● ● ● ● ● ● ● ● 0.0 0.1 0.2 0.3 0.4 Betweenness Centrality − Ra w n 20 30 40 50 60 70 80 90 100 ● ● ● ● ● ● ● ● ● ● ● ● ● ● ● ● ● ● ● ● ● ● ● ● ● ● ● ● ● ● ● ● ● ● ● ● ● ● ● ● ● ● ● ● ● ● ● ● ● ● ● ● ● ● ● ● ● ● ● ● ● ● ● ● ● ● ● ● ● 0.1 0.2 0.3 0.4 0.5 Closeness Centrality − Ra w n 20 30 40 50 60 70 80 90 100 ● ● ● ● ● ● ● ● ● ● ● ● ● ● ● ● ● ● ● ● ● ● ● ● 0.1 0.2 0.3 0.4 0.5 0.6 0.7 T ransitivity − Ra w n 20 30 40 50 60 70 80 90 100 ● ● ● ● ● ● ● ● ● ● ● ● ● ● ● ● ● ● ● ● ● ● ● ● ● ● ● ● ● ● ● ● ● ● ● ● ● ● ● ● ● 1.5 2.0 2.5 3.0 A vg. P ath Length − Ra w n 20 30 40 50 60 70 80 90 100 ● ● ● ● ● ● ● ● ● ● ● ● ● ● ● ● ● ● ● ● ● 0.2 0.3 0.4 0.5 0.6 Density − Ra w n 20 30 40 50 60 70 80 90 100 ● ● ● ● ● ● ● ● ● ● ● ● ● ● ● ● ● ● ● ● ● ● ● ● ● ● ● ● ● ● ● ● ● ● ● ● ● ● ● ● ● ● ● ● ● ● ● ● ● ● ● − 2 0 2 4 6 Degree Centrality − Adjusted n 20 30 40 50 60 70 80 90 100 ● ● ● ● ● ● ● ● ● ● ● ● ● ● ● ● ● ● ● ● ● ● ● ● ● ● ● ● ● ● ● ● ● ● ● ● ● ● ● ● ● ● ● ● ● ● ● ● ● ● ● ● ● ● ● ● ● ● ● ● ● ● ● ● ● ● ● ● ● ● ● ● ● ● ● ● ● ● ● ● ● ● ● ● ● ● ● ● ● ● ● ● ● ● ● ● ● ● ● ● ● ● ● ● ● ● ● ● 0 2 4 6 Betweenness Centrality − Adjusted n 20 30 40 50 60 70 80 90 100 ● ● ● ● ● ● ● ● ● ● ● ● ● ● ● ● ● ● ● ● ● ● ● ● ● ● ● ● ● ● ● ● ● ● ● ● ● ● ● ● ● ● ● ● ● ● ● ● ● ● ● ● ● ● ● ● ● ● ● ● ● ● ● ● ● ● ● ● ● − 2 0 2 4 Closeness Centrality − Adjusted n 20 30 40 50 60 70 80 90 100 ● ● ● ● ● ● ● ● ● ● ● ● ● ● ● ● ● ● ● ● ● ● ● ● − 2 0 2 4 T ransitivity − Adjusted n 20 30 40 50 60 70 80 90 100 ● ● ● ● ● ● ● ● ● ● ● ● ● ● ● ● ● ● ● ● ● ● ● ● ● ● ● ● ● ● ● ● ● ● ● ● ● ● ● ● ● − 2 0 2 4 6 A vg. P ath Length − Adjusted n 20 30 40 50 60 70 80 90 100 ● ● ● ● ● ● ● ● ● ● ● ● ● ● ● ● ● ● ● ● ● − 3 − 2 − 1 0 1 2 3 Density − Adjusted n 20 30 40 50 60 70 80 90 100 ● ● ● ● ● ● ● ● ● ● ● ● ● ● ● ● ● ● ● ● ● ● ● ● ● ● ● ● ● ● ● ● ● ● ● ● ● ● ● ● ● ● ● ● ● ● ● ● ● ● ● 0.1 0.2 0.3 0.4 Degree Centrality − Ra w n 20 30 40 50 60 70 80 90 100 ● ● ● ● ● ● ● ● ● ● ● ● ● ● ● ● ● ● ● ● ● ● ● ● ● ● ● ● ● ● ● ● ● ● ● ● ● ● ● ● ● ● ● ● ● ● ● ● ● ● ● ● ● ● ● ● ● ● ● ● ● ● ● ● ● ● ● ● ● ● ● ● ● ● ● ● ● ● ● ● ● ● ● ● ● ● ● ● ● ● ● ● ● ● ● ● ● ● ● ● ● ● ● ● ● ● ● ● 0.0 0.1 0.2 0.3 0.4 Betweenness Centrality − Ra w n 20 30 40 50 60 70 80 90 100 ● ● ● ● ● ● ● ● ● ● ● ● ● ● ● ● ● ● ● ● ● ● ● ● ● ● ● ● ● ● ● ● ● ● ● ● ● ● ● ● ● ● ● ● ● ● ● ● ● ● ● ● ● ● ● ● ● ● ● ● ● ● ● ● ● ● ● ● ● 0.1 0.2 0.3 0.4 0.5 Closeness Centrality − Ra w n 20 30 40 50 60 70 80 90 100 ● ● ● ● ● ● ● ● ● ● ● ● ● ● ● ● ● ● ● ● ● ● ● ● 0.1 0.2 0.3 0.4 0.5 0.6 0.7 T ransitivity − Ra w n 20 30 40 50 60 70 80 90 100 ● ● ● ● ● ● ● ● ● ● ● ● ● ● ● ● ● ● ● ● ● ● ● ● ● ● ● ● ● ● ● ● ● ● ● ● ● ● ● ● ● 1.5 2.0 2.5 3.0 A vg. P ath Length − Ra w n 20 30 40 50 60 70 80 90 100 ● ● ● ● ● ● ● ● ● ● ● ● ● ● ● ● ● ● ● ● ● 0.2 0.3 0.4 0.5 0.6 Density − Raw n 20 30 40 50 60 70 80 90 100 ● ● ● ● ● ● ● ● ● ● ● ● ● ● ● ● ● ● ● ● ● ● ● ● ● ● ● ● ● ● ● ● ● ● ● ● ● ● ● ● ● ● ● ● ● ● ● ● ● ● ● − 2 0 2 4 6 Degree Centrality − Adjusted n 20 30 40 50 60 70 80 90 100 ● ● ● ● ● ● ● ● ● ● ● ● ● ● ● ● ● ● ● ● ● ● ● ● ● ● ● ● ● ● ● ● ● ● ● ● ● ● ● ● ● ● ● ● ● ● ● ● ● ● ● ● ● ● ● ● ● ● ● ● ● ● ● ● ● ● ● ● ● ● ● ● ● ● ● ● ● ● ● ● ● ● ● ● ● ● ● ● ● ● ● ● ● ● ● ● ● ● ● ● ● ● ● ● ● ● ● ● 0 2 4 6 Betweenness Centrality − Adjusted n 20 30 40 50 60 70 80 90 100 ● ● ● ● ● ● ● ● ● ● ● ● ● ● ● ● ● ● ● ● ● ● ● ● ● ● ● ● ● ● ● ● ● ● ● ● ● ● ● ● ● ● ● ● ● ● ● ● ● ● ● ● ● ● ● ● ● ● ● ● ● ● ● ● ● ● ● ● ● − 2 0 2 4 Closeness Centrality − Adjusted n 20 30 40 50 60 70 80 90 100 ● ● ● ● ● ● ● ● ● ● ● ● ● ● ● ● ● ● ● ● ● ● ● ● − 2 0 2 4 T ransitivity − Adjusted n 20 30 40 50 60 70 80 90 100 ● ● ● ● ● ● ● ● ● ● ● ● ● ● ● ● ● ● ● ● ● ● ● ● ● ● ● ● ● ● ● ● ● ● ● ● ● ● ● ● ● − 2 0 2 4 6 A vg. P ath Length − Adjusted n 20 30 40 50 60 70 80 90 100 ● ● ● ● ● ● ● ● ● ● ● ● ● ● ● ● ● ● ● ● ● − 3 − 2 − 1 0 1 2 3 Density − Adjusted n 20 30 40 50 60 70 80 90 100 ● ● ● ● ● ● ● ● ● ● ● ● ● ● ● ● ● ● ● ● ● ● ● ● ● ● ● ● ● ● ● ● ● ● ● ● ● ● ● ● ● ● ● ● ● ● ● ● ● ● ● 0.1 0.2 0.3 0.4 Degree Centrality − Ra w n 20 30 40 50 60 70 80 90 100 ● ● ● ● ● ● ● ● ● ● ● ● ● ● ● ● ● ● ● ● ● ● ● ● ● ● ● ● ● ● ● ● ● ● ● ● ● ● ● ● ● ● ● ● ● ● ● ● ● ● ● ● ● ● ● ● ● ● ● ● ● ● ● ● ● ● ● ● ● ● ● ● ● ● ● ● ● ● ● ● ● ● ● ● ● ● ● ● ● ● ● ● ● ● ● ● ● ● ● ● ● ● ● ● ● ● ● ● 0.0 0.1 0.2 0.3 0.4 Betweenness Centrality − Raw n 20 30 40 50 60 70 80 90 100 ● ● ● ● ● ● ● ● ● ● ● ● ● ● ● ● ● ● ● ● ● ● ● ● ● ● ● ● ● ● ● ● ● ● ● ● ● ● ● ● ● ● ● ● ● ● ● ● ● ● ● ● ● ● ● ● ● ● ● ● ● ● ● ● ● ● ● ● ● 0.1 0.2 0.3 0.4 0.5 Closeness Centrality − Ra w n 20 30 40 50 60 70 80 90 100 ● ● ● ● ● ● ● ● ● ● ● ● ● ● ● ● ● ● ● ● ● ● ● ● 0.1 0.2 0.3 0.4 0.5 0.6 0.7 T ransitivity − Ra w n 20 30 40 50 60 70 80 90 100 ● ● ● ● ● ● ● ● ● ● ● ● ● ● ● ● ● ● ● ● ● ● ● ● ● ● ● ● ● ● ● ● ● ● ● ● ● ● ● ● ● 1.5 2.0 2.5 3.0 A vg. P ath Length − Ra w n 20 30 40 50 60 70 80 90 100 ● ● ● ● ● ● ● ● ● ● ● ● ● ● ● ● ● ● ● ● ● 0.2 0.3 0.4 0.5 0.6 Density − Ra w n 20 30 40 50 60 70 80 90 100 ● ● ● ● ● ● ● ● ● ● ● ● ● ● ● ● ● ● ● ● ● ● ● ● ● ● ● ● ● ● ● ● ● ● ● ● ● ● ● ● ● ● ● ● ● ● ● ● ● ● ● − 2 0 2 4 6 Degree Centrality − Adjusted n 20 30 40 50 60 70 80 90 100 ● ● ● ● ● ● ● ● ● ● ● ● ● ● ● ● ● ● ● ● ● ● ● ● ● ● ● ● ● ● ● ● ● ● ● ● ● ● ● ● ● ● ● ● ● ● ● ● ● ● ● ● ● ● ● ● ● ● ● ● ● ● ● ● ● ● ● ● ● ● ● ● ● ● ● ● ● ● ● ● ● ● ● ● ● ● ● ● ● ● ● ● ● ● ● ● ● ● ● ● ● ● ● ● ● ● ● ● 0 2 4 6 Betweenness Centrality − Adjusted n 20 30 40 50 60 70 80 90 100 ● ● ● ● ● ● ● ● ● ● ● ● ● ● ● ● ● ● ● ● ● ● ● ● ● ● ● ● ● ● ● ● ● ● ● ● ● ● ● ● ● ● ● ● ● ● ● ● ● ● ● ● ● ● ● ● ● ● ● ● ● ● ● ● ● ● ● ● ● − 2 0 2 4 Closeness Centrality − Adjusted n 20 30 40 50 60 70 80 90 100 ● ● ● ● ● ● ● ● ● ● ● ● ● ● ● ● ● ● ● ● ● ● ● ● − 2 0 2 4 T ransitivity − Adjusted n 20 30 40 50 60 70 80 90 100 ● ● ● ● ● ● ● ● ● ● ● ● ● ● ● ● ● ● ● ● ● ● ● ● ● ● ● ● ● ● ● ● ● ● ● ● ● ● ● ● ● − 2 0 2 4 6 A vg. P ath Length − Adjusted n 20 30 40 50 60 70 80 90 100 ● ● ● ● ● ● ● ● ● ● ● ● ● ● ● ● ● ● ● ● ● − 3 − 2 − 1 0 1 2 3 Density − Adjusted n 20 30 40 50 60 70 80 90 100 ● ● ● ● ● ● ● ● ● ● ● ● ● ● ● ● ● ● ● ● ● ● ● ● ● ● ● ● ● ● ● ● ● ● ● ● ● ● ● ● ● ● ● ● ● ● ● ● ● ● ● 0.1 0.2 0.3 0.4 Degree Centrality − Ra w n 20 30 40 50 60 70 80 90 100 ● ● ● ● ● ● ● ● ● ● ● ● ● ● ● ● ● ● ● ● ● ● ● ● ● ● ● ● ● ● ● ● ● ● ● ● ● ● ● ● ● ● ● ● ● ● ● ● ● ● ● ● ● ● ● ● ● ● ● ● ● ● ● ● ● ● ● ● ● ● ● ● ● ● ● ● ● ● ● ● ● ● ● ● ● ● ● ● ● ● ● ● ● ● ● ● ● ● ● ● ● ● ● ● ● ● ● ● 0.0 0.1 0.2 0.3 0.4 Betweenness Centrality − Ra w n 20 30 40 50 60 70 80 90 100 ● ● ● ● ● ● ● ● ● ● ● ● ● ● ● ● ● ● ● ● ● ● ● ● ● ● ● ● ● ● ● ● ● ● ● ● ● ● ● ● ● ● ● ● ● ● ● ● ● ● ● ● ● ● ● ● ● ● ● ● ● ● ● ● ● ● ● ● ● 0.1 0.2 0.3 0.4 0.5 Closeness Centrality − Raw n 20 30 40 50 60 70 80 90 100 ● ● ● ● ● ● ● ● ● ● ● ● ● ● ● ● ● ● ● ● ● ● ● ● 0.1 0.2 0.3 0.4 0.5 0.6 0.7 T ransitivity − Ra w n 20 30 40 50 60 70 80 90 100 ● ● ● ● ● ● ● ● ● ● ● ● ● ● ● ● ● ● ● ● ● ● ● ● ● ● ● ● ● ● ● ● ● ● ● ● ● ● ● ● ● 1.5 2.0 2.5 3.0 A vg. P ath Length − Ra w n 20 30 40 50 60 70 80 90 100 ● ● ● ● ● ● ● ● ● ● ● ● ● ● ● ● ● ● ● ● ● 0.2 0.3 0.4 0.5 0.6 Density − Ra w n 20 30 40 50 60 70 80 90 100 ● ● ● ● ● ● ● ● ● ● ● ● ● ● ● ● ● ● ● ● ● ● ● ● ● ● ● ● ● ● ● ● ● ● ● ● ● ● ● ● ● ● ● ● ● ● ● ● ● ● ● − 2 0 2 4 6 Degree Centrality − Adjusted n 20 30 40 50 60 70 80 90 100 ● ● ● ● ● ● ● ● ● ● ● ● ● ● ● ● ● ● ● ● ● ● ● ● ● ● ● ● ● ● ● ● ● ● ● ● ● ● ● ● ● ● ● ● ● ● ● ● ● ● ● ● ● ● ● ● ● ● ● ● ● ● ● ● ● ● ● ● ● ● ● ● ● ● ● ● ● ● ● ● ● ● ● ● ● ● ● ● ● ● ● ● ● ● ● ● ● ● ● ● ● ● ● ● ● ● ● ● 0 2 4 6 Betweenness Centrality − Adjusted n 20 30 40 50 60 70 80 90 100 ● ● ● ● ● ● ● ● ● ● ● ● ● ● ● ● ● ● ● ● ● ● ● ● ● ● ● ● ● ● ● ● ● ● ● ● ● ● ● ● ● ● ● ● ● ● ● ● ● ● ● ● ● ● ● ● ● ● ● ● ● ● ● ● ● ● ● ● ● − 2 0 2 4 Closeness Centrality − Adjusted n 20 30 40 50 60 70 80 90 100 ● ● ● ● ● ● ● ● ● ● ● ● ● ● ● ● ● ● ● ● ● ● ● ● − 2 0 2 4 T ransitivity − Adjusted n 20 30 40 50 60 70 80 90 100 ● ● ● ● ● ● ● ● ● ● ● ● ● ● ● ● ● ● ● ● ● ● ● ● ● ● ● ● ● ● ● ● ● ● ● ● ● ● ● ● ● − 2 0 2 4 6 A vg. P ath Length − Adjusted n 20 30 40 50 60 70 80 90 100 ● ● ● ● ● ● ● ● ● ● ● ● ● ● ● ● ● ● ● ● ● − 3 − 2 − 1 0 1 2 3 Density − Adjusted n 20 30 40 50 60 70 80 90 100 ● ● ● ● ● ● ● ● ● ● ● ● ● ● ● ● ● ● ● ● ● ● ● ● ● ● ● ● ● ● ● ● ● ● ● ● ● ● ● ● ● ● ● ● ● ● ● ● ● ● ● 0.1 0.2 0.3 0.4 Degree Centrality − Ra w n 20 30 40 50 60 70 80 90 100 ● ● ● ● ● ● ● ● ● ● ● ● ● ● ● ● ● ● ● ● ● ● ● ● ● ● ● ● ● ● ● ● ● ● ● ● ● ● ● ● ● ● ● ● ● ● ● ● ● ● ● ● ● ● ● ● ● ● ● ● ● ● ● ● ● ● ● ● ● ● ● ● ● ● ● ● ● ● ● ● ● ● ● ● ● ● ● ● ● ● ● ● ● ● ● ● ● ● ● ● ● ● ● ● ● ● ● ● 0.0 0.1 0.2 0.3 0.4 Betweenness Centrality − Ra w n 20 30 40 50 60 70 80 90 100 ● ● ● ● ● ● ● ● ● ● ● ● ● ● ● ● ● ● ● ● ● ● ● ● ● ● ● ● ● ● ● ● ● ● ● ● ● ● ● ● ● ● ● ● ● ● ● ● ● ● ● ● ● ● ● ● ● ● ● ● ● ● ● ● ● ● ● ● ● 0.1 0.2 0.3 0.4 0.5 Closeness Centrality − Ra w n 20 30 40 50 60 70 80 90 100 ● ● ● ● ● ● ● ● ● ● ● ● ● ● ● ● ● ● ● ● ● ● ● ● 0.1 0.2 0.3 0.4 0.5 0.6 0.7 T ransitivity − Raw n 20 30 40 50 60 70 80 90 100 ● ● ● ● ● ● ● ● ● ● ● ● ● ● ● ● ● ● ● ● ● ● ● ● ● ● ● ● ● ● ● ● ● ● ● ● ● ● ● ● ● 1.5 2.0 2.5 3.0 A vg. P ath Length − Ra w n 20 30 40 50 60 70 80 90 100 ● ● ● ● ● ● ● ● ● ● ● ● ● ● ● ● ● ● ● ● ● 0.2 0.3 0.4 0.5 0.6 Density − Ra w n 20 30 40 50 60 70 80 90 100 ● ● ● ● ● ● ● ● ● ● ● ● ● ● ● ● ● ● ● ● ● ● ● ● ● ● ● ● ● ● ● ● ● ● ● ● ● ● ● ● ● ● ● ● ● ● ● ● ● ● ● − 2 0 2 4 6 Degree Centrality − Adjusted n 20 30 40 50 60 70 80 90 100 ● ● ● ● ● ● ● ● ● ● ● ● ● ● ● ● ● ● ● ● ● ● ● ● ● ● ● ● ● ● ● ● ● ● ● ● ● ● ● ● ● ● ● ● ● ● ● ● ● ● ● ● ● ● ● ● ● ● ● ● ● ● ● ● ● ● ● ● ● ● ● ● ● ● ● ● ● ● ● ● ● ● ● ● ● ● ● ● ● ● ● ● ● ● ● ● ● ● ● ● ● ● ● ● ● ● ● ● 0 2 4 6 Betweenness Centrality − Adjusted n 20 30 40 50 60 70 80 90 100 ● ● ● ● ● ● ● ● ● ● ● ● ● ● ● ● ● ● ● ● ● ● ● ● ● ● ● ● ● ● ● ● ● ● ● ● ● ● ● ● ● ● ● ● ● ● ● ● ● ● ● ● ● ● ● ● ● ● ● ● ● ● ● ● ● ● ● ● ● − 2 0 2 4 Closeness Centrality − Adjusted n 20 30 40 50 60 70 80 90 100 ● ● ● ● ● ● ● ● ● ● ● ● ● ● ● ● ● ● ● ● ● ● ● ● − 2 0 2 4 T ransitivity − Adjusted n 20 30 40 50 60 70 80 90 100 ● ● ● ● ● ● ● ● ● ● ● ● ● ● ● ● ● ● ● ● ● ● ● ● ● ● ● ● ● ● ● ● ● ● ● ● ● ● ● ● ● − 2 0 2 4 6 A vg. P ath Length − Adjusted n 20 30 40 50 60 70 80 90 100 ● ● ● ● ● ● ● ● ● ● ● ● ● ● ● ● ● ● ● ● ● − 3 − 2 − 1 0 1 2 3 Density − Adjusted n 20 30 40 50 60 70 80 90 100 ● ● ● ● ● ● ● ● ● ● ● ● ● ● ● ● ● ● ● ● ● ● ● ● ● ● ● ● ● ● ● ● ● ● ● ● ● ● ● ● ● ● ● ● ● ● ● ● ● ● ● 0.1 0.2 0.3 0.4 Degree Centrality − Ra w n 20 30 40 50 60 70 80 90 100 ● ● ● ● ● ● ● ● ● ● ● ● ● ● ● ● ● ● ● ● ● ● ● ● ● ● ● ● ● ● ● ● ● ● ● ● ● ● ● ● ● ● ● ● ● ● ● ● ● ● ● ● ● ● ● ● ● ● ● ● ● ● ● ● ● ● ● ● ● ● ● ● ● ● ● ● ● ● ● ● ● ● ● ● ● ● ● ● ● ● ● ● ● ● ● ● ● ● ● ● ● ● ● ● ● ● ● ● 0.0 0.1 0.2 0.3 0.4 Betweenness Centrality − Ra w n 20 30 40 50 60 70 80 90 100 ● ● ● ● ● ● ● ● ● ● ● ● ● ● ● ● ● ● ● ● ● ● ● ● ● ● ● ● ● ● ● ● ● ● ● ● ● ● ● ● ● ● ● ● ● ● ● ● ● ● ● ● ● ● ● ● ● ● ● ● ● ● ● ● ● ● ● ● ● 0.1 0.2 0.3 0.4 0.5 Closeness Centrality − Ra w n 20 30 40 50 60 70 80 90 100 ● ● ● ● ● ● ● ● ● ● ● ● ● ● ● ● ● ● ● ● ● ● ● ● 0.1 0.2 0.3 0.4 0.5 0.6 0.7 T ransitivity − Ra w n 20 30 40 50 60 70 80 90 100 ● ● ● ● ● ● ● ● ● ● ● ● ● ● ● ● ● ● ● ● ● ● ● ● ● ● ● ● ● ● ● ● ● ● ● ● ● ● ● ● ● 1.5 2.0 2.5 3.0 Avg. P ath Length − Raw n 20 30 40 50 60 70 80 90 100 ● ● ● ● ● ● ● ● ● ● ● ● ● ● ● ● ● ● ● ● ● 0.2 0.3 0.4 0.5 0.6 Density − Ra w n 20 30 40 50 60 70 80 90 100 ● ● ● ● ● ● ● ● ● ● ● ● ● ● ● ● ● ● ● ● ● ● ● ● ● ● ● ● ● ● ● ● ● ● ● ● ● ● ● ● ● ● ● ● ● ● ● ● ● ● ● − 2 0 2 4 6 Degree Centrality − Adjusted n 20 30 40 50 60 70 80 90 100 ● ● ● ● ● ● ● ● ● ● ● ● ● ● ● ● ● ● ● ● ● ● ● ● ● ● ● ● ● ● ● ● ● ● ● ● ● ● ● ● ● ● ● ● ● ● ● ● ● ● ● ● ● ● ● ● ● ● ● ● ● ● ● ● ● ● ● ● ● ● ● ● ● ● ● ● ● ● ● ● ● ● ● ● ● ● ● ● ● ● ● ● ● ● ● ● ● ● ● ● ● ● ● ● ● ● ● ● 0 2 4 6 Betweenness Centrality − Adjusted n 20 30 40 50 60 70 80 90 100 ● ● ● ● ● ● ● ● ● ● ● ● ● ● ● ● ● ● ● ● ● ● ● ● ● ● ● ● ● ● ● ● ● ● ● ● ● ● ● ● ● ● ● ● ● ● ● ● ● ● ● ● ● ● ● ● ● ● ● ● ● ● ● ● ● ● ● ● ● − 2 0 2 4 Closeness Centrality − Adjusted n 20 30 40 50 60 70 80 90 100 ● ● ● ● ● ● ● ● ● ● ● ● ● ● ● ● ● ● ● ● ● ● ● ● − 2 0 2 4 T ransitivity − Adjusted n 20 30 40 50 60 70 80 90 100 ● ● ● ● ● ● ● ● ● ● ● ● ● ● ● ● ● ● ● ● ● ● ● ● ● ● ● ● ● ● ● ● ● ● ● ● ● ● ● ● ● − 2 0 2 4 6 Avg. P ath Length − Adjusted n 20 30 40 50 60 70 80 90 100 ● ● ● ● ● ● ● ● ● ● ● ● ● ● ● ● ● ● ● ● ● − 3 − 2 − 1 0 1 2 3 Density − Adjusted n 20 30 40 50 60 70 80 90 100 Model&Version: & p" =&0.10 & &&&&&&& p" =&0.25 " & The rows indicate the common network statistics, while the left column gives the unadjusted statistic and the right column gives those adjusted by a Bernoulli mixture model. In each plot, the x-axis giv es the network sizes. The color indicates the two versions of the model, where the probability of connections betw een neighborhoods is giv en in the legend on the right. tw o generative models (with θ bt w = 0.10 and θ bt w = 0.25) which are evident in the boxplots of the raw , unadjusted statistics are either diminished, preserv ed, or amplified by the mixture model adjustment. While the empirical distribution of degree centrality appears to remain r oughly the same under either model, w e see differences in the empirical distributions of the other unadjusted/adjusted netw ork statistics. Not sur prisingly , in most cases, this difference is harder to distinguish among small networks but increasingly easier to distinguish as the netw ork gro ws in size. Note that there is a difference betw een the empirical distributions of unadjusted transitivity and density statistics across the two generative models, and this distinction is preser v ed in the adjusted v ersions of these statistics. For the remaining network statistics - betweenness centrality , closeness centrality , and av erage path length - the difference betw een the empirical distributions of the unadjusted statistics across the tw o generative models is actually amplified and made more noticeable by the adjustment. Although this simulation study is rather limited in scope, w e expect to see similar results under different settings. Once the netw ork statistics’ dependence on netw ork size is remov ed, it is not surprising that w e might be able to more easily pick up “true” differences betw een netw orks under comparison. Not only does the mixture model adjustment allow for comparison of common network statistics across netw orks of different size, but it also improv es the ease of the comparativ e analysis itself, since differences among adjusted statistics are often more pronounced. 6. Application: L.A.F ANS Ecological Networks Finally , w e apply the mixture model adjustment to neighborhood netw ork data from the Los Angeles Family and Neighborhood Surve y (L.A.F ANS). Conducted in the early 2000s, L.A.F ANS is a two-w av e sur v ey of roughly 3,000 families in 65 census tracts in Los Angeles County , Califor nia (Sastr y et al., 2006). Here, w e use activity data collected during the first wa ve (2000 and 2001). Surv ey participants w ere asked to report the locations where they conduct a few specific routine activities, such as where they go grocery shopping, where they go to the doctor and where they w ork. Follo wing earlier analysis with this dataset, we assign the reported activity locations to census block groups (Browning et al., 2014). Naturally , this data can be represented as a tw o-mode ecological network within each census tract, with the first mode being people who reside in a census tract and the second mode being the census block groups in which activity locations that these people reported visiting are physically located. W e focus only on the one-mode projection of these netw orks, where people in a tract are connected if they report visiting activity locations that occur in the same census block 15 Figure 8: L.A.F ANS Network Structure The abov e netw orks are one-mode projections of activity pattern data from L.A.F ANS. For both of these networks, n = 34 . group. Note that we observe N = 65 networks, where the nodes in each netw ork represent the sur v ey participants from a particular census tract. The netw ork sizes range from n = 27 to n = 54 people. V isually , w e notice tw o structural patterns in these data. W e give examples of these tw o patterns in Figure 8 4 . For the most part, these 65 observed networks look like either of the tw o networks in this figure. Either the network consists of a single group of v ery highly connected nodes and a few nodes with only a few connections (i.e. it exhibites some type of core-periphery structure) or is generally less dense, with multiple groups of more highly connected nodes. W e analyze proporties of these networks b y mirroring the structure of this paper thus far: first, w e examine the ra w netw ork statistics themselv es; secondly , we standardize relativ e to a fully parameterized reference distribution, Erd ˝ os-Rényi graphs; finally , w e apply the Mixture Model Adjustment where w e use the Ber noulli model, the mean degree preser ving Bernoulli model and the Hierarchical Bernoulli model to produce the mixture reference distributions. W e use all of the same algorithm settings as described before. As was obser v ed in the simulation study , we expect the perfor mance of the Hierarchical Ber noulli mixture to be poor relativ e to its computational requirements. Further , recall that the simulation study results indicated that using the mean degree preserving v ersion of the Ber noulli model w ould be superior to the original v ersion if mean degree (rather than density) is preser v ed as netw ork size increases. W e consider a simple plot of density and mean degree against netw ork size in Figure 9. Since the density of our observed networks appears to be preserv ed as netw ork size changes, w e expect the mixture model adjustment using Ber noulli model components to be superior to the v ersion which includes Krivitsky et al. (2011)’s offset ter m. Figure 9: Density and Mean Degree in L.A.F ANS Networks ● ● ● ● ● ● ● ● ● ● ● ● ● ● ● ● ● ● ● ● ● ● ● ● ● ● ● ● ● ● ● ● ● ● ● ● ● ● ● ● ● ● ● ● ● ● ● ● ● ● ● ● ● ● ● ● ● ● ● ● ● ● ● ● ● 30 35 40 45 50 55 0.2 0.3 0.4 0.5 0.6 0.7 0.8 n Density ● ● ● ● ● ● ● ● ● ● ● ● ● ● ● ● ● ● ● ● ● ● ● ● ● ● ● ● ● ● ● ● ● ● ● ● ● ● ● ● ● ● ● ● ● ● ● ● ● ● ● ● ● ● ● ● ● ● ● ● ● ● ● ● ● 30 35 40 45 50 55 10 15 20 25 30 35 n Mean Degree Density (left) and mean degree (right) are plotted against network size for the N = 65 observed L.A.F ANS census tracts. The dotted lines represent fitted simple linear regressions. Unlike in the simulation studies, here, w e no longer hav e much replication across netw ork size, and so w e turn to new metrics for evaluating how comparable the netw ork statistics are across different netw ork sizes. In Figure 9 in the Supplementary Materials w e pro vide simple plots of the netw ork statistics b y netw ork size, n . If the netw ork statistics are comparable across different network sizes, w e would not expect to see dependence betw een network statistics and n . Or 4 The identity of the sampled census tracts in L.A.F ANS is withheld to protect respondents’ identity . 16 rather , w e w ould expect to see the correlation between the raw statistics and n be reduced b y our adjustment methods. W e pro vide a table of such correlations in T able 2. T able 2: L.A.F ANS Data: Correlation betw een Network Statistics and Network Size A djustment M odel Unadjusted Erd ˝ os-Rényi Bernoulli Mean Degree Hierarchical Bernoulli Bernoulli S t atistic Deg. Cent. 0.8228 0.3005 0.3026 0.3509 0.1877 Betw . Cent. 0.6598 0.4670 0.4290 0.1351 0.3851 Clos. Cent. 0.2228 0.0745 0.1060 0.1299 0.0417 T ransitivity -0.0981 0.2543 -0.0926 0.2286 -0.1000 A v g. Path 0.0081 0.1224 0.0651 -0.1659 0.0236 Density -0.0473 -0.1298 -0.0473 0.1878 -0.0522 Although the plotting scale obviously differs across n , the adjustment methods do not seem to hav e a strong effect on the o verall shape or patter n that w e obser v e in any of these plots, with the exception of degree centrality . For the unadjusted degree centrality measures, w e see a strong relationship with network size. How ev er , applying any kind of adjustment method seems to ammeliorate the issue. For all other netw ork statistics, w e do not obser v e such an ob vious impro v ement. Ho we v er , when w e examine the correlations in T able 2, w e see that applying some type of an adjustment method does reduce the correlation betw een netw ork size and many of the network statistics. This holds for all of the centralization measures, but is violated for a verage path length as w ell as Erd ˝ os-Rényi adjusted transitivity and density . Recall that in our simulation study , the Erd ˝ os-Rényi adjustment perfor med rather poorly for topological measures, so it is not surprising that it appears to perform poorly for these same measures in this application as w ell. Further , although the correlation betw een a v erage path length and network size is not reduced by the adjustment methods, it is v ery near zero to begin with and remains relativ ely near zero under both the Ber noulli and Hierarchical Ber noulli v ersions of the Mixture Model Adjustment. Giv en these results and the conclusions from our simulation study , w e recommend using netw ork statistics adjusted by the Ber noulli version of the Mixture Model Adjustment in any further analysis inv olving these netw ork statistics. Note that all versions of the Mixture Model Adjustment performed comparably , but that the Bernoulli v ersion is much less computationally expensiv e (see T able 5 in the Supplementary Materials) than the Hierarchical Bernoulli v ersion, and the assumptions of the Ber noulli model (constant density across netw ork size) appear to be a good match for our obser v ed data. Mo ving for w ard with our analysis, w e now use the adjusted network statistics to compare across netw orks of different size. Note that although the adjusted network statistics are z-scores, they should not be inter pretted as conv eying any type of statistical significance. Rather , they are measures of relative comparison (much like PCA component scores), that pick up differences among the networks being compared. Finally , we will briefly examine wa ys in which using these adjusted v alues can impact the types of conclusions we might dra w about these data. For example, if w e examine the ra w degree centralization v alues across our group of observed netw orks, we notice that the netw ork for census tract #64 has a larger value than that for census tract #37 (see Figure 10). How ev er , it tur ns out that this observation is entirely driv en b y netw ork size. Once w e perfor m the Ber noulli v ersion of the Mixture Model Adjustment, w e see the opposite: the netw ork for census tract #37 has a much larger degree centrality v alue than w e w ould expect for netw orks of that size while census tract #64’s is closer to what we might expect for its size. And recall, that in this type of statement, we are comparing our obser v ed networks to simulated netw orks of the same size which mimic the type of structure that w e obser v e in our dataset (here, the only structural effect w e are mimicking is density , since we are using the Bernoulli v ersion of the Mixture Model Adjustment). Thus, w e might conclude that, relativ e to the type of network data w e observed, census tract #37 has higher degree centrality than census tract #64, net of network size effects. These types of rank changes are common throughout the various netw ork statistics examined here. In summar y , using unadjusted or poorly adjusted (i.e. via the Erd ˝ os-Rényi adjustment) netw ork statistics in a comparative analysis of network data can lead to v ery different conclusions than if one wer e to utilize our proposed adjusted statistics. In fact, w e argue that these different conclusions could in fact be dangerously misleading because the statistics are not properly adjusted for netw ork size. Thus, w e encourage using a Ber noulli version (perhaps including Krivitsky et al. (2011)’s offset term) of the Mixture Model Adjustment to first adjust obser v ed netw ork statistics for size effects and then proceed with any desired analysis of these common network statistics per usual (e.g. as independent variables in a regression analysis). The decision to include Krivitsky et al. (2011)’s offset term could be guided b y theoretical considerations of the expected beha vior of density and mean degree for the particular type of netw ork data under consideration, as network size increases. This decision should also be influenced b y any patter ns in the observ ed data, as was considered here. That is, simply plotting density and mean degree against network size for the obser v ed netw orks should help infor m whether or not an offset ter m is helpful. 17 Figure 10: Degree Centrality in the L.A.F ANS Neighborhood Data ● ● ● ● ● ● ● ● ● ● ● ● ● ● ● ● ● ● ● ● ● ● ● ● ● ● ● ● ● ● ● ● ● ● ● ● ● ● ● ● ● ● ● ● ● ● ● ● ● ● ● ● ● ● ● ● ● ● ● ● ● ● ● 250 500 750 30 35 40 45 50 55 n Unadjusted ● ● ● ● ● ● ● ● ● ● ● ● ● ● ● ● ● ● ● ● ● ● ● ● ● ● ● ● ● ● ● ● ● ● ● ● ● ● ● ● ● ● ● ● ● ● ● ● ● ● ● ● ● ● ● ● ● ● ● ● ● ● ● 0 2 4 6 8 30 35 40 45 50 55 n Census T ract ● ● ● 37 64 Bernoulli Adjusted The horizontal axis denotes netw ork size, n , while the vertical axis giv es the statistic value. 7. Discussion W e hav e shown that netw ork statistics are not amenable to direct comparison across networks of different size, ev en when the netw orks under consideration are generated from the same model. Although w e can not make this statement absolutely , w e hav e demonstrated this phenomenon across a range of popular and reasonable generativ e models for netw ork data as w ell as across a variety of popular netw ork statistics. W e preview ed the adv antages of the Mixture Model Adjustment and ha v e shown that in many cases the adjusted statistics are more comparable across network sizes and are still capable of describing interesting features of netw orks. This provides researchers with a reliable wa y of making comparisons across networks of different sizes, without the difficulty of specifying a fully parameterized reference distribution a priori. The resulting adjusted netw ork statistics can be interpretted as measures of relativ e comparison among the obser v ed netw orks, similar to PCA component scores. Due to its superior perfor mance and low computational cost, w e hav e recommended use of the Ber noulli model (perhaps including Krivitsky et al. (2011)’s offset term) for the components of the mixture reference distribution and pr ovided a simple approach for deciding whether or not to include the offset term. Perhaps implementing netw ork models other than those examined here as mixture components in this adjustment will offer ev en greater impro v ements, or perhaps certain netw ork statistics are more amenable to adjustments utilizing a particular class of netw ork models. W e lea ve this topic for future inv estigation. The strong perfor mance of the Bernoulli models is not sur prising. Anderson et al. (1999); Faust (2006) and V an W ijk et al. (2010) all document a relationship betw een network density (or , closely related, av erage degree, as examined by Anderson et al.; V an W ijk et al.) and a v ariety of graph-lev el network statistics. Thus, it is not sur prising that a method which properly adjusts for netw ork density w ould render the network statistics more comparable across netw ork sizes. Of course, the range of network statistics and generativ e netw ork models examined here could be expanded as w ell. W e ha v e considered only statistical generativ e network models rather than mathematical models, such as the conditional uniform graphs examined b y Anderson et al. (1999). Our intent was to create a mixture reference distribution which represents the type of structure that we expect to see in, say , another realization of our set of observed networks, rather than viewing the obser v ed network structure as some fixed attribute and adjusting for it, i.e. rather than conditioning on observed netw ork attributes as is done in CUG models. Further examination of the perfor mance of the Mixture Model Adjustment itself is also needed. In particular , a consideration of the effect of N M , the number of mixture components, could prov e to be a w orthwhile inv estigation. Other measures of distributional comparison could be used, rather than the simple z-score which performs poorly for nonnormal distributions. Further , perhaps mixture weights could be incorporated within the Mixture Model Adjustment, proportional to some measure of model fit, to better adjust for obser v ed variability in the network dataset. 18 Acknowledgements Support for this work w as pro vided by grants from the National S cience Foundation (NSF DMS-1209161), the National Institute of Health (NIH R01DA032371), the W illiam T . Grant Foundation, and The Ohio State Univ ersity Institute for Population Research (NIH P2CHD058484). References An, W . “Multilev el meta network analysis with application to studying network dynamics of netw ork inter v entions.” Social Networks , 43:48 – 56 (2015). Anderson, B. S., Butts, C., and Carley , K. “The interaction of size and density with graph-lev el indices.” Social Networks , 21(3):239 – 267 (1999). Bassett, D. S., Bullmore, E., V erchinski, B. A., Matta y , V . S., W einberger , D. R., and Me yer -Lindenberg, A. “Hierarchical organization of human cortical netw orks in health and schizophrenia.” The Journal of Neuroscience , 28(37):9239–9248 (2008). Bro wning, C. R., Calder , C. A., Kriv o, L. J., Mohr , A. L., and Boettner , B. “S ocioeconomic segregation of activity spaces in urban neighborhoods: Does shared residence mean shared routines?” (2014). Manuscript submitted for publication. Butts, C. T . “Exact bounds for degree centralization.” Social Networks , 28(4):283–296 (2006). Chatterjee, S., Diaconis, P ., et al. “Estimating and understanding exponential random graph models.” The Annals of Statistics , 41(5):2428–2461 (2013). Daudin, J.-J., Picard, F ., and Robin, S. “A mixture model for random graphs.” Statistics and Computing , 18(2):173–183 (2008). Erdös, P . and Rényi, A. “On the ev olution of random graphs.” Publications of the Mathematical Institute of the Hungarian Academy of Sciences , 5:17 – 61 (1960). Faust, K. “Comparing social networks: size, density , and local structure.” Metodološki zvezki , 3(2):185–216 (2006). Frank, O. and Strauss, D. “Markov graphs.” Journal of the American Statistical Association , 81(395):832–842 (1986). Freeman, L. C. “Centrality in social networks conceptual clarification.” Social Networks , 1(3):215 – 239 (1979). Gilbert, E. N. “Random graphs.” The Annals of Mathematical Statistics , 1141–1144 (1959). Handcock, M. S., Hunter , D. R., Butts, C. T ., Goodreau, S. M., Krivitsky , P . N., Bender-deMoll, S., and Morris, M. statnet: Software T ools for the Statistical Analysis of Network Data . The Statnet Project, r package v ersion 2015.11.0 edition (2015). He, Y ., Chen, Z., and Ev ans, A. “Structural insights into aberrant topological patter ns of large-scale cortical netw orks in alzheimer ’s disease.” The Journal of Neuroscience , 28(18):4756–4766 (2008). Kolaczyk, E. D. and Csárdi, G. Statistical analysis of network data with R , volume 65. Springer (2014). Krivitsky , P . N., Handcock, M. S., and Morris, M. “Adjusting for network size and composition effects in exponential-family random graph models.” Statistical methodology , 8(4):319–339 (2011). Lubbers, M. J. “Group composition and netw ork structure in school classes: A multile v el application of the p ∗ model.” Social Networks , 25(4):309 – 332 (2003). Lubbers, M. J. and Snijders, T . A. “A comparison of v arious approaches to the exponential random graph model: A reanalysis of 102 student networks in school classes.” Social Networks , 29(4):489 – 507 (2007). New comb, S. “A generalized theory of the combination of obser v ations so as to obtain the best result.” American Journal of Mathematics , 8:343–66 (1886). Padgett, J. F . “Marriage and elite structure in Renaissance Florence, 1282-1500.” Social Science History Association (1994). Pearson, K. “Contribution to the mathematical theor y of ev olution.” Philosophical T ransactions of the Royal Society A , 185:71–110 (1894). Sastry , N., Ghosh-Dastidar , B., Adams, J., and Pebley , A. R. “The design of a multilev el sur v ey of children, families, and communities: The Los Angeles Family and Neighborhood Sur v ey .” Social Science Research , 35(4):1000 – 1024 (2006). 19 S chindler , K. A., Bialonski, S., Horstmann, M.-T ., Elger , C. E., and Lehnertz, K. “Ev olving functional netw ork properties and synchronizability during human epileptic seizures.” Chaos: An Interdisciplinary Journal of Nonlinear Science , 18(3):033119 (2008). Scholz, F . W . and Stephens, M. A. “K-Sample Anderson–Darling tests.” Journal of the American Statistical Association , 82(399):918–924 (1987). Schweinber ger , M., Handcock, M., and Luna, P . hergm: Hierarchical Exponential-Family Random Graph Models with Local Dependence (2015). Schweinber ger , M. and Handcock, M. S. “Local dependence in random graph models: Characterization, properties and statistical inference.” Journal of the Royal Statistical Society: Series B (Statistical Methodology) , 77(3):647–676 (2015). Shalizi, C. R. and Rinaldo, A. “Consistency under sampling of exponential random graph models.” The Annals of Statistics , 41(2):508–535 (2013). Smit, D. J., Stam, C. J., Posthuma, D., Boomsma, D. I., and De Geus, E. J. “Heritability of ”small-world” netw orks in the brain: a graph theoretical analysis of resting-state EEG functional connectivity .” Human brain mapping , 29(12):1368–1378 (2008). Smith, J. A. and Moody , J. “Structural effects of netw ork sampling cov erage I: Nodes missing at random.” Social Networks , 35(4):652 – 668 (2013). Snijders, T . A., Pattison, P . E., Robins, G. L., and Handcock, M. S. “New specifications for exponential random graph models.” Sociological methodology , 36(1):99–153 (2006). Snijders, T . A. B. and Baerveldt, C. “A multilev el netw ork study of the effects of delinquent behavior on friendship ev olution.” The Journal of Mathematical Sociology , 27(2-3):123–151 (2003). Stam, C. “Functional connectivity patter ns of human magnetoencephalographic recordings: a ‘small-world’ network?” Neuroscience Letters , 355(1–2):25 – 28 (2004). V an W ijk, B. C., Stam, C. J., and Daffertshofer , A. “Comparing brain netw orks of different size and connectivity density using graph theory .” PloS One , 5(10):e13701 (2010). 20
Original Paper
Loading high-quality paper...
Comments & Academic Discussion
Loading comments...
Leave a Comment