Comparison and Adaptation of Automatic Evaluation Metrics for Quality Assessment of Re-Speaking
Re-speaking is a mechanism for obtaining high quality subtitles for use in live broadcast and other public events. Because it relies on humans performing the actual re-speaking, the task of estimating the quality of the results is non-trivial. Most o…
Authors: Krzysztof Wo{l}k, Danijel Korv{z}inek
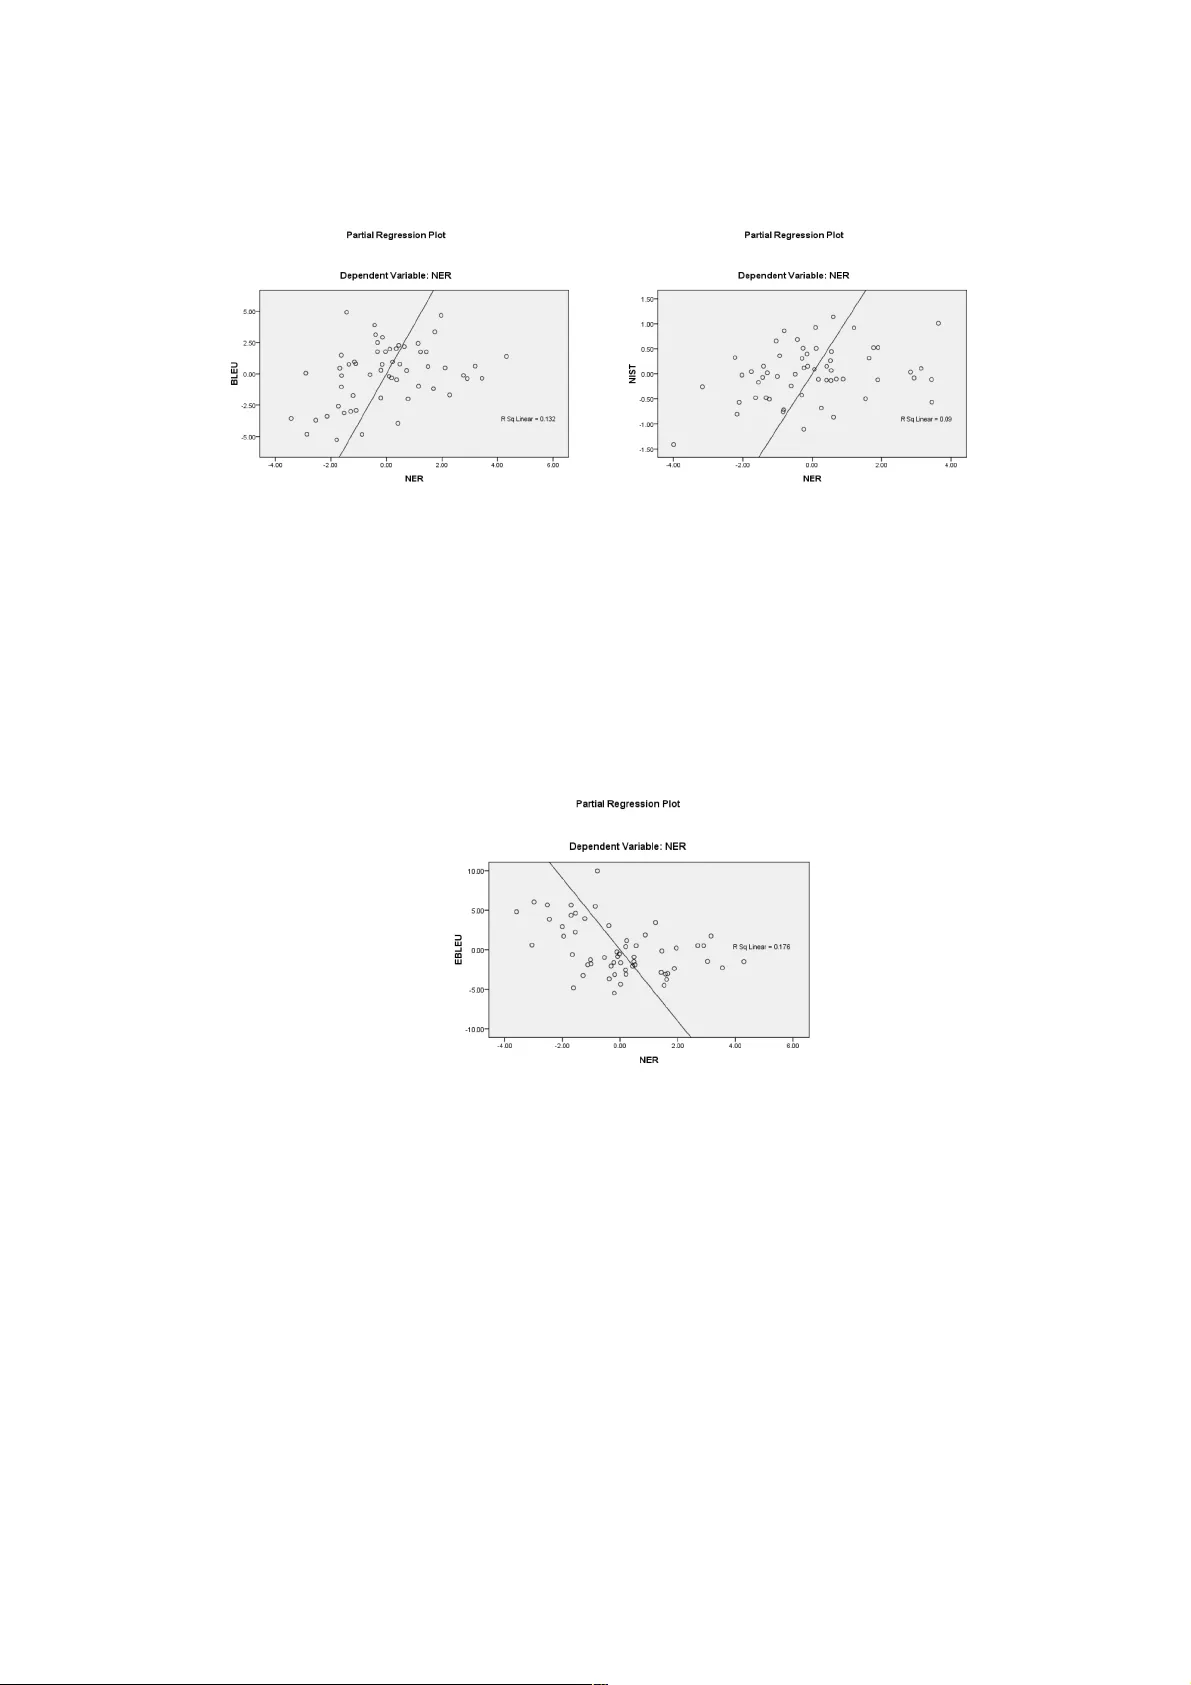
Comparison an d Adaptation of Automatic Evaluation Metrics f or Quality Assessment of Re - Speaking Krzysztof Wo ł k, Danijel Kor ž inek Depart ment of Mul timedi a Polish - Japanese Academy of Information Techn ology . kwolk @ pja . edu.pl, danijel @ pja.edu.pl Abstrac t Re - speaking is a mechanism for obtaining high qu ality subtitles for use in live broadcast and other public events. Because i t relies on humans perf orming the actual re - speaking, the task of estimating the q uality of the results is non - trivial. Most organi sat ions rely on h umans to perform th e actual qu ality assessm ent, but purely automatic methods have been developed for other similar problem s, like Machi ne Transl ati on . This pap er will try to compare seve ral of these metho ds: BLEU, EBLEU, NIST, METEOR, METEOR - PL, TER and RIBES. These will then be matched to the human - derived NER metric, commonly used in re - speaking. 1 Introduction One of the main drivi ng forces in Speech Technology , for the last several years, comes from the effo rts of various group s and organiz ations tackling with the issue o f disability, specifically deaf and hard of hearing people. Most notably, a long term effort by such organisations has lead to a plan by the Euro pean Com mision to enable “Sub titling of 1 00% of program s in pub lic T V all over the EU b y 202 0 w ith sim ple te chnical standards and consume r friend ly rule s” [15 ]. This ambitious task would not be possible t o achieve without the aid of Speech Technology. Whil e t her e h as bee n a con sid era ble improvemen t of quality of Automatic Speech Recognit ion (ASR) tec hnology recently, man y of th e tasks present in real - life are simply b eyond complete automation. On the other hand, there are tasks, which are also impossible to achieve by hum ans withou t the aid of ASR. For example, movie subt itle s are usu ally done by human transcribers and can take a day, up to a w eek, per material to complete. Live subtitling, however, can sustain only a few seconds delay between the time an event is recorded and the time it appears on the viewer's screen. This is where r e- speaking comes into play. The idea of re - speaking is to use ASR to create live and fully an notated subtitles, but rather than risk ing m isrecognitio n of the speec h hap pening in the liv e reco rding, a specia lly traine d individual, the so - called re - speaker, repeats the speech from the re corded eve nt in a quiet and controlled environment. This approach has many advantages t hat guarantee excellent results: controlled env ironment, the ability to adapt the speaker, the ability of the speaker to adapt to the softw are, solving problems like double - speak, cocktail p arty effect and non - grammatic speech by paraphrasing. The standard of quality required by many jurisdictions demands less than 2% of errors [17]. From the point of v iew of a re - speaker, this problem is ver y similar to that of an interpreter only inste ad of translating from o ne language to ano ther, re - speaking is usually don e withi n one lang uage onl y. Ther e are many asp ects of re - speaking wo rthy of the ir own insight [16], but this paper will dea l only with t he issue of qual ity assessment. Similarly to Machine Translation (MT), the assessment of the accuracy of re - speaking is not a trivial task, becaus e there are many p ossible way s to paraphrase a n utterance, just like the re are many ways to translat e any give n sentence. Measuring the accuracy of such data has to take semantic meaning into account, rather than blindly performing sim ple word - to - word co mparis on. One option is to use human s to perform this evaluati on, as in the NER model, describ ed later in the pa per. This has been recognized as very expensive and time - consuming [8]. A s a result, human effort cannot keep up with the growing and continual need for the evaluation. This led to the recogn ition that the d evelopm ent of autom ated evalu ation techn iques is critical. [8,9] Unfort unate ly most of the automat ic evalu ation metrics were develo ped for ot her purpo ses than re - speaking (mostly machine translation) and are not suited for languages like P olish that differ semantically and struct urally from English. Poli sh has complex declension, 7 cases, 15 gender forms, and complicated grammatical construction. This leads to a larger vocabulary and greater complexity in data requirements for such tasks. U nlike Polish, English does not have declensions. In addit ion, word order, esp. the Subject - Verb - Object (SVO) pattern, is absolut ely crucial to determining the meaning of an E nglish sentence [10]. W hile these automatic metrics have already been thoroughly studied, w e feel that there is still much to be learnt, especially in different l anguages and for di fferent ta sks, like r e - speaking. This paper will compare some of these automated and human assisted metrics, while also considering issues related specifically to P olish. A small introduction to all the metrics is presented in the beginnin g of the pap er, followe d by an ex periment u sing actual re - sp eaking data. 2 Machi ne Tra nsl ati on Metr ic s 2.1 BLEU Metric BLEU was developed based on a premise similar to that used for speech recognit ion, described in [1] as: “The closer a machine t ranslation is to a p rofessional h uman tran slation, the better it is.” So, the BLEU metric is designed t o measure how close SM T output is to that of human reference translations. It is important to note that translations, SM T or human, may differ significan tly in word u sage, wor d order, and phrase len gth. [1] To address the se complexit ies, BLEU att empts to match var iable le ngth phrase s between SMT output and reference translations. W eighted m atch averages are used to determine the translation score. [2] A number of variations of the BLEU metric exist. H owever, the basic m etric requires calculation of a brevity penalty PB, which is calculated as follows: ! " # $% & ' ( )*$ + ,- .% /& 0 (/ / / where r i s the lengt h of the refer ence corpus, and candidate (referenc e) trans lati on length is given by c. [2] The basic BLEU metri c is t hen det ermined a s shown i n [2]: 1 234 # ! " )56 /* 7 8 9:; < => ? / 6 8 . / / where 7 = / are posit ive weig hts summin g to one, and the n - gram precision @ = is calculated using n - grams with a maximum lengt h of N. There are s everal ot her import ant fea tures of BLEU. First, word and phra se posit ion withi n the text are not evaluated by this m etric. To prevent SM T systems from artificially inflating their scores by overuse of words kn own with high con fidence, each candidate word is constrained by the w ord co unt of the corre sponding referen ce tran slation. A geo metric mean of individual sentence scores, wi th con sideration of th e brevity penalty, is then calculated for the entire corpus. [2] 2.2 NIST Metric The NIST metric was designed to improve BLEU by rewarding the translation of infrequent ly used words. This was intended to further prevent inflati on of SMT evaluation scores by focusing on common words and high confidence trans lations. As a res ult, the NIST metric uses heavier weight s for rarer words. The final NIST score is calculat ed using the arit hmetic m ean of the n - gram m atches between SMT and reference tra nslations. In a ddition, a sm aller brevity penalty is used for smaller variations in phrase lengths. The reliability and quality of the NIST metric has been shown to be super ior to the BLEU metric in many c ases . [3] 2.3 Translation Edit Rate (TER) Translat ion Edit Rate (T ER) was d esigned to p rovide a very intu itive SMT evaluation metric, requiring less data than othe r techniques while avo iding the labor intensity of hu man evaluation . It calcu lates the nu mber of edits req uired to m ake a m achine translation m atch exactly to the closest reference transl ation in fluency and semantics. [4, 5] Calcula tion of th e TER met ric is de fined in [4] : A 3B # C D B / / where E rep resen ts the mi nimum number of edit s requi red for an exact match, an d the ave rage length of the r eference text is given by wR. Edits may include the deletion of wo rds, word insertion, w ord substitutio ns, as well a s changes in wo rd or phrase order. [4] 2.4 METEOR Met ric The Metri c for Evaluation of Translation with Explicit Order ing (METEOR) is intended to take sever al factors th at are indir ect in BL EU into accoun t more dir ectly. Rec all (the pro portion of matche d n - grams to total ref erence n - grams) is used directly in this m etric. In addition, METE OR explicitly measures higher order n - grams, considers word - to - word matche s, and appl ies arithmetic averaging for a final score. Best matches against m ultiple reference tr anslations can also be used. [5] The METEOR method uses a s ophistic ated and in cremental word alignmen t method th at start s by considering exact word - to - word match es, word stem matches, and synonym matches. Alter nati ve wor d ord er si mila riti es ar e th en ev aluat ed ba sed o n tho se mat ches. Calcula tion of precis ion is similar in the METEOR and NIST metri cs. Recall is calculat ed at the wo rd leve l. To combine the precision and rec all score s, ME TEOR uses a harm onic mean. METEOR rew ards l onge r n - gram matche s. [5] The METEOR metric is c a lculated as sh own in [5 ]: ECFCGH # * $I /!/H H J K/! .* 1 L M N . / / where t he uni gram re call and pr ecisi on are given by R and P, res pecti vely . The br evit y pena lty M N is determin ed by: M N # 0 O 5 P Q R / where Q R is the n umber of matchin g unigra ms , and C is the minim um n umber of phrases required to match u nigrams in the SM T output with th ose found in the refere nce translations. An import ant factor in METEOR is the liberal use of weights for the numerous aspect s of the system. These weights need to be tuned for specific tasks to match human judgment precisely. The tool comes with a couple of pre - tu ned pa rameter s ets for so me com mon task and lan guage pairs, but these obviously don’t include ei ther re - speaking or Polish. 2.5 METEOR - PL Whil e of ten use d in a language - independ ent m anner, th e grea test adv antage of M ETEO R is its ability to model features of a specific language, like the aforem entioned synonyms, stems and paraphrasing. These features are enabled thr ough the use of standard language tools, eas ily obtainable for many languages. In order to adapt METEO R to Polish, several steps needed to be made. The synonym m atcher uses a special script for e xtracti ng rele vant in formation from th e Princeton WordNet [11] project. In Polish, there is an equivalent p roject developed at the Wroc ł aw University of Technology [12] and it works exactly the same as the Princeton original. The standard METEOR stemmer is implemented using the Snowball [13] tool, but this only supports a limited set of languag es. Other languag es can be implemented by han d - crafting rules using a special finite grammar. For Polish, a well known morphological analyzer and stemmer Morfo log ik [14] develo ped at the IPI PAN was us ed inst ead . This meant that the METEOR source code needed to be slightly modifi ed, speci fica lly to s upport mul tipl e st ems pe r wor d. One final modificat ion of the system, wit h respect to Polish, was the creation of a list of function words. This list isn’t very big (this is true for o ther languages as well) and may have to be adjusted for specific uses. At its current state it contains punctuation, some common abbreviations and common conjunctions. The last feature of METEOR is its ability to model paraphrasing. This uses a system that is trained on a parallel cor pus. At the mom ent of writing this paper, the amount of respeaking data was s o s mall that n o su ch cor pus could be re adily pro duced. Th is is someth ing that c ould significantly improve the measure in the future, however. 2.6 RIBES The focus of t he RIBES metric is w ord order. It uses rank corre lation coeffic ients based on word order to compare SMT and referenc e translati ons. The primary rank correlat ion coeffic ient s used are Spearman’s ρ , w hich measures the d istance of d ifferences in r ank, and K endall’s τ , which measur es t he di rection of differences in ran k. [6] These ran k measures can be normalize d to e nsure pos itive values [ 6]: Normali zed Spearma n’s ρ ( STB . / # / *U / J /$ .VW Normali zed Kendall ’s X/* SYA . / # / * X / J /$.V W These measures can be combined with precision P and modifie d to avoid overestimating the correlation of only corresponding words i n the SMT and reference translations: STB / MZ / [\] / SYA / MZ / where α is a param eter in the range 0 < α < 1. 2.7 EBLEU We now dis cuss enhan ceme nts to the BLEU metri c tha t we intr o duced in [7]. The goal was to make this metric more reliab le when it comes to morphologic ally rich languages like Polis h. In particular, our enhanced metric rewards synonyms and rare w ord tr anslations, while modifyi ng the calculatio n of cumu lative score s. a. Cons ideration of Synonyms In our enhanced m etric, we would like to reward m atches o f synony ms, since the correct meanin g is sti ll convey ed. Consider thi s tes t phra se: " this is a exam" and th is ref erence phras e: "t his i s a quiz" The BLEU scor e is c alculat ed as follows: BLEU = (1+ 1+1+0)/ 4 = 3/ 4 = 0. 75 BLEU does not count the word "exam" as a match, because it does not find it in the reference phrase. However, this word is not a bad choice. In our method, we w ant to score the synonym “exam” higher than zero and lower than the exact word "quiz". To do this, for each word in a test phrase we try to find its synonyms. We check for an exact word ma tch a nd fo r al l t est phrase syno nyms t o fi nd th e cl osest words to the refer ence. We apply the defaul t BLEU al gor ith m to the mo dified test p hrase and reference phrase, w ith one difference. The default BL EU algorithm scores this new test phrase as 1.0, but we know that the orig inal tes t phras e is "this is a exam ". So , we would like to give a s core h igher th an 0 .75 bu t les s than 1.0 to the test phrase. During the BLEU evalu ation , we check each word for an exac t match. If the word is a synonym and not an exact match, we do not give a full score to that word. The score for a synonym will be the de fault BLEU score for an origi nal word multiplied by a constant (synonym - score). For example, if thi s constant equals 0.90, th e new score with synonyms is: (1+1+1+0.9 )/4 = 3.9/4 = 0.975 With this algor it hm, we have synony m scores for all n - grams, because in 2 - gram we have “a quiz” and in 3 - gram,”is a quiz” i n both test and referen ce phrase s. b. Consideration of Rare Words Our algo rith m gives ex tra poi nts to rare wor d matches . Firs t, it obtai ns the ra re words found in the refe rence corpus. If we so rt all distinct w ords o f the reference wit h their repetition order (descending), the last words in this list are rare words. The algorithm takes a specific percentage of the whole sor ted list as the rare words (rare - words - percent). When the def aul t BLEU algo rit hm tries to score a word, if thi s w ord is in the rare word list, the score is m ultiplied by a constant (rare - words - score). This action applies to all n - grams. So, if we have a rare word in a 2 - gram, the algorithm increases the score for this 2 - gram. For example, if the word "ro man" is rare, th e "rom an e mpire" 2- gram gets an increased score. The algorithm is careful that score of each sentence falls with in the range of 0.0 a nd 1.0. c. Det erminati on of Cumula tive Scor e The cumul ative score of our algorithm combines defa ult BLEU scores using logar ithms and exponentials as follows: 1. Initialize s = 0 2. For each i th - gram: a. s = s + log(B i ) b. C i = exp(s / i ) where B i is the defau lt BLEU score and C i is the cum ulative scor e. In addition, we kno w that: )56 ^_` a J ^_` b # a c b and: )56 ^_` a Vb # a * d e . 3 NER Subt itl e Accu racy Model The NER model [17] is a simple extension of the w ord accuracy m etric adapted specifically for m easuring the ac curacy of subtitles. It is one of two measures that is of particular imp ortanc e for media provide rs (television compan ies, movie distributors, etc), the other one being the reduction rate. Gen erally, the aim of go od subtitles is to redu ce the length of w ritten text as muc h as possible (in order to preserve space on screen and make i t e asier to read) while maintaining an almost perfect accuracy (usually above 98%). Since we are dealing with paraphras ing, it is very difficult to perform accurate m easurements by comparing the text only. T he NER model gets around this problem by counting errors using a simple formula, which inspired its name: f CH / a&&g(a&h # f L C L H f / i $IIj Where N is the number of ana lyz ed to kens (usu all y als o inc lud es punctua tio n), E is the number of er rors performed by the re - speake r, and R is the number of errors pe rfor med by the ASR syst em (on re - speaker’s speech). Additionally, the errors in E are weighted: 0.25 for minor errors, 0.5 for normal and 1 for serious errors. Th ere are user - friend ly tools available for making these assessm ents and obviously th ere may b e a ce rtain level of hum an bias involved in these estimates. Nevertheless, all the decisions are t horoughly checked and explainable using this method, which makes it one of the most popula r tec hnique s for subtitl e quali ty assessment used by many regulatory bodi e s worldwide. 4 Datase t and Exper iment Set up The data used in the experiments described in this paper was collected during a study performed in the Institute of Applied Linguistics at the University of W arsaw [16] . T his, still ongoing, study aims to determin e the relevant features of go od re - speakers and their technique. One of the obvi ous me asures is natu rally the qual ity of r e - speaking discussed in this paper. The subjects were studied in several hour sessions, where they had to perform various tasks and ps ychological exams. The fina l test was to do actual re - spea king of pre - recorded material. This was simultaneously recorded and recogniz ed by a commercial, off - the - shelf ASR suite. The software was moderately adapted to the re - speaker during a several hour s ession, a few weeks before the te st. The materi als included four different 5 minute segments in th e speaker's native language and one in eng lish (where th e task was also translation). The re cordings were additionally transcribed by a hu man, to convey exactly wh at the pe rson said. The fina l dataset c ontains thr ee sets of transcriptions: 1. the transcriptio n of the orig inal recorde d material 2. the transcriptio n of the re - speaker transcribed by a human 3. the output o f the ASR recognizin g the respe aker 5 Results Compar ison In our experime nts we used 10 transcripts prepared u sing the protocol ab ove. Each transc ript was eva luat ed wit h al l th e metr ics d escri bed i n thi s pape r as well as man uall y usi ng th e NER metri c. Table 1 presen ts evaluat ion between human made text trans cription and the original texts. Table 2 presents evalua tion be tween ASR s ystem and original text s. SPKR BLEU NIST TER METEOR METEOR - PL EBLEU RIBES NER RED . 1 56.20 6.90 29.10 79.62 67.07 62.32 85.59 92.38 10.15 2 56.58 6.42 30.96 78.38 67.44 58.82 86.1 3 94.86 17.77 3 71.56 7.86 18.27 88.28 76.19 79.58 92.48 94.71 12.01 4 76.64 8.27 13.03 90.34 79.29 87.38 93.07 93.1 3.72 5 34.95 5.32 44.50 61.86 47.74 37.06 71.60 91.41 17.03 6 61.73 7.53 20.47 83.10 72.55 69.11 92.43 92.33 4.89 7 61.74 6.93 28.26 7 8.26 69.78 63.99 78.32 95.3 10.29 8 33.52 4.28 46.02 63.06 47.61 36.75 77.55 93.95 26.81 9 68.97 7.46 22.50 83.15 76.56 71.83 88.78 94.73 4.05 10 70.02 7.80 18.78 86.12 78.71 75.16 88.15 95.23 6.41 11 47.07 5.56 33.84 76.10 62.02 47.86 85.05 93.61 22.7 7 12 53.49 6.65 30.63 77.93 65.27 55.90 86.20 94.09 14.33 13 75.71 7.95 16.07 89.72 83.13 77.74 91.62 94.78 9.31 14 66.46 7.60 18.44 84.34 76.20 66.53 90.76 94.82 6.09 15 25.77 1.85 54.65 58.62 40.82 31.08 68.90 85.26 32.83 16 88.82 8.66 5.75 96.15 90 .12 95.20 95.76 95.96 2.71 17 63.26 7.25 25.72 81.95 73.16 65.83 88.99 94.77 10.15 18 60.69 7.18 26.23 79.41 70.86 66.77 87.56 95.15 5.75 19 59.13 7.2 25.04 80.00 70.32 62.77 89.17 95.78 4.74 20 86.24 8.43 7.11 94.60 90.07 92.88 95.39 95.58 1.52 21 20 .61 2.08 65.14 47.56 33.31 27.42 55.63 91.62 36.89 22 64.40 7.43 22.84 82.69 72.82 66.93 89.44 93.46 10.15 23 27.30 2.69 52.62 58.96 43.19 35.78 68.06 90.07 31.81 24 82.43 8.33 10,15 92.40 86.04 85.61 94.63 97.18 12.02 25 82.22 8.44 9.48 93.75 87.00 91 .59 95.12 97.01 3.89 26 76.17 8.25 13.54 91.33 81.54 82.35 91.95 95.83 8.63 27 35.01 4.39 49.41 62.64 47.81 46.64 72.79 87.56 25.21 28 29.50 3.53 53.13 60.73 42.98 40.87 74.25 85.76 28.09 29 70.04 7.78 17.26 87.22 80.63 73.58 91.56 93.98 8.63 30 56.75 6.89 26.06 79.60 70.52 58.43 90.78 95.79 11.68 31 63.18 6.90 26.57 83.47 71.80 67.80 84.51 94.29 17.77 32 31.74 5.14 43.15 63.58 49.37 33.07 83.05 94.77 19.12 33 89.09 8.54 5.41 95.69 91.62 92.62 95.94 97.41 0.34 34 81.04 8.42 8.29 93.60 88.51 89.68 9 5.18 93.76 5.75 35 73.72 8.11 15.40 88.62 78.32 83.17 92.48 93.89 4.40 36 69.73 7.90 15.06 87.90 81.65 78.10 93.91 93.97 7.45 37 57.00 7.24 26.40 81.28 68.54 65.83 86.63 92.74 8.46 38 35.26 3.68 46.70 66.04 47.84 40.73 74.61 89.15 27.07 39 46.76 4.92 39.59 72.95 57.66 54.28 72.77 88.07 25.21 40 16.79 1.74 65.48 44.61 29.04 19.62 58.77 86.68 32.66 41 19.68 0.63 61.42 56.13 39.15 41.59 49.67 84.36 52.12 42 39.19 5.04 41.62 68.38 50.85 42.41 79.79 91.23 23.35 43 67.13 7.61 19.12 86.53 75.63 68.60 93.5 1 95.01 11.84 44 49.85 6.26 33.84 75.31 64.34 59.44 79.28 92.23 11.84 45 37.38 4. 2 43.49 68.66 54 .30 44.51 75.36 93.11 27.58 46 79.11 8.25 12.01 91.48 85.72 81.66 94.84 95.36 6.09 47 40.73 4.93 41.96 68.61 54.34 42.96 83.09 89.97 21.15 48 29.03 2.65 5 1.27 61.24 47.21 39.53 67.21 86.07 31.98 49 68.75 7.78 18.78 86.24 77.18 72.40 90.65 94.95 5.41 50 75.24 7.97 16.07 88.88 81.51 81.27 90.88 95.75 7.45 51 78.71 8.24 11.51 91.33 83.99 86.08 94.77 98.69 4.23 52 37.60 4.31 44.84 66.32 51.59 42.22 78.73 89 . 37 - 6. 6 53 73.20 8.07 14.38 88.78 79.55 77.39 93.93 93.73 2. 2 54 67.43 7.67 20.30 85.64 75. 90 70.28 87.57 94.91 12.07 55 70.06 7.90 18.44 87.29 76.67 78.93 90.79 93.49 7.1 1 56 71.88 7.83 17.77 88.24 78.07 77.51 89.21 97.74 8.46 57 80.05 8. 3 11.00 91.81 85.72 83.94 95.03 96.12 2.88 Table 1: Eval uation of human made text transcri ption and original text (RED – reduction rate). SPKR BLEU NIST TER METEOR METEOR - PL EBLEU RIBES NER RED . 1 41.89 6.05 44.33 66.10 54.05 44.77 78.94 92.38 10.15 2 48.94 5.94 37.39 71.14 60.24 49.79 81.29 94.86 17.77 3 57.38 7.11 27.24 78.41 67.08 62.87 89.42 94.71 12.01 4 59.15 7.07 27.24 77.21 67.94 65.31 87.71 93.1 3.72 5 26.08 4.57 55.33 52.33 39.14 26.89 69.22 91.41 17.03 6 44.17 6.32 36.38 69.16 60.15 47.97 86.04 92.3 3 4.89 7 51.79 6.39 34.86 71.42 65.47 52.31 79.19 95.3 10.29 8 22.03 3.17 61.93 45.27 33.90 22.14 59.93 93.95 26.81 9 52.35 6.09 39.93 68.02 63.07 53.87 78.53 94.73 4.05 10 54.44 6.65 33.50 73.16 65.42 57.28 82.11 95.23 6.41 11 65.95 7.57 19.63 84.68 76. 30 72.76 92.45 97.01 3.89 12 59.12 7.26 24.53 81.63 69.57 61.59 89.13 95.83 8.63 13 17.08 2.96 68.19 42.14 30.55 21.97 59.69 85.76 28.09 14 49.78 6.53 32.32 72.88 64. 10 51.98 86.56 93.98 8.63 15 46.01 6. 3 34.69 71.10 61. 70 46.11 87.96 95.79 11.68 16 35.50 5.03 44.33 65.64 50.58 36.53 79.16 93.61 22.77 17 34.42 4.51 56.01 52.80 41.15 34.17 63.30 94.09 14.33 18 58.58 6.95 28.93 77.96 69.47 59.22 85.73 94.78 9.31 19 49.06 6.50 31.64 72.94 63.35 47.49 85.64 94.82 6.09 20 19.86 2.58 65.48 46.48 31.29 21.38 60.96 85.26 32.83 Table 2 : Evaluat ion between ASR and origi nal text To find the most reliable metrics in pl ace o f NE R, a backward linear regression has been used [18]. This regression h as been selected for the following reasons: 1 The data are l inear d ata (co rrelati on anal ysis pre sent l inear r elation ) 2 The data are ra tio l evel da ta, t hus good for li near re gression 3 This regression analysis provides more than one regression results, thus the best variables can be found 4 Reliabl e varia bles are extract ed by excludi ng irrel evant variables from the 1 st to the la st stage (give the most reliable variables). For this analys is, the Stand ardized Coe fficients would be seen as strength of relationship that extracted from the U nstandardized C oefficients [19]. The sig (p - value) would be judged with the alpha ( 0.05) to investigate the most significant variables that explain the NER metrics . The Adjust ed R - square ( B k ) [20] would provide th e idea, how much the variable s are explaining the NER var iance s. Table 3 represents the regression summary for NER and o ther metrics. H ere, at first, the model has all th e met rics and except EBLEU none of them are significant p re dictors of NER. Additi onal ly, among a ll the met rics , TER is the most insignificant m etric, thus it has been removed for the seco nd model. In the second model only EBLEU (p = 0.0 07 ) and NIST (p = 0.019 ) were significant as they were below the alph a (0.05) . Here in th e 2 nd model the most insignificant metrics is RIBES (p = 0.538 ), thus it was removed in the 3 rd model at the next stage. In the 3rd mo del, again E BLEU (p = 0. 0 06 ) and NIST (p = 0.0 18 ) is significant and their significance value increased so does the Beta for EBLEU in creased, the strong er they become in predicting NER. In this model, METEOR_ pl is the m ost insig nificant metric, thu s it ha s been removed for the n ext model. In the 4th model, E BLEU , BLEU and NIST are significa nt and the level of s ignificance for EBLEU and BLEU has increased as we ll as their b eta values , nonethele ss the lev el of signif icance for NIST re main same . However, a t this stage of the m odel, M ETEO R bec ome the most insignificant m etric, thus it has been remo ved for the final (5th mod el). Along, side com pared to 2nd and, 3rd model, in 4th model it has been seen that the BLEU is becoming more sign ificant as the p - value (p = 0.005 ) is less than the alpha (0.05). Finally, the la st stage (5th model) the remaining metrics are significant, a s all have p - values less than alpha. T hus, no next step of models has been exec uted. He re, the fist model explaining 75 .9 % of the var ian ce for NER, however , the second mod el exp laining 76.3 % of the var ian ce of the NE R, 3 rd m odel e xplaining 76 .6% o f the variance of the N ER, 4 th mo del ex plaining 76.0 % of the varian ce of the N ER and final mod el explaining 76.1 % of the vari ance of the N ER. All these are statistically accepted R - square values. Model Unstandar dized Co effici ents Standardized Coefficien ts t Sig. Adjuste d R- square B Std. Error Beta 1 st model (Constant) 100.068 19.933 5.020 .000 0.759 BLEU .176 .122 1.060 1.439 .157 NIST 1.162 .530 .738 2.192 .033 TER - .072 .186 - .353 - .386 .701 METEOR - .205 .168 - .797 - 1.216 .230 EBLEU - .218 .078 - 1.293 - 2.806 .007 RIBES - .067 .093 - .219 - .723 .473 METEOR_pl .194 .160 .954 1.216 .230 2 nd model (Constant) 92.622 4.895 18.920 .000 0.763 BLEU .189 .117 1.136 1.614 .113 NIST 1.220 .504 .775 2.420 .019 METEOR - .190 .163 - .741 - 1.170 .248 EBLEU - .215 .077 - 1.270 - 2.803 .007 RIBES - .051 .082 - .167 - .620 .538 METEOR_pl .217 .147 1.067 1.479 .145 3 rd model (Constant) 91.541 4.547 20.133 .000 0.766 BLEU .184 .116 1.107 1.586 .119 NIST 1.068 .438 .678 2.440 .018 METEO R - .237 .143 - .923 - 1.655 .104 EBLEU - .193 .068 - 1.145 - 2.841 .006 METEOR_pl .222 .146 1.093 1.527 .133 4 th model (Constant) 90.471 4.550 19.885 .000 0.760 BLEU .285 .096 1.716 2.955 .005 NIST 1.083 .443 .687 2.444 .018 METEOR - .099 .11 2 - .385 - .878 .384 EBLEU - .204 .069 - 1.210 - 2.982 .004 5 th model (Constant) 86.556 .913 94.814 .000 0.761 BLEU .254 .090 1.531 2.835 .006 NIST .924 .404 .587 2.289 .026 EBLEU - .221 .066 - 1.310 - 3.370 .001 a. Dependent Variable: NER Table 3: Regress ion resu lt summary for NER and the six metr ics 6 Conclusi on From the re gression it has been found that BLEU is the most signifi cant predictor of NER, after BLEU, N IST is significant and finally, EBLEU is also a significant metric tha t can pre dict the NER better a nd thus th ese can be alte rnative to th e NER metric. T he regression equation that can compute the value of NER based on these three stat istical metrics as: f CH # lm O nn J /IO Wno c / pqCr J /IO KWo c fstF /u /IO WW$ c / CpqCr /// / Movin g for ward , reg res sio n plot s fr om the above regr essi on fo r the sign ifi can t met ric s are presented below. These plots show the relation between dependent metric with each significant metri c. The closer the dots in the plot to the regression line the better the R - square value an d the better the relationship. It is w orth noting that the ME TEOR metric should be fine - tune d to work prope rly. Th is wo uld however require more data and more research into this is pl anned in the future. Finally, the results presented in this paper are derived from a very small data sample and may not be very representative of the task in general. The process of acquiring more data is still ongoing so these experiments are going to be repeated once more data be comes available. Acknowle dgement s We would like to thank dr Agnies zka Szark owsk a and Ł ukasz Dutka for sharing the data that allowed us to perform these experiments. Some of the research used in t his paper was funded by the CLA RIN - PL pro ject. Biblio graphy 1. K. Papin eni, S. Rouskos, T. Ward, and W. J. Zhu, “BLEU: A method for automatic evaluation of machine translation,” in Proc. of 40th Annual Meeting of the Ass oc. for Computati onal Lingui stics , Philadelphia, July 20 02, pp. 31 1 - 318. ! Figur e' 3: ! Par ti al !re gr es sion ! plot ! for !N ER!an d! EB L E U ! ! Figur e' 2: ! Parti al!r egr es sio n! plo t! for !NER ! and!N IST ! ! ! Figur e' 1 :' Pa rti al!re gress ion ! plot ! for !N E R! and!B LEU ! ! 2. E. Am ittai Axelrod, „ Factored Language M odels for Statistica l M achine Translation ” , Univer sity of E dinbur gh, 2006. 3. G. Doddingt on, “Aut omati c evaluat ion of machi ne trans lati on quali ty using N - gram Co - Occurr ence statist ics” , in Proc. of Second International Conference on Human Language Technology (HLT) , San Diego, M arch 20 02, pp. 13 8 - 145. 4. P. Koehn, H. Hoang, A. Birch, C. Callison - Bur ch, M. Federico, N. Bertoldi, B. Cowan, W. Shen, C. Moran, R. Zens , C. Dyer, R. Boja r, A. Constant in, a nd E. H erbst, “Moses: Open source too lkit for statistical mac hine translation,” in Proc. of the AC L 2007 Demo and Poster Sessions , Prague, June 200 7, pp. 177 – 180. 5. S. Banerjee A. and Lavie, “METEOR: An automatic met ric for MT evaluation with improved c orrelation with human judgments,” in Proc. of ACL Workshop on I ntrinsic and Extr insic Evaluati on Measur es for Machi ne Tran sla tio n and/or Summari zat ion , An n Arb or, June 2005, pp. 65 - 72. 6. H. Isozaki, et al. , “Automa tic evaluation of transla tion quality for distant language pairs,” in Proc. of 2010 Conference on Empir ical Methods in Natural Language Processing , MIT , Massa chu set ts, USA , 9 - 11 October , 2010. 7. K. Wo ł k., K. Marasek , “Enhance d Bilingu al Evalua tio n Underst udy” , Lecture Not es on Information The ory, ISSN: 230 1 - 3788, 2014 8. E. H. Hovy, “Toward finely differentiated evaluati on metrics for machine transl ation,” in Proc. of the Eagles Workshop on St andards an d Evaluation, Pis a, Italy, 2010. 9. F. Reeder, “Additio nal mt - eval references,” International Standards for Language Engineeri ng, Eval uation Working Gro up, 2001. 10. K. Wo ł k, K. M arasek , “P olish – Englis h Speech Statistical Machine Translation Systems for the IW SLT 2014.”, Pro ceedings o f the 11th Interna tional W orkshop on Spok en Lang uage Translat ion, Ta hoe Lake, USA, 2014 11. A George Miller, "W ordNet: a lexical d atabase for English." , Communicatio ns of the A CM 38.11 , p. 39 - 41 , 1995 . 12. M. Mazia rz, M. Piasecki, S. Sz pakowicz , „Approaching plWordNet 2.0.” , Proceedings of the 6th Global Wordnet Confer ence, Matsue, 9 - 13th Januar y, 2012, Japan 13. M.F. Porter , "Snowball: A language for st emming algori thms." , 2001 . 14. M. Woli ń ski, M . Mi ł kowski, M . Ogrodnicz uk, A . Przepiórkowski , and Ł . Sza ł kiewicz , „ PoliMorf: a (not so) new open morphological dictionary for Polish. ”, In Proceedings of the Eighth Internation al Conference on Language Resources and Evaluation, LREC 2012, p. 860 – 864, Istanbul, Turkey, 2012. 15. European Federation of Hard of Hearing Peop le, „State of subtitli ng access in EU. Report 2011”, available at: http://ec.europa.eu/i nternal_market/cons ultations/2011/ audiovisual/non - registered - organisations/european - federation - of - hard - of - hearing - people - efhoh - _en.pdf , 201 1 16. A. Szarkows ka, et al. , „A re interpreters better respeakers? A n exploratory study on respeaking com petences” at Respeaki ng, li ve subtitling and accessibility conference, Rome , 2015 17. P. Romero - Fres co, and J. Martínez, "Accuracy rate in live su btitling – the NER mod el.", 2011 . 18. G.A. Se ber, A. J . Lee, „ Line ar regre ssion a nalysis ” (Vol. 936). John Wiley & Sons , 201 2 . 19. J.O. Kim, C.W. Muelle r, C. W. , „ Standardized and unstand ardized coefficients in causal analysis An expository note.”, Sociol ogical Metho ds & Research, 4(4), 423 - 438 , 1976 . 20. J. Frost, "Multi ple Regression Anal ysis: Use Adjust ed R - Squared and Predicted R - Square d to Include the Correct N umber of Variab les." The Minitab Blo g, http://blog. minitab. com/blog/adventures - in - statistics/multiple - regessiona nalysis - use - adjusted -r- squared - an d- predicted -r- squared - to - in clude - the - correctnumber - of - variables , 2013 . 21. D. W. Zimmerman, „ A Note on Interpr etat ion of the Paire d - Samples t Test". Jo urnal of Education al and Behavioral Stat ist ics 22 (3), p. 34 9 – 360, 1997.
Original Paper
Loading high-quality paper...
Comments & Academic Discussion
Loading comments...
Leave a Comment