A More Powerful Two-Sample Test in High Dimensions using Random Projection
We consider the hypothesis testing problem of detecting a shift between the means of two multivariate normal distributions in the high-dimensional setting, allowing for the data dimension p to exceed the sample size n. Specifically, we propose a new …
Authors: Miles E. Lopes, Laurent J. Jacob, Martin J. Wainwright
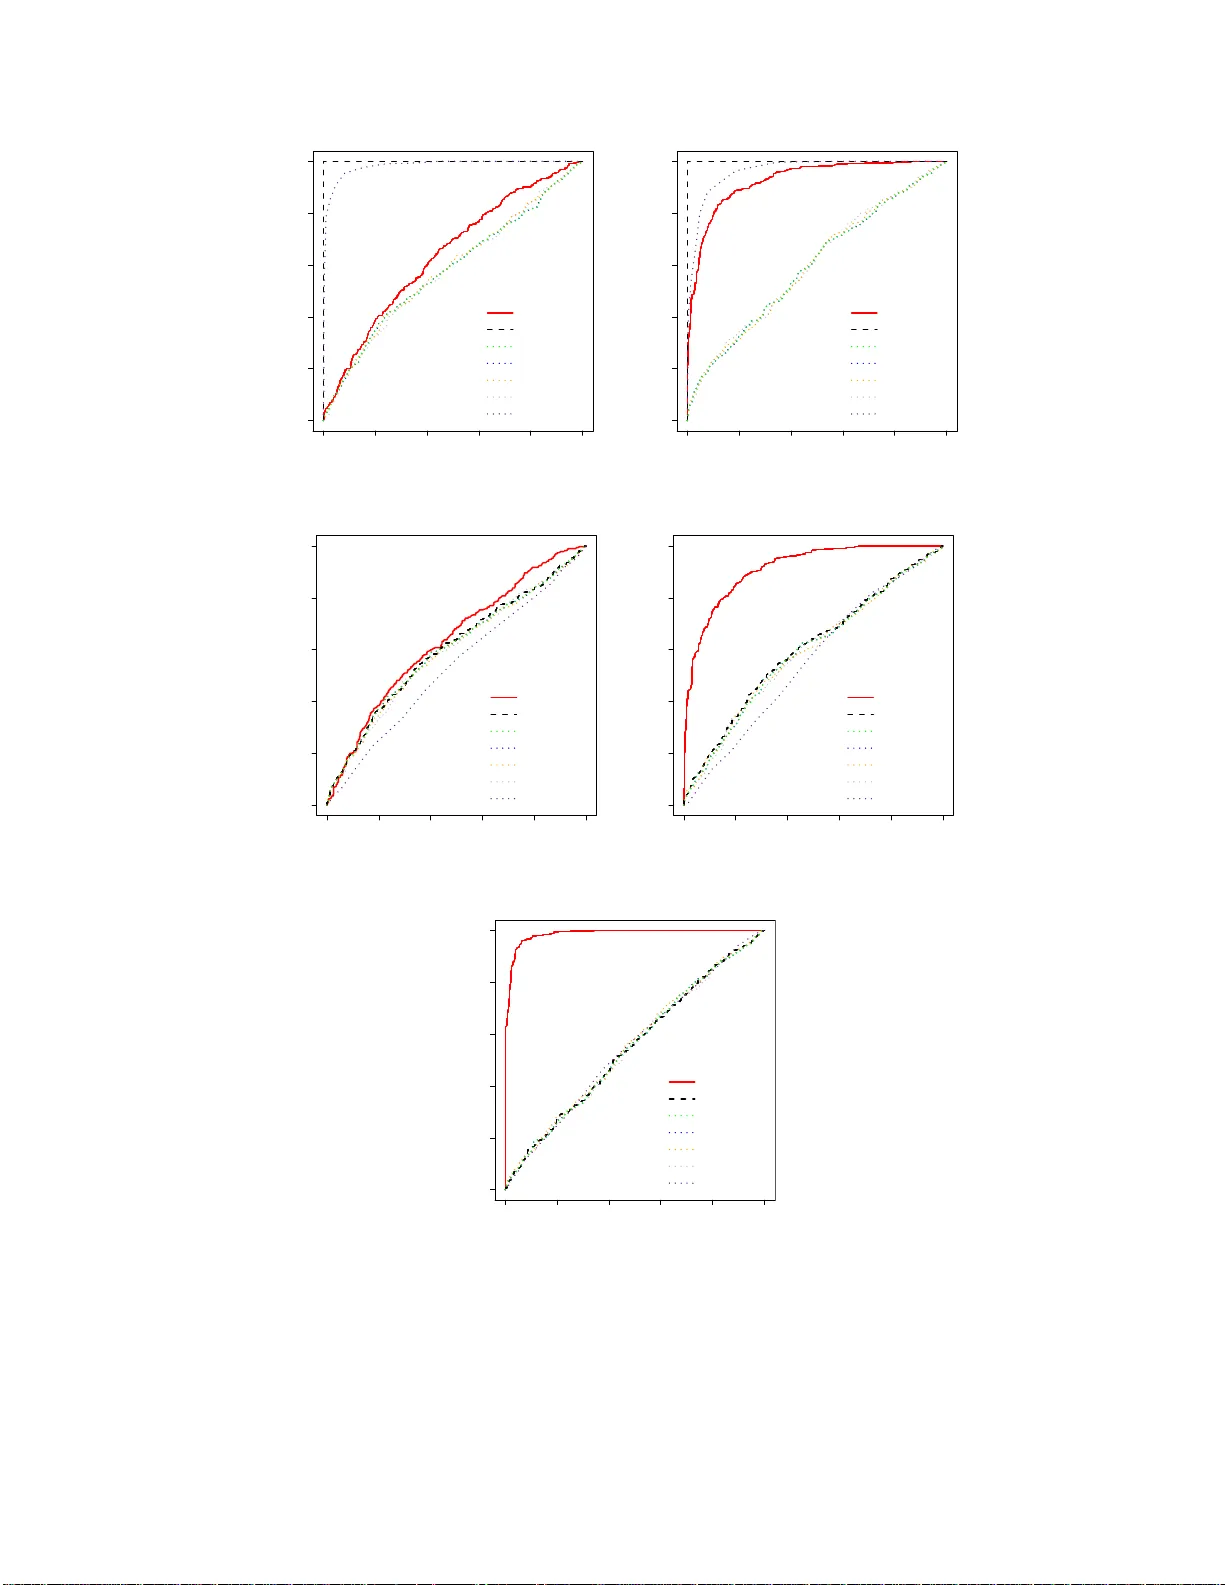
A More P o w e rful Tw o-Sample T est in High Dimension s using Random Pro jection Miles E. Lop es 1 Lauren t J. Jacob 1 Martin J. W ain wright 1 , 2 mlopes@sta t.berkeley .edu laurent@st at.berkele y.edu wainwrig@s tat.berkel ey.edu Departmen ts of Statistics 1 and EECS 2 Univ ersit y of California, Berk eley Abstract W e consider the h yp othesis testing problem of detecting a s hift b etw een the mea ns of t wo m ul- tiv ariate normal distributions in the high-dimensiona l setting, a llowing f or the data dimension p to exceed the s ample size n . Sp ecifically , w e pro po se a new test statistic for the tw o -sample test of means tha t int egrates a ra ndom pro jection with the clas sical Ho telling T 2 statistic. W orking under a high-dimensional fr amework with ( p, n ) → ∞ , w e first derive an asy mpto tic p ow er function for our test, and then provide sufficient conditions for it to achiev e gr eater p ow er than other state-o f-the-art tests. Using ROC cur ves gener ated from synthetic data, we demonstra te sup e rior p er formance agains t comp eting tests in the par a meter reg imes anticipated by our the- oretical r esults. Lastly , we illustrate a n adv antage of our pro cedur e’s false p ositive rate with compariso ns on high-dimensional gene expres sion data involving the discrimination of different t yp es of cancer. 1 In tro duction Application d omains su c h as m olecular biology and fMRI [e.g., 1, 2, 3, 4] hav e stimulat ed consider- able interest in t wo-sample hypothesis testing prob lems in th e h igh-dimensional setting, wh ere t wo samples of data { X 1 , . . . , X n 1 } and { Y 1 , . . . , Y n 2 } are subsets of R p , and n 1 , n 2 ≪ p . The problem of discriminating b et w een t w o d ata-generat ing distr ibutions b ecomes difficult in this cont ext as the cu mulativ e effect of v ariance in man y v ariables can “explain a w ay” th e correct hypothesis. In transcriptomics, for instance, p gene exp ression measures on the order of hundreds or thousands ma y b e used to in v estigate differences b et w een t wo biological conditions, and it is often difficult to obtain sample sizes n 1 and n 2 larger than sev eral dozen in eac h condition. F or problems such as these, classical metho ds ma y b e ineffectiv e, or not applicable at all. Lik ewise, there has b een gro wing in terest in devel oping testing pr o cedures th at are b etter suited to deal with the effects of dimension [e.g., 5, 6, 7, 8, 9]. A f undamenta l instance of the general tw o-sample problem is the t wo-sample test of means with Gaussian data. In this case, t wo indep enden t sets of samples { X 1 , . . . , X n 1 } and { Y 1 , . . . , Y n 2 } ⊂ R p are generated in an i.i.d. manner from p -dimensional m ultiv ariate normal distribu tions N ( µ 1 , Σ) and N ( µ 2 , Σ) r esp ectiv ely , where the mean v ectors µ 1 and µ 2 , and p ositiv e-definite co v ariance matrix Σ ≻ 0, are all fi xed and unkno wn. Th e hyp othesis testing pr oblem of interest is H 0 : µ 1 = µ 2 v ersu s H 1 : µ 1 6 = µ 2 . (1) The most well- kno wn test statistic for th is problem is the Hotelling T 2 statistic, defined by T 2 := n 1 n 2 n 1 + n 2 ( ¯ X − ¯ Y ) ⊤ b Σ − 1 ( ¯ X − ¯ Y ) , (2) 1 where ¯ X := 1 n 1 P n 1 j =1 X j and ¯ Y := 1 n 2 P n 2 j =1 Y j are the sample means, and b Σ is the p o oled sample co v ariance matrix, giv en b y b Σ : = 1 n P n 1 j =1 ( X j − ¯ X )( X j − ¯ X ) ⊤ + 1 n P n 2 j =1 ( Y j − ¯ Y )( Y j − ¯ Y ) ⊤ , where we define n := n 1 + n 2 − 2 for con v enience. When p > n , the matrix b Σ is singular, and the Hotelling test is not well-defined. Eve n when p ≤ n , the Hotelling test is known to p erform p oorly if p is nearly as large as n . This wa s shown in an imp ortan t pap er of Bai and Saranadasa (abbreviated BS) [5], who stud ied the p erformance of the Hotelling test under ( p, n ) → ∞ with p/n → 1 − ǫ , and sho w ed that the asymptotic p o wer of the test su ffers for small v alues of ǫ > 0. Consequently , sev eral impro vemen ts on the Hotelling test ha ve b een p rop osed in the high-dimensional setting in past y ears [e.g., 5, 6 , 7 , 8]. Due to th e we ll-kno wn degradation of b Σ as an estimate of Σ in high dimensions, the line of researc h on extensions of Hotelling test for p roblem (1) has fo cused on replacing b Σ in the defin ition of T 2 with other estimators of Σ. In the pap er [5], BS prop osed a test statistic b ased on th e quan tit y ( ¯ X − ¯ Y ) ⊤ ( ¯ X − ¯ Y ), whic h can be view ed as replacing b Σ with I p × p . It w as s h o wn by BS that this statistic ac hiev es non-trivial asymptotic p o we r whenever the ratio p/n con v erges to a constan t c ∈ (0 , ∞ ). This statistic was later refin ed by Chen and Qin [8] (CQ for s hort) wh o sho wed that the same asymp totic p o w er can b e ac hiev ed without imp osing an y explicit restriction on the limit of p/n . Another direction wa s considered by S riv asta v a and Du [6, 7] (SD for short), who prop osed a test statisti c based on ( ¯ X − ¯ Y ) ⊤ b D − 1 ( ¯ X − ¯ Y ), where b D is the diagonal matrix asso ciated with b Σ, i.e. b D ii = b Σ ii . Th is choic e ensures that b D is inv ertible f or all dimen sions p with probabilit y 1. Sriv asta v a and Du demonstrated that their test h as sup erior asymptotic p o w er to the tests of BS and CQ un der a certain parameter setting and lo cal alternativ e when n = O ( p ). T o the b est of our kn owledge, th e pro cedures of CQ and SD rep resen t the state-of-the-art among tests for problem (1) 1 with a known asymptotic p o w er fun ction u n der the s caling ( p, n ) → ∞ . In th is pap er, w e p rop ose a new testing pro cedure for problem (1 ) in the high-dimensional set- ting, which inv olv es randomly pro jecting the p -dimensional samples in to a space of lo wer dimension k ≤ min { n, p } , and then w orking w ith the Hotelling test in R k . Allo wing ( p, n ) → ∞ , w e deriv e an asymptotic p o w er fun ction for our test and sho w that it outp erforms the tests of BS, CQ, and SD in terms of asymptotic relativ e efficiency u nder certain conditions. Our comparison results are v alid with p/n tendin g to a constan t or infinity . F urthermore, whereas the men tioned testing pro cedures can only offer appr o ximate lev el- α critical v alues, our pr o cedure sp ecifies exact lev el- α critical v alues for general multiv ariate n ormal data. Our test is also very easy to implement , an d has a computational cost of order O ( n 2 p ) op erations wh en k scales linearly with n , whic h is mo dest in the high-dim en sional setting. F rom a conceptual p oint of view, the p ro cedure studied here is most d istinct from p ast ap- proac hes in th e w a y that co v ariance structure is incorp orated in to the test statistic. As stated ab o ve, the test statistics of BS, CQ, and SD are essentia lly b ased on v ersions of the Hotelling T 2 with diagonal estimators of Σ . Our analysis and sim ulations sho w that this limited estimation of Σ sacrifices p o w er when th e data v ariables are correlated, or wh en most of the v ariance can b e captured in a small n u m b er of v ariables. In this regard, our pr o cedure is motiv ated by th e id ea that co v ariance structure ma y b e used more effectiv ely b y testing with pro jected samples in a s pace of low er dimen sion. Th e u se of pro jection-based test statistics h as also b een considered previously in Jacob et al. [10] and Cl´ emen¸ con et al. [9]. 1 The tests of BS, CQ, and SD actually extend somewhat b eyond the p roblem (1) in th at their asymp t otic p ow er functions ha ve b een obtained u nder d ata-generating distribu t ions more general t han Gaussian, e.g. satisfying simple moment conditions. 2 The remainder of this pap er is organized as follo w s. In Section 2, we discuss th e in tuition for our testing pro cedur e, and then formally define the test statistic. Section 3 is dev oted to a n u m b er of theoretical results ab out the p erformance of the test. Theorem 1 in Section 3.1 provi des an asymptotic p ow er fu nction, and T heorems 2 and 3 in Sections 3.4 and 3.5 giv e sufficient cond itions for ac h ieving greater p o w er than the tests of CQ and S D in the s en se of asymptotic relativ e efficiency . In Sections 4.1 and 4.2, we us e synthetic d ata to mak e p erformance comparisons w ith R OC and calibration curv es against the m entioned tests, as w ell as some r ecen t non-parametric pro cedures suc h as maxim um mean discrepancy (MMD) [11], ke rnel Fish er discriminant analysis (KFDA) [12], and a test b ased on area-und er -cur v e m aximization, denoted T reeRank [9]. Th ese simulations s h o w that our test outp erf orms comp eting tests in the p arameter regimes ant icipated by our theoretical results. Lastly , in S ection 4.3 we study an example inv olving high-dimensional gene expression data, and demonstrate an adv an tage of our test in terms of its f alse p ositiv e rate wh en discriminating b et w een differen t t yp es of cancer. Notation. W e us e δ := µ 1 − µ 2 to d en ote the shift ve ctor b et we en the d istributions N ( µ 1 , Σ) and N ( µ 2 , Σ). F or a p ositiv e-definite cov ariance matrix Σ, let D σ b e th e diagonal m atrix obtained b y setting the off-diag onal en tries of Σ to 0, and also define the associated correlat ion matrix R := D − 1 / 2 σ Σ D − 1 / 2 σ . Let z 1 − α denote the 1 − α quanti le of the stand ard normal distribution, and let Φ b e its cumulati v e distrib ution fu nction. If A is a matrix in R p × p , let | | | A | | | 2 denote its sp ectral norm (maxim um singular v alue), and define the F rob eniu s norm | | | A | | | F := q P i,j A 2 ij . When all the eigen v alues of A are real, we denote them by λ min ( A ) = λ p ( A ) ≤ · · · ≤ λ 1 ( A ) = λ max ( A ). If A is p ositiv e-definite, we write A ≻ 0, and A 0 if A is p ositiv e semidefinite. W e u se the notation f ( n ) . g ( n ) if there is some ab s olute constant c ∈ (0 , ∞ ) suc h that the inequalit y f ( n ) ≤ c n holds for all large n . If b oth f ( n ) . g ( n ) and g ( n ) . f ( n ) hold, then w e write f ( n ) ≍ g ( n ). The notation f ( n ) = o ( g ( n )) means f ( n ) /g ( n ) → 0 as n → ∞ . F or t w o random v ariables X and Y , equalit y in distribution is wr itten as X d = Y . 2 Random pro jection metho d F or the remainder of the pap er, we retain th e setup for the tw o-sample test of means (1) with Gaussian data giv en in Section 1. In p articular, our pro cedur e can b e imp lemented with p > n or p ≤ n , as long as k is c hosen su c h that k ≤ min { n, p } . In Section 3.3, we d emons trate an optimalit y prop erty of the c h oice k = ⌊ n/ 2 ⌋ , whic h is v alid in mo d er ate or high-d im en sions, i.e., p ≥ ⌊ n / 2 ⌋ , and we restrict our attenti on to this case in Theorems 2 and 3. 2.1 In tuit ion for random pro jection metho d A t a high lev el, our metho d can b e view ed as a t wo -step pro cedur e. First, a single random pr o jectio n P ⊤ k ∈ R k × p is dra wn , and is u sed to map the s amp les f rom the high-dimens ional space R p to a lo w-dimensional sp ace R k . S econd, the Hotelli ng T 2 test is applied to a n ew hyp othesis testing problem, denoted H 0 , pro j v ersu s H 1 , pro j , in the pr o jecte d space. A decision is then pulled back to the high-dimensional problem (1) b y simp ly rejecting the original null hyp othesis H 0 whenev er the Hotelling test rejects H 0 , pro j in the pr o jecte d sp ace. T o p ro vid e some in tuition for our metho d , it is p ossible to consider the problem (1) in terms of a comp etition b et w een the dimension p , and the “statistica l distance” separating H 0 and H 1 . On one 3 hand, the accum ulation of v ariance from a large num b er of v ariables mak es it difficult to discrimin ate b et w een the h yp otheses, and thus, it is desirable to reduce the d imension of the data. On the other hand, metho d s for red u cing dimens ion also tend to b ring H 0 and H 1 “closer together,” making them harder to distinguish . Mindful of the fact that the Hotelling T 2 measures the separation of H 0 and H 1 in terms of th e K ullbac k-Leibler div ergence D KL ( N ( µ 1 , Σ) k N ( µ 2 , Σ)) = 1 2 δ ⊤ Σ − 1 δ , with δ = µ 1 − µ 2 , 2 w e see that the relev ant s tatistica l distance is dr iv en b y the length of δ . C onsequen tly , w e seek to transform th e d ata in a wa y that reduces d imension and p reserv es m ost of the length of δ up on passin g to the transformed distributions. F rom this geometric p oin t of view, it is natural to exploit the fact that random pro jectio ns can sim u ltaneously reduce d imension and appr o ximately preserve length with high p r obabilit y [14]. In add ition to reducing d imension in a wa y th at tends to preserve statistical d istance b et w een H 0 and H 1 , r andom p ro jections hav e t wo other interesting pr op erties with regard to the design of test statistics. Note that w hen th e Hotelling test s tatistic is constru cted f rom the pro jected samples in a space of dimension k ≤ min { n, p } , it is prop ortional to [ P ⊤ k ( ¯ X − ¯ Y )] ⊤ ( P ⊤ k b Σ P k ) − 1 [ P ⊤ k ( ¯ X − ¯ Y )]. 3 Th us, whereas th e tests of BS, CQ , an d SD replace b Σ in the definition of T 2 with a d iagonal estima- tor, our pro cedure u ses P ⊤ k b Σ P k as a k × k su rrogate for b Σ. The key adv an tage is that P ⊤ k b Σ P k retains some in formation ab out the off-diagonal entries of Σ. Another b enefit offered b y random pro jection concerns the robu stness of critical v alues. In the classical setting where p ≤ n , th e critical v alues of the Hotelling test are exact in the presence of Gaussian d ata. I t is also well -kno wn f rom the pro jection purs uit literature that the empirical distrib u tion of randomly pr o jecte d data tend s to b e appro ximately Gaussian [15]. Ou r p ro cedure lev erages these t wo facts by first “inducing Gaussian- it y” and then applying a test that has exact critical v alues for Gaussian data. Consequently , we exp ect that the critical v alues of our pr o cedure ma y b e accurate ev en w hen the p -dimen sional d ata are n ot Gaussian, and this idea is illustrated b y a simulat ion with data generated from a mixture mo del, as wel l as an example with real transcriptomic data in Section 4.3. 2.2 F ormal testing pro cedure F or an inte ger k ∈ { 1 , . . . , min { n, p }} , let P ⊤ k ∈ R k × p denote a random matrix with i.i.d. N (0 , 1) en- tries, 4 dra w n indep end en tly of the d ata. C on d itioning on a giv en draw of P ⊤ k , th e pro jected samples { P ⊤ k X 1 , . . . , P ⊤ k X n 1 } and { P ⊤ k Y 1 , . . . , P ⊤ k Y n 2 } are distributed i.i.d. according to N ( P ⊤ k µ i , P ⊤ k Σ P k ) resp ectiv ely , with i = 1 , 2. Since the pro jected data are Gaussian and lie in a sp ace of dimension no larger than n , it is natur al to consid er applyin g the Hotelling test to the follo wing t wo -samp le problem in the pr o jected space R k : H 0 , pro j : P ⊤ k µ 1 = P ⊤ k µ 2 v ersu s H 1 , pro j : P ⊤ k µ 1 6 = P ⊤ k µ 2 . (3) F or this pro jected pr oblem, the Hotelling test statistic take s the form T 2 k := n 1 n 2 n 1 + n 2 [ P ⊤ k ( ¯ X − ¯ Y )] ⊤ ( P ⊤ k b Σ P k ) − 1 [ P ⊤ k ( ¯ X − ¯ Y )] , 2 When p ≤ n , the d istribution of th e Hotelling T 2 under b oth H 0 and H 1 is given by a scaled noncentral F distribution p n n − p +1 F p,n − p − 1 ( η ), with noncentralit y parameter η := n 1 n 2 n 1 + n 2 δ ⊤ Σ − 1 δ . The exp ected v alue of T 2 gro ws linearly with η , e.g., see Mu irhead [13, p. 216, p. 25]. 3 F or the choice of P ⊤ k giv en in Section 2.2, th e matrix P ⊤ k b Σ P k is inv ertible with probability 1. 4 W e refer to P ⊤ k as a pro jection, eve n though it is not a pro jection in the strict sense of b eing idemp otent. Also, w e do not normalize P ⊤ k by 1 / √ k (which is commonly used for Gaussian matrices [14]) b ecause our statistic T 2 k is inv arian t with resp ect to th is scaling. 4 where ¯ X , ¯ Y , and b Σ are as stated in the introd uction. Note that P ⊤ k b Σ P k is inv ertible with p r obabilit y 1 when P ⊤ k has i.i.d. N (0 , 1) entries, w hic h ensures that T 2 k is wel l-defined, even w hen p > n . When conditioned on a dr a w of P ⊤ k , th e T 2 k statistic has an k n n − k +1 F k ,n − k +1 distribution un der H 0 , pro j , since it is an ins tance of th e Hotelling test statistic [13, p . 216]. Insp ect ion of the formula for T 2 k also shows that its d istribution is the s ame u n der b oth H 0 and H 0 , pro j . Consequen tly , if w e let t α := k n n − k +1 F 1 − α k ,n − k +1 , where F 1 − α k ,n − k +1 is the 1 − α quan tile of the F k ,n − k +1 distribution, then the condition T 2 k ≥ t α is a lev el- α decision r ule f or r ejecting th e null hyp othesis in b oth the pro jected problem (3) and the original pr ob lem (1). Accordingly , we define this as th e cond ition for rejecting H 0 at lev el α in our pro cedur e for (1). W e summarize the implemen tation of our pro cedu re b elo w. Implemen tation of random p ro jection-based test at level α for prob lem (1). 1. Generate a single rand om matrix P ⊤ k ∈ R k × p with i.i.d. N (0 , 1) entries. 2. C ompute T 2 k , using P ⊤ k and the tw o sets of samples. 3. I f T 2 k ≥ t α , r eject H 0 ; otherwise accept H 0 . ( ⋆ ) 3 Main results and their c on sequenc es This section is dev oted to the statement and d iscussion of our main theoretica l results, in cluding an asymptotic p o w er function for our test (Theorem 1 ), and comparisons of asymptotic relativ e efficiency with state-of-the-art tests p rop osed in past work (Theorems 2 and 3). 3.1 Asymptotic p o w er function Our firs t main result c haracterizes th e asymptoti c pow er of the T 2 k test statistic in the high- dimensional setting. As is standard in high-dimensional asymptotics, we consider a sequence of h y p othesis testing pr oblems indexed by n , allo wing the dimension p , sample sizes n 1 and n 2 , mean v ectors µ 1 and µ 2 and co v ariance m atrix Σ to implicitly v ary as functions of n , with n tending to infinity . W e also mak e another t yp e of asymptotic assump tion, kno wn as a lo c al alternative , wh ic h is commonplace in hypothesis testing (e.g., see v an der V aart [16 § 14.1]) . The idea lying b ehind a lo cal alternativ e assumption is that if the difficulty of discrim in ating b et w een H 0 and H 1 is “held fixed” with resp ect to n , then it is often the case that most testing pr o cedures hav e p o w er tendin g to 1 under H 1 as n → ∞ . In suc h a situation, it is n ot p ossible to tell if one test has greater asymp - totic p o wer than another. Consequently , it is standard to deriv e asymp totic p o we r results un der the extra condition that H 0 and H 1 b ecome harder to d istinguish as n gro ws. This theoretical device aids in id en tifying the conditions under whic h one test is more p o we rful than another. The follo wing lo cal alternativ e ( A0 ), and balancing assu mption ( A1 ), are the same as those used b y Bai and Saranadasa [5] to stud y the asymp totic p o w er of th e classical Hotelling test un der ( n, p ) → ∞ . In particular, the lo cal alternativ e ( A0 ) means that the Ku llbac k-Leibler d iv ergence b et w een the p -dimensional sampling distributions, D KL ( N ( µ 1 , Σ) k N ( µ 2 , Σ)) = 1 2 δ ⊤ Σ − 1 δ , tend s to 0 as n → ∞ . ( A0 ) (Lo cal alternativ e.) The shif t vect or and co v ariance matrix satisfy δ ⊤ Σ − 1 δ = o (1). ( A1 ) There is a constan t b ∈ (0 , 1) suc h that n 1 /n → b . 5 ( A2 ) There is a constan t y ∈ (0 , 1) suc h that k /n → y . T o set some notation for our asymp totic p ow er resu lt in Th eorem 1 , let θ := ( δ , Σ) b e an ordered pair contai ning the relev an t p arameters for pr ob lem (1), and defin e ∆ 2 k as twic e the Kullbac k-Leibler div ergence b et w een the p ro jected sampling distributions, ∆ 2 k := 2 D KL N ( P ⊤ k µ 1 , P ⊤ k Σ P k ) N ( P ⊤ k µ 2 , P ⊤ k Σ P k ) = δ ⊤ P k ( P ⊤ k Σ P k ) − 1 P ⊤ k δ . (4) When interpreting the statemen t of Theorem 1 b elow, it is imp ortan t to notice that eac h time the pro cedur e ( ⋆ ) is implemented, a d ra w of P ⊤ k induces a new test statistic T 2 k . Ma king this dep end en ce on P ⊤ k explicit, let β ( θ ; P ⊤ k ) denote the exact (non-asymptotic) p o wer fun ction of the T 2 k statistic at leve l α for problem (1), cond itioned on a give n dra w of P ⊤ k , as in p ro cedure ( ⋆ ). Theorem 1. Assume c onditions ( A0 ), ( A1 ), and ( A2 ). Then, for almost al l se quenc es of pr oje c- tions P ⊤ k , the p ower function β ( θ ; P ⊤ k ) satisfies β ( θ ; P ⊤ k ) − Φ − z 1 − α + b (1 − b ) r 1 − y 2 y ∆ 2 k √ n → 0 as n → ∞ . (5) Remarks. Notice that if ∆ 2 k = 0 (e.g. under H 0 ), then Φ( − z 1 − α + 0) = α , whic h corresp onds to blin d guessing at leve l α . Consequen tly , the second term b (1 − b ) q 1 − y 2 y ∆ 2 k √ n d etermin es the adv an tage of our pro cedure o v er blind guessing. S in ce ∆ 2 k is t wice the KL-diverge n ce b et w een the pro jected sampling d istributions, these observ ations conform to the in tuition from Section 2 that the KL-divergence measures the discrepancy b et w een H 0 and H 1 . Pr o of of The or em 1. Let β H ( θ ; P ⊤ k ) d enote the exact p ow er of the Hotelli ng test for the pro jected problem (3) at lev el α . As a preliminary step, w e v erify that β ( θ ; P ⊤ k ) = β H ( θ ; P ⊤ k ) , (6) for almost all P ⊤ k . T o see this, first r ecall fr om Section 2 that the condition T 2 k ≥ t α is a lev el- α rejection criterion in b oth the pro cedu re ( ⋆ ) for the original prob lem (1), and the Hotelling test for the pro jected pr ob lem (3 ). Next, n ote that if H 1 : δ 6 = 0 holds, then H 1 , pro j : P ⊤ k δ 6 = 0 holds with p r obabilit y 1, since P ⊤ k δ is distrib uted as N (0 , k δ k 2 2 I k × k ). C onsequen tly , for almost all P ⊤ k , the lev el- α decision rule T 2 k ≥ t α has the same p o w er agai nst the alternativ e in b oth the original and the pro jected pr oblems, which v erifi es (6). This establishes a tec hnical link that allo ws results on the p o w er of the classical Hotelling test to b e transf er r ed to the high-dimensional p roblem (1). In order to complete the pro of, we use a resu lt of Bai an d Saranadasa [5, Theorem 2.1] 5 , which asserts th at if ∆ 2 k = o (1) holds for a fixed sequence of pro jections P ⊤ k , and assumptions ( A1 ) and ( A2 ) hold, then β H ( θ ; P ⊤ k ) satisifes β H ( θ ; P ⊤ k ) − Φ − z 1 − α + b (1 − b ) r 1 − y 2 y ∆ 2 k √ n → 0 as n → ∞ . (7) T o ensur e ∆ 2 k = o (1), we app eal to a deterministic matrix in equalit y that follo w s from the p ro of of Lemma 3 in Jacob et al. [10]. Namely , for any full rank matrix M ⊤ ∈ R k × p , and an y δ ∈ R p , δ ⊤ M ( M ⊤ Σ M ) − 1 M ⊤ δ ≤ δ ⊤ Σ − 1 δ . 5 T o prevent confusion, note that the notation in BS [5] for δ differs from ours. 6 Since P ⊤ k is full rank w ith probabilit y 1, we see that ∆ 2 k ≤ δ ⊤ Σ − 1 δ → 0 for almost all s equences of P ⊤ k under the lo cal alternativ e ( A0 ), as needed. Thus, the pro of of Th eorem 1 is completed by com binin g equation (6) w ith the limit (7). 3.2 Asymptotic r elativ e efficiency (ARE) Ha ving deriv ed an asymptotic p o w er function in Th eorem 1, w e are now in p osition to p ro vide a detailed comparison with the tests of CQ [8] and SD [6 , 7]. W e den ote the asymp totic p ow er function of our lev el- α r andom pro jection-based test (RP) by β RP ( θ ; P ⊤ k ) := Φ − z 1 − α + b (1 − b ) r 1 − y 2 y ∆ 2 k √ n , (8) where we r ecall θ := ( δ , Σ). T he asymptotic p o w er functions for the level - α testing pr o cedures of CQ [8] and S D [6, 7 ] are giv en b y β CQ ( θ ) := Φ − z 1 − α + b (1 − b ) √ 2 k δ k 2 2 n | | | Σ | | | F , and (9a) β SD ( θ ) := Φ − z 1 − α + b (1 − b ) √ 2 δ ⊤ D − 1 σ δ n | | | R | | | F , (9b) where D σ denotes the matrix form ed by s etting the off-diagonal entries of Σ to 0, and R denotes the correlation matrix asso ciated to Σ. The functions β CQ and β SD are deriv ed und er local alternativ es and asymp totic assu m ptions that are similar to the ones used here to obtain β RP . In particular, all three fun ctions can b e obtained allo w ing p/n to tend to an arbitrary p ositiv e constan t, or to infinity . A standard metho d of comparing asymp totic p o we r functions is through the concept of asymp- totic r elative efficiency , or ARE for short (e.g., see v an der V aart [16, ch. 14-1 5]). Since the term added to − z 1 − α inside the Φ function is what con trols pow er, the relativ e efficiency of tests is defined by the ratio of suc h terms. More explicitly , w e define ARE ( β CQ ; β RP ) := k δ k 2 2 n | | | Σ | | | F . q 1 − y y ∆ 2 k √ n 2 , and (10a) ARE ( β SD ; β RP ) := δ ⊤ D − 1 σ δ n | | | R | | | F . q 1 − y y ∆ 2 k √ n 2 . (10b) Whenev er the ARE is less than 1, our pro cedur e is consid ered to ha v e greater asymptotic p ow er than the comp eting test—with our adv an tage b eing greater for smaller v alues of the ARE . Consequ en tly , w e seek sufficien t conditions in Theorems 2 and 3 b elo w for ens uring that the ARE is sm all. In classical analyses of asymp totic relativ e efficiency , th e ARE is usu ally a d eterministic quan- tit y that do es not dep end on n . Ho we v er, in the current cont ext, our use of high-dimensional asymptotics, as w ell as a r an d omly constructed test statistic, lead to an ARE that v aries with n and is r an d om. (In other w ord s, the ARE s p ecifies a sequence of r andom v ariables in d exed b y n .) Moreo v er , the dep endence of the ARE on ∆ 2 k implies that the ARE is affecte d by the orien tation of the shift vect or δ . 6 T o consider an a ve rage-case s cenario, w here no single orienta tion of δ is of 6 In fact, ARE ( β CQ ; β RP ) and ARE ( β SD ; β RP ) are inv arian t with resp ect to scaling of δ , and so t he orien tation δ / k δ k 2 is the only part of the shift vector that is relev ant for comparing p ow er. 7 particular imp ortance, w e place a p rior on δ , and assu me that it follo ws a spherical distribu tion 7 with P ( δ = 0) = 0. This implies that the orienta tion δ / k δ k 2 of the shift f ollo ws th e uniform (Haar) distribution on the unit sphere. W e emphasize that ou r pro cedure ( ⋆ ) do es n ot rely on this choice of p rior, and that it is only a device for making an a verag e-case comparison against CQ and S D in Th eorems 2 and 3. Lastly , we p oin t out that a similar assumption w as consider ed by Sriv asta v a and Du [6], w ho let δ b e a deterministic vecto r w ith all co ord inates equal to the same v alue, in order to compare with th e results of BS [5]. T o b e clear ab out the meaning of Prop osition 1 and Theorems 2 and 3 b elo w, we henceforth regard the ARE as a function of tw o random ob jects, P ⊤ k and δ , and our probabilit y statemen ts are made with this understand ing. W e complete the preparation for our comparison theorems by stating Prop ositio n 1 and sev eral limiting assumptions with n → ∞ . ( A3 ) The shift δ has a spherical distrib ution with P ( δ = 0) = 0, and is indep endent of P ⊤ k . ( A4 ) There is a constan t a ∈ [0 , 1) suc h that k /p → a . ( A5 ) Assume 1 √ k tr(Σ) p λ min (Σ) = o (1). ( A6 ) Assume | | | D − 1 σ | | | 2 tr( D − 1 σ ) = o (1). As can b e seen from the form u las for β RP and the ARE, the p erformance of the T 2 k statistic is determined by th e r an d om quantit y ∆ 2 k . The follo win g prop ositio n p ro vides interpretable u pp er and lo we r b ounds on ∆ 2 k that hold with high-probability . This prop osition is the main tec hnical to ol needed for our comparison results in Theorems 2 and 3. A pro of is giv en in Ap p endix B . Prop osition 1. Under c onditions ( A3 ), ( A4 ), and ( A5 ), let c b e any p ositive c onstant strictly less than (1 − √ a ) 2 , and let C b e any c onstant strictly gr e ater than (1+ √ a ) 2 (1 − √ a ) 2 . Then, as n → ∞ , we have P ∆ 2 k k δ k 2 2 ≥ c k tr(Σ) → 1 , and (11a) P ∆ 2 k k δ k 2 2 ≤ C k p λ min (Σ) → 1 . (11b) Remarks. Although w e ha ve pr esented upp er and lo w er b ound s in an asymptotic manner, our pro of sp ecifies non -asymp totic b ou n ds on ∆ 2 k / k δ k 2 2 . Due to the fact that Prop osition 1 is a to ol for making asymptotic comparisons of p ow er in Theorems 2 and 3, it is sufficient and simp ler to state the b oun ds in this asymptotic f orm . Note that if th e cond ition tr (Σ ) ≍ p λ min (Σ) holds, then Prop osition 1 is sharp in the sense the upp er and lo wer b ounds (11a) and (11b) matc h u p to constan ts. 3.3 Choice of pro ject ion dimension k = ⌊ n/ 2 ⌋ W e now demons tr ate an optimalit y p rop erty of the c h oice of p ro jected dimension k = ⌊ n/ 2 ⌋ . Note that this choic e implicitly assumes p ≥ ⌊ n/ 2 ⌋ , but th is d o es not affect the applicabilit y of pro cedure 7 i.e. δ d = U δ for any orth ogonal matrix U . 8 ( ⋆ ) in mo derate or high-dimensions. Letting k /n → y ∈ (0 , 1) as in assu mption ( A2 ), recall that the asymptotic p o w er function from Th eorem 1 is Φ − z 1 − α + b (1 − b ) r 1 − y 2 y ∆ 2 k √ n . Since Prop osition 1 ind icates that ∆ 2 k scales linearly in k up to random fl uctuations, w e see that formally r eplacing k with y n leads to m aximizing the function f ( y ) := q 1 − y 2 y y . The fact that f is maximized at y = 1 / 2 su ggests th at in certain cases, k = ⌊ n/ 2 ⌋ m a y b e asymptotically optimal in a su itable sense. Considering a simple case where Σ = σ 2 I p × p for some absolute constan t σ 2 > 0, it can b e sho w n 8 that u nder assumptions ( A2 ), ( A3 ), and in tegrabilit y of k δ k 2 2 , p n E (∆ 2 k ) E ( k δ k 2 2 ) → y /σ 2 , (12) for all y ∈ (0 , 1), as n → ∞ . The follo wing prop ositio n is an immediate extension of this obser- v ation, and shows that k = ⌊ n/ 2 ⌋ is optimal in a precise sens e for parameter s ettings that include Σ = σ 2 I p × p as a sp ecial case. Namel y , as n → ∞ , th e quanti t y q 1 − y 2 y ∆ 2 k is largest on a verag e for k = ⌊ n/ 2 ⌋ among all choi ces of k , und er the conditions stated b elo w. Prop osition 2. In addition to assumptions ( A2 ) and ( A3 ), supp ose that k δ k 2 2 is inte gr able. A lso assume that for some absolute c onstant σ 2 > 0 , the limit (12) holds for any y ∈ (0 , 1) . L et y ∗ = 1 / 2 , and k ∗ = ⌊ n/ 2 ⌋ . Then, for any y ∈ (0 , 1) , lim n →∞ q 1 − y ∗ 2 y ∗ E (∆ 2 k ∗ ) q 1 − y 2 y E (∆ 2 k ) = 1 2 p y (1 − y ) ≥ 1 . (13) Remarks. The ROC curv es in Figure 1 illustrate sev eral c hoices of pro jection d imension, with k = ⌊ y n ⌋ and y = 0 . 1 , 0 . 3 , 0 . 5 , 0 . 7 , 0 . 9, u nder tw o different p arameter settings. I n Setting (1), Σ = σ 2 I p × p with σ 2 = 50, and in S etting (2 ), the matrix Σ w as constructed with a rapidly deca ying sp ectrum, and a matrix of eigen ve ctors dra wn from th e uniform (Haar) distribution on the orthogonal group, as in p anel (d ) of Figure 3 (see Section 4.1 for additional details). The curv es in b oth settings w ere generated b y sampling n 1 = n 2 = 50 data at p oin ts from eac h of the distributions N ( µ 1 , Σ) and N ( µ 2 , Σ) in p = 200 dimensions, and rep eat ing th e pro cess 2000 times under b oth H 0 and H 1 . F or the exp erimen ts under H 1 , the shift δ w as dra wn u niformly from a sphere of radius 3 for Setting (1), and radius 1 f or S etting (2)—in acco rdance with assu mption ( A3 ) in Pr op osition 2. Note that k = ⌊ n/ 2 ⌋ giv es th e b est ROC curve f or Setting (1) in Figure 1, whic h agrees w ith the fact that Σ = σ 2 I p × p satisfies the conditions of Prop ositi on 2. In Setting (2), we see that the choic e k = ⌊ n/ 2 ⌋ is not far from optimal, even wh en Σ is v ery differen t fr om σ 2 I p × p . 8 Note th at k δ k 2 and δ / k δ k 2 are in d ep endent, and E h δ ⊤ k δ k 2 A δ k δ k 2 i = tr( A ) /p for any A ∈ R p × p , und er ( A3 ); see [13, p. 38]. 9 F alse positiv e rate T rue positive r ate 0.0 0.2 0.4 0.6 0.8 1.0 0.0 0.2 0.4 0.6 0.8 1.0 y=0.5 y=0.1 y=0.3 y=0.7 y=0.9 (a) S etting (1) F alse positiv e rate T rue positive r ate 0.0 0.2 0.4 0.6 0.8 1.0 0.0 0.2 0.4 0.6 0.8 1.0 y=0.5 y=0.1 y=0.3 y=0.7 y=0.9 (b) Setting (2) Figure 1. Setting (1) co rresp onds to Σ = σ 2 I p × p with σ 2 = 50, and Setting (2) involv es a cov a riance matrix Σ with randomly selected eig e n vectors a nd a rapidly decaying sp ectrum. The ROC cur ves indicate that k = ⌊ n/ 2 ⌋ is optimal, or near ly optimal, amo ng the five choices of y in the t wo settings . 3.4 P ow er comparison wit h CQ The next result provides a sufficient condition for the T 2 k statistic to b e asymptotically more p o w erf u l than the test of CQ . A pro of is giv en at the end of this section (3.4 ). Theorem 2. Under the c onditions of Pr op osition 1, supp ose that we use a pr oje ction dimension k = ⌊ n/ 2 ⌋ , wher e we assume p ≥ ⌊ n/ 2 ⌋ . F ix a numb er ǫ 1 > 0 , and let c 1 ( ǫ 1 ) b e any c onstant strictly gr e ater than 4 ǫ 1 (1 − √ a ) 4 . If the c ondition n ≥ c 1 ( ǫ 1 ) tr(Σ) 2 | | | Σ | | | 2 F , (14) holds for al l lar ge n , then P [ARE ( β CQ ; β RP ) ≤ ǫ 1 ] → 1 as n → ∞ . Remarks. The case of ǫ 1 = 1 s er ves as the reference for equal asymptotic p erformance, with v alues ǫ 1 < 1 corresp on d ing to the T 2 k statistic b eing asymptotically more p o we rful than the test of CQ. T o in terpret the resu lt, note that Jens en’s inequalit y imp lies that the ratio tr(Σ) 2 / | | | Σ | | | 2 F lies b et w een 1 and p , for any choice of Σ . As suc h, it is reasonable to int erpret this ratio as a measure of the effe ctive dimension of the co v ariance structur e. 9 The message of Th eorem 2 is that as long as the sample size n gro ws faster than the effectiv e dimension, then our p ro jection-based test is asymptotically su p erior to the test of CQ . The ratio tr(Σ) 2 / | | | Σ | | | 2 F can also b e viewed as measuring the de c ay r ate of th e sp ectrum of Σ, with the condition tr(Σ) 2 | | | Σ | | | 2 F ≪ p ind icating rapid deca y . Th is condition means that the d ata has lo w v ariance in “most” directions in R p , and s o pro jecting onto a random set of k directions 9 This ratio has also b een studied as an effective measure of matrix rank in th e context of low-rank matrix reconstruction [17]. 10 will likely map the data in to a lo w -v ariance su bspace in which it is harder for c hance v ariation to explain a wa y the correct h yp othesis, thereby resu lting in greater p ow er. Example 1. One in s tance of sp ectrum deca y o ccurs when the top s eigen v alues of Σ con tain most of the mass in the sp ectrum. When Σ is d iagonal, this h as the interpretatio n that s v ariables capture most of the total v ariance in the data. F or simplicit y , assum e λ 1 = · · · = λ s > 1 and λ s +1 = · · · = λ p = 1, wh ic h is s im ilar to the spike d c ovarian c e mo del introdu ced by Johnstone [18]. If the top s eigen v alues cont ain half of the total mass of th e sp ectrum, then s λ 1 = ( p − s ), and a simple calculation sh o ws that tr(Σ) 2 | | | Σ | | | 2 F = 4 λ 2 1 λ 2 1 + λ 1 s ≤ 4 s. (15) This again illustrates the idea that condition (14) is satisfied as long as n gro ws at a faster rate than the effectiv e n u m b er of v ariables s . It is s traigh tforward to c hec k that this example satisfies assumption ( A5 ) of T heorem 2 when, for instance, λ 1 = o ( √ k ). Example 2. Another example of sp ectrum deca y can b e sp ecified b y λ i (Σ) ∝ i − ν , for some absolute prop ortionalit y constant, a r ate parameter ν ∈ (0 , ∞ ), and i = 1 , . . . , p . This t yp e of deca y arises in connection with the F ourier co efficients of functions in Sob olev ellipsoids [19 § 7.2]. Noting that tr(Σ) ≍ R p 1 x − ν dx and | | | Σ | | | 2 F ≍ R p 1 x − 2 ν dx, direct computation of the integrals sho ws that tr(Σ) 2 | | | Σ | | | 2 F ≍ 1 if ν > 1 log 2 p if ν = 1 p 2(1 − ν ) if ν ∈ ( 1 2 , 1) p/ log p if ν = 1 2 p if ν ∈ (0 , 1 2 ) . Th us, a deca y rate giv en by ν ≥ 1 is easily sufficient for condition (14) to hold unless the d imension gro ws exp onen tially w ith n . On the other hand , deca y rates asso ciated to ν ≤ 1 / 2 are to o slo w for condition (14 ) to hold when n ≪ p , and r ates corresp onding to ν ∈ ( 1 2 , 1) lead to a more nuance d comp etition b et w een p and n . Assumption ( A5 ) of Th eorem 2 holds for all ν ∈ (0 , 1), b ut wh en ν = 1 or ν > 1, the dimen s ion p m u st satisfy the extra conditions log p = o ( √ k ) or p ν − 1 = o ( √ k ) resp ectiv ely . 10 The pro of of Th eorem 2 is a direct application of Prop osition 1. Pr o of of The or em 2. Recalling ARE ( β CQ ; β RP ) = n k δ k 2 2 | | | Σ | | | F . √ n ∆ 2 k 2 , with k = ⌊ n/ 2 ⌋ and y = 1 / 2, the ev en t of in terest, ARE ( β CQ ; β RP ) ≤ ǫ 1 , (16) is the same as n | | | Σ | | | 2 F 1 ǫ 1 ≤ ∆ 2 k k δ k 2 2 2 . 10 It ma y b e p ossible to relax ( A5 ) with a more refined analysis of the pro of of Prop osition 1. 11 By Prop osition 1, we know that for an y p ositive constan t c strictly less than (1 − √ a ) 2 , the probabilit y of the ev en t c k tr(Σ) ≤ ∆ 2 k k δ k 2 2 . (17) tends to 1 as n → ∞ . Consequentl y , as long as the inequalit y n | | | Σ | | | 2 F 1 ǫ 1 ≤ c k tr(Σ) 2 , (18) holds for all large n , then th e ev ent (16) of interest will also h a ve p robabilit y tendin g to 1. Replacing k with n 2 · [1 − o (1)], the last condition is the same as n ≥ tr(Σ) 2 | | | Σ | | | 2 F · 4 ǫ 1 c 2 [1 − o (1)] 2 . (19) Th us, for a give n c h oice of c 1 ( ǫ 1 ) in the statemen t of th e theorem, it is p ossible to c ho ose a p ositiv e c < (1 − √ a ) 2 so that inequalit y (18) is implied by the claimed suffi cient condition (14) for all large n . 3.5 P ow er comparison wit h SD W e no w giv e a sufficien t cond ition for our pr o cedure to b e asymptotically more p o w erful than SD. Theorem 3. In addition to the c onditions of The or em 2, assume that ( A6 ) holds. Fix a numb er ǫ 1 > 0 , and let c 1 ( ǫ 1 ) b e any c onsta nt strictly gr e ater than 4 ǫ 1 (1 − √ a ) 4 . If the c ondition n ≥ c 1 ( ǫ 1 ) tr(Σ) p 2 tr( D − 1 σ ) | | | R | | | F 2 (20) holds for al l lar ge n , then P [ARE ( β SD ; β RP ) ≤ ǫ 1 ] → 1 as n → ∞ . Remarks. Unlik e the co mparison agai nst CQ, the correlatio n matrix R pla ys a large role in determining relativ e p erformance of our test against SD. C orrelation en ters in t wo different wa ys. First, the F rob enius n orm | | | R | | | F is larger when the data v ariables are more correlated. Second, if Σ has a large num b er of small eigen v alues, then tr( D − 1 σ ) is v ery large wh en the v ariables are uncorrelated, i.e. when Σ is d iagonal. Letting U Λ U ⊤ b e a sp ectral decomp osition of Σ, with u i b eing th e i th column of U ⊤ , note that ( D σ ) ii = u ⊤ i Λ u i . When the data v ariables are correlated, the v ector u i will hav e man y nonzero comp onents, wh ic h will giv e ( D σ ) ii a con tribution from some of the larger eigen v alues of Σ , and prev en t ( D σ ) ii from b eing to o small. F or example, if u i is un iformly distributed on the un it s phere, as in Example 4 b elo w, then on a v erage E [( D σ ) ii ] = tr(Σ) /p . Therefore, correlation has the effect of mitigating the growth of tr( D − 1 σ ). Since the SD test statistic [6] can b e th ough t of as a v ersion of the Hotelling T 2 with a diagonal estimato r of Σ, the SD test statistic mak es no essen tial use of correlation structure. By con trast, our T 2 k statistic do e s tak e correlation into accoun t, and so it is un derstandable that correlated data enhance the p erformance of our test r elativ e to S D. 12 Example 3. Supp ose the correlation matrix R ∈ R p × p has a b lo c k-diagonal structure, with m iden tical blo c ks B ∈ R d × d along the diagonal: R = B . . . B . (21) Note that p = m · d . Fix a num b er ρ ∈ (0 , 1), and let B ha ve diagonal en tries equ al to 1, and off-diagonal ent ries equal to ρ , i.e. B = (1 − ρ ) I d × d + ρ 11 ⊤ , where 1 ∈ R d is the all-ones v ector. Cons equen tly , R is p ositi v e-defin ite, and we ma y consider Σ = R for s implicit y . S ince | | | B | | | 2 F = d + 2 ρ 2 d 2 , and | | | R | | | 2 F = m | | | B | | | 2 F , it follo w s that | | | R | | | 2 F = [1 + ρ 2 ( d − 1)] p . Also, in this example w e ha ve tr(Σ) = tr( D − 1 σ ) = p and p/d = m , which implies tr(Σ) p 2 tr( D − 1 σ ) | | | R | | | F 2 = p 1 + ρ 2 ( d − 1) ≤ m ρ 2 . (22) Under these conditions, we conclude that the sufficient cond ition (20) in Theorem 3 is satisfied when n gro w s at a faster rate than the num b er of blo cks m . Note too that th e sp ectrum of Σ consists of m copies of λ max (Σ) = (1 − ρ ) + ρ d and ( p − m ) copies of λ min (Σ) = 1 − ρ , wh ic h means when ρ is not to o sm all, the n umber of blo cks is the same as the num b er of dominant eigen v alues— rev ealing a p arallel with Example 1. F rom these observ ations, it is straigh tforward to c heck that this example satisfies assumptions ( A5 ) and ( A6 ) of Theorem 3. The sim ulations in Section 4.1 giv e an examp le where R has the form in line (21) and the v ariables corresp ond ing to eac h blo c k are highly correlated. Example 4. T o consider the p erformance of our test in a case where Σ is n ot constructed deter- ministically , Section 4.1 illustrates simulatio ns inv olving r andomly sele cte d matrices Σ for wh ic h T 2 k is more p o w erf u l than the tests of BS, CQ, and SD. Random correlation structure can b e generated b y samp ling the matrix of eigen v ectors of Σ f rom the uniform (Haar) d istribution on the orthogonal group, and then imp osing v arious deca y constraint s on th e eigenv alues of Σ. Additional d etails are pro v id ed in Section 4.1. Example 5. It is p ossib le to sh o w that the su ffi cien t condition (20) r e quir es non-trivial correlation in the h igh-dimensional s etting. T o see this, consider an example wh ere th e d ata are completely free of correlation, i.e., where R = I p × p . Then, | | | R | | | F = √ p , and Jensen’s inequalit y implies that tr( D − 1 σ ) ≥ p 2 / tr( D σ ) = p 2 / tr(Σ), giving tr(Σ) p 2 tr( D − 1 σ ) | | | R | | | F 2 ≥ p . Altoge ther, this sho ws if the data exh ibits very lo w corr elation, then (20) cann ot hold when p gro ws faster than n (in the pr esence of a uniform ly oriente d sh ift δ ). This is confirmed by the simulatio ns of Section 4.1. Similarly , it is sho w n in the pap er [6] that the SD test s tatistic is asymptotically sup erior to the CQ test statistic 11 when Σ is diagonal and δ is a deterministic v ector with all coordin ates equal to the s ame v alue. 11 Although the work in SD (2008) [6] w as published prior to th at of CQ (2010) [8], th e asymptotic p ow er function of CQ for problem (1) is the same as that of the metho d prop osed in BS (1996) [5], and S D offer a comparison against the metho d of BS. 13 The p ro of of Th eorem 3 mak es u se of concen tration b oun ds for Gaussian quad r atic forms, whic h are stated b elo w in Lemma 1 (see Ap p endix A for pr o of ). These b ound s are s imilar to results in the pap ers of Bec h ar, and Laur en t and Massart [20, 21] (c.f. Lemma 3 in App en d ix A), b ut ha ve error terms inv olving the sp ectral norm as opp osed to th e F rob enius norm, and hence Lemma 1 ma y b e of indep en den t int erest. Lemma 1. L et A ∈ R p × p b e a p ositive semidefinite matrix with | | | A | | | 2 > 0 , and let Z ∼ N (0 , I p × p ) . Then, for any t > 0 , P " Z ⊤ AZ ≥ tr( A ) 1 + t q | | | A | | | 2 tr( A ) 2 # ≤ exp − t 2 / 2 , (23) and for any t ∈ 0 , q tr( A ) | | | A | | | 2 − 1 , we have P " Z ⊤ AZ ≤ tr( A ) q 1 − | | | A | | | 2 tr( A ) − t q | | | A | | | 2 tr( A ) 2 # ≤ exp( − t 2 / 2) . (24) Equipp ed with this lemma, we can now p r o ve Th eorem 3 . Pr o of of The or em 3. W e pro ceed along the lines of th e p ro of of Theorem 2 . Let us defin e the ev ent of inte rest, E n : = ARE ( β SD ; β RP ) ≤ ǫ 1 , w here we recall ARE ( β SD ; β RP ) = nδ ⊤ D − 1 σ δ | | | R | | | F . √ n ∆ 2 k 2 with k = ⌊ n/ 2 ⌋ and y = 1 / 2. The even t E n holds if and only if n | | | R | | | 2 F 1 ǫ 1 ≤ ∆ 2 k k δ k 2 2 2 k δ k 2 2 δ ⊤ D − 1 σ δ 2 . (25) W e consid er the tw o factors on the r igh t hand s id e of (25) sep arately . By Prop osition 1, f or any constan t c ∈ (0 , (1 − √ a ) 2 ), the first factor ∆ 2 k k δ k 2 2 satisfies P c k tr(Σ) ≤ ∆ 2 k k δ k 2 2 → 1 as n → ∞ . (26) T urnin g to the second f actor k δ k 2 2 δ ⊤ D − 1 σ δ in line (25), w e note that δ / k δ k 2 is u niformly distributed on the u nit sph ere of R p , and so δ / k δ k 2 d = Z / k Z k 2 , where Z ∼ N (0 , I p × p ). Next, usin g Lemma 1, w e see that assump tion ( A6 ) im p lies Z ⊤ D − 1 σ Z tr( D − 1 σ ) → 1 in pr obabilit y . Since k Z k 2 2 /p → 1 almost surely , w e obtain the limit δ ⊤ D − 1 σ δ k δ k 2 2 p tr( D − 1 σ ) d = Z ⊤ D − 1 σ Z tr( D − 1 σ ) p k Z k 2 2 → 1 in p robabilit y . (27) 14 Consequent ly , f or any ˜ c ∈ (0 , 1), the r andom v ariable k δ k 2 2 δ ⊤ D − 1 σ δ is greater than ˜ c p tr( D − 1 σ ) with probabilit y tending to 1 as n → ∞ . Applying this observ ation to lin e (25) , and u sing the limit (26), w e conclude that P ( E n ) → 1 as long as the inequalit y n | | | R | | | 2 F 1 ǫ 1 ≤ c k tr(Σ) 2 ˜ c p tr( D − 1 σ ) 2 (28) holds for all large n . Replacing k with n 2 · [1 − o (1)] , the last condition is equiv alen t to n ≥ tr(Σ) p 2 tr( D − 1 σ ) | | | R | | | F 2 · 4 ǫ 1 c 2 ˜ c 2 [1 − o (1)] 2 . (29) Th us, for a giv en c hoice of c 1 ( ǫ 1 ) in the statemen t of the theorem, it is p ossible to c ho ose c < (1 − √ a ) 2 and ˜ c < 1 so that th e claimed sufficient cond ition (20 ) implies the inequalit y (28) f or all large n , wh ic h completes the pro of. 4 P erformance comparisons on real and syn thetic data In this section, we compare our pro cedure to a broad collecti on of comp eti ng metho ds on synt hetic data, illustr ating the effects of the d ifferen t f actors in v olve d in T heorems 2 and 3 . Sections 4.1 and 4 .2 consid er R OC curv es and calibration curv es resp ectiv ely . An example in volving h igh- dimensional gene expr ession data is studied in S ection 4.3. 4.1 R OC curv es on syn thetic data Using multiv ariate n orm al data, w e generated ROC curves (see Figure 3) in fiv e distinct parameter settings. F or eac h ROC curve, we sampled n 1 = n 2 = 50 data p oin ts from eac h of the distributions N ( µ 1 , Σ) and N ( µ 2 , Σ) in p = 200 dimens ions , and r ep eated the pro cess 500 times with δ = µ 1 − µ 2 = 0 u nder H 0 , an d 500 times with k δ k 2 = 1 u nder H 1 . F or eac h simula tion und er H 1 , th e shift δ was sampled as Z / k Z k 2 for Z ∼ N (0 , I p × p ), so as to b e d ra w n uniform ly from the u nit sphere, and satisfy assum ption ( A3 ) in Theorems 2 and 3. Letting U Λ U ⊤ denote a sp ectral decomp ositi on of Σ, we sp ecified the first four p arameter settings by c ho osing Λ to hav e a sp ectrum with slo w or fast deca y , and choosing U to b e I p × p or a randomly dra wn matrix from the uniform (Haar) distribution on the orthogonal group [22]. No te that U = I p × p giv es a diagonal co v ariance matrix Σ, wher eas a randomly c hosen U induces correlation among the v ariables. T o consider tw o rates of sp ectral deca y , w e selected p equally spaced eigen v alues λ 1 , . . . , λ p b et w een 10 − 2 and 1, and raised them to the p ow er 15 for fast deca y , and the p o we r 6 for slo w deca y . W e then added 10 − 3 to eac h eigen v alue to con trol the condition num b er of Σ , and rescaled them so that | | | Σ | | | F = q λ 2 1 + · · · + λ 2 p = 50 in eac h of the fi rst four settings (fixing a common amount of v ariance). Plots of the resulting sp ectra are sho wn in Figure 2. The fifth setting was sp ecified b y c ho osing the correlation matrix R to ha ve a b lo ck-diago n al structure, corresp ond ing to 40 groups of highly correlated v ariables. Sp ecifically , the matrix R wa s constructed to ha v e 40 id en tical blo c ks B ∈ R 5 × 5 along its diagonal, with the diagonal ent ries of B equal to 1, and the off-diagonal en tries of B equal to ρ := 1 1 . 01 (c.f. Example 3). Th e m atrix Σ was then form ed b y setting D σ = 1 ρ I p × p , and Σ = D 1 / 2 σ RD 1 / 2 σ . In addition to our r an d om pr o jecti on (RP)-based test, we imp lemen ted the metho ds of BS [5], SD [6], and CQ [8], w hic h are all designed sp ecifically for p r oblem (1) in the high-dimensional 15 0 50 100 150 200 0 5 10 15 Inde x Eigenv alue f ast decay slow deca y Figure 2. Plots of t wo se ts of eigenv alues λ 1 , . . . , λ p , with slow and fast decay , both satisfying | | | Σ | | | F = q λ 2 1 + · · · + λ 2 p = 50. T o interpret the num b er of no n-negligible eige nv alues, there are 2 9 eigenv a lues greater than 1 10 λ max (Σ) in the ca se of fast decay , and there are 65 eigenv alues greater than 1 10 λ max (Σ) in the case of slow decay . setting. F or the sake of completeness, we also show comparisons against tw o recen t non-parametric pro cedures that are based on kernel metho ds: maximum mean discrep an cy (MMD) [11], and kernel Fisher d iscriminan t analysis (KFD A) [12], as we ll as a test based on area-under-curve maximization, denoted T reeRank [9]. Overall , th e R OC cur v es in Figure 3 sho w that in eac h of the fiv e settings, either our test, or the test of SD, p erform the b est within this collection of pro cedu r es. On a qualitativ e level, Figure 3 reve als some striking differences b et ween our pro cedure and the comp eting tests. Comparing indep enden t v ariables v ersus correlated v ariables, i.e. p an els (a) and (b), with panels (c) and (d), w e see that the tests of SD and T reeRank lose p o w er in the presence of correlated data. Mean while, the R O C curve of our test is essen tially u nc h anged wh en passing fr om in dep end ent v ariables to correlated v ariables. Sim ilarly , our test also exhibits a large adv an tage wh en the correlation structure is p rescrib ed in a blo c k-d iagonal manner in panel (e). The agreemen t of this effect with T heorem 3 is explained in the remarks and examples after that theorem. C omp aring slo w sp ectral d eca y v ersus fast sp ect ral deca y , i.e. panels (a) and (c), with panels (b ) and (d), w e see that the comp eting tests are essen tially insensitive to the c h ange in sp ectrum, wh ereas our test is able to tak e adv an tage of lo w-dimensional co v ariance s tructure. The remarks and examples of T heorem 2 giv e a theoretical justifi cation f or this observ ation. It is also p ossible to offer a more quant itativ e assessmen t of the R OC curves in ligh t of Theorems 2 and 3. T able 1 summarizes appro ximate v alues of tr(Σ) 2 / | | | Σ | | | 2 F and tr(Σ) p 2 tr( D − 1 σ ) | | | R | | | F 2 from Theorems 2 and 3 in the five settings describ ed ab o v e. 12 The table shows that our theory is consisten t with Figure 3 in th e sense that the only settings for which our test yields an inferior ROC 12 F or the case of randomly selected Σ, the quantities are obtained as the av erage from 500 d ra ws. 16 F alse positiv e rate T r ue positiv e rate 0.0 0.2 0.4 0.6 0.8 1.0 0.0 0.2 0.4 0.6 0.8 1.0 RP SD CQ BS KFD A MMD T reeRank (a) d iagonal Σ , slo w deca y F alse positiv e rate T r ue positiv e rate 0.0 0.2 0.4 0.6 0.8 1.0 0.0 0.2 0.4 0.6 0.8 1.0 RP SD CQ BS KFD A MMD T reeRank (b) d iagonal Σ, fast deca y F alse positiv e rate T r ue positiv e rate 0.0 0.2 0.4 0.6 0.8 1.0 0.0 0.2 0.4 0.6 0.8 1.0 RP SD CQ BS KFD A MMD T reeRank (c) random Σ, slow d eca y F alse positiv e rate T r ue positiv e rate 0.0 0.2 0.4 0.6 0.8 1.0 0.0 0.2 0.4 0.6 0.8 1.0 RP SD CQ BS KFD A MMD T reeRank (d) r andom Σ, fast deca y F alse positiv e rate T r ue positiv e rate 0.0 0.2 0.4 0.6 0.8 1.0 0.0 0.2 0.4 0.6 0.8 1.0 RP SD CQ BS KFD A MMD T reeRank (e) b lo c k-diagonal correlati on Figure 3. ROC curves of several test statistics for five different settings of correlation s tructure and s p ectr al decay of Σ : (a) Diago nal cov ariance / slow decay , (b) Diagona l cov ariance / fas t decay , (c) Random cov ariance / slow decay , and (d) Random cov ariance / fast decay . (e) Blo c k-dia gonal correla tion. 17 curv e are those for w hic h the qu an tit y tr(Σ) p 2 tr( D − 1 σ ) | | | R | | | F 2 is drastically larger than n = 50 + 50 − 2 = 98. (In all of the settings where tr(Σ) 2 / | | | Σ | | | 2 F and tr(Σ) p 2 tr( D − 1 σ ) | | | R | | | F 2 are less than n , our test yields the b est R OC cur v e against the comp etitors.) Ho wev er, if the entries in the table are multiplied b y a choice of the constan t c 1 ( ǫ 1 ) > 4 ǫ 1 (1 − √ a ) 4 from Theorems 2 and 3, we s ee that our asymptotic conditions (14) and (20) are somewhat conserv ativ e at the finite sample lev el. C onsidering n = 98, the table sho ws that c 1 ( ǫ 1 ) would need to b e roughly equ al to 1.5 so that the inequalities (14 ) and (20) hold in all th e settings for which our metho d h as a b etter ROC cu r v e than th e relev an t comp etitor. In the b asic case that ǫ 1 = 1 and a = 0, w e ha ve 4 ǫ 1 (1 − √ a ) 4 = 4, whic h means that the constan t 4 ǫ 1 (1 − √ a ) 4 needs to b e impro ved b y roughly a factor of 4 / 1 . 5 ≃ 3 or b etter. W e exp ect that suc h impro vemen t is p ossible with a more refi ned analysis of the pro of of Prop osition 1. T able 1. Appro ximate v alues of the quantities tr(Σ) 2 / | | | Σ | | | 2 F and tr(Σ) p 2 tr( D − 1 σ ) | | | R | | | F 2 in the five parameter settings of the synthetic data exp eriments. Theorems 2 and 3 a ssert that these q uantit ies determine the relative p erformance of o ur test aga inst CQ and SD r esp ectively . diagonal Σ, diagonal Σ, random Σ, random Σ, blo ck-diagonal slo w decay fast decay slo w decay fast decay correlation (Thm. 2 vs. CQ) tr(Σ) 2 / | | | Σ | | | 2 F 54 25 54 25 41 (Thm. 3 vs. S D ) tr(Σ) p 2 tr( D − 1 σ ) | | | R | | | F 2 4 . 6 × 10 5 3 . 5 × 10 5 58 30 41 4.2 Calibration curv es on synthetic data Figure 4 con tains calibration plots resulting from the s im ulations d escrib ed in Section 4.1—showing ho w w ell the observ ed false p ositiv e r ates (FPR) of the v arious tests compare against the nomin al lev el α . (Note that these plots only reflect sim ulations un d er H 0 .) Ideally , wh en testing at lev el α , the observ ed FPR should b e as close to α as p ossible, and a th in diagonal grey line is used here as a reference for p erf ect calibration. Figures 4 (a) and (b) corresp ond r esp ectiv ely to the settings from Section 4.1 where Σ is diagonal, w ith a slo w ly d eca ying sp ectrum , and wh ere Σ h as random eigen- v ectors and a rapidly deca ying sp ectrum. In these cases the tests of BS, CQ, and SD are reasonably w ell-calibrated, and our test is nearly on top of the optimal diagonal line. T o consider robustness of calibration, we r ep eated th e simula tion from pan el (a), but replaced the sampling distribu tions N ( µ i , Σ), i = 1 , 2, with the m ixtures 0 . 2 N ( µ i + d 1 ,i , Σ) + 0 . 3 N ( µ i + d 2 ,i , Σ) + 0 . 5 N ( µ i + d 3 ,i , Σ), where 0 . 2 d 1 ,i + 0 . 3 d 2 ,i + 0 . 5 d 3 ,i = 0, and d 1 , 1 , d 2 , 1 , d 1 , 2 , d 2 , 2 w ere dra wn indep end ently and uni- formly fr om a sphere of radius | | | Σ | | | 2 F . The resu lting calibration plot in Figure 4 (c) sh o ws that our test deviates slightly from the diagonal in th is case, bu t th e calibration of the other three tests degrades to a m u c h more noticeable extent. Exp er im ents on other non-Gaussian distrib u tions (e.g. with hea vy tails) ga v e similar results, suggesting that the critical v alues of our pro cedure m a y b e generally more robu s t (see also the discussions of robu stness in S ections 2.1 and 4.3). 4.3 Comparison on high-dimensional gene expression data. The abilit y to detect gene sets ha ving different expression b et ween t wo typ es of conditions, e.g., b e- nign and malignant forms of a d isease, is of great v alue in many areas of biomedical researc h . In this 18 0.0 0.2 0.4 0.6 0.8 1.0 0.0 0.2 0.4 0.6 0.8 1.0 Nominal le vel α F alse positive r ate RP SD CQ BS (a) d iagonal Σ , slo w deca y 0.0 0.2 0.4 0.6 0.8 1.0 0.0 0.2 0.4 0.6 0.8 1.0 Nominal le vel α F alse positive r ate RP SD CQ BS (b) r andom Σ, fast deca y 0.0 0.2 0.4 0.6 0.8 1.0 0.0 0.2 0.4 0.6 0.8 1.0 Nominal le vel α F alse positive r ate RP SD CQ BS (c) mixture mo del . Figure 4 . Calibr ation plots on synthetic data under three different data-gener ating distributions. The grey line is a reference for optimal calibra tion. section, w e s tu dy our testing pro cedure in the con text of determining whether a set of p genes is dif- feren tially expressed b et ween tw o relativ ely small groups of patien ts of s izes n 1 and n 2 . T o compare the p erformance of our T 2 k statistic against comp etit ors CQ and SD in this typ e of app lication, we constructed a collection of 1680 d istinct t wo-sample pr oblems in the follo w in g manner, using data from three genomic stud ies of ov arian [23], my eloma [24] an d colorectal [25] cancers. First, we ran- domly sp lit the 3 datasets resp ectiv ely in to 6, 4, and 6 group s of appro ximately 50 patient s. Next, w e considered all p ossib le pairwise comparisons b et w een all sets of patient s on eac h of 14 biologi- cally meaningful gene sets fr om the canonical p ath wa ys of the database MSigDB [26]. Eac h gene set con tains b et w een 75 and 128 genes (with an av erage of 98 . 5). Since n 1 ≃ n 2 ≃ 50, our collection of t wo- sample problems is gen uin ely high-dimensional. Sp ecifica lly , we h a ve 14 × ( 6 2 + 4 2 + 6 2 ) = 504 problems un der H 0 , an d 14 × (6 × 4 + 6 × 4 + 6 × 6) = 1176 p roblems und er H 1 , w here w e assume that ev ery gene set is d ifferen tially expressed b et w een t wo sets of p atien ts with t wo differen t cancers, and that no gene s et is differential ly exp ressed b etw een t w o sets of p atien ts with the same cancer. Although it is conceiv able that this assumption could b e violated by the existence of v arious cancer subtypes, or differences b et we en original tissue samples, our initial step of r andomly splitting the three cancer datasets into subsets guards against th is p ossibilit y . With consideration to ROC curv es, the cancer datasets are dissimilar enough that BS, CQ, SD, and our metho d all pro duce p erfect R OC curves fr om the collection of tw o-sample problems (no H 1 case has a larger p-v alue th an any H 0 case). The hyp ergeometric test-based (HG) enric h men t analysis [27] often used by exp erimen talists on th is problem giv es a sub optimal area-under-curv e of 0 . 989. Examining the qualit y of calibration reve als an imp ortant difference b et w een our test and the comp etitors in this example. It is apparent in Figure 5 (a) that the cur v e for our pro cedure is closer to the optimal diagonal line (plotted in light grey) for most v alues of α than the comp eting cu r v es. F u rthermore, the lo wer-left corner of Figure 5 (a) is of p articular imp ortance, as practitioners are usually only interested in p-v alues lo wer than 10 − 1 . Figure 5 (b) is a zo omed plot of the low er-left corner, whic h sho ws th at the SD and CQ tests commit too many false p ositiv es at lo w thresholds. Again, in this regime, our pro cedure is closer to the diagonal and safely commits few er than the allo w ed n u m b er of false p ositiv es. F or example, when thr esholding p-v alues at 0 . 01, SD has an actual FPR of 0 . 03, and an even more excessiv e FPR of 0 . 02 wh en thr esholding at 0 . 001. Th e tests 19 0.0 0.2 0.4 0.6 0.8 1.0 0.0 0.2 0.4 0.6 0.8 1.0 Nominal le vel α F alse positiv e rate RP SD CQ BS HG (a) FPR for genomic data 0.00 0.02 0.04 0.06 0.08 0.10 0.00 0.02 0.04 0.06 0.08 0.10 Nominal le vel α F alse positiv e rate RP SD CQ BS HG (b) FPR for genomic data (zo om) Figure 5. (a) F alse p ositive rate a gainst p-v alue threshold on the g ene expr ession exp eriment of Section 4.3 for RP , BS, CQ, SD and the hypergeo metric (HG) enrichmen t test. (b) Zo om o n the p-v alue < 0 . 1 regio n. The optimal diagona l line is plotted in light gr e y . of CQ and BS do ev en w orse. The same thresholds on the p-v alues of our test lead to false p ositive rates of 0 . 008 and 0 resp ectiv ely . As discussed in Section 2.1, there are t wo prop erties of our testing pro cedure that could accoun t for the adv ant age of our FPR on the b oth the sy nthetic and real data. First, our test inh erits exact critical v alues for Gaussian data fr om the classical Hotell ing test, whereas th e comp eting tests of SD, CQ, and BS u s e th resholds based on asymptotic app r o ximations. Second, ev en if the p -dimens ional data is p o orly approxi mated b y N ( µ 1 , Σ) and N ( µ 1 , Σ), it is w ell kno wn that randomly pro jected data tends to b e nearly Gaussian [15]. Consequentl y , the use of a p r o jectio n that induces Gaussianit y , in conjunction w ith exact critical v alues for Gaussian data ma y explain the adv an tage of our test’s FPR. 5 Conclusion W e h a ve p rop osed a no vel testing pro cedur e f or th e t wo-sample test of means in high dimensions . This pro cedure can b e implemente d in a simple manner by first p ro jecting a dataset with a single randomly drawn matrix, and th en applying th e stand ard Hotelling T 2 test in the pro jected space. In addition to deriving an asymp totic p ow er fu nction f or this test, we ha v e provi ded inte rpretable conditions on the co v ariance and correlation matrices for achieving greater p o wer than comp eting tests in the sense of asymptotic relativ e efficiency . S p ecifically , our th eoretical comparisons sh o w that our test is well-suited to in teresting regimes wh er e th e d ata v ariables are correlated, or w here most of the v ariance can b e captur ed in a small num b er of v ariables. F u rthermore, in the realistic case of ( n , p ) = (100 , 200), these typ es of cond itions were s h o wn to corresp ond to fa vorable p erf or- mance of our test against sev eral comp etitors in ROC cur ve comparisons on syn thetic data. Finally , w e sho wed on real gene expression data th at our pro cedure was more reliable than comp etitors in terms of its false p ositiv e rate. Extensions of this work may includ e more r efined applications of random pro jection to other high-dimen s ional testing problems. 20 Ac kno wledgemen t s. The authors thank Sandrine Dudoit, Ann e Biton, and Pe ter Bic kel for helpful discussions. MEL gratefully ac kn o wledges the supp ort of the DOE CSGF F ello wship, und er gran t n u m b er DE-F G02-97ER253 08, and LJ J the su p p ort of Stand Up to Cancer. MJW w as partially supp orted by NSF grant DMS-0907632. 21 A Matrix and Concen tration Inequalities This app endix is devot ed to a num b er of matrix and concen tration inequalities u sed at v arious p oint s in our analysis. W e also p r o ve Lemma 1, whic h is stated in the main text in Section 3.5. Lemma 2. If A and B ar e squar e r e al matric es of the same size with A 0 and B = B ⊤ , then λ min ( B ) tr ( A ) ≤ tr( AB ) ≤ λ max ( B ) tr( A ) . (30) Pr o of. The up p er b ound is an immediate consequen ce of F an’s inequalit y [28, p.10], wh ic h states that any t wo symmetric matrices A, B ∈ R p × p satisfy tr( AB ) ≤ P p i =1 λ i ( A ) λ i ( B ) , where λ i +1 ( · ) ≤ λ i ( · ). Replacing A with − A yields the low er b ound. See the pap ers of Bec har [20], or Laurent and Massart [21] for p ro ofs of the f ollo wing concen tration b ound s for Gaussian qu adratic forms. Lemma 3. L et A ∈ R p × p with A 0 , and Z ∼ N (0 , I p × p ) . Then for any t > 0 , we have P h Z ⊤ AZ ≥ tr( A ) + 2 | | | A | | | F √ t + 2 | | | A | | | 2 t i ≤ exp( − t ) , and (31a) P h Z ⊤ AZ ≤ tr( A ) − 2 | | | A | | | F √ t i ≤ exp( − t ) . (31b) The follo wing result on the extreme eigen v alues of Wishart matrices is giv en in Da vidson and Szarek [29, Theorem I I .13]. Lemma 4. F or k ≤ p , let P ⊤ k ∈ R k × p b e a r ando m matrix with i.i.d. N (0 , 1) entries. Then, for al l t > 0 , we have P h λ max 1 p P ⊤ k P k ≥ 1 + p k /p + t 2 i ≤ exp( − pt 2 / 2) , and (32a) P h λ min 1 p P ⊤ k P k ≤ 1 − p k /p − t 2 i ≤ exp( − pt 2 / 2) . (32b) Pro of of Lemma 1. Note that the fu nction f ( Z ) := √ Z ⊤ AZ = k A 1 / 2 Z k 2 has Lipsc hitz constan t A 1 / 2 2 = p | | | A | | | 2 with resp ect to the Euclidean norm on R p . By the Gaussian isop erimetric inequalit y [30], we hav e for an y s > 0, P [ f ( Z ) ≤ E [ f ( Z )] − s ] ≤ exp − s 2 2 | | | A | | | 2 . (33) F r om the Poi ncar ´ e inequalit y for Gaussian measures [31], the v ariance of f ( Z ) is b ounded ab ov e as V ar [ f ( Z )] ≤ | | | A | | | 2 . Noting that E [ f ( Z ) 2 ] = tr( A ), w e see that the exp ectat ion of f ( Z ) is lo wer b ound ed as E [ f ( Z )] ≥ q tr( A ) − | | | A | | | 2 . Substituting this low er b ound into the concentrati on inequalit y (33) yields P f ( Z ) ≤ q tr( A ) − | | | A | | | 2 − s ≤ exp − s 2 2 | | | A | | | 2 . 22 Finally , letting t ∈ 0 , q tr( A ) | | | A | | | 2 − 1 , and choosing s 2 = t 2 | | | A | | | 2 yields the claim (24). The Gaussian isop erimetric inequalit y also implies P [ f ( Z ) ≥ E f ( Z ) + s ] ≤ exp − s 2 2 | | | A | | | 2 . By Jensen’s inequalit y , we hav e E [ f ( Z )] = E √ Z ⊤ AZ ≤ q E [ Z ⊤ AZ ] = p tr( A ) , from wh ic h we obtain P h f ( Z ) ≥ p tr( A ) + s i ≤ exp − s 2 2 | | | A | | | 2 , and setting s 2 = t 2 | | | A | | | 2 for t > 0 yields the claim (23). B Pro of of Prop ositio n 1 The pro of of Prop osition 1 is based on Lemmas 5 and 6, which we state and pro v e b elo w in Section B.1. W e then prov e P rop osition 1 in t wo parts, b y fi rst proving the lo we r b oun d (11a), and then the up p er b ound (11b) in sections B.2 and B.3 resp ectiv ely . B.1 Tw o auxiliary lemmas Note that the follo wing tw o lemmas only deal with th e randomn ess in the k × p matrix P ⊤ k , and they can b e stated w ithout reference to the s ample size n . Lemma 5. L et P ⊤ k ∈ R k × p have i.i.d. N (0 , 1) entries, wher e k ≤ p . Assu me ther e is a c onstant a ∈ [0 , 1) such that k /p → a as ( k , p ) → ∞ . Then, ther e is a se quenc e of numb ers c k → (1 − √ a ) 2 such that P 1 p tr( P k ( P ⊤ k Σ P k ) − 1 P ⊤ k ) ≥ k tr(Σ) c k → 1 as ( k , p ) → ∞ . Pr o of. By the cyclic prop ert y of trace and Lemma 2 , we ha ve 1 p tr P k ( P ⊤ k Σ P k ) − 1 P ⊤ k = 1 p tr ( P ⊤ k Σ P k ) − 1 P ⊤ k P k (34) ≥ 1 p tr ( P ⊤ k Σ P k ) − 1 λ min P ⊤ k P k . (35) F or a general p ositiv e-definite matrix A ∈ R k × k , Jensen’s inequalit y implies tr( A − 1 ) ≥ k 2 / tr( A ). Com b ining this with the low er-b ound on λ min ( P ⊤ k P k ) from Lemma (4) leads to 1 p tr P k ( P ⊤ k Σ P k ) − 1 P ⊤ k ≥ k 2 tr( P ⊤ k Σ P k ) · [1 − p k /p − t 2 ] 2 | {z } =:1 − r 2 ( t 2 ) , (36) with probabilit y at least 1 − exp( − pt 2 2 / 2). W e no w obtain a high-pr obabilit y up p er b ound on tr( P ⊤ k Σ P k ) that is of order k tr(Σ). First let Σ = U Λ U ⊤ b e a sp ectral decomp osition of Σ. W riting P ⊤ k Σ P k as ( P ⊤ k U )Λ( U ⊤ P k ), and recalling that the column s of P k are distribu ted as N (0 , I p × p ), we see th at P ⊤ k Σ P k is distributed as P ⊤ k Λ P k . Hence, we ma y w ork under the assu mption th at Σ and Λ are in terchangea ble. Let 0 < λ 1 ≤ · · · ≤ λ p 23 b e the eigenv alues of Σ , with λ i = Λ ii , and let Z ∈ R ( pk ) × 1 b e a concatenated column vec tor of k indep end en t and ident ically distributed N (0 , I p × p ) v ectors. Like wise, let Λ ∈ R pk × pk b e a diagonal matrix obtained by arr an ging k copies of Λ along the d iagonal, i.e. Λ : = Λ . . . Λ . (37) By consid ering the diagonal entries of P ⊤ k Λ P k , it is straigh tforw ard to v erify that tr( P ⊤ k Λ P k ) d = Z ⊤ ΛZ . Applying Lemma 3 to the qu adratic form Z ⊤ ΛZ , and noting that | | | Λ | | | F / tr(Λ) and | | | Λ | | | 2 / tr(Λ) are at m ost 1, we hav e tr( P ⊤ k Λ P k ) ≤ tr( Λ ) + 2 √ t 3 | | | Λ | | | F + 2 t 3 | | | Λ | | | 2 = k tr(Λ) + 2 √ t 3 √ k | | | Λ | | | F + 2 t 3 | | | Λ | | | 2 ≤ k tr(Λ) 1 + 2 √ t 3 √ k + 2 t 3 k | {z } =:1+ r 3 ( t 3 ) , (38) with probabilit y at least 1 − exp ( − t 3 ), giving th e desired up p er b ound on tr ( P ⊤ k Λ P k ). In ord er to com bine the last b ound with (36), defin e the ev ent E k : = 1 p tr P k ( P ⊤ k Σ P k ) − 1 P ⊤ k ≥ k tr(Σ) 1 − r 2 ( t 2 ) 1 + r 3 ( t 3 ) , and then observe that P ( E k ) ≥ 1 − exp( − pt 2 2 / 2) − exp( − t 3 ) by the union b ound. Cho osing t 2 = 1 /p 1 / 4 and t 3 = √ k , we ensu re that P ( E k ) → 1 as ( k , p ) → ∞ , and m oreo v er, th at 1 − r 2 ( t 2 ) 1 + r 3 ( t 3 ) → (1 − √ a ) 2 , whic h completes the pro of. Lemma 6. Assume the c onditions of L emma 5. Then for any C > (1+ √ a ) 2 (1 − √ a ) 2 , we have P " P k ( P ⊤ k Σ P k ) − 1 P ⊤ k F ≤ C √ k λ min (Σ) # → 1 as ( k , p ) → ∞ . (39) Pr o of. By the relation | | | A | | | 2 F = tr( A 2 ) for symmetric matrices A , and the cyclic prop ert y of trace, P k ( P ⊤ k Σ P k ) − 1 P ⊤ k 2 F = tr P k ( P ⊤ k Σ P k ) − 1 P ⊤ k 2 = tr ( P ⊤ k Σ P k ) − 1 P ⊤ k P k 2 . Letting ρ ( · ) d enote the sp ectral radius of a m atrix, we use the fact that | tr( A ) | ≤ k ρ ( A ) ≤ k | | | A | | | 2 for all real k × k matrices A (see [32, p. 297]) to obtain P k ( P ⊤ k Σ P k ) − 1 P ⊤ k 2 F ≤ k ( P ⊤ k Σ P k ) − 1 P ⊤ k P k 2 2 . 24 Using the sub multiplicativ e pr op ert y of | | |·| | | 2 t wice in succession, P k ( P ⊤ k Σ P k ) − 1 P ⊤ k 2 F ≤ k ( P ⊤ k Σ P k ) − 1 P ⊤ k P k 2 2 ≤ k ( P ⊤ k Σ P k ) − 1 2 2 · P ⊤ k P k 2 2 = k 1 λ 2 min ( P ⊤ k Σ P k ) · λ 2 max ( P ⊤ k P k ) . (40) Next, b y Lemma 4, we h av e th e b ound λ max ( P ⊤ k P k ) ≤ p · [1 + p k /p + t 4 ] 2 | {z } =:1+ r 4 ( t 4 ) , (41) with probabilit y at least 1 − exp( − pt 2 4 / 2). By the v ariational charact erization of eigen v alues, follo w ed by L emm a 4 , we ha ve λ min ( P ⊤ k Σ P k ) = inf k x k 2 =1 x ⊤ P ⊤ k Σ P k x ≥ inf k y k 2 =1 y ⊤ Σ y inf k x k 2 =1 k P k x k 2 2 = λ min (Σ) · λ min ( P ⊤ k P k ) ≥ λ min (Σ) · p · (1 − r 2 ( t 2 )) , (42) with probabilit y at least 1 − exp( − pt 2 2 / 2) , and r 2 ( t 2 ) defined as in line (36). Substituting the b ounds (41) and (42 ) in to line (40), we obtain P k ( P ⊤ k Σ P k ) − 1 P ⊤ k 2 F ≤ k λ 2 min (Σ) (1 + r 4 ( t 4 )) 2 (1 − r 2 ( t 2 )) 2 . (43) with probabilit y at least 1 − exp( − pt 2 2 / 2) − exp( − pt 2 4 / 2), w here w e ha ve used the un ion b ound. Setting t 2 = t 4 = 1 /p 1 / 4 , the prob ab ility of the ev ent (43) tends to 1 as ( k , p ) → ∞ . F urther- more, (1 + r 4 ( t 4 )) 2 (1 − r 2 ( t 2 )) 2 → (1 + √ a ) 4 (1 − √ a ) 4 , and so w e ma y tak e C in the statemen t of the lemma to b e an y constan t strictly greater than (1+ √ a ) 2 (1 − √ a ) 2 . B.2 Pro of of lo wer b ound (11 a) in Prop osit ion 1 By the assumption on the distr ibution of δ , w e may write δ / k δ k 2 as Z / k Z k 2 where Z ∼ N (0 , I p × p ). F u rthermore, b ecause k Z k 2 / √ p → 1 almost surely as n → ∞ , it is p ossible to replace δ / k δ k 2 with Z/ √ p , and work un der the assumption that ∆ 2 k k δ k 2 2 = 1 p Z ⊤ P k ( P ⊤ k Σ P k ) − 1 P ⊤ k Z . Noting that we 25 ma y take Z to b e indep end en t of P ⊤ k , the concen tration in equ alit y for Gaussian qu adratic form s in Lemma 2 giv es a lo wer b oun d on the conditional probabilit y P h ∆ 2 k k δ k 2 2 ≥ 1 p tr P k ( P ⊤ k Σ P k ) − 1 P ⊤ k − ψ ( t 1 ) P ⊤ k i ≥ 1 − exp( − t 1 ) , (44) where ψ ( t 1 ) := 2 √ t 1 p P k ( P ⊤ k Σ P k ) − 1 P ⊤ k F is a random err or term, and t 1 is a p ositiv e real num b er that ma y v ary with n . No w that th e randomn ess from δ has b een sep arated out in (44) , w e study the randomn ess from P ⊤ k b y defining the ev ent E n := n 1 p tr P k ( P ⊤ k Σ P k ) − 1 P ⊤ k − ψ ( t 1 ) ≥ L n o , (45) where L n is a real num b er whose dep enden ce on n will b e sp ecified b elo w. T o see the main line of argum en t tow ard the statemen t of the prop osition, we integ rate the conditional probabilit y in line (44) with r esp ect to P ⊤ k , and obtain P ∆ 2 k k δ k 2 2 ≥ L n ≥ [1 − exp( − t 1 )] P ( E n ) . (46) The rest of the pro of pr o ceeds in t wo parts. First, w e lo w er -b ound tr P k ( P ⊤ k Σ P k ) − 1 P ⊤ k p on an ev ent E ′ n with P ( E ′ n ) → 1 as n → ∞ . Second, w e upp er-b ound ψ ( t 1 ) on an eve n t E ′′ n with P ( E ′′ n ) → 1. Then we c h o ose L n so that E n ⊃ E ′ n ∩ E ′′ n , and tak e t 1 → ∞ so that (46) implies P (∆ 2 k k δ k 2 2 ≥ L n ) → 1 as n → ∞ . F or the fir st step of lo wer-boun ding tr P k ( P ⊤ k Σ P k ) − 1 P ⊤ k p , Lemma 5 asserts that there is a sequence of num b ers c n → (1 − √ a ) 2 suc h that the ev ent E ′ n := n 1 p tr P k ( P ⊤ k Σ P k ) − 1 P ⊤ k ≥ k tr(Σ) c n o (47) satisfies P ( E ′ n ) → 1 as n → ∞ . Next, for the second step of upp er-b ounding th e error ψ ( t 1 ), Lemma 6 guaran tees th at for an y constan t C strictly greater th an (1+ √ a ) 2 (1 − √ a ) 2 , the even t E ′′ n := n 2 p P k ( P ⊤ k Σ P k ) − 1 P ⊤ k F ≤ 2 C √ k pλ min (Σ) o (48) satisfies P ( E ′′ n ) → 1 as n → ∞ . No w, with consideration to E ′ n and E ′′ n , d efine the deterministic quantit y L n := k tr(Σ) h c n − √ t 1 2 C √ k tr(Σ) pλ min (Σ) i , (49) whic h ensur es E n ⊃ E ′ n ∩ E ′′ n for all c h oices of t 1 . Consequ en tly , P ( E n ) → 1, and it r emains to c ho ose t 1 appropriately so th at the probabilit y in line (46) tends to 1. I f we let t 1 = √ k p λ min tr(Σ) , then t 1 → ∞ b y assumption ( A5 ), and the second term ins id e the brack ets in line (49) v anishes as n → ∞ . Altogether, w e h a ve sho w n that L n tr(Σ) k → (1 − √ a ) 2 , an d P ∆ 2 k k δ k 2 2 ≥ L n → 1 . It f ollo ws that P ∆ 2 k k δ k 2 2 ≥ c k tr(Σ) → 1 for any p ositive constant c < (1 − √ a ) 2 , w hic h completes the pro of of the low er b ound (11a). 26 B.3 Pro of of upper b ound (11b) in P rop osition 1 As in the pro of of the low er b ound 11a in App en dix B.2, w e ma y reduce to the case that ∆ 2 k k δ k 2 2 = 1 p Z ⊤ P k ( P ⊤ k Σ P k ) − 1 P ⊤ k Z . Conditioning on P ⊤ k , Lemma 3 giv es a low er b ound on th e conditional probabilit y P h ∆ 2 k k δ k 2 2 ≤ 1 p tr P k ( P ⊤ k Σ P k ) − 1 P ⊤ k + ψ ( s 1 ) + φ ( s 1 ) P ⊤ k i ≥ 1 − exp( − s 1 ) , (50) where s 1 is a p ositive r eal n u m b er that may v ary with n , and we defin e ψ ( s 1 ) := 2 √ s 1 p P k ( P ⊤ k Σ P k ) − 1 P ⊤ k F , φ ( s 1 ) := 2 s 1 p P k ( P ⊤ k Σ P k ) − 1 P ⊤ k 2 . (51) Clearly , φ ( s 1 ) ≤ √ s 1 ψ ( s 1 ). Again, as in th e pro of of the lo wer b ound (11a), w e let U n denote an upp er b ound w h ose d ep endence on n will b e sp ecified b elo w , and we d efi ne an ev ent D n := 1 p tr P k ( P ⊤ k Σ P k ) − 1 P ⊤ k + (1 + √ s 1 ) ψ ( s 1 ) ≤ U n , (52) and int egrate with resp ect to P ⊤ k to obtain P ∆ 2 k k δ k 2 2 ≤ U n ≥ [1 − exp( − s 1 )] P ( D n ) . (53) Con tinuing along the parallel line of reasoning, w e up p er-b ound 1 p tr P k ( P ⊤ k Σ P k ) − 1 P ⊤ k on an ev en t D ′ n (defined b elo w) with P ( D ′ n ) → 1, and r e-use the upp er b ound of ψ ( s 1 ) on the even t E ′′ n (see line (48)), which w as sho wn to satisfy P ( E ′′ n ) → 1. Th en, w e c h o ose U n so that D n ⊃ D ′ n ∩ E ′′ n , yielding P ( D n ) → 1. Lastly , w e tak e s 1 → ∞ at an appropriate r ate so that the probabilit y in line (53) tends to 1. T o defin e the ev ent D ′ n for upp er-b ounding 1 p tr P k ( P ⊤ k Σ P k ) − 1 P ⊤ k , note that f or a symmetric matrix A with r an k k , J en sen’s inequalit y implies tr( A ) ≤ p k tr( A 2 ), r egardless of the size of A . Considering A = P k ( P ⊤ k Σ P k ) − 1 P ⊤ k , and p tr( A 2 ) = | | | A | | | F , we see that we ma y c h o ose D ′ n = E ′′ n from line (48), and on th is s et w e ha v e the inequalit y , 1 p tr( P k ( P ⊤ k Σ P k ) − 1 P ⊤ k ) ≤ √ k C √ k p λ min (Σ) , (54) with pr obabilit y tending to 1 as n → ∞ , as long as C is strictly greater than (1+ √ a ) 2 (1 − √ a ) 2 . In ord er to guaran tee the in clusion D n ⊃ D ′ n ∩ E ′′ n , we define U n := C k p λ min (Σ) 1 + ( s 1 + √ s 1 ) 2 √ k . (55) Note that k = ⌊ n/ 2 ⌋ implies k → ∞ as n → ∞ , so c ho osing s 1 = k 1 / 4 ensures that s 1 → ∞ and the second term inside the b rac ket s in lin e (55) v anishes. C om bin in g lines (53) and (55), we ha v e P ∆ 2 k k δ k 2 2 ≤ U n → 1 , and U n p λ min (Σ) C k → 1 . It follo ws that P ∆ 2 k k δ k 2 2 ≤ C k p λ min (Σ) → 1 for any constan t C strictly greater than (1+ √ a ) 2 (1 − √ a ) 2 , wh ic h completes the pro of of the u p p er b ound (11b). 27 References [1] Y. Lu, P . Liu, P . Xiao, and H. De ng. Hotelling’s T2 multi v ariate profiling for detec ting differen tial expression in m icroarrays. Bioinformatics , 21(14 ):3105 –3113, J u l 2005. [2] J. J. Go eman and P . B ¨ uhlm an n . Analyzing gene expression data in terms of gene sets: m etho d- ologic al issues. Bioinformatics , 23(8):9 80–98 7, Apr 2007. [3] D. V. D. Ville, T. Blue, and M. Unser. In tegrated wa v elet pro cessing and spatial statistical testing of fmri d ata. Neu r oimage , 23(4):1472 –1485, 2004. [4] U. Ruttimann et al. S tatistica l an alysis of f u nctional mri data in the w a v elet domain. IEEE T r ansactions on Me dic al Imaging , 17(2):142 –154, 1998. [5] Z. Bai and H. Saranadasa. Effect of high d imension: by an example of a t wo sample p roblem. Statistic a Sinic a , 6:311,329, 1996. [6] M. S. Sriv asta v a and M. Du. A test for the m ean v ector with f ew er observ ations th an the dimension. Journal of Multivariate A nalysis , 99:386 –402, 2008. [7] M. S . Sriv asta v a. A test f or the mean with few er observ atio ns than the dimension u nder non-normalit y . J ournal of M u ltivariate Analysis , 100:518 –532, 2009. [8] S. X. C hen and Y. L. Qin. A tw o-sample test for high-dimen sional data with applications to gene-set testing. Annal s of Statistics , 38(2):8 08–83 5, F eb 2010. [9] S. Cl ´ emen¸ con, M. Dep ec ker, and V a ya tis N. AUC optimization and the tw o-sample problem. In A dvanc es in N eur al Information Pr o c essing Systems (NIPS 2009) , 2009. [10] L. Jacob, P . Neuvial, and S. Dudoit. Gains in p ow er from stru ctured t w o-sample tests of means on graphs. T echnical Rep ort arXiv:q-bio/1009 .5173v1 , arXiv, 2010. [11] A. Gretton, K. M. Borgw ardt, M. Rasch, B. Sc h ¨ olko p, and A.J. Smola. A k ernel metho d for the t wo -sample-problem. In B. Sc h ¨ olkopf, J. P latt, and T. Hoffman, editors, A dvanc es in Neur al Information P r o c essing Systems 19 , pages 513–5 20. MIT Pr ess, C am br idge, MA, 2007. [12] Z. Harc h aoui, F. Bac h, and E. Moulines. T esting for homogeneit y with ke rnel Fisher discrim- inan t analysis. I n John C. Platt, Daphne Koller, Y oram S inger, and Sam T. Ro w eis, editors, NIPS . MIT Press, 2007. [13] R. J. Muirh ead. Asp e cts of Multivariate Statistic al The ory . John Wiley & Sons, inc., 1982. [14] S. S. V empala. The R andom Pr oje ction M etho d . DIMA CS Series in Discrete Mathematics and Theoretical Computer Science. American Mathematica l So ciet y , 2004. [15] P . Diaconis and D. F reedman. Asymptotics of graphical pr o jectio n pu rsuit. Annals of Statistics , 12(3): 793–8 15, 1984 . [16] A. W. v an der V aart. Asymptotic Statistics . Cam b ridge, 2007. [17] G. T ang and A. Nehorai. The stabilit y of lo w-rank matrix reconstruction: a c onstrained singular v alue view. arXiv:1006.40 88, submitte d to IEEE T r ans. Informat ion The ory , 2010 . 28 [18] I. Johnstone. On the distribution of the largest eigen v alue in p rincipal comp onents analysis. Anna ls of Statistics , 29(2): 295–3 27, 2001 . [19] L. W asserman . Al l of Non-Par ametric Statistics . Springer S eries in Statistics. Sp ringer-V erlag, New Y ork, NY, 2006. [20] I. Bec har. A Bern stein-t yp e inequalit y f or sto c hastic pro cesses of quadratic form s of Gaussian v ariables. T echnical Rep ort arXiv:0909.3 595v1, arXiv, 2009. [21] B. Laurent and P . Massart. Adaptiv e estimation of a quadratic fu nctional by mo del selection. Anna ls of Statistics , 28(5): 1302– 1338, 2000 . [22] G. W. S tew art. Th e Efficient Generation of Random Or th ogonal Matrices w ith an Ap plication to Condition Estimators. SIAM Journal on Numeric al A nalysis , 17(3):4 03–40 9, 1980 . [23] R. W. T othill et al. Nov el molecular s u bt y p es of s er ou s and endometrioid o v arian cancer link ed to clinical outcome. Clin Canc er R es , 14(16):519 8–5208, Aug 2008. [24] J. Moreaux et al. A high-risk signature for patient s with multiple m ye loma established f r om the molecular classification of human m yelo ma cell lin es. Haematol o gic a , 96(4):574– 582, Apr 2011. [25] R. N. Jorissen et al. Me tastasis-associated gene expr ession changes p r edict p oor outcomes in patien ts with duke s stage b and c colorectal cancer. Clin Canc er R es , 15(24):7642 –7651, Dec 2009. [26] A. Su bramanian et al. Gene set enrichmen t analysis: a kno wledge-based ap p roac h for inter- preting genome-wide expression p r ofiles. Pr o c. Natl. A c ad. Sci. USA , 102(43):1 5545– 15550, Oct 2005. [27] T. Beissbarth and T. P . Sp eed. Gostat: find s tatistically ov errepresent ed gene on tologies with in a group of genes. Bioinformatics , 20(9):1464 –1465, Jun 2004. [28] A. S. Lewis J. M. Borwein. Convex Analysis and Nonline ar Optimization The ory and Examples . CMS Bo okks in Mathematics. C anadian Mathematica l So ciet y , 2000. [29] K. R. Da vidson and S. J . Szarek. Lo cal op erator theory , random matrices, and Banac h spaces. in Handb o ok of Banach Sp ac es , 1, 2001. [30] P . Massart. Conc entr ation Ine qualities and Mo del Sele ction . Lecture Notes in Mathematics: Ecole d’Et´ e de Probabilit ´ es de Saint- Flour XXXI I I-200 3. Sp ringer, Berlin, Heidelb er g, 2007 . [31] W. Bec kner. A generalized Poincar ´ e inequalit y for Gaussian measur es. Pr o c e e dings of the Americ an Mathematic al So ciety , 105(2):39 7–400 , 1989. [32] R. Horn and C . Johnson. Matrix Analysis . Cam b r idge Univ er s it y Press, 22nd printing edition, 2009. 29
Original Paper
Loading high-quality paper...
Comments & Academic Discussion
Loading comments...
Leave a Comment