Network Methods for Pathway Analysis of Genomic Data
Rapid advances in high-throughput technologies have led to considerable interest in analyzing genome-scale data in the context of biological pathways, with the goal of identifying functional systems that are involved in a given phenotype. In the most…
Authors: Rosemary Braun, Sahil Shah
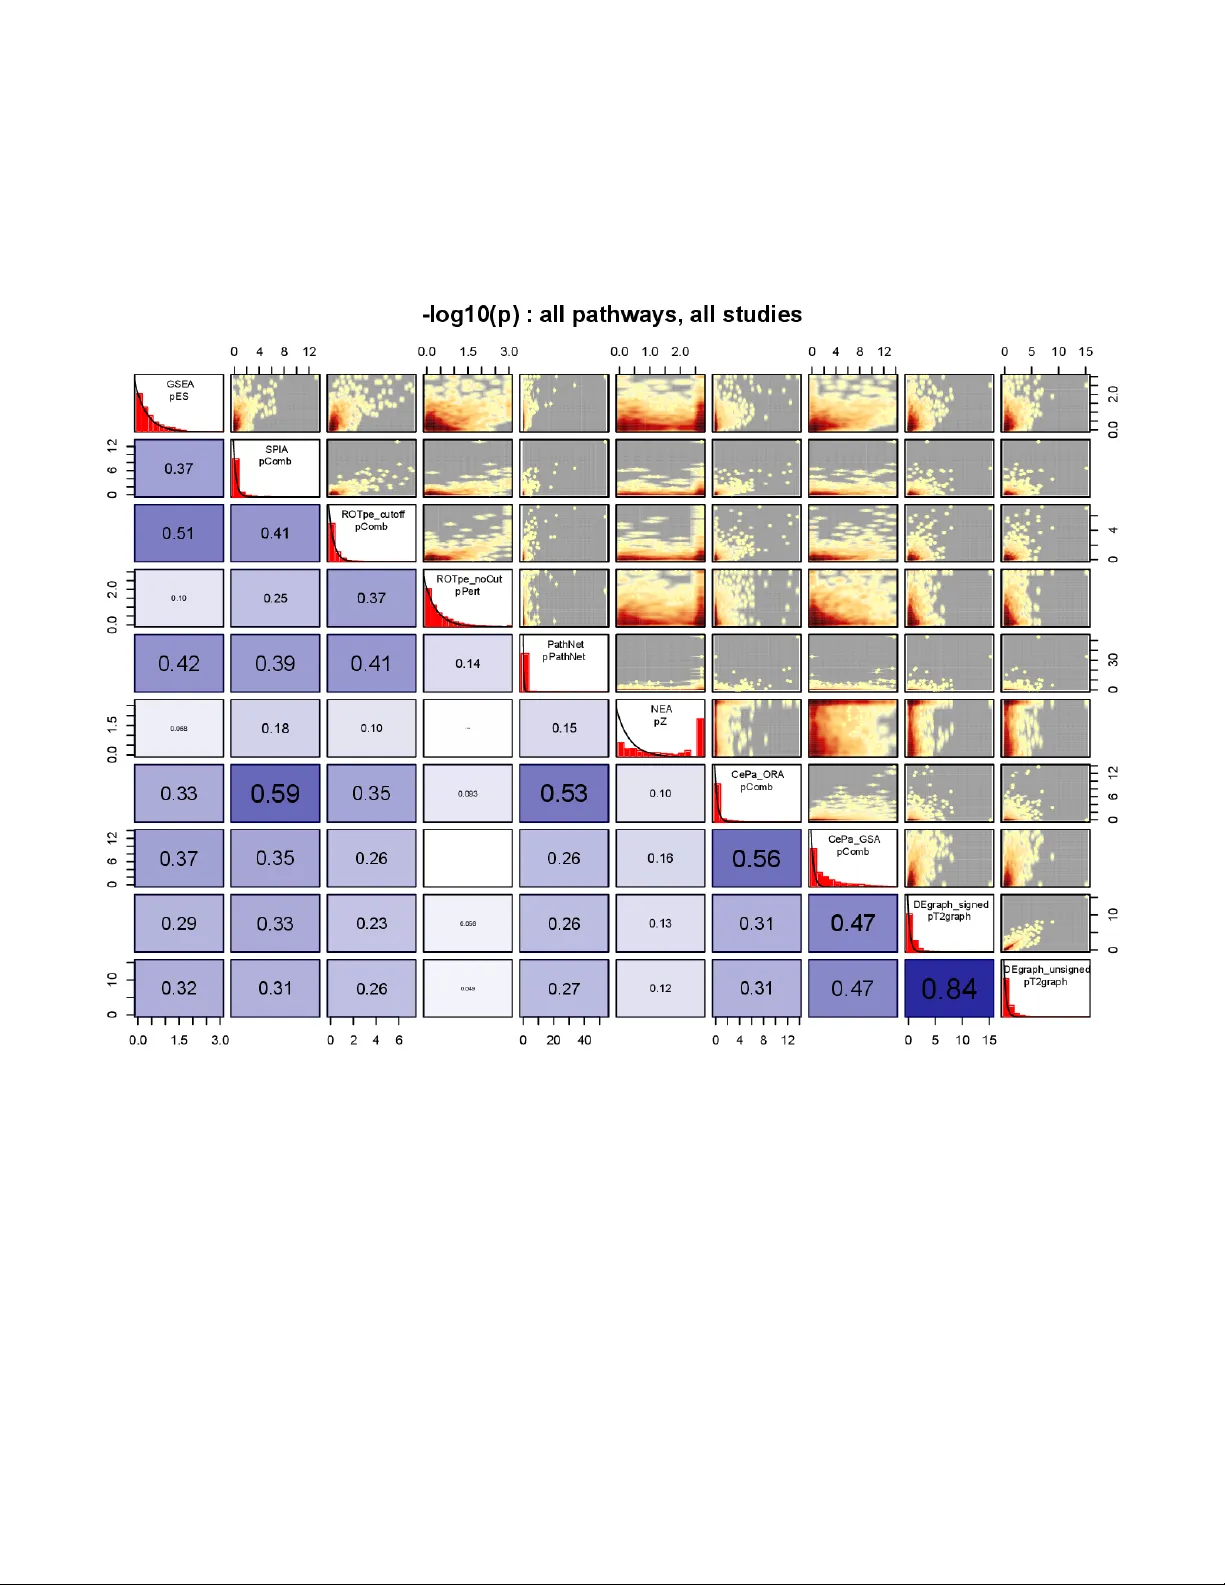
Net w ork Metho ds for P ath w a y Analysis of Genomic Data Rosemary Braun ∗ 1 and Sahil Shah 2 1 Biostatistics, F einb er g Scho ol of Me dicine and Northwestern Institute on Complex Systems 2 Engine ering Scienc es and Applie d Mathematics Northwestern University Abstract Rapid adv ances in high–throughput technologies ha ve led to considerable in terest in analyzing genome– scale data in the con text of biological path wa ys, with the goal of iden tifying functional systems that are in volv ed in a giv en phenot yp e. In the most common approac hes, biological pathw ays are mo deled as simple sets of genes, neglecting the netw ork of in teractions comprising the path wa y and treating all genes as equally imp ortan t to the path wa y’s function. Recen tly , a n umber of new methods hav e been prop osed to in tegrate path wa y top ology in the analyses, harnessing existing knowledge and enabling more n uanced mo dels of complex biological systems. Ho wev er, there is little guidance a v ailable to researc hes c ho osing betw een these metho ds. In this review, we discuss eight top ology-based metho ds, comparing their metho dological approac hes and appropriate use cases. In addition, we present the results of the application of these metho ds to a curated set of ten gene expression profiling studies using a common set of path wa y annotations. W e report the computational efficiency of the methods and the consistency of the results across metho ds and studies to help guide users in c ho osing a metho d. W e also discuss the c hallenges and future outlook for improv ed netw ork analysis metho dologies. In tro duction Mo dern high–throughput (HT) tec hnologies enable researc hers to mak e comprehensiv e measuremen ts of the molecular state of biological samples and ha ve yielded a wealth of information regarding the asso ciation of genes with specific phenotypes. Ho wev er, the complex and adaptiv e nature of living systems presents a significan t challenge to deriving accurate and predictive mechanistic mo dels from genomic data. Because cellular processes are go v erned b y net works of molecular in teractions, critical alterations to these systems may arise at different points y et result in similar phenotypes. At the same time, the adaptabilit y and robustness of living systems enables v ariations to b e tolerated. T ypical gene–lev el analyses of HT data, suc h as tests of differen tial expression, are unable capture these effects. As a result, there has b een gro wing interest in systems–lev el analyses of genomic data. P athw a y analysis tec hniques, which aim to examine HT data in the context of mec hanistically related gene sets, hav e been enabled by the gro wth of databases describing functional netw orks of in teractions. These include KEGG [1], BioCarta [2], Reactome [3], the NCI P athw a y In teraction Database (NCI-PID) [4], and InnateDB [5], amongst others. T o address the c hallenge of querying these databases using a common framew ork, markup languages such as KGML (used b y KEGG) and BioP AX hav e b een developed to describ e path wa ys using a consisten t format. In particular, the Biological Path wa y Exchange (BioP AX) pro ject now pro vides a unified vi ew of the data from man y of the abov e sources [6], including NCI-PID, Reactome, BioCarta, and WikiPath w ays. Ov er the past decade, a n umber of pathw a y analysis metho ds hav e b een dev elop ed to in tegrate this information with data derived from genomic studies [7]. These metho ds can b e broadly group ed in to tw o categories. The first category comprises analyses designed to iden tify pathw a ys in which significant genes are o verrepresen ted. A comprehensive review of these metho ds w as recently published Khatri &al [7]; examples ∗ Corresp onding author: rbraun@northwestern.edu 1 include h yp ergeometric tests, Gene Set Enric hment Analysis (GSEA) [8], and Ingenuit y Path wa y Analysis [9]. The second category of approac hes use dimension reduction algorithms to summarize the v ariation of the genes across the path wa y and test for path wa y–lev el differences without relying on single–gene asso ciation statistics. Examples include GPC-Score [10], P athifier [11], and PDM [12]. In con trast to enric hment analyses like GSEA, these metho ds are capable of identifying differences at the systems–level that would b e indetectable b y metho ds that rely upon single–gene asso ciation statistics, such as differences in the c o or dination of the expression of tw o genes. Despite these adv ances, the ma jorit y of these methods treat path w ays as simple lists of genes, neglecting the net w ork of in teractions codified in path wa y databases (cf. Fig 1) despite the fact that the imp ortance of path wa y net work structure to biological function has long b een appreciated. In [13], the authors presen ted systematic mathematical analysis of the top ology of metab olic netw orks of 43 organisms represen ting all three domains of life, and found that despite significant v ariation in the pathw a y comp onen ts, these net works share common mathematical prop erties which enhance error-tolerance. In [14], the authors compared the lethalit y of m utations in y east with the p ositions of the affected protein in kno wn path wa ys, and found that the biological necessity of the protein w as well modeled b y its connectivity in the net work. T o incorp orate kno wn interaction netw ork top ology with traditional pathw ay analyses, a multitude of approac hes hav e b een proposed for o verla ying gene–sp ecific data (either the ra w data itself or p -v alues deriv ed from gene–level statistical tests) onto path wa y netw orks [15–34]. Ho wev er, to date few comparisons b et w een them hav e been made. One recent review [35] attempted to compare three netw ork–based analyses (SPIA, P ARADIGM, and PathOlogist); unfortunately , the comparison w as stymied b y the metho ds’ disparate implemen tations and reference databases, and yielded inconclusiv e results. T o address this gap, we review eigh t top ology–based path wa y analysis metho ds [8, 15–26, 36]. While this is not a comprehensiv e review of all suc h algorithms, the metho ds we consider ha ve the common feature of b eing implemen ted in R and p ermitting the user to pro vide the pathw a y mo dels (such as those obtained from KEGG), th us allowing them to be compared directly without the issues encountered in [35]. Their free a v ailability from CRAN and BioConductor [37] also makes them the most p opular netw ork analysis metho ds in the bioinformatics and computational biology research comm unit y . Belo w, we briefly describ e each metho d and discuss its features and limitations. In addition, we also pro vide a comparison of these metho ds applied to a curated set of gene expression data from 10 ov arian cancer studies [38], using a common set of 247 KEGG pathw a ys. Using this data, we were able to ev aluate b oth the computational efficiency of the metho ds and the consistency of the results b et ween the metho ds and across the studies. The suite of data and scripts used in this comparison are av ailable from our website, enabling researchers to compare up dated versions and new net work analysis pac k ages using this common framew ork. Ov erview of Net w ork P athw ay Analysis Metho ds W e consider 8 p opular netw ork-based pathw a y analysis metho ds, described below. In the follo wing discussion, w e consider a path wa y to b e a netw ork of genes (no des), where edges represent a bio c hemical interaction. These edges may b e directed (e.g., gene i induces gene j , but not vice-versa) or signed (e.g., +1 for acti- v ation or induction, − 1 for repression or inhibition). Also, while the following metho ds w ere designed with differen tial expression analyses in mind, it should b e noted that most are flexible enough to accommo date other statistics or data t yp es (e.g., allele frequencies and χ 2 statistics from GW AS). A summary of the k ey features of the methods is given in T able 1. F or comparison, we also consider GSEA [8], a commonly–used path wa y analysis algorithm that do es not incorp orate net work topology . GSEA Gene Set Enrichmen t Analysis (GSEA) [8] is an extremely p opular metho d for detecting path wa ys that are enric hed for differentially expressed genes. In contrast to simple h yp ergeometric o v errepresentation analysis, GSEA do es not require a threshold for calling a gene significant, but rather considers the magnitude of the expression changes for all the genes in the pathw ay . Briefly , the algorithm ranks all assay ed genes according to the significance of the gene–level asso ciations, and computes a running sum statistic to test whether the genes on the pathw a y of interest tend to lie at the top of the ranked list (vs. a n ull h yp othesis of b eing randomly distributed). Significant pathw a ys are those whose genes o ccur higher in the rank ed list 2 than exp ected by chance, resulting in a sharply p eak ed running sum statistic. The size of this p eak, called the enrichmen t score (ES), is tested for significance by permuting the sample lab els and recalculating the test statistic to generate a null distribution. This pro cedure identifies pathw ays with an accumulation of differen tially expressed genes that are asso ciated with the phenotypes of interest. As its name suggests, ho wev er, GSEA treats pathw a ys as sets of genes, without incorp orating net work topology . SPIA Signaling Path w ay Impact Analysis (SPIA) [15], and the related ROn toT o ols/P athw a y-Express metho d describ ed b elo w, are metho ds designed to quantify the impact that differentially expressed (DE) genes ha ve on the downstream elemen ts of the pathw a y by taking into account the n umber of DE genes, the magnitude of the expression differences, and the direction and t yp e of edges in the pathw a y . In SPIA, a “p erturbation factor” is computed for each gene g , defined as the w eighted sum of the expression differences of all the DE genes whic h are direct upstream parents of g in the net work. The weigh ting co efficien ts are a function of b oth the n umber of outgoing edges of the parent no de, as w ell as the type of edge (p ositive for induction/activ ation, negative for repression/inhibition) connecting the parent to the child no de g . The total accum ulated p erturbations of all genes in the path wa y is compared against a null distribution obtained b y rep eatedly randomizing the observed expression differences to different genes in the netw ork. SPIA com bines the resulting p erturbation p v alue, p. PER T, with the p v alue from the simple hypergeometric ov errepresen ta- tion test for the pathw a y , p. ORA, using Stouffer’s weigh ted- z method [39], yielding a path wa y graph p v alue ( p. Com b). Thus, a path wa y with DE genes at its entry point could b e deemed more significan t than one with DE genes further downstream, ev en if the fold c hanges are smaller. Although SPIA is describ ed in the context of differen tial gene expression, the metho d can in principle be used with an y type of gene-level asso ciation statistic (e.g., hazard ratios for surviv al, minor allele frequencies of SNP v ariants, or multiv ariate F or T 2 statistics testing asso ciation across more than tw o phenotypes). Ho wev er, SPIA requires that the user set a significance threshold to select the genes that are considered in the analysis. R On toT o ols/Path wa y Express ROn toT o ols/Path wa y Express (ROT/pe) [16–18] is a refinement up on SPIA. In SPIA, a gene significance threshold is used to select DE genes, and the DE genes are treated equally , while those that are not DE are not considered in the analysis. T o enable a more nuanced analysis, R OT/p e w eights the change in expression of each gene by the significance of the gene level statistics. As a result, marginally significan t c hanges in expression are given less weigh t than a highly significan t changes of the same magnitude. F urthermore, this metho d permits a “cut-off free” analysis that assigns non-significan t genes a lo w weigh t rather than aggressiv ely discarding them as non-DE. When no cutoff is used, ROT/pe do es not calculate the o verrepresen tation significance p. ORA, but simply rep orts the significance of the p erturbation (obtained, as in SPIA, by randomly p erm uting the gene expression differences across the net work). P athNet PathNet [19] incorp orates pathw ay top ology b y computing b oth a “direct” and “indirect” asso cia- tion statistic for eac h gene. The “direct” statistic is the result of a single–gene asso ciation test (e.g., a classical t test of differential expression). Once these are obtained, PathNet then computes “indirect” statistic for eac h gene, defined as the sum of the − log 10 p v alues of the direct associations for all the gene’s neigh b ors in the path wa y . The direct and indirect scores for eac h gene are summed and tested for significance by p erm uting the direct evidence statistic across all genes in a “global” net work formed by merging pathw a ys with common genes. The resulting gene–lev el p v alues are then thresholded for significance, and the pathw a y is tested for enric hment using a h yp ergeometric test. Lik e SPIA and ROT/pe, PathNet can accommo date a v ariety of gene–lev el metrics and is not restricted to simple differen tial expression. In contrast to SPIA and R OT/p e, PathNet considers all p ossible edges in the global netw ork, not simply those confined to a single path w ay , enabling it to find pathw a ys that are strongly affected through indirect links. Also in con trast to b oth SPIA and ROT/pe, P athNet do es not distinguish b et w een inhibitory and activ ating edges. P athNet’s use of thresholding for testing pathw a y significance is also a drawbac k, but could easily b e ov ercome by using a GSEA-like pro cedure instead of the hypergeometric test. 3 NEA As in P athNet, Netw ork Enric hment Analysis (NEA) [20, 21] also attempts to incorporate information from the “global” net w ork of pathw ays formed by merging the common genes in the individual functional path wa ys represen ted in the database, but uses a different approach to quan tify enrichmen t. Rather than coun ting significant no des (i.e. genes) in eac h pathw a y of in terest, NEA counts the n umber of edges in the path wa y connecting to a significance gene. This is done by summing the degree (i.e., n umber of edges) for each DE gene on the pathw a y and amongst its neigh b ors, subtracting out links from genes that do not connect to a gene in the pathw a y . Genes outside the path wa y will th us con tribute to the path wa y’s score; connections b et ween tw o DE genes on the pathw a y are coun ted twice (once p er each gene). NEA assess the significance of this statistic b y randomly rewiring the top ology of the “global” netw ork, conditioned on preserving the degree of each node. Lik e all the foregoing metho ds, any gene-level statistic of in terest may b e used as an input to NEA. Ho wev er, NEA as implemen ted is dep enden t up on setting cutoffs for gene significance in order to count the n umber of DE links, making the results susceptible to noise induced b y thresholding. It ma y b e of interest to inv estigate p ossible refinements of NEA using a weigh ting scheme rather than a strict binary cutoff. Also, NEA as currently implemented do es not consider the direction of the edges in the graph, but rather treats all edges as bi-directional. Direction-based refinements to NEA ma y thus also b e of in terest. CeP a All of the abov e methods impro ve upon GSEA b y not only considering eac h gene’s differen tial expression, but also exa mining the differen tial expression of its nearest–neigh b ors (“perturbations” from upstream genes in SPIA and ROT/pe, “indirect evidence” in P athNet, num ber of DE links in NEA). The resulting path wa y scores thus represen t an accumulation of lo c alize d effects within the pathw a y . In con trast to these approaches, CePa [22, 23] attempts to take a broader view of the netw ork by incorp orating graph cen trality measures in to the statistics. Briefly , the “centralit y” of a no de in a graph is a measuremen t of its relativ e imp ortance to the rest of the net work [40]. One simple cen trality measure is the no de’s degree: the num b er of edges connecting to that no de. On a directed graph, the in–/out–degrees, whic h are the coun ts of a no de’s incoming/outgoing edges resp ectiv ely , are also useful for quantifying how susceptible/influen tial a no de is. “Bet weenness,” another cen trality measure, quan tifies how frequen tly the shortest path b et ween an y tw o no des go es through the no de of in terest. CeP a uses the cen trality measures of the genes in the net work to p erform either an “o ver represen tation analysis” (CePa-ORA) or a “gene set analysis” (CeP a-GSA). In CeP a-ORA, the user sp ecifies a set of sig- nifican t genes (based on some pre-determined significance threshold); CeP a-ORA then sums the centralit y measures of the significant genes and calculates the significance of the sum by randomly selecting a new set of “significant” genes based on the prop ortion of truly observed significan t genes in the net work. That is, CeP a-ORA tests whether significan t differen tial expression is more likely to be high–centralit y no des in the path wa y than would be exp ected by c hance. The CePa–GSA v arian t incorporates the gene–level statistics (suc h as the t statistic from a test of differ- en tial expression) rather than using only the list of significant genes. CePa-GSA m ultiplies the gene statistics b y the gene cen trality measures. In this wa y , CeP a directly weigh ts each gene’s statistic b y its imp ortance in the net w ork, reflecting the observ ation made by Jeong and others [14] that alterations to more cen tral genes ha ve a more profound impact on an organism. CePa–GSA then aggregates the weigh ted gene–lev el statistics in to a single path wa y–lev el statistic b y taking, for example, their maximum or median. As implemented in the CePa pack age, the default gene–level statistic is the absolute v alue of the t statistic from a tw o–sample test of differen tial expression, and the default pathw ay–lev el statistic is the mean of the cen trality–w eigh ted gene–lev el statistics. The significance of this pathw a y–level score is calculated b y p erm uting the sample lab els of the the gene expression matrix, recomputing the gene–level statistics with the p erm uted samples, and then recomputing the pathw a y statistic. The resulting p v alue quantifies the differences in centralit y–weigh ted gene expression that are asso ciated with the phenotypic differences of in terest. While in principle b oth CePa-ORA and CeP a-GSA can use an y gene–lev el statistics, at present the implemen tation of CePa-GSA is such that the user is confined only to tw o–sample t –tests of differential expression. If, for instance, the outcome of in terest is surviv al (yielding hazard ratios for each gene), or if 4 differences across m ultiple conditions or phenotypes are b eing assessed with a multiv ariate linear model or ANO V A, or if the input data is categorical rather than contin uous (such as allele frequencies from SNP GW AS studies), the user has no choice other than to precompute the gene–level p v alues and use the thresholded CeP a-ORA analysis rather than the more nuanced CePa-GSA approac h. It w ould b e of considerable interest to address this limitation b y providing a more flexible in terface to CePa-GSA that p ermits user–defined mo dels. In addition, while CePa provides a very rich view of the centralit y–weigh ted path wa y analysis, the v ariety of statistics it obtains (one per each of 6 centralit y metrics considered) and the diverse options for path wa y aggregation (max, mean, etc., as well as the option for user–defined function) can make the results difficult to in terpret. Finally , it may also b e argued that linear cen trality–w eigh ting (as opp osed to, e.g., w eighing by a p o w er function of the cen trality) is an arbitrary c hoice that ma y influence the results. DEGraph An alternativ e top ology–w eighting approach is implemen ted in DEGraph [24], whic h uses a m ultiv ariate Hotelling T 2 test to iden tify pathw a ys in which a significant subset of genes are differentially expressed. In DEGraph, both the standard T 2 and a net work–smoothed graph T 2 are computed. Based on the intuition that tw o genes connected in the net work should b eha ve in a correlated fashion, DEGraph’s net work–smoothing filters the gene expression differences by k eeping only the first few comp onen ts of its pro jection onto a basis defined b y the graph Laplacian [41]. Sp ectral decomp osition of the pathw ay’s graph Laplacian encapsulates the geometry of the netw ork top ology at progressiv ely finer scales, and the pro jection of the gene expression shifts on to the coarsest comp onents may b e analogized to keeping only the low est frequency F ourier comp onen ts of a function. These net work–smoothed shifts are then tested using the Hotelling T 2 test. Unlik e CeP a, DEGraph provides a means to obtain path w ay–wide top ology–w eighted scores without making arbitrary choices ab out the w eighting. In particular, the mathematical and statistical prop erties of graph Laplacian sp ectra are w ell–c haracterized [41, 42] and can be precisely related to the dynamical prop erties of the net w ork [43, 44], making this approac h more justifiable than the w eigh ting scheme prop osed in CePa. How ev er, this sp ectral approach is necessarily confined to operate only on connected comp onents, p osing problems for pathw ays comprising several disjoin t subgraphs (e.g., tw o sub-pro cesses connected by a exogenous stimulus that is not represented in the gene netw ork). In such cases, the pathw a y will ha ve several T 2 statistics—one for each connected comp onen t—leaving a choice as to whether the path wa y p v alue should b e defined by that of its largest subnetw ork or some combination of all its subnetw orks. In addition, the use of the Hotelling T 2 test requires that the gene–level statistics follow a multiv ariate normal distribution, whic h limits the t yp es of data and analyses to whic h DEGraph could b e applied. In consequence, the DEGraph implemen tation is only capable of testing pathw a y–wide multi–gene differen tial expression b et ween t wo sample classes. Recen tly , a more flexible spectral decomp osition metho d has been prop osed [31, 45], but whic h relies up on computationally in tensive p erm utation tests. It w ould b e highly in teresting to extend DEGraph to accommo date other data types and statistical tests. T op ology GSA Although analyzing the data at the path wa y level can identify imp ortan t systems–lev el c hanges that would b e missed by single–gene analyses, the path wa y–lev el findings can b e difficult to in- terpret and v alidate for large netw orks. While identifying functionally significant pathw ays is the goal of systems biology , it is often necessary to identify sp ecific features within those netw orks that can b e tar- getted exp erimen tally . T o facilitate the discov ery of targetable sets of genes and interactions, a num b er of techniques ha ve b een prop osed to search for significant submo dules within pathw a ys. One such metho d is T op ologyGSA [25, 26], whic h uses a Gaussian net work mo del to identify significant subnetw orks in the graph. T op ologyGSA begins b y transforming the directed pathw a y netw ork graph in to its so–called “moral” graph by connecting all “paren t” no des of a vertex and removing the edge directionalit y . The moral graph is then decomp osed in to cliques: subsets of no des in the graph for which ev ery pair is connected by an edge (triangles are the simplest cliques; a clique of four no des has 6 edges; a clique of five has 10; etc). Each clique is then tested for differen tial expression b y mo deling the expression of the genes in the net w ork as Gaussian random v ariables, sub ject to the class–conditional cov ariance betw een the clique’s genes for eac h phenot yp e. If no significan t cliques are found, edges are iteratively added and the statistics recomputed. The result is the iden tification not only of pathw a ys with significan t gene expression differences, but of specific connected 5 subgraphs within the pathw a ys that can then b e in ve stigated in greater detail. An app ealing feature of T op ologyGSA is the use of gene cov ariance in the analysis. Despite the fact that genes often exhibit considerable correlations in expression, most pathw a y analyses consider the genes as indep enden t v ariables. Ho wev er, T op ologyGSA’s approac h of conditioning the clique statistics on phenotype– sp ecific cov ariances also introduces a limitation: like DEGraph, it can only b e used if the outcome of in terest can b e dic hotomized. Moreo ver, while testing cliques of a triangulated graph to detect significan t subnet w orks is an in teresting idea, it has a v ery serious dra wback: finding all maximal cliques in a graph is an N P -hard problem, meaning that a solution is not guaranteed in polynomial time. In particular, a brute-force search for a clique of size k in a graph with n no des has a computational complexit y of O ( n k k 2 ) . While appro ximations can b e made, a recen t proof b y Chen [46] demonstrated that the clique problem cannot b e solved in less than f ( k ) n o ( k ) time for any function f and linear function o ( k ) . As the size of the pathw a y n gro ws, the size of the submo dule cliques k also increases, and time needed to searc h for those submo dules increases exponentially . This means that for larger pathw a ys—often the v ery ones for whic h submodule detection is desirable—the problem T op ologyGSA attempts to solv e ma y b e intractable. Because T op ologyGSA iterativ ely adds edges as part of the significance computation, the exp onen tial cost is incurred on each iteration. A far more efficient approac h w ould b e to use sp ectral metho ds to iden tify communities of no des [41, 42, 47, 48] rather than articulating all maximal cliques. Suc h an approach, whic h would be closely related to y et still distinct from the sp ectral used in DEGraph [24] and Path wa y/PDM [31, 45], would p ermit the identification of connected subnets of significan t genes far more efficien tly than solving the clique problem. Ev aluating the Performance of Net w ork Analysis Metho ds As described ab o ve and shown in T able 1, these netw ork analysis metho ds ha v e differen t features that mak e them better suited to some use cases than others. Nevertheless, for man y common analyses, most of these approac hes could b e applied, and the user is faced with a c hoice b et ween several promising metho ds. Unfortunately , b enc hmark tests to systematically ev aluate the performance of net work analysis metho ds remain lac king, limiting the comm unity’s abilit y to compare metho ds. The dev elopmen t of a systematic ev aluation framew ork faces a n um b er of challenges. First, the metho ds themselv es ha ve highly disparate implemen tations, often using different databases and path wa y semantics, making them difficult to compare in a consistent wa y . F or example, P athOlogist [32, 33] treats pathw a ys as bipartite graphs of genes and interactions in con trast to the gene–mode net works considered b y the metho ds describ ed abov e, and is restricted in its implementation to pathw a ys from the NCI/PID [4] database. Secondly , it is not clear what the “gold standard” for these metho ds should b e. Unlike machine learning and net work inference problems whic h are readily tested against sim ulated b enc hmark data with kno wn solutions (suc h as the in-silico data suites used in the DREAM Challenges [49]), there is no agreement on what the “correct” results of these analyses would be. T o provide in tuition regarding the p erformance of the metho ds review ed here, w e systematically applied them to a curated suite of gene expression data from 10 ov arian cancer studies [38] using a common set of pathw a y definitions obtained from the KEGG database. The goal of these tests w as not only to supply pro visional guidance ab out the relative p erformance of the metho ds, but also to suggest a strategy for a testing framew ork for path wa y analysis metho ds. Metho ds Our approach is motiv ated by the observ ation that systems–level analyses improv e the concordance of results b et w een different studies of the same phenot yp e [45, 50]. Although multiple studies of the same phenotype ma y yield very different lists of significant genes, path wa y analyses tend to to show m uch greater agreement. This effect is not unexp ected, considering the complexit y of biological systems [51] and the noisiness of HT data; individual disease–asso ciated genes may b e detected in some studies but miss the significance threshold in others. How ever, if a pathw a y is functionally related to the disease, w e ma y reasonably exp ect to detect its asso ciation across multiple studies, ev en if the sp ecific genes contributing to its significance v ary from one study to the next. 6 This observ ation leads to the following conjectures: If a specific pathw ay is functionally related to a particular phenotype, w e exp ect that some manifestation of its in volv ement will b e present in the data for all studies of that disease, and that an accurate and sensitive net work analysis approach will detect those signals consistently across the studies. A p o or net work analysis method, on the other hand, will yield results that are strongly influenced by noise in the data, and hence will detect path w ays that are particular to eac h study rather than the common biological signal. On the basis of this conjecture, we use the cross–study concordance of each metho d’s results to measure its ability to detect a common (and presumably “true”) signal in each of the studies. Ov arian Cancer Data F or the purp oses of our analysis, we used gene expression and clinical information from curatedOv arian- Data [38], an expert–curated collection of uniformly prepared microarra y data and documented clinical metadata from 23 o v arian cancer studies totalling 2970 patients. The curatedOv arianData pro ject w as de- signed to facilitate gene expression meta-analysis as well as softw are developmen t. By pro viding a consisten t represen tation of data that has b een pro cessed to ensure comparability b et ween studies, the pack age enables users to immediately analyze the data without needing to reconcile differen t microarra y technologies, study designs, expression prepro cessing metho ds, or clinical data formats. Because several of the metho ds under consideration were limited to tw o–sample comparisons, we selected data sets with sample classes that could b e meaningfully dichotomized. Since the v ast ma jorit y of the samples came from patients with stage I II cancers, tumor/normal and stage–based comparisons w ere not feasible; instead, we c hose to compare lo w– and high–grade o v arian serous carcinomas. These grades hav e distinct histological features, molecular c haracteristics, and clinical outcomes [52, 53]. Low–grade serous carcinomas t ypically ev olve slowly from adenofibromas, acquiring o ver time frequen t m utations to KRAS, BRAF, or ERBB2 genes, but not TP53 m utations. In contrast, high–grade serous carcinomas are characterized b y TP53 m utations, often without mutations to KRAS, BRAF, or ERBB2. They arise from unknown precursor lesions, progress rapidly , and hav e worse clinical outcomes. F or this analysis, we selected studies with a minim um of 15 high– and low–grade serous carcinomas and 1000 genes assay ed, keeping only the patients who fell in to those categories and who had surviv al data. 10 of the 23 a v ailable studies met these criteria. The study accession num b ers and sample coun ts are given in T able 2. The microarra y data was filtered to keep only the genes common to all 10 studies; no other filtering was done. This resulted in 7680 genes common to all 10 studies. T o obtain the gene–level statistics required by sev eral of the analyses, the R limma pack age [54] was used. log 2 fold changes were used for the magnitude of differential expression when required; the significance of the asso ciation was quantified using the p v alue for the empirical Bay es estimated t statistic [54]. Where thresholds for significance w ere needed, the 0 . 05 most significan t genes w ere selected. (NB, this corresp onds to the 0 . 05 quan tile of significance, not p = 0 . 05 . Because the studies v aried considerably in their sample sizes, and hence pow er, w e chose to use a quan tile–based threshold rather than a p v alue threshold to render them comparable. While the p v alue for the 0 . 05 quan tile v aried from study to study , in all cases this corresp onded to p 0 . 05 .) Net w ork Mo dels In order to ensure that eac h of the eight methods tested used a common, comparable set of pathw ay defini- tions, w e created the pathw ay annotation ob jects required for eac h metho d by hand from a fresh download of the KEGG path wa y database [1]. The KEGGgraph R pac k age [55] w as used to obtain the pathw ay K GML files for 247 human path wa ys. The KGML files w ere first pro cessed into R graphNEL ob jects for use by ROn- toT o ols/P athw a yExpress (R OT/p e), T op ologyGSA,and DEGraph. The graphNEL ob jects w ere then used to to generate the lists of genes, edges, and adjacency matrices v ariously required b y GSEA, P athNet, NEA, and CeP a. The path.info data used b y SPIA w as also generated from the KEGG graphNEL ob jects and written to disk as required by SPIA. In this wa y , we ensured that the set of pathw a ys considered by each metho d would b e directly comparable to eac h other. The complete set of path wa y annotation ob jects for all the metho ds, along with an R script to generate a complete set of up dated mappings from a fresh KEGG 7 do wnload, is av ailable from http://braun.tx0.org/netRev . Application Eac h of the methods sho wn in T able 1 was applied to all 10 data sets described in T able 2 for all 247 KEGG path wa ys in out database. Where p ermutation tests w ere required, 1000 p erm utations w ere used. Sev eral of the methods ha ve options that permit differen t st yles of analysis, which w e also explored. The details of our application is given below: GSEA As a p oin t of reference, the non–netw orked GSEA w as applied as describ ed in [56], using the gene p -v alues obtained from limma as describ ed ab o ve. Significance was tested using 1000 p erm utations of the sample classes. SPIA SPIA was applied using an 0.05–quantile threshold for significance as describ ed ab o v e. A n umber of the path wa ys had no edges considered by SPIA (whic h only considers directed edges, cf. [15, 36]), and so w ere preemptively excluded from the analysis by the pac k age. The ov errepresen tation and p erturbation p -v alues were com bined using Stouffer’s normal–inv erse metho d. R OT/p e, cutoff R OT/p e p ermits analysis with and without a p v alue threshold [16–18]; we applied b oth. Here, we used the same threshold as in SPIA, meaning that the results should b e roughly comparable to SPIA for the p. ORA ov errepresen tation analysis. In contrast to SPIA, how ev er, pPert is now w eighted by the gene’s significance, rather than treating all significant genes equally . Genes not meeting the significance threshold are excluded from p. Pert with 0 weigh t, similar to the exclusion in SPIA. p. Pert and p. ORA w ere combined as in SPIA. R OT/p e, no cut W e p erformed R OT/p e without a significance threshold. Because the h yp ergeometric test cannot b e p erformed without setting a cut-off, only pPert is rep orted. In contrast to the thresholded analysis, pP ert now in volv es data from al l the genes, although those with low significance will ha ve low w eighing. PathNet P athNet was carried out as describ ed ab o v e and in [19]. PathNet returns b oth the P athNet p v alue com bining the “direct” and “indirect” evidence, along with the simple h yp ergeometric p v alue. The quan tity of in terest is p PathNet. NEA NEA w as carried out as describ ed ab o ve and in [20, 21], using the same gene thresholds and num ber of p erm utations as in the other studies. CePa-ORA Lik e R OT/p e, CeP a also has options to perform the analyses with or without setting a gene–significance threshold [22, 23]. W e p erformed b oth; here, w e use the same thresholds used in the other analyses to carry out CePa-ORA. As describ ed abov e, CeP a will report the significance using a v ariety of net work cen trality measures. Because there is no clear c hoice of which one is correct, we chose to com bine all six measures into a single p v alue for CeP a-ORA using Stouffer’s metho d. CePa-GSA W e also p erformed the non-thresholded CePa-GSA. The analysis differs from CePa-ORA not only in the num b er of genes considered, but also in the type of hypothesis test p erformed. While CePa-ORA tests a “comp etitiv e” hypothesis [7] comparing path w ays to random subsets of genes while holding fixed the sample lab els (and hence the gene–level statistics), CeP a-GSA tests the “self–con tained” null h yp othesis by p ermuting the sample lab els while holding the pathw ay definition fixed (see T able 1). 8 The tw o tests are orthogonal to each other, and we do not anticipate that the results of CePa-GSA will necessarily be the same as those for CeP a-ORA. As in CeP a-ORA, we c hose to combine the six p ’s in to one p v alue for CePa-GSA using Stouffer’s metho d. DEGr aph DEGraph also presents several alternativ e analysis approaches, sp ecifically , whether or not the netw ork should b e signed (corresponding to inv ersely–related no des) or unsigned for the purp oses of computing the smoothing vector [24]. W e p erformed b oth the signed and unsigned analyses. F or each of these, w e also had to mak e a decision regarding ho w to handle pathw a ys with more than one connected comp onen t, and hence more than one p -v alue. W e tried b oth simply taking the p v alue for the largest connected comp onent as the p v alue for the path wa y , as well as com bining the p v alues for all the comp onen ts using Stouffer’s metho d. DEGraph will rep ort b oth the non-netw ork ed p ( T 2 ) as w ell as the graph–smo othed p ( T 2 ) graph; the latter is the primary quan tity of in terest. T op olo gyGSA Finally , w e attempted to apply T op ologyGSA [25, 26] as implemented to our data. In principle, T op ol- ogyGSA rep orts p v alues for b oth differential v ariance and differen tial mean expression across the path wa y submo dules, both of whic h are of in terest. Results Computational efficiency The computational time to complete each each of the analyses on a desktop machine (3.4 GHz quad-core In tel Core i7 iMac with 16GB RAM) is given in T able 3. Each of the metho ds sho wn in T able 1 w as applied to all 10 data sets describ ed in T able 2 for 247 path wa ys. Where permutation tests were required, 1000 p erm utations w ere used. All jobs completed the calculation in under an hour p er study with the exception of NEA, which required ∼ 2 . 5 hrs/study, and T op ologyGSA, whic h failed to complete ev en the first analysis when it was finally halted after 100hrs ( > 4 days). In terestingly , R OT/p e, which is a weigh ted modification of the same computation carried out in SPIA, required less time than SPIA (and, additionally , was able to treat more path wa ys), whic h we attribute to co de improv ements b y the authors of b oth methods [15–18, 36] and made ROT/pe amongst the fastest of the metho ds we tested. Nev ertheless, with most methods taking only a few minutes per study , the differences in computational cost b et ween them are minor. With the exception of T op ologyGSA, whic h w e will return to b elo w, and DEGraph, the ma jor computa- tional cost is due to p erm utation testing. (In DEGraph, the computation of the smo othing vector scales as O ( n 3 ) where n is the n um b er of genes in the path wa y graph, and so can b e cum b ersome for v ery large path- w ays; how ev er, DEGraph do es not require permutation tests.) Perm utation testing is trivially parallelizable, and the dev elopment of parallel R libraries such as snow [57] facilitates developmen t of pac k ages that can b e run on clusters. Y et, of the pac k ages considered here, only CePa pro vides a parallelized implementation. On insp ection, it b ecame clear that T op ologyGSA had b een w orking for ov er 90 CPU hours to obtain the maximal cliques for a single pathw a y . As exp ected, the clique problem had b ecome in tractable; an example of the computational cost of the clique algorithm used in T op ologyGSA for a moderately sized KEGG net work is given in Supplementary T able S1. Unfortunately , T op ologyGSA has no mec hanism built in to monitor and bail out of the computation, nor do es it c heck the size of the transformed pathw a y b efore inv oking the max clique algorithm so that potentially problematic pathw a ys can be skipped. Running T op ologyGSA thus requires that the user confine the analyses to smaller pathw ays, but b ecause the computation dep ends on the densit y of the graph after moralization and triangularization, doing so is not as simple as merely selecting smaller pathw a ys. While the user could transform the graphs by hand to make a selection of tractable path wa ys, these chec ks should really b e built into the pack age. The issue of exp onen tial cost should also b e w ell–do cumen ted, ideally with a small b enc hmark that the user can run to estimate the computational time required on their machine (e.g., extrap olating from a table suc h as Supplementary T able S1), so that the user can make informed decisions about the application of the metho d to particular pathw a ys. 9 Analyses As discussed ab o v e, we p osit that if a path wa y is functionally related to a particular phenotype (here, high vs. lo w grade ov arian cancer), w e exp ect that a manifestation of its in volv emen t will b e present in the data for all studies of that disease, and that an accurate and sensitive netw ork analysis approac h will detect those signals consisten tly across the studies while a p oor netw ork analysis method will yield results that are strongly influenced by noise in the data and will v ary strongly from one study to another. Based on this in tuition, we consider the cross–study concordance of each metho d’s results to measure its abilit y to detect a common (and presumably “true”) signal in eac h of the studies. Cross–study concordance F or each metho d tested, w e examined the correlation of p -v alues obtained for the 247 pathw a ys b et w een all 45 p ossible pairs of the 10 studies listed in T able 2. F or reference, w e also b egan b y examining the correlation in gene–lev el statistics betw een the studies. Because eac h metho d has a differen t range/resolution of p ossible p v alues o wing to the differen t uses of parametric and nonparametric tests, w e use the nonparametric Sp earman’s rank correlation as a measure of concordance. Figure 2 depicts the correlation of results for all all 45 study pairs. F or completeness, we show the cross– study correlations for each metho d’s subanalyses, in addition to the “final” com bined result. This includes the p ORA and p Pert v alues for SPIA and ROT/pe (b oth with and without a cutoff ) that are combined to form the final p Comb v alue for the pathw a y; the standard p Hyp er hypergeometric test along with the net work edge–based h yp ergeometric test from PathNet; the results for all six cen trality measures considered b y CePa ORA and GSA analyses, whic h are then combined into p Com b; and the DEGraph results for the standard Hotelling T 2 and the netw ork–smo othed p T2graph for the largest connected comp onent (lcc) and the full path wa y ( p ’s for all connected comp onenen ts combined) for b oth the signed and unsigned analyses. The “final” results for eac h analysis are denoted by b olding. Supplementary Figure File S1 pro vides a more detailed view of the these correlations. T o aid in the interpretation of Fig. 2, Fig. 3 presen ts a summary of the cross–study correlations for each of the “final” results. Here, the distribution of correlations for eac h of the 10 studies with resp ect to all other studies is sho wn for eac h of the metho ds. As can b e seen in the top row of Fig. 2 and first panel of Fig. 3, the correlation of gene–lev el statistics is often po or; w e obtained a maxim um rank correlation ρ = 0 . 20 for the gene p -v alues, with a median of ∼ 0 . 02 . This lack of corresp ondence ev en amongst studies of the same phenot yp e has b een observ ed in other inv estigations of microarra y data [50]. Also as previously observed in other studies [45, 50], w e found that the correlations were generally improv ed in pathw ay analyses, both in terms of the n umber of p ositiv ely–correlated study pairs (few er blue cells in Fig. 2) and in the magnitude of the p ositive correlations (cf Figs. 2,3). Considering that each study is interrogating gene expression in the same phenotypes, w e ideally desire that the correlations b et ween all study pairs should b e p ositive, and indeed man y were, with the CeP a GSA analyses b eing the strongest and most consistent (cf Fig. 3). In addition, we also observ e that the concordance for the netw ork–based analyses w as alwa ys stronger than that exhibited by non–net work analyses. In Fig. 2, this can be seen in the darker blue cells of GSEA and b oth SPIA and ROT/pe p ORA sub-analysis v alues, all of which measure enrichmen t without considering the netw ork top ology . In Fig. 3, this difference is manifest by the low er medians and tails for the GSEA b o xplot v ersus the others. It is also instructive to consider the cross–study correlations for eac h method in the con text of the gene– lev el concordance and the sample size of the studies. The study pairs depicted in Fig. 2 are sorted in order of gene–level concordance. Generally , w e exp ect that studies which ha ve greater similarity at the gene level will also exhibit greater similarity in the pathw ay statistics, and in most cases this pattern holds, with lo w er correlations at the left end of the plot. Qualitative departures from this trend can b e seen in the SPIA, NEA, and CePa–ORA b et weenness results. Moreov er, we exp ect that tw o large studies will exhibit greater correlation than tw o smaller studies, on the basis of the in tuition that tw o large studies are b etter p ow ered to distinguish subtle but biologically meaningful, and hence consisten t, effects from noise. In Fig. 2, the sum of the sample sizes for eac h study pair is giv en in the bottom ro w, and the pattern of study sizes can b e seen to b e most strongly manifest in the v arious CePa analyses. 10 Consistency b et w een metho ds A similar in tuition regarding the concordance of findings may b e had regarding the results of the v arious metho ds within a given study . That is, despite the differences b et w een the metho ds, we might reasonably exp ect that if a path wa y is strongly affected in a particular study , it will b e detected by more than one of these methods, i.e., that for a given study the results from SPIA, R OT/p e, NEA, &c. will b e correlated. Figure 4 sho ws, for eac h study , the distribution of pathw a y p –v alue correlations that eac h metho d had with all other metho ds. A more detailed view is provided in Supplementary Figure File S2. As ab o v e, w e use Sp earman’s rank correlation as a measure of concordance to account for methodological differences influencing the dynamic range of p v alues. NEA analyses tended to give results that disagree with metho ds obtained from the other analyses (cf Fig. 4), for reasons we ill discuss further b elo w, while the other metho ds are fairly comparable. While the abov e comparisons consider correlations for the whole range of p v alues returned b y eac h metho d, we now consider how consistent the selection of “significan t” pathw a ys is for the v arious metho ds. The heatmap in Figure 5 depicts the num b er of times that a path wa y w as ranked in the top 20% for the 10 studies listed in T able 2. that a path wa y was ranked in the top 20%. Results from all subanalyses of each metho d are given, including the p ORA and p P ert v alues for SPIA and R OT/p e (with and without a cutoff ) that are combined to form the final p Com b v alue for the path wa y; the standard p Hyper h yp ergeometric test and the net work edge–based hypergeometric test from PathNet; the results for all six centralit y measures considered by CeP a ORA and GSA analyses that are then com bined in to p Comb; and DEGraph results for the standard Hotelling T 2 test p T2 and the netw ork–smo othed p T2graph for the largest connected comp onen t (lcc) and the full pathw a y ( p ’s for all connected comp onenen ts com bined) for b oth the signed and unsigned analyses. The “final” results for each analysis are denoted b y b olding. The pathw a ys are sorted by the a verage across the b olded analyses, suc h that (eg) CeP a–GSA contributes to that a verage once as opp osed to sev en times. The probabilities for the coun ts under the null hypothesis are also shown; our exp ectation is that w e will see, by chance, coun ts of 0–4 with 95% probabilit y , while counts > 5 should o ccur only once b y c hance amongst the 247 pathw a ys. On the other hand, path w ays for which the null h yp othesis is indeed false should exhibit high coun ts more frequently , corresp onding to their detection in multiple studies. Generally , this pattern app ears to qualitatively hold, and the pathw a ys which are deemed significant in > 5 studies tend to detected consistently by most of the metho ds (with the exception of NEA). This suggests that the results are being driven by commonalities across studies, and that those common patterns are detectable b y man y of the metho ds considered. Distribution of results A more detailed understanding of these patterns emerges from looking at the concordance b et w een metho ds for all pathw ays in all studies, sho wn in Fig. 6. In the upp er triangle of plots, the joint distributions of − log 10 p v alues are rep orted; the corresp onding correlation co efficien ts are sho wn in the low er triangle. Note that, as ab o ve, rank correlation co efficien ts are rep orted (and so ma y differ from “by ey e” estimates). On the diagonal, histograms of − log 10 p are plotted in red; the black lines show the exp ected distribution of − log 10 p corresp onding to the uniform distribution of p v alues exp ected under the n ull. Strikingly , it can b e seen from the histograms in Fig. 6 that the p v alues obtained from NEA are strongly biased tow ard highly significan t p v alues; indeed, ov er half of all NEA p Z v alues fall ≤ 10 − 3 , whereas w e exp ect that the proportion w ould b e ∼ 1 / 1000 . This causes an extremely large fraction of path wa ys to b e deemed statistically significant even after adjusting for m ultiple h yp otheses in NEA, making it difficult to discriminate truly significan t path wa ys using the current implementation. Suc h sev erely sk ewed p -v alue distributions are generally attributable to an incorrect null mo del. 1 The other metho ds follo w the theoretical p v alue distributions relativ ely well, with a sligh t deviation observ ed in CePa–GSA. Discussion Our review indicates a num ber of b enefits and drawbac ks asso ciated with each metho d, some of whic h are inheren t to the underlying metho dology , and others of which are consequences of the implementations. 1 In the case of NEA, we b eliev e there ma y be a simple remedy for the incorrect n ull model. Sp ecifically , w e note that the NEA pack age do es not distinguish genes that are assa yed and deemed non-significan t from genes those that are simply not assa yed. By treating non-assay ed genes as insignificant, the proportion of significant genes is significantly reduced, low ering the probabilit y of significant edges in the resampled graphs. 11 Metho dological considerations In T able 1, the design features of each method are listed. A ma jor distinction b et ween the metho ds is the need for gene p -v alue thresholding. Threshold–free analyses are generally considered preferable to those that require gene–level significance thresholds, since the threshold in tro duces an arbitrary choice and excludes the full sp ectrum of data from the analysis; for this reason, GSEA is preferred to hypergeometric enrichmen t tests [7, 8] for non-net w ork pathw a y analyses. Of the netw ork–based metho ds, SPIA, P athNet, and NEA ha ve the common drawbac k of requiring thresholding on gene–lev el significance; in contrast, CePa and ROT/pe pro vide threshold–free options, and the DEGraph and T op ologyGSA analyses are threshold–free by design. Ho wev er, it should be noted that the cutoff–free ROT/pe analysis differs substantially from the cutoff based R OT/p e analysis. Sp ecifically , ROT/pe with a cutoff computes b oth the downstream p erturbation analysis ( p P ert) and a hypergeometric ov er-represen tation analysis ( p ORA) which are then com bined to measure the impact of differential expression on a pathw ay , while in the cutoff–free analysis, only the downstream p erturbations p Pert are considered. This limitation could be ov ercome simply b y using a GSEA-lik e analysis in place of the hypergeometric test, enabling both p ORA and p P ert to b e computed with or without a threshold. The second ma jor metho dological distinction is in the type of hypothesis b eing tested b y the metho ds. “Comp etitiv e” null hypotheses compare the path wa y of in terest to a random path wa y while holding the sam- ple classes (or gene–level asso ciations) fixed, whereas “self-contained” n ull hypotheses test if the pathw a y is more strongly asso ciated with a particular phenotypic attribute than exp ected by c hance giv en the genes and top ology of the pathw a y [7]. The t wo tests represen t tw o differen t conditional probabilities (“comp etitiv e” b eing conditioned on the sample labels, allowing the definition of the path wa y to v ary; the “self–contained” b eing conditioned on the pathw a y definition, but allowing the sample classes to v ary), and may th us give differen t results. The “self–con tained” null is considered sup erior since it is b oth b etter justified biologi- cally (“comp etitiv e” p erm utations tests will create physiologically unrealistic path wa ys) and directly answers the question of whether a particular path wa y is asso ciated with the phenotype of interest. Unfortunately , though, metho ds testing the “self–contai ned” null tend also to b e limited in the type of data that can b e used: DEGraph, T op ologyGSA,and CeP a-GSA are limited to t wo–sample comparisons of con tinuous data, making them unsuitable for surviv al analysis or application to GW AS SNP data. Ho wev er, while this limi- tation is inherent to the distributional assumptions made in DEGraph (whic h uses Hotelling’s T 2 test) and T op ologyGSA (which uses a Gaussian netw ork mo del), it is only an implementation limitation in CePa-GSA rather than a metho dological constrain t. A revision of the CePa pack age with a more flexible interface w ould pro vide a threshold–free, “self–contained” netw ork analysis to ol that could b e applied to a broad v ariety of studies. Ease of use All net work metho ds tested are provided as R or BioConductor pac k ages, making them easily adoptable. In addition, SPIA, ROT/pe, T op ologyGSA,and DEGraph accept R graphNEL [58] ob jects describing pathw a ys, making them easy to use with pathw a y annotation pac k ages suc h as KEGGgraph [55], GRAPHITE [59], NCIgraph [60], &c., without additional prepro cessing. A more serious consideration regarding the ease of use is the computation time, shown in T able 3. As discussed ab ov e, most metho ds are comparably efficient with the exception of NEA and T op ologyGSA. W e could iden tify no metho dological factor that contributes to NEA’s lengthy run-time, and b eliev e that it is lik ely due to inefficiencies in the R implemen tation. In contrast, T op ologyGSA’s inefficiency is an unav oidable consequence of the metho d’s reliance on solving the NP-hard maximal clique problem. The exp onential complexit y can easily b ecome intractable for ev en mo derately sized path wa ys, illustrated in Supplemen tary T able S1. At minim um, c hecks should b e built in to the T op ologyGSA pac k age to conserv atively skip pathw ays that ma y fail to b e solved in a reasonable amount of time (e.g., by rejecting pathw a ys with more than a certain num b er of no des or edges after moralization and triangulation). Ho w ever, it is not clear that the maximal clique problem necessarily needs to b e solved. Arguably , simply detecting communit y structure within the netw ork (i.e., finding dense subgraphs without requiring that all pairs of no des are completely connected as in a clique) is sufficien t to define pathw ay “modules,” whic h can then b e analyzed in the same 12 w ay as the cliques curren tly are. Detecting communit y structure/clusters within a graph is readily ac hieved b y sp ectral metho ds [41, 42, 45, 47, 48], that solve a relaxation of the problem in O ( n 3 ) time. Computational efficiency of many of these metho ds could b e further improv ed by parallelized implementations, a feature that only CePa has to date. Reliabilit y of results In absence of “gold–standard” data against which to b enc hmark these analyses, we attempted to characterize their reliability based on the concordance of their results in a suite of comparable o v arian cancer studies (T able 2). Based on the in tuition that studies of similar phenotypes should yield similar results, we examined the correlation of path wa y statistics obtained by eac h method amongst the 10 studies. In general, w e found greater concordance in the pathw a y net work analysis results than in the simple gene–lev el analysis (cf. Figs. 2,3), whic h was the exp ected and desirable result from studies of the same phenotype [50]. W e also observ ed that the net work–based analyses generally ga ve more concordan t results than the non-net w ork GSEA analysis (Fig. 3). The greatest increases in cross–study concordance were obtained with R OT/p e and CeP a (Figs. 2,3). In addition, w e exp ected that meaningful cross–study concordance of pathw ay results w ould b e p ositiv ely influenced b y b oth gene–level concordance and the p ow er of the studies under consideration. With the exceptions of NEA and the SPIA analyses, the correlation of pathw ay–lev el concordance with gene– lev el concordance is visible for all metho ds in Fig. 2, meeting our expectations. The correlation of concordance with sample size is most clearly manifest only in the CeP a-GSA analyses, and, weakly , in DEGraph. W e are thus inclined to b eliev e that the impro ved cross–study concordance amongst the CeP a and DEGraph are attributable to their detection of common biological signals across the 10 studies. Based on the conjecture that biological “truths” should b e detectable despite slight metho dological differ- ences b etw een the analyses, w e also examined the concordance of findings betw een v arious metho ds. Fig. 4 sho ws the correlations in path wa y p v alues amongst the metho ds for each study . Most metho ds yielded comparable results, with the exception of NEA. Correlations in the path wa ys consistently identified as being in the top 20% significant can also b e seen amongst SPIA, ROT/pe, P athNet, CeP a, and DEGraph in Fig. 5. By con trast, NEA tends to detect consisten tly significan t pathw a ys that are infrequently found amongst the top 20% in any study using the other metho ds. In addition to in vestigating the cross–study and cross–metho d concordance, w e also examined the distri- bution of p v alues obtained for the metho ds, sho wn in Fig. 6. It is exp ected that most of the 247 path wa ys tested are not significantly asso ciated with ov arian cancer, and th us the distribution of p v alues should b e, by definition, uniformly distributed on [0 , 1] with the exception of a handful of significant pathw ays. Ho w ever, as seen in Fig. 6 and discussed ab o ve, the net work enrichmen t p Z computed in NEA are exceedingly small a ma jority of the time, indicating a likely problem with the n ull mo del used in NEA. 1 More generally , this observ ation raises questions ab out what constitutes an appropriate null model for net work analyses. In the context of the “self–contained” hypothesis tests, the answer is straigh t–forward: one p erm utes the sample lab els, lea ving the net work itself intact. F or the “comp etitiv e” hypothesis, ho wev er, the answ er is far less clear. The difficulties in constructing null mo dels that accurately preserve the statistical and graph theoretic prop erties of net works ha ve b een considered by ourselv es and others [45, 61]. Most notably , simple randomization of no de prop erties or graph rewiring will pro duce null mo dels that lack the assortativit y found in biological interaction netw orks. That is, b ecause of the underlying biology , groups of genes that are connected in pathw a y databases will likely exhibit correlated expression (and hence correlated gene–lev el significance) in exp erimen tal data. By randomizing the data across the netw ork, that prop ert y is destro yed, resulting in netw ork mo dels that are not as structured as those found in nature. Metho ds using suc h null mo dels will yield inflated significance, since the data is b eing compared against naive random net works rather than biolo gic al ly plausible r andom networks . The test of the “comp etitiv e” null hypothesis th us demands more sophisticated null mo dels than those curren tly employ ed. These issues also underscore the b enefit of using a “self–contained” test, which preserv es the asso ciations b etw een gene expression and net work structure while randomizing their asso ciation with the phenotype of interest. In general, we find that CePa-GSA exhibits the best cross–study concordance (Fig. 3), does so in a 13 w ay that meets reasonable exp ectations of b eing correlated with gene–lev el concordance and sample sizes (Fig. 2), and has the b enefit of testing the prefered “self–contained” n ull. The dra wbacks of the metho d, ho wev er, include limitations regarding the input data as discussed abov e, as w ell as the fact that CeP a returns sev eral sub–analyses that m ust b e selected or com bined b y the user, as w e did here. CePa-GSA also required nearly an hour per study when using 1000 p erm utations, though this ma y b e p ossible to reduce with CePa’s parallel implementation. Other metho ds pro vide sp eedier computations and more flexible inputs, alb eit at the exp ense of impro ved concordance or other metho dological limitations (cf. T able 1) Conclusions New netw ork–based metho ds hav e garnered increasing interest as to ols to analyze complex genomic datasets at the systems level. Despite the dev elopment of a n um b er of promising tools, how ev er, there is little guidance av ailable to researchers for choosing b et w een the metho ds. In this review, we sough t to compare all the net work analysis metho ds a v ailable in R/BioConductor at the time of this writing [8, 15–26, 36]. In addition to discussing their metho dological and implementation features, we also prop osed and applied a no vel means to compare their p erformance using a suite of curated microarra y data-sets [38] and a set of up dated KEGG mappings developed to enable consistent path wa y mo dels for each metho d. The data w e used for the analysis, the prepared KEGG path wa ys, and the scripts to carry out the computations (including functions to refresh the curated data and KEGG mappings from their source rep ositories) hav e b een made a v ailable on the author’s website ( http://braun.tx0.org/netRev ) to enable other researc hers to apply these comparisons to new methods as they are dev elop ed. In addition, w e plan to make a v ailable up dated versions of our findings as these pack ages are up dated. The results of our tests clearly indicated the b enefits and limitations of each approac h. The tests also revealed idiosyncracies that would hav e b een unnoticed except in comparison; for example, our comparisons revealed a bug in the previous v ersion of the R OT/p e computation, whic h led us to suggest a fix that has no w b een implemen ted in the curren t version (review ed here). In addition to pro viding guidance about the features of the metho ds (T able 1), the efficiency of the computations (T able 3), and the consistency of the results (Figs. 2–6), our review also suggests a n umber of directions for future metho dological dev elopment. Most notably , there is a need for b enc hmark and testing standards against which net work analysis methods should b e tested. W e used the consistency of the results across a set of comparable studies, but this approac h is plagued by a serious limitation: namely , w e hav e no wa y to assess whether the “consistent” results are consisten t owing to biological commonalities amongst o v arian cancers or due to a fluke of the microarray data, since the set is homogenous with resp ect to the disease type. A more insightful analysis could b e obtained by the dev elopmen t of a database of diverse studies that are all curated to the same standards, just as was done for the curated ov arian data [38]. While diverse datasets are readily obtained, the work required to ensure that they are all comparable is non-trivial (and was b ey ond the scop e of this pap er); ho w ever, suc h data would b e immensely useful to the researc h comm unity . Relatedly , agreement on a common pathw ay represen tation format suc h as BioP AX [6] and developers’ adoption of a consisten t API accepting these path wa y files would aid comparison b et ween these metho ds without requiring that the pathw ays b e prepared b y the user in differen t wa ys. Secondly , we note that the most significan t methodological distinctions b etw een the pac k ages inv olv e a c hoice b et ween using the preferred “self–con tained” n ull hypothesis versus having the flexibility to apply the metho d in con texts other than t wo–sample differential expression studies. W e recommend using metho ds that test the self–contained n ull (b oth for statistical and biological reasons as discussed ab o v e and in [7]), but at presen t none of these pac k ages are able to test, for example, a self–containe d hypothesis that a path wa y is significan tly asso ciated with surviv al. This compromise could b e easily resolved by further dev elopment of CeP a–GSA allowing the user indicates to the function the statistical test (or mo del to b e fit) rather than assuming that a t wo–sample t -test is desired. In the case of DEGraph, whic h uses Hotelling’s tw o-sample T 2 statistic to compare the graph “smo othed” gene expressions in tw o phenotypes, suc h an extension is less ob vious but would b e a v aluable addition to DEGraph’s functionalit y . Relatedly , w e note that care must b e exercised when constructing n ull mo dels for the path wa ys for the “comp etitiv e” tests. An easy chec k of whether or not the null mo del is correct is to examine the distribution 14 of p v alues across a large set of path wa ys; strong deviation from the exp ected uniform distribution of p v alues is indicative of an incorrect null mo del. Ho wev er, this rough assessment will only reveal egregious fla ws. In the metho ds discussed abov e, and indeed man y net w ork biology metho ds generally , n ull graphs are generated b y simply resampling no de or edge prop erties. This destro ys the correlation structure in the data (as [8] discussed) as well as the expected assortativit y of gene expression in the path wa y , yielding excessively conserv ative null models. There is th us a need to develop metho ds that can pro duce n ull graphs that are more biologically plausible. Finally , w e observ e that a common dra wback to all of these metho ds is their reliance up on single–gene statistical tests. As a result, while all of these metho ds are able to articulate differences in gene expression that hav e an impact at the pathw a y level, they cannot detect differentially regulated path wa ys when there are no detectable marginal effects at the gene level. An alternative approach w ould be to ov erla y the gene expression data itself on to the net work (instead of using statistics corresp onding to the gene’s differential expression), obtain a summary statistic for the net work as a whole, and compare those. This approac h has pro ved p o werful in a non–netw ork context [10, 45], where it w as able to detect pathw a ys in which non- linear patterns of gene expression were asso ciated with phenot yp e. While net work extensions hav e been prop osed [31], R implemen tations remain lacking. Net work analysis is rapidly b ecoming a v aluable to ol for harnessing existing biological information to yield mec hanistic, systems–level insigh ts from HT data. A num b er of promising metho ds hav e b een dev elop ed, and w e hav e found that most yield more consistent results (as measured b y cross–study concordance) than b oth gene–level analyses and non–netw ork path wa y analyses (GSEA [8]). Nevertheless, challenges remain, and further work in this area has the p otential to significan tly improv e the systems–based analysis of HT data, facilitating b etter understanding of the structure and function of the complex netw orks that co ordinate living pro cesses. 15 Gene p -v alue Expression 1 2-sample Metho d thresholding data only restriction Directed Signed 2 Null type 3 Citation GSEA no no no N/A N/A self-con tained [8] SPIA yes no no y es y es competitive [15, 16, 36] R OT/p e optional no no y es y es competitive [16–18] P athNet y es no no y es no comp etitiv e [19] NEA y es no no no no comp etitiv e [20, 21] CeP a-ORA y es no no y es no comp etitiv e [22, 23] CeP a-GSA no as written 4 as written 4 y es no self-con tained [22, 23] DEGraph no y es y es no optional self-contained [24] T op ologyGSA no y es y es no no self-con tained [25, 26] T able 1: Prop eries of the v arious methods, including whether genes are thresholded on p -v alues, restrictions on the type of data and comparisons that can b e made, the type of edges used by the mo del, and the type of null hypothesis tested. Notes: 1 “Expression data” is used here to denote any data that meets the assumptions used in gene expression testing, i.e., that the data is contin uous and normally distributed. Other data meeting these assumptions can also b e used, but metho ds which hav e this restriction cannot accept SNP data, etc. 2 “Signed” edges hav e signs assigned based on the in teraction type in the pathw ay reference graph, distinguishing activ ating/in- ducing edges (+1) from repressing/inhibiting edges (-1). 3 “Null t yp e” refers to the t yp e of null h yp othesis tested (cf. [7]. “Competitive” n ull hypotheses compare the pathw a y of interest to randomly generated path wa ys, without permuting sample labels, i.e., testing that the path wa y statistic is more significan t than a random pathw ay given the sample lab els. “Self-con tained” null hypotheses compare the statistic for the pathw ay to that obtained by randomly p ermuting sample lab els, i.e., testing that the path wa y is more strongly asso ciated with a particular phenot ypic attribute than exp ectd by chance given the genes and top ology of the pathw ay . The self-contained null is considered to b e a stronger test [7]. 4 CeP a-GSA is not inherently restricted to 2-sample tests of differential expression methodologically , how ever the present imple- men tation will only carry out the non-thresholded “GSA” type analysis for 2-sample tests of differential expression. As currently implemen ted, other types of analyses (e.g., using SNP data or mo deling surviv al) must b e carried out in CeP a using the “ORA” analysis, which requires gene p -v alue thresholding and can only test the comp etitive null h yp othesis 3 . 16 grade Study A ccession No. N (low) N (high) GSE13876_eset 59 85 GSE14764_eset 24 44 GSE17260_eset 67 43 GSE30161_eset 19 27 GSE32062.GPL6480_eset 131 129 GSE32063_eset 23 17 GSE9891_eset 103 154 PMID17290060_eset 57 57 PMID19318476_eset 17 24 TCGA_eset 75 470 T able 2: Studies and samples sizes of the data used in this inv estigation. The data are publicly accessible from GEO [62] and a v ailable as part of the curatedOv arianData pack age. time (sec), 247 pathw ays, all 10 studies a vg run time p er study Metho d P ack age V ersion user system CPU (usr+sys) wallclock SPIA SPIA_2.14.0 1229.803 123.825 1353.628 1356.908 2m 15s R OT/p e, cutoff ROntoTools_1.4.0 948.702 9.497 958.199 959.367 1m 35s R OT/p e, no cut ROntoTools_1.4.0 1054.795 16.861 1071.656 1076.913 1m 47s P athNet PathNet_1.2.0 747.983 9.572 757.555 796.516 1m 20s NEA neaGUI_1.0.0 78099.148 5280.723 83379.871 83389.635 2h 18m 58s CeP a-ORA CePa_0.5 3217.099 21.367 3238.466 3238.537 5m 24s CeP a-GSA CePa_0.5 29127.875 512.618 29640.493 29650.268 49m 25s DEGraph (s,u) DEGraph_1.14.0 2467.075 43.743 2510.818 2514.990 4m 11s T op ologyGSA topologyGSA_1.4.3 [N/A: job halted after 100hrs] 360000 . 000 T able 3: Pac k age versions and run times (in seconds) for 247 pathw a ys in all ten studies. A verage times (in h/m/s) for a single study (i.e., 1/10th w allclo c k) are also noted. Times for computation (“user”) and k ernel system calls (“system”) are giv en; the total CPU time consumed is the sum of these. The computations were carried out on a lightly–loaded 3.4 GHz quad-core In tel Core i7 iMac with 16GB RAM running R version 3.0.3 under OS X 10.8.5 (Darwin 12.5.0). Note that the times for DEGraph include b oth the signed and unsigned graph analyses. 1000 random p erm utations were used for the metho ds that perform resampling (all except DEGraph). 17 Figure 1: F ragment of the KEGG cell-cycle path wa y (hsa04110). Classical pathw a y analyses such as GSEA do not tak e the netw ork top ology into account, but rather treat the path wa y as a simple list of genes. As a result, changes to a gene suc h as p53 (red), which has a high degree and a direct influence on a num b er of other high–degree genes, a large downstream net work, and an outgoing connection to a whole other netw ork (the ap optosis pathw ay) are treated in the same wa y as changes to a gene such as Bub1 (blue), which has far fewer connections. In con trast, top ology–based analyses attempt to incorporate the structure of the netw ork and the relative imp ortance of each gene to the pathw ay . 18 n1+n2 DEgraph_unsigned.pT2graph DEgraph_unsigned.pT2 DEgraph_unsigned.lcc_pT2graph DEgraph_unsigned.lcc_pT2 DEgraph_signed.pT2graph DEgraph_signed.pT2 DEgraph_signed.lcc_pT2graph DEgraph_signed.lcc_pT2 CePa_GSA.pComb CePa_GSA.outReach CePa_GSA.inReach CePa_GSA.betweenness CePa_GSA.outDegree CePa_GSA.inDegree CePa_GSA.equalWeight CePa_ORA.pComb CePa_ORA.outReach CePa_ORA.inReach CePa_ORA.betweenness CePa_ORA.outDegree CePa_ORA.inDegree CePa_ORA.equalWeight NEA.pZ PathNet.pPathNet PathNet.pHyper ROTpe_noCut.pPert ROTpe_cutoff.pComb ROTpe_cutoff.pPert ROTpe_cutoff.pORA SPIA.pComb SPIA.pPert SPIA.pORA GSEA.pES gene.level 0 10 20 30 40 study pairs (sorted by gene-level correlation) -1.0 -0.5 0.0 0.5 1.0 corl correlation of pathway p-values between study pairs Figure 2: Cross–study concordance for each sub-analysis. F or each subcomputation of each metho d, we show the correlation b et ween pathw ay p v alues for all possible study pairs (45 total). Study pairs are ordered along the x axis according to their correlation in gene–lev el p v alues, sho wn in the top row. Metho ds are lab eled in alternating colors, with the final/com bined p v alues denoted in b old. The b ottom ro w of the plot shows the sum of the sample sizes for each pair of studies, with dark green b eing high. 19 -0.2 0.0 0.2 0.4 0.6 0.8 gene.level -0.2 0.0 0.2 0.4 0.6 0.8 -0.2 0.0 0.2 0.4 0.6 0.8 GSEA.pES -0.2 0.0 0.2 0.4 0.6 0.8 -0.2 0.0 0.2 0.4 0.6 0.8 SPIA.pComb -0.2 0.0 0.2 0.4 0.6 0.8 -0.2 0.0 0.2 0.4 0.6 0.8 ROTpe_cutoff.pComb -0.2 0.0 0.2 0.4 0.6 0.8 -0.2 0.0 0.2 0.4 0.6 0.8 ROTpe_noCut.pPert -0.2 0.0 0.2 0.4 0.6 0.8 -0.2 0.0 0.2 0.4 0.6 0.8 PathNet.pPathNet -0.2 0.0 0.2 0.4 0.6 0.8 -0.2 0.0 0.2 0.4 0.6 0.8 NEA.pZ -0.2 0.0 0.2 0.4 0.6 0.8 -0.2 0.0 0.2 0.4 0.6 0.8 CePa_ORA.pComb -0.2 0.0 0.2 0.4 0.6 0.8 -0.2 0.0 0.2 0.4 0.6 0.8 CePa_GSA.pComb -0.2 0.0 0.2 0.4 0.6 0.8 -0.2 0.0 0.2 0.4 0.6 0.8 DEgraph_signed.pT2graph -0.2 0.0 0.2 0.4 0.6 0.8 -0.2 0.0 0.2 0.4 0.6 0.8 DEgraph_unsigned.pT2graph -0.2 0.0 0.2 0.4 0.6 0.8 GSE13876 (N=144) GSE14764 (N=68) GSE17260 (N=110) GSE30161 (N=46) GSE32062.GPL6480 (N=260) GSE32063 (N=40) GSE9891 (N=257) PMID17290060 (N=114) PMID19318476 (N=41) TCGA (N=545) Figure 3: Cross–study correlations. Each plot displa ys the cross-study correlation of the results for each ma jor analysis metho d. Bo xplots within eac h frame indicate, for a giv en metho d, the distribution of correlations each study had with the nine other studies. EG, consider the “GSEA.pES” plot; the blue (leftmost) box indicates the distribution of correlations of GSEA path wa y enric hment score p v alues (pES) that study ‘GSE13876’ had with eac h of the other data sets. The red b o x indicates the correlations b et ween ‘GSE14764’ GSEA results and those of other nine studies, etc. Cross-study correlations of the gene–level statistics are also shown. Note that the scale on each of the plots is the same. 20 -0.2 0.0 0.2 0.4 0.6 0.8 1.0 GSE13876 (N=144) -0.2 0.0 0.2 0.4 0.6 0.8 1.0 -0.2 0.0 0.2 0.4 0.6 0.8 1.0 GSE14764 (N=68) -0.2 0.0 0.2 0.4 0.6 0.8 1.0 -0.2 0.0 0.2 0.4 0.6 0.8 1.0 GSE17260 (N=110) -0.2 0.0 0.2 0.4 0.6 0.8 1.0 -0.2 0.0 0.2 0.4 0.6 0.8 1.0 GSE30161 (N=46) -0.2 0.0 0.2 0.4 0.6 0.8 1.0 -0.2 0.0 0.2 0.4 0.6 0.8 1.0 GSE32062.GPL6480 (N=260) -0.2 0.0 0.2 0.4 0.6 0.8 1.0 -0.2 0.0 0.2 0.4 0.6 0.8 1.0 GSE32063 (N=40) -0.2 0.0 0.2 0.4 0.6 0.8 1.0 -0.2 0.0 0.2 0.4 0.6 0.8 1.0 GSE9891 (N=257) -0.2 0.0 0.2 0.4 0.6 0.8 1.0 -0.2 0.0 0.2 0.4 0.6 0.8 1.0 PMID17290060 (N=114) -0.2 0.0 0.2 0.4 0.6 0.8 1.0 -0.2 0.0 0.2 0.4 0.6 0.8 1.0 PMID19318476 (N=41) -0.2 0.0 0.2 0.4 0.6 0.8 1.0 -0.2 0.0 0.2 0.4 0.6 0.8 1.0 TCGA (N=545) -0.2 0.0 0.2 0.4 0.6 0.8 1.0 GSEA.pES SPIA.pComb ROTpe_cutoff.pComb ROTpe_noCut.pPert PathNet.pPathNet NEA.pZ CePa_ORA.pComb CePa_GSA.pComb DEgraph_signed.pT2graph DEgraph_unsigned.pT2graph Figure 4: Cross–method correlations. Eac h plot displays the correlation in p v alues amongst differen t methods applied to eac h of the data sets. Here, the boxplots within each frame indicate, for a giv en study , the distribution of correlations the results from each method had with the others. EG, in the top left frame, the blue (left most) box plot indicates the distribution of correlation b et ween the pathw ay enric hment score p v alues (pES) vs. the pathw ay p v alues obtained from the other nine analyses when applied to the GSE13876 data. Note that the scale on each of the plots is the same. 21 (a ve ra g e ) DEgraph_unsigned.pT2graph D Eg ra p h _ u n si g n e d . p T 2 D Eg ra p h _ u n si g n e d . l cc_ p T 2 g ra p h D Eg ra p h _ u n si g n e d . l cc_ p T 2 DEgraph_signed.pT2graph D Eg ra p h _ si g n e d . p T 2 D Eg ra p h _ si g n e d . l cc_ p T 2 g ra p h D Eg ra p h _ si g n e d . l cc_ p T 2 CePa_GSA.pComb C e Pa _ G SA. o u t R e a ch C e Pa _ G SA. i n R e a ch C e Pa _ G SA. b e t w e e n n e ss C e Pa _ G SA. o u t D e g re e C e Pa _ G SA. i n D e g re e C e Pa _ G SA. e q u a l W e i g h t CePa_ORA.pComb C e Pa _ O R A. o u t R e a ch C e Pa _ O R A. i n R e a ch C e Pa _ O R A. b e t w e e n n e ss C e Pa _ O R A. o u t D e g re e C e Pa _ O R A. i n D e g re e C e Pa _ O R A. e q u a l W e i g h t NEA.pZ PathNet.pPathNet Pa t h N e t . p H yp e r ROTpe_noCut.pPert ROTpe_cutoff.pComb R O T p e _ cu t o f f . p Pe rt R O T p e _ cu t o f f . p O R A SPIA.pComb SPI A. p Pe rt SPI A. p O R A GSEA.pES pathways 8 (p=7.4e-05) 7 (p=7.9e-04) 6 (p=5.5e-03) 5 (p=2.6e-02) 4 (p=8.8e-02) 3 (p=2.0e-01) 2 (p=3.0e-01) 1 (p=2.7e-01) 0 (p=1.1e-01) Number of studies (of 10) in which a pathway ranks unambiguously in top 20% Figure 5: Num b er of studies in whic h a pathw a y ranks in the top 20% for each analysis. F or each sub computation of each method, we show for each path wa y the n umber of times the pathw ay was amongst the top 20% most significan t in each of the 10 studies. P athw a ys were only considered significant if they met the 20% cutoff unam biguously; if there were more than 20% of pathw a ys tied for the top sp ot, none w ere considered to b e meaningfully in the top 20%. Methods are lab eled in alternating colors, with the final/com bined p v alues denoted in b old. The num b er of studies (out of 10 possible) in which the path wa y w as in the top 20% for that analysis is giv en b y color; blac k indicates that the method could not give an answ er for that pathw ay (typically a result of gene thresholding leaving no meaningful edges). The p v alues in the color scale correspond to the probability of that sp ecific ov erlap assuming 10 Bernoull i trials with p = 0 . 2 success. The 247 pathw ays are ordered along the x axis by the mean ov erlap from the final (bolded) analyses, while the bottom ro w sho ws the av erage across all sub-analyses. 22 Figure 6: p-v alue distributions b y metho d (all path wa ys, all studies). Depicted are join t and marginal distributions of − log 10 ( p ) v alues for all pathw ays in all studies. (Note that higher v alues are more significan t.) In the upp er triangle, smo othed scatter plots depict the joint distribution of − log 10 ( p ) for each pair of metho ds; darker red corresp onds to higher density of p oin ts. In the low er triangle, Sp earman’s r ank correlations ρ b et ween the p v alues obtained from each pair of metho ds is given, with positive correlations shown in increasing blue intensit y and negativ e correlations sho wn in increasing red in tensity (there are no negative v alues). Note that b ecause rank correlations provide a measure of concordance that is independent of the dynamic range of the quantities being correlated and hence less influenced by outliers, the ρ rep orted in the low er triangle may differ from a “by eye” estimate of the corrlation based on the plots in the upp er triangle. On the diagonal, the marginal distributions of − log 10 ( p ) are shown as red histograms, with the theoretically exp ected distributions (uniform p under the null) shown as a blac k line. 23 References [1] Minoru Kanehisa, Michihiro Araki, Susum u Goto, Masahiro Hattori, Mik a Hirak a wa, Masumi Itoh, T oshiaki Katay ama, Sh uichi Ka washima, Sh ujiro Okuda, T oshiaki T okimatsu, and Y oshihiro Y amanishi. KEGG for linking genomes to life and the environmen t. Nucl. A cids R es. , 36(Database issue):D480–4, 2008. [2] Darryl Nishimura. BioCarta. Biote ch Softwar e & Internet R ep ort: The Computer Softwar e Journal for Scientists , 2(3):117–120, 2001. [3] Imre V astrik, P eter D’Eustachio, Esther Sc hmidt, Gopal Gopinath, Da vid Croft, Bernard de Bono, Marc Gillespie, Bijay Jassal, Suzanna Lewis, Lisa Matthews, Guanming W u, Ewan Birney , and Lincoln Stein. Reactome: a kno wledge base of biologic path wa ys and pro cesses. Gen. Biol. , 8(3):R39, 2007. [4] C. F. Schaefer, K. Anthon y , S. Krupa, J. Buc hoff, M. Day , T. Hanna y , and K. H. Buetow. PID: the Path wa y In teraction Database. Nucl. A cids R es. , 37:D674–679, 2009. [5] Da vid J Lynn, Geoffrey L Winsor, Calvin Chan, Nicolas Ric hard, Matthew R Laird, Aaron Barsky , Jennifer L Gardy , Fiona M Ro che, Timoth y HW Chan, Naisha Shah, et al. InnateDB: facilitating systems-lev el analyses of the mammalian innate immune response. Mol. Sys. Biol. , 4(1), 2008. [6] Emek Demir, Michael P Cary , Suzanne P aley , Ken F ukuda, Christian Lemer, Imre V astrik, Guanming W u, P eter D’Eustachio, Carl Schaefer, Joanne Luciano, et al. The BioP AX comm unity standard for path wa y data sharing. Nat. Biote chnol. , 28(9):935–942, 2010. [7] P . Khatri, M. Sirota, and A.J. Butte. T en years of path wa y analysis: Current approac hes and outstanding c hallenges. PL oS Comput. Biol. , 8(2):e1002375, 2012. [8] Ara vind Subramanian, P ablo T amay o, V amsi K Mo otha, Sa yan Mukherjee, Benjamin L Eb ert, Michael A Gillette, Amanda Paulo vic h, Scott L Pomero y , T o dd R Golub, Eric S Lander, and Jill P Mesirov. Gene set enric hment analysis: a knowledge-based approach for interpreting genome-wide expression profiles. PNAS , 102(43):15545–50, 2005. [9] Stev e E Calv ano, W enzhong Xiao, Daniel R Ric hards, Ramon M F elciano, Henry V Baker, Ra ymond J Cho, Richard O Chen, Bernard H Brownstein, J Perren Cobb, S Kevin T schoeke, et al. Natur e , 437(7061):1032–1037, 2005. [10] Rosemary Braun, Leslie Cop e, and Giov anni P armigiani. Identifying differential correlation in gene/- path wa y com binations. BMC Bioinformatics , 9:488, 2008. [11] Y otam Drier, Mic hal Sheffer, and Eytan Domany . Path wa y-based p ersonalized analysis of cancer. PNAS , 110(16):6388–6393, 2013. [12] Rosemary Braun. Systems anaylsis of high–throughput data. In Seth Corey et al., editors, Blo o d: A Systems Biolo gy Appr o ach . Springer–V erlag, (in press) 2013. [13] H Jeong, B T ombor, R Alb ert, Z N Oltv ai, and A L Barabasi. The large-scale organization of metab olic net works. Natur e , 407(6804):651–4, 2000. [14] H Jeong, S P Mason, A L Barabasi, and Z N Oltv ai. Lethalit y and cen trality in protein net works. Natur e , 411(6833):41–2, 2001. [15] A di Laurentiu T arca, Sorin Draghici, Purvesh Khatri, Sonia S Hassan, Poo ja Mittal, Jung-sun Kim, Chong Jai Kim, Juan P edro Kusanovic, and Rob erto Romero. A no vel signaling path w ay impact analysis. Bioinformatics , 25(1):75–82, 2009. 24 [16] Sorin Draghici, Purv esh Khatri, A di Lauren tiu T arca, Kashy ap Amin, Arina Done, Calin V oichita, Constan tin Georgescu, and Rob erto Romero. A systems biology approach for path w ay level analysis. Gen. R es. , 17(10):1537–1545, 2007. [17] Calin V oic hita, Mic hele Donato, and Sorin Draghici. Incorp orating gene significance in the impact anal- ysis of signaling pathw a ys. 2012 11th International Confer enc e on Machine L e arning and Applic ations , (1):126–131, 2012. [18] Calin V oichita and Sorin Draghici. R OntoT o ols: R Onto-T o ols suite . R pack age version 1.2.0. [19] Bhask ar Dutta, Anders W allqvist, and Jaques Reifman. PathNet: a to ol for pathw a y analysis using top ological information. Sour c e Co de for Biolo gy and Me dicine , 7(1):10, 2012. [20] Andrey Alexeyenk o, W o o jo o Lee, Maria P ernemalm, Justin Guegan, Philipp e Dessen, Vladimir Lazar, Janne Lehtiö, and Y udi Pa witan. Net work enric hment analysis: extension of gene-set enric hment analysis to gene netw orks. BMC Bioinformatics , 13:226, 2012. [21] Setia Pramana. ne aGUI: An R p ackage to p erform the network enrichment analysis (NEA) , 2013. R pac k age v ersion 1.0.0. [22] Zuguang Gu, Jialin Liu, Kunming Cao, Junfeng Zhang, and Jin W ang. Cen trality-based path wa y enric hment: a systematic approac h for finding significant pathw a ys dominated b y k ey genes. BMC Sys. Bio. , 6(1):56, 2012. [23] Zuguang Gu and Jin W ang. CePa: an R pack age for finding significan t pathw a ys w eighted b y multiple net work cen tralities. Bioinformatics , 29(5):658–60, 2013. [24] Lauren t Jacob, Pierre Neuvial, and Sandrine Dudoit. Gains in p o wer from structured t wo-sample tests of means on graphs. arXiv , Sep 2010. [25] Maria S Massa, Monica Chiogna, and Chiara Rom ualdi. Gene set analysis exploiting the top ology of a path wa y . BMC Sys. Bio. , 4(1):121, 2010. [26] Sofia Massa and Gabriele Sales. top olo gyGSA: Gene Set Analysis Exploiting Pathway T op olo gy , 2014. R pac k age v ersion 1.4.3. [27] Ali Sho jaie and George Michailidis. Penalized principal component regression on graphs for analysis of subnet works. In A dvanc es in Neur al Information Pr o c essing Systems , pages 2155–2163, 2010. [28] Marcus T Dittric h, Gunnar W Klau, Andreas Rosenw ald, Thomas Dandek ar, and T obias Müller. Iden ti- fying functional modules in protein–protein in teraction netw orks: an integrated exact approach. Bioin- formatics , 24(13):i223–i231, 2008. [29] Daniela Beisser, Gunnar W Klau, Thomas Dandek ar, T obias Müller, and Marcus T Dittrich. Bionet: an r-pac k age for the functional analysis of biological net works. Bioinformatics , 26(8):1129–1130, 2010. [30] T Ideker, V Thorsson, J A Ranish, R Christmas, J Buhler, J K Eng, R Bumgarner, D R Go o dlett, R Aebersold, and L Ho od. Integrated genomic and proteomic analyses of a systematically p erturbed metab olic net w ork. Scienc e , 292(5518):929–34, 2001. [31] Rosemary Braun. Hearing the Shap e of Cancer: Sp ectral graph theory for pathw a y analysis of gene expression data. In qBio Confer enc e on Cel lular Information Pr o c essing, Sixth Annual . LANL, 2012. [32] Sol Efroni, Carl F Schaefer, and Kenneth H Buetow. Identification of key pro cesses underlying cancer phenot yp es using biologic pathw a y analysis. PL oS One , 2(5):e425, 2007. 25 [33] Sharon I Green blum, Sol Efroni, Carl F Sc haefer, and Ken H Buetow. The P athOlogist: an automated to ol for path wa y-cen tric analysis. BMC Bioinformatics , 12(1):133, 2011. [34] Ali Sho jaie, George Mic hailidis, et al. Netw ork enrich ment analysis in complex experiments. Stat. Appl. in Gen. Mol. Bio. , 9(1), 2010. [35] Vina y V aradan, Prateek Mittal, Charles J V ask e, and Stephen C Benz. The in tegration of biological path wa y knowledge in cancer genomics: a review of existing computational approaches. Signal Pr o c essing Magazine, IEEE , 29(1):35–50, 2012. [36] A di Laurentiu T arca, Purvesh Kathri, and Sorin Draghici. SPIA: Signaling Pathway Imp act Analysis (SPIA) using c ombine d evidenc e of p athway over-r epr esentation and unusual signaling p erturb ations , 2013. R pac k age v ersion 2.14.0. [37] Rob ert C Gen tleman, Vincent J Carey , Douglas M Bates, Ben Bolstad, Marcel Dettling, Sandrine Dudoit, Byron Ellis, Laurent Gautier, Y ongchao Ge, Jeff Gentry , et al. Bio conductor: op en soft ware dev elopment for computational biology and bioinformatics. Gen. Biol. , 5(10):R80, 2004. [38] Benjamin F rederick Ganzfried, Markus Riester, Benjamin Haib e-Kains, Thomas Risc h, Svitlana T yekuc hev a, Ina Jazic, Xin Victoria W ang, Mahnaz Ahmadifar, Mic hael J Birrer, Giov anni P armigiani, et al. curatedOv arianData: clinically annotated data for the ov arian cancer transcriptome. Datab ase: the journal of biolo gic al datab ases and cur ation , 2013, 2013. [39] MC Whitlo c k. Com bining probability from indep enden t tests: the weigh ted Z-metho d is sup erior to Fisher’s approac h. J. Evol. Biol. , 18(5):1368–1373, 2005. [40] D.B. W est et al. Intr o duction to gr aph the ory . Pren tice Hall Upper Saddle Riv er, NJ, 2001. [41] F.R.K. Chung. Sp e ctr al gr aph the ory . Amer Mathematical So ciet y , 1997. [42] A.Y. Ng, M.I. Jordan, and Y. W eiss. On sp ectral clustering: Analysis and an algorithm. A dv. in Neur al Info. Pr o c. Systems , 2:849–856, 2002. [43] F atihcan M A tay , T urker Biyikoglu, and J. Jost. Netw ork synchronization: Sp ectral versus statistical prop erties. Physic a D , 224(1-2):35–41, 2006. [44] W. Lu and T. Chen. Global synchronization of discrete-time dynamical net w ork with a directed graph. IEEE T r ans. , 54(2):136, 2007. [45] Rosemary Braun, Greg Leibon, Scott P auls, and Daniel Ro c kmore. Partition decoupling for m ulti-gene analysis of gene expression profiling data. BMC Bioinformatics , 12(497), 2011. [46] Jianer Chen, Xiuzhen Huang, Iy ad A Kanj, and Ge Xia. Strong computational low er b ounds via parameterized complexit y . Journal of Computer and System Scienc es , 72(8):1346–1367, 2006. [47] MEJ Newman. Detecting comm unity structure in netw orks. Eur. Phys. J. B , 38(2):321–330, Dec 2004. [48] Leon Danon, Albert Díaz-Guilera, Jordi Duc h, and Alex Arenas. Comparing comm unit y structure iden tification. J. Stat. Me ch. , 2005(09):P09008–P09008, Sep 2005. [49] D. Marbach, R.J. Prill, T. Sc haffter, C. Mattiussi, D. Floreano, and G. Stolo vitzky . Revealing strengths and w eaknesses of metho ds for gene net work inference. PNAS , 107(14):6286–6291, 2010. [50] T. Manoli, N. Gretz, H.J. Gröne, M. Kenzelmann, R. Eils, and B. Brors. Group testing for pathw a y analysis impro ves comparabilit y of different microarra y datasets. Bioinformatics , 22(20):2500, 2006. [51] D Hanahan and R A W einberg. The hallmarks of cancer. Cel l , 100(1):57–70, 2000. 26 [52] Gad Singer, Robert Oldt, Y oram Cohen, Bran t G W ang, David Sidransky , Rob ert J Kurman, and Ie-Ming Shih. Mutations in braf and kras c haracterize the dev elopment of low-gr ade ov arian serous carcinoma. J. Natl. Canc er Inst. , 95(6):484–486, 2003. [53] Russell V ang, Ie-Ming Shih, and Rob ert J Kurman. Ov arian low-grade and high-grade serous carcinoma: pathogenesis, clinicopathologic and molecular biologic features, and diagnostic problems. A dvanc es in A natomic Patholo gy , 16(5):267, 2009. [54] Gordon K Smyth. Limma: linear mo dels for microarray data. In Bioinformatics and c omputational biolo gy solutions using R and Bio c onductor , pages 397–420. Springer, 2005. [55] Jitao David Zhang and Stefan Wiemann. KEGGgraph: a graph approach to KEGG P A THW A Y in R and BioConductor. Bioinformatics , 25(11):1470–1471, 2009. [56] Ara vind Subramanian, P ablo T amay o, V amsi K Mo otha, Sa yan Mukherjee, Benjamin L Eb ert, Michael A Gillette, Amanda Paulo vic h, Scott L Pomero y , T o dd R Golub, Eric S Lander, and Jill P Mesirov. Gene set enric hment analysis: a knowledge-based approach for interpreting genome-wide expression profiles. PNAS , 102(43):15545–50, 2005. [57] Luk e Tierney , A. J. Rossini, Na Li, and H. Sev ciko v a. snow: Simple Network of W orkstations , 2013. R pac k age v ersion 0.3-13. [58] R. Gentleman, Elizab eth Whalen, W. Hub er, and S. F alcon. gr aph: A p ackage to hand le gr aph data structur es . R pack age version 1.40.1. [59] Gabriele Sales, Enrica Calura, and Chiara Rom ualdi. gr aphite: GRAPH Inter action fr om p athway T op olo gic al Envir onment , 2014. R pack age v ersion 1.10.0. [60] Lauren t Jacob. NCIgr aph: Pathways fr om the NCI Pathways Datab ase , 2012. R pac k age v ersion 1.10.0. [61] Gregory Leib on, Scott P auls, Daniel Ro c kmore, and Rob ert Sav ell. T op ological structures in the equities mark et netw ork. PNAS , 105(52):20589–20594, December 2008. [62] D.L. Wheeler, T. Barrett, D.A. Benson, S.H. Bry ant, K. Canese, V. Chetvernin, D.M. Churc h, M. DiCuc- cio, R. Edgar, S. F ederhen, et al. Database resources of the National Center for Biotechnology Informa- tion. Nucl. A cids R es. , 35(Database issue):D5, 2007. [63] P atric RJ Östergård. A fast algorithm for the maximum clique problem. Discr ete Applie d Mathematics , 120(1):197–207, 2002. 27 Supplemen tary Information > h s a 0 0 1 9 0 . g n l A g r a p h N E L g r a p h w i t h d i r e c t e d e d g e s N u m b e r o f N o d e s = 1 3 3 N u m b e r o f E d g e s = 1 3 2 > ( h s a 0 0 1 9 0 . m r l < - m o r a l i z e ( h s a 0 0 1 9 0 . g n l ) ) A g r a p h N E L g r a p h w i t h u n d i r e c t e d e d g e s N u m b e r o f N o d e s = 1 3 3 N u m b e r o f E d g e s = 1 0 7 8 > q p G e t C l i q u e s ( h s a 0 0 1 9 0 . m r l ) 1 / 1 3 3 ( m a x 1 ) 0 . 0 0 s ( 0 . 0 0 s / r o u n d ) 1 0 4 / 1 3 3 ( m a x 1 ) 0 . 1 0 s ( 0 . 0 0 s / r o u n d ) 1 0 5 / 1 3 3 ( m a x 1 ) 0 . 2 0 s ( 0 . 1 0 s / r o u n d ) 1 0 6 / 1 3 3 ( m a x 1 ) 0 . 4 1 s ( 0 . 2 0 s / r o u n d ) 1 0 7 / 1 3 3 ( m a x 1 ) 0 . 8 2 s ( 0 . 4 1 s / r o u n d ) 1 0 8 / 1 3 3 ( m a x 1 ) 1 . 6 6 s ( 0 . 8 4 s / r o u n d ) 1 0 9 / 1 3 3 ( m a x 1 ) 3 . 3 2 s ( 1 . 6 6 s / r o u n d ) 1 1 0 / 1 3 3 ( m a x 1 ) 6 . 6 6 s ( 3 . 3 4 s / r o u n d ) 1 1 1 / 1 3 3 ( m a x 1 ) 1 3 . 3 5 s ( 6 . 7 0 s / r o u n d ) 1 1 2 / 1 3 3 ( m a x 1 ) 2 6 . 7 8 s ( 1 3 . 4 2 s / r o u n d ) 1 1 3 / 1 3 3 ( m a x 1 ) 5 3 . 7 0 s ( 2 6 . 9 2 s / r o u n d ) 1 1 4 / 1 3 3 ( m a x 1 ) 1 0 7 . 6 7 s ( 5 3 . 9 8 s / r o u n d ) 1 1 5 / 1 3 3 ( m a x 1 ) 2 1 5 . 8 6 s ( 1 0 8 . 1 9 s / r o u n d ) 1 1 6 / 1 3 3 ( m a x 1 ) 4 3 2 . 7 1 s ( 2 1 6 . 8 5 s / r o u n d ) 1 1 7 / 1 3 3 ( m a x 1 ) 8 6 6 . 7 8 s ( 4 3 4 . 0 7 s / r o u n d ) 1 1 8 / 1 3 3 ( m a x 1 ) 1 7 3 6 . 2 0 s ( 8 6 9 . 4 2 s / r o u n d ) 1 1 9 / 1 3 3 ( m a x 1 ) 3 4 7 7 . 4 2 s ( 1 7 4 1 . 2 3 s / r o u n d ) 1 2 0 / 1 3 3 ( m a x 1 ) 6 9 6 4 . 6 9 s ( 3 4 8 7 . 2 7 s / r o u n d ) 1 2 1 / 1 3 3 ( m a x 1 ) 1 3 9 4 8 . 8 9 s ( 6 9 8 4 . 1 9 s / r o u n d ) 1 2 2 / 1 3 3 ( m a x 1 ) 2 7 9 4 8 . 8 1 s ( 1 3 9 9 9 . 9 2 s / r o u n d ) . . . T able S1: R output showing exp onen tial cost of the maximal clique problem for a the o xidative phosphorylation KEGG path wa y . hsa00190 is a mo destly sized 133 no des and 132 edges (b elow the median across all KEGG graphs). After moralization, ho wev er, it b ecomes considerably more dense, jumping to 1078 edges. Finding cliques in a graph of this size is a c hallenging task. T op ologyGSA does this with qpGetCliques() , which is an R in terface to the GNU GPL Cliquer library implemen ting Östergård’s algorithm [63], the fastest maximal clique algorithm to date. The algorithm uses a branch-and-bound pro cedure, in whic h first small subgraphs of S no des are searched for maximal cliques. Once found, the size of the subgraph is incremented and searched again, un til either all no des are in the subgraph S = 133 or when increasing the subgraph would not permit the maximal clique found to that point. Because maximal clique is an NP-hard problem, the cost increases exp onen tially with eac h increase in subgraph size, as can b e seen here with the dense moralized hsa00190 graph. Th e first column of the timing output shows the progress of the calculation as the subgraph size is increased. In the second column, the accumulated runtime is recorded, while the last column gives the amount of time required since the previous search round finished clique was found. The exp onen tial increase in hardness as is clearly visible. Timing was stopp ed after approximately 8h, before the algorithm could complete. Extrap olating from this data, running to completion could take as muc h as ∼ 57042500 sec, nearly tw o years. 28 Figures S1: supp.xStudyP airs.p df Plots of p -v alue correlations b et w een different studies for each of the 10 metho ds, along with the gene-wise p -v alue correlations. − log 10 p v alues are plotted against each other abov e the diagonal; b elo w, the correlation co efficien ts are given. Note that in NEA (pg 9), a huge n um b er of pathw a ys “saturated” the test, with none of 1000 p erm utations yielding statistics comparable to those observed, suggesting p ossible issues with the n ull mo del. Figures S2: supp.xMetho dP airs.p df Plots of p -v alue correlations b et ween differen t metho ds for each of the 10 studies. − log 10 p v alues are plotted against eac h other ab o v e the diagonal; below, the correlation co efficien ts are given. 29
Original Paper
Loading high-quality paper...
Comments & Academic Discussion
Loading comments...
Leave a Comment