Efficient Independence-Based MAP Approach for Robust Markov Networks Structure Discovery
This work introduces the IB-score, a family of independence-based score functions for robust learning of Markov networks independence structures. Markov networks are a widely used graphical representation of probability distributions, with many appli…
Authors: Facundo Bromberg, Federico Schl"uter
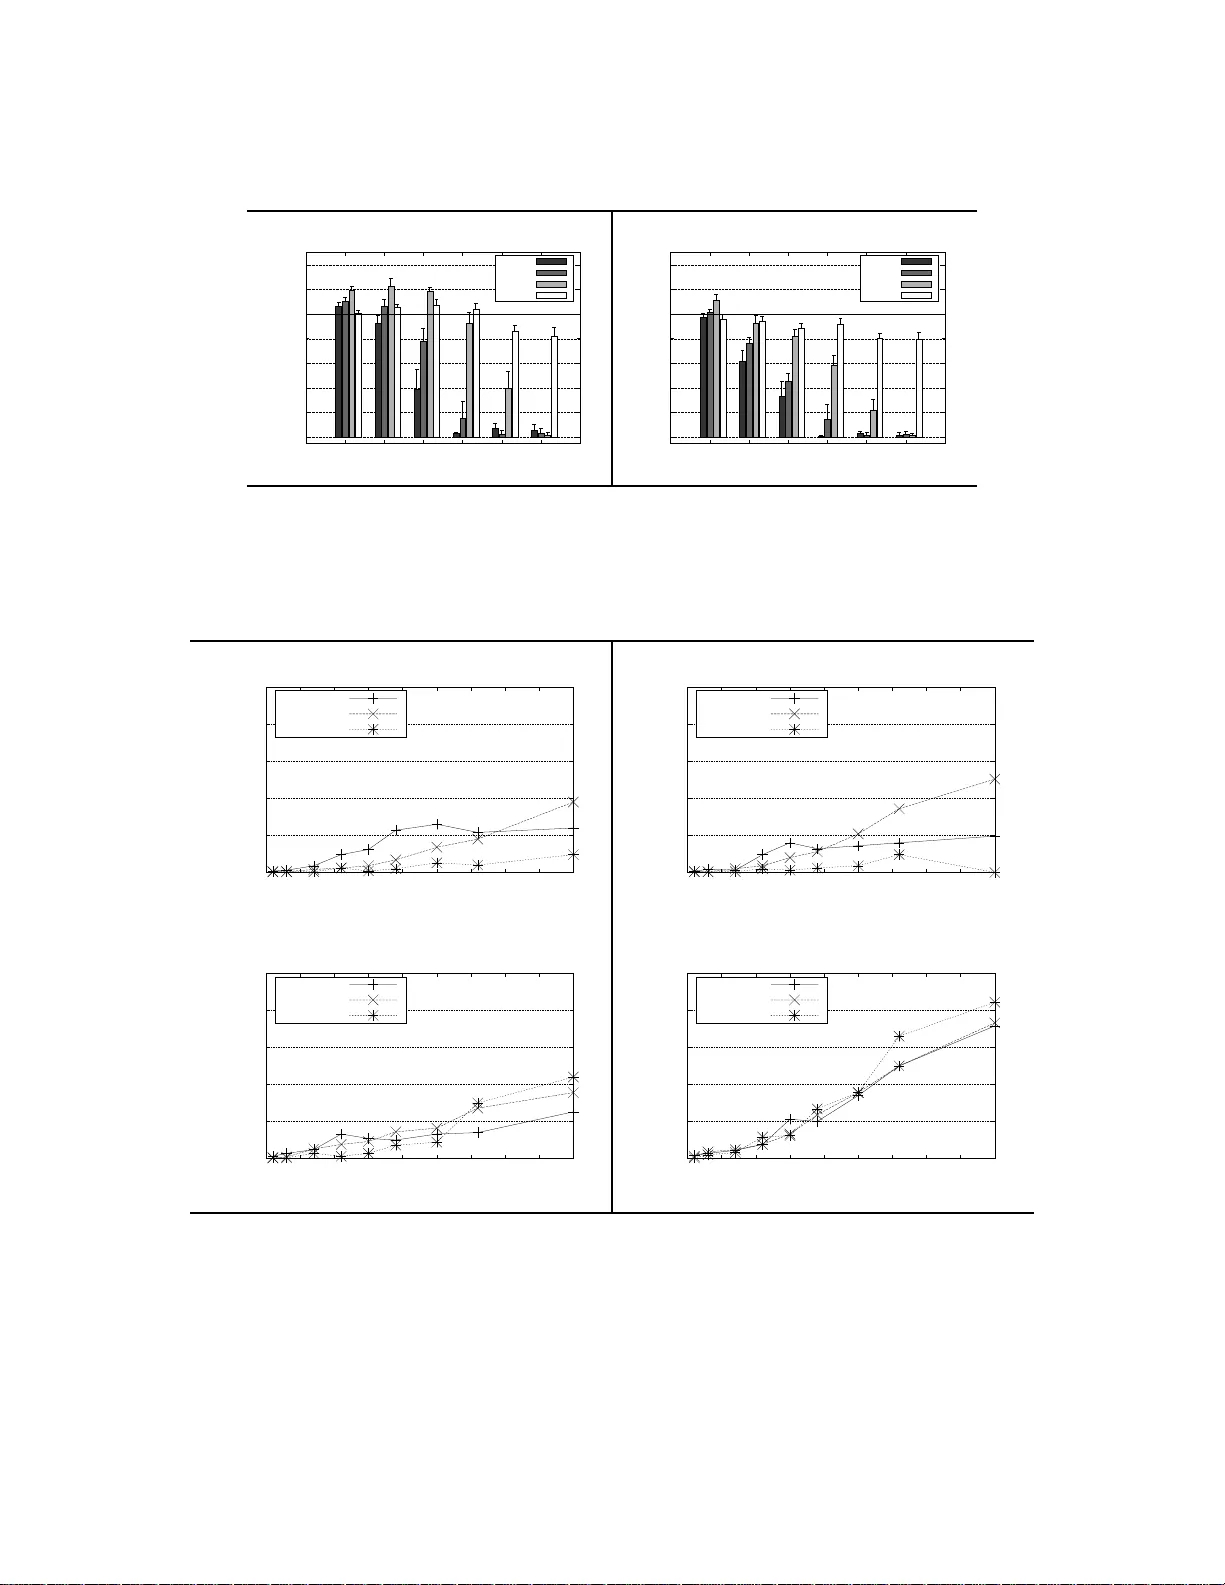
Efficien t Indep endence-Based MAP Approac h for Robust Mark o v Net w orks Stru c tu r e Disco v ery F acundo Brom b erg fbr o mber g@frm.utn .edu.ar F ederico Sc hl ¨ uter federico.schluter@frm.utn.edu.ar Information Systems Dep artment National T e ch n olo gic al University, F acultad Re gio n al Mendoza R o driguez 273, CP 550 0, Mendoza, Ar gentina Editor: Abstract This work in tro duces the IB-s core , a family o f independence- based scor e functions for ro- bust lear ning of Mark ov netw or ks indep endence structures. Marko v netw or ks are a widely used gra phical representation of probability distributions, with many applications in sev- eral fields of science. The main a dv ant age of the IB- score is the p oss ibilit y o f computing it without the need of es timation o f the numerical parameter s, an NP - hard pr o blem, usua lly solved thro ugh an approximate, data - intensiv e, iter a tive optimizatio n. W e derive a fo rmal expression for the IB -score fro m first principles, ma inly maximum a p osteriori and co ndi- tional indep endence prop erties, and exe mplify several instantiations of it, r esulting in tw o nov el a lgorithms for structure lear ning: IBMAP-HC and IBMAP-TS . Exp erimental re- sults ov er b oth ar tificial and real world d ata show these algorithms achiev e impo r tant error reductions in the learnt structures when compared with the s ta te-of-the-ar t indep endence- based structure learning a lgorithm GSMN, achieving increments o f mor e than 50% in the amount of indep endencies they enco de co r rectly , a nd in some cases, lear ning corre ctly ov er 90% of the edg es that GSMN learnt incorre c tly . Theoretical ana lysis s hows IBMAP-HC pro ceeds efficiently , achieving these improv ements in a time p olynomia l to the num b e r of random v ariables in the domain. Keyw ords: Graphical Mo dels, Structure Discovery , Indep endence- based , Scor e-based, Marko v netw orks, Reliability . 1. In tro duction The p resen t w ork presen ts a no v el approac h for the problem of lea r ning the indep en- dence stru cture of a Mark ov net w ork ( MN ) fr om data b y taking a maximum-a-p osteriori ( MAP ) B a ye s ian p ersp ectiv e of the indep endence-based approac h (Spir tes et al., 2000). Indep endence-based algorithms learn the structure by p erformin g a su ccession of statistical tests of indep endence among differen t groups of random v ariables. T hey are app ealing for t wo imp ortan t reasons: they are amenable to p ro of of correctness (un der assumptions, s ee more details on these and other Mark o v n et wo rk concepts in the next section b elo w); and they are efficient , reac h ing time complexities of O ( n 2 ) in the w ors t case, with n the num b er of random v ariables in th e domain. This runtime is an ov erwhelming impro vemen t ov er score-based approac h es such as maxim um-like liho o d, that has su p er-exp onen tial runtime (more later). 1 Unfortunately , the ab o ve holds only in th eory , as the correctness of th e algorithms, i.e., the guaran tee they pr o duce the correct structure, is compromised when the in d ep end ence decision of the statisti cal tests is unreliable, an almost certain t y when these tests are p er- formed on data. Moreo ver, as we discuss in m ore detail in the follo w in g sections, f or tests to b e reliable they require data with size exp onential in the n u m b er of v ariables n .T o address these imp ortant concerns , the present w ork fo cuses on algorithms for impro ving the qu alit y of indep endence-based app roac hes, w hile main taining a manegeable runtime. Our main contribution is the IB- sc or e , the result of a hybrid app roac h b et we en indep en- dence and score based approac h es, with imp ro vemen ts ov er b oth. O n one hand, generalizing on previous w orks, e.g. (Margaritis and Bromberg, 2009), it impro v es th e qualit y of existing indep en d ence-based algorithms b y taking a Bay esian, MAP approac h, mo delling explicitly the p osterior distr ibution of structures giv en the data. On the other, it can b e computed efficien tly , con trary to existing scores, as it do es not requ ire estimating the mo del p aram- eters, an NP-hard computation usually appr o ximated through a data-in tensiv e iterativ e algorithm. This is ac hiev ed by fi rst mo delling the uncertain ty in the indep end encies as random v ariables, and then expan d ing th e p osterior o v er these indep enden cies, an op era- tion that results in an expr ession for the p osterior of the stru ctur es dep end ent only on th e p osterior of indep endence assertions, that can b e computed efficient ly (c.f. § 3). W e no w pro ceed in the n ext Section 2 to discuss in more detail man y of these concepts and algorithms, in clud ing a th orou gh literature review. F ollo wing, Section 3 formalizes and deriv es the I B-score f r om fi rst-principles. Sectio n 4 in tro duces tw o algorithms IBMAP- HC and IBMAP-TS , eac h exemp lifyin g t w o different p ossible optimization searc hes for the MAP , and t wo different p ossible instantiat ions of the IB-score. Then, in Section 5 w e present exp erimen tal results that confir m the r ob u stness of IBMAP-HC and I BMAP- TS, and the p olynomial ru nt ime of IBMAP-HC. T o conclude, we present a summ ary and p ossible directions of futu r e w orks in Section 6 . 2. Mark o v netw orks In this section w e d escrib e and m otiv ate MNs in more detail, comparing v arious existing approac hes for learning an indep en d ence structure from data (S ection 2.1), expanding on the deficiencies of the approac hes describ ed abov e, an d how our con tribu tion add resses these deficiencies successfully . The inno v ation rate of computing and digital storage capacit y is increasing r apidly as time p asses, pro du cing an imp ortan t increase in the data a v ailable in digital format. As a resp onse, the communit y of d ata mining and mac h ine learning is constan tly pr o ducing no vel and improv ed algorithms for extraction of the knowledge and information implicit in this d ata. Without a d oubt, the w ell-established probabilistic theory is a p ow er f ul mo d - eling to ol con tributin g to most of these algorithms, sp ecially w h en the data is uncertain (i.e., measuremen ts are noisy). Pr ob abilistic gr aphic al mo dels (P earl, 1988; Lauritzen, 1996 ; Koller and F riedman, 2009) are a family of m ulti-v ariate, efficien t probabilit y distributions that, by co difyin g implicitly the conditional in d ep end ences among the rand om v ariables in a domain, pro duce sometimes exp onent ial reductions in storage requirements and time- complexit y of statistical inference (more details b elow). These efficiencies are the reason 2 that probabilistic grap h ical m o dels (or simply graphical mo dels) h as had an increasingly imp ortant role in the analysis and design of mac hin e learning algorithms in recent yea r s. Examples of successful applicati ons include: computer vision (Besag et al., 1991; Anguelo v et al., 2005), restoration of noisy images, texture classification and image segmen tation; genetic re- searc h and disease diagnosis (F r iedm an et al., 2000); sp atial d ata mining suc h as geograph y , transp ort, ecology , and man y others (Shekhar et al., 2004). A graphical mo del is a p r obabilistic mo del ov er the join t set V of r andom variables . It consists in a set of n umerical parameters Θ , and a graph G which enco d es — compactly— indep en d ences among all the random v ariables of the domain. The edges of G r epresent explicitly all th e p ossible probabilistic conditional indep endences among the v ariables, th u s called sometimes the indep endenc e structur e or s im p ly structur e of the domain. W e are in terested in the p roblem of learning a graphical mo del f r om data, that consists in learning b oth the indep end ence structure G , and the n umerical parameters Θ , as illustrated in Fig. 1. As in any statisti cal mo deling pr o cess, w e assu me the data a v ailable (Fig. 1, cen ter) is a sampling of some unknown und erlying probability distribu tion (Fig. 1, left), and learning consists in pro ducing a s tructure G and parameters Θ (Fig. 1, right) that b est fi t the data, with the hop e that this mo del matc hes th e und erlying distr ib ution. Figure 1: Outline of the problem: w e hav e at our disp osal a dataset (cente r ), assumed to b e a sampling of some un kno w n underlying probabilit y d istribution (left). Learn ing consists in analyzing the inp ut dataset to pro d uce a mo d el distribu tion (left). Learning consists in analyzing the input dataset to pro du ce a mo d el that b est fits it (righ t), with the h op e that it matc hes th e underlyin g mo d el. There are t wo predominant types of graphical mo dels: Bayesian networks ( BN ) and Markov networks ( MN ). F or BNs, G is a dir ected and acyclic graph, and for MNs, G is an un directed graph. These t wo families differ in the indep endencies they can encod e. Not all sets of indep endences —and therefore not all th e p robabilit y distributions— are represent able b y graphs, and moreo ver, some sets of indep endences —and therefore some distributions— are only representable by a BN, and others only by a MN (and s ome exists that cannot b e represen ted b y neither a BN nor MN). F or the case of MNs (our fo cus in this wo rk), distribu tions that can b e f aithful ly represen table by u ndirected graphs are called gr aph-isomorph (see (P earl , 1988) for more d etails). A common practice, and one we follo w in th is work, is to assume that the und erlying distribution (of wh ich the input data is a sample) is graph-isomorph. 3 In wh at follo ws, w e use capitals X , Y , Z , . . . to denote random v ariables, and b old capitals X , Y , Z , . . . to denote sets of rand om v ariables. W e denote by V the set of all the random v ariables in the problem domain, and its cardinalit y by n , i.e., | V | = n . In this w ork, w e assume that all v ariables in V are discrete. W e d enote th e input dataset b y D , and its cardinalit y (i.e., the num b er of d ata p oints) by N . As we s aid b efore, a MN consists in a set of n umerical parameters Θ , and a graph G th at enco d es conditional indep endences among th e random v ariables cont ained in the set V . W e u se the notatio n I ( X, Y | Z ) to denote the conditional indep endence p redicate I o v er the triplet ( X, Y | Z ) which is true ( false ) wh enev er X is indep endent (dep end en t) of Y , giv en the set of v ariables Z . The graph G consists of n n o des, one for eac h X ∈ V , and a set of edges E ( G ) b etw een this no des that enco de the set of all pr ob ab ilistic conditional indep endences among the random v ariables in V . Fig. 2 sho ws an example of a MN. T he enco ding of ind ep endences in a MN is as follo ws: ( X, Y ) ∈ E ( G ) ⇔ ∀ Z ⊆ { V − { X , Y }} , ¬ I ( X , Y | Z ) (1) In other wo r ds, an edge b et ween tw o v ariables X and Y enco des the fact that X is dep end en t of Y , conditioned on any set Z ⊆ { V − { X , Y }} , and the lack of an edge b et ween v ariables X and Y means that ∃ Z ⊆ { V − { X, Y }} that satisfies I ( X, Y | Z ). As shown in Pe arl (1988), when the un d erlying mo del is graph-isomorph, the enco ding is equiv alent to reading indep en d ences thr ough vertex-sep ar ation , i.e., t wo v ariables X and Y are indep endent (dep end ent) according to the graph giv en the set Z , if and only if v ariables X and Y are disconnected (connecte d) in the sub -graph of G resulting from r emo ving all edges in ciden t in a v ariable in Z . In other w ord s, the set Z interce p ts (do es n ot in tercepts) ev ery path fr om X to Y . T o illustrate, consider v ariables 0 and 5. These v ariables are dep end en t given { 2 } b ecause there is still a path through v ariable 3, and th u s in dep end en t giv en { 2 , 3 } . Figure 2: An example Mark o v n et work with 7 no des. As ment ioned, the strength of graphical mo dels, b oth MNs and BNs, lies in the some- times exp onent ial reduction in storage capacit y and time complexit y of statistical infer- ence. Storage and statistical inf erence (mostly marginalization) is exp onential b ecause the represent ation of a m u lti-v ariate joint p robabilit y distrib ution ov er V consists in a multi- dimensional table with n + 1 column s, and exp onen tially many tup les, eac h consisting in a complete assignment s of the n v ariables, and on e column to store the pr obabilit y of that assignmen t. Fig. 3 (left) illustrates the table for th e join t pr obabilit y of a system of n binary 4 v ariables (i.e., that can tak e any of t wo v alues), consisting on 2 n tuples, one p er configura- tion. Th e exp onentia l reduction in storage and inference o ccurs b ecause certain conditional indep en d ences allo w a decomp osition of the join t p robabilit y in to a pro duct of factor or p otential f unctions, eac h quantified by the parameters Θ , and dep end en t on only a subs et of V . F or instance, it is a well -kno wn fact that wh en all n v ariables in V = { V 1 , ..., V n } are m utually indep enden t, P r( V 1 , ..., V n ) = n Q i =1 Pr( V i ). S ince the tables associated w ith a function ov er some set of v ariables is exp onen tial in the n u m b er of v ariables in that s et (as exemplified earlier in this paragraph for the case of the join t), the d ecomp osition requires then a p olynomial n u m b er of (exp onential ly) smaller tables. Moreo v er, it can b e shown that in man y cases the num b er of v ariables in eac h factors is b ounded by a small n um b er, resulting in the exp onential reduction in b oth storage and marginalizat ion. T o con tinue with our example, the decomp osition of th e n binary v ariables results in n tables with only 2 tuples eac h, as illustr ated in Fig. 3 (righ t). An imp ortan t difference b et w een MNs and BNs lies in the prop erties of th eir factor functions. The factor functions of MNs are not normalized, th us, in order to obtain a fully qu antified probabilistic mo del, an exp onent ial computation of a normalization constan t (known as the p artition function ) o ver all p ossible assignmen ts of the n v ariables is requir ed. BNs, instead, allo w a f actorizat ion of th e join t distribution into conditional probabilit y distribu tions, i.e., normalized factors, that can thus b e learned efficien tly from data (do es not require normalization). V 1 V 2 ... V n Pr( V 1 , .., V n ) 0 0 ... 0 0.121 0 0 ... 1 0.076 . . ... . . . . ... . . . . ... . . 1 1 ... 0 0.21 1 1 ... 1 0.12 ⇒ V 1 Pr( V 1 ) 0 0.21 1 0.79 , V 2 Pr( V 2 ) 0 0.45 1 0.55 ... V n Pr( V n ) 0 0.42 1 0.58 Figure 3: Storage reduction o ver n binary v ariables from 2 n to 2 n . 2.1 Structure learning algorithms: bac kground and related wo rk In this s ection w e discuss the pr ob lem, and motiv ate our approac h for solving it, in the con text of existing algorithms for learning stru ctur e from data. Historically , the literature h as pr esen ted t w o b road approac h es for learning MNs: sc or e- b ase d algorithms, and indep endenc e-b ase d (also called c onstr aine d-b ase d ) algorithms. Score- based algo rithms, exemplified by Lam and Bacc h u s (1994); McCallum (2003); Acid and d e Camp os (2003), p erform a searc h on the space of all p ossible graphs to fi nd the stru cture w ith maxi- m u m score. These algorithms differ in the ap p roac h tak en to explore the space of all graphs (sup er-exp onen tial in size, e.g., th ere are 2 ( n choose 2) undirected graph s with n no d es), and in th e fu n ctional form , and theoretical justification, for the score. Examples of s cores are maximum lik eliho o d P r ( D | G, Θ ) of the data D giv en the mo del ( Θ , G ) (Besag, 1974), 5 minimum description leng th of the mo del ( Θ , G ) (Lam and Bacc hus, 1994), or pseudo- lik eliho o d (Besag, 1975; Y u and Cheng, 2003; Koller and F riedm an, 2009)), again of the D giv en the mod el ( Θ , G ). The last approac h , p seudo-lik eliho o d, int ro duces an app ro ximate expression for compu ting the like liho o d that do es not require the n ormalization of the mo del (i.e., the compu tation of its normalizatio n constan t). T o compu te the score of eac h struc- ture G “visited” dur ing the searc h, it is necessary to estimate th e parameters Θ . F or BNs this op eration can b e p erformed efficien tly (Hec kerman et al., 1995), bu t for MNs this is a costly op eration that consists in an optimization in itself (Besag, 1974; Y u and Chen g, 2003; Koller and F riedman, 2009). F or ins tance, in the case of the lik eliho o d , the optimizatio n w ould b e o ver th e space of parameters, for a fixed stru cture G . W e will later show that our approac h, although it requires a search o ver th e space of stru ctures, can compu te efficien tly the (indep endence-based) score at eac h step as it d o es not requir e the estimation of th e parameters. Indep endence-based algorithms (S pirtes et al., 2000; Aliferis et al. , 2003; Tsamardinos et al., 2003; Bromb er g et al., 2009; Margaritis and Bromberg, 2009) ha ve the abilit y to learn the indep en d ence stru cture efficien tly , as they do not require n either a search o ver structures, nor the estimation of p arameters at eac h s tep of their execution (of cour se, in order to ob- tain a complete mo d el ( G, Θ ) they do need to estimate the parameters once the structur e has b een learned). In stead, these algorithms tak e a rather direct approac h for construct- ing the indep endence str ucture b y inquiring ab out the conditional ind ep enden ces that hold in the inpu t data. This inquiry is p erformed in p ractice through statistical tests such as P earson’s χ 2 test (Agresti, 2002), more recently th e Bayesian test (Margariti s , 2005; Margaritis and Brom b erg, 2009), and for con tinuous Gaussian data the p artial c orr elation test (S p irtes et al., 2000), among others. A t eac h step, these algorithms p rop ose a triplet ( X, Y | Z ) and inquir e the data whether ind ep enden ce or dep endence holds for th at tr ip let. Whic h triplet is prop osed at s ome step dep ends on the in dep end ence information the al- gorithm has up to that p oint , that is, wh ic h triplets has b een prop osed so far, and th eir corresp ondin g ind ep endence v alue. T o find the structure consisten t with th is indep endence information, these algorithms pr o ceed by discarting, at eac h step, all th ose structures that are inconsistent (i.e., do not enco d e) the ind ep end en ce j ust learned , un til all but one s truc- ture has b een discarded . Algorithms exist th at require a num b er of tests that is p olynomial in the n um b er n of v ariables in the domain, which, toget her with th e fact that statisti- cal tests can b e executed in a ru nning time prop ortional to the n umb er of data p oin ts N in the dataset, result in a total runnin g time th at is p olynomial in b oth n and N . On top of their efficiency , another imp ortan t adv an tage of these algorithms, is that, und er as- sumptions (statistical tests are correct, and the und erlying mo del is graph -isomorp h ), it is p ossible to pro v e the correctness of these algorithms, i.e., that they return the structure of the u nderlying mo del. F or a thorough example of su ch pro of w e refer th e reader to Brom b erg et al. (2009). Unfortunately , statistical indep endence tests are n ot alw a ys reli- able. Most indep endence-based algorithms are oblivious to this fact, evident fr om their design, whic h discards structures based on a single test. If the test is wrong (i.e., it asserts indep en d ence wh en in fact the v ariables in the triplet are dep end ent, or vice v ersa), the underlying (true) str ucture ma y b e d iscarded. This prob lem is not to b e underestimated b e- cause the qualit y of statistical ind ep enden ce tests degrades exp onen tially with the n um b er of v ariables inv olv ed in the test. F or example, (Co chran, 1954) recommends that P earson’s 6 χ 2 indep en d ence test b e deemed u nreliable if more th an 20% of the cells of th e tests con- tingency table ha ve an exp ected count of less than 5 data p oints. Sin ce the con tingency table of a conditional ind ep end ence test o ve r ( X, Y | Z ) is d -dimensional, with d = 2+ | Z | (Agresti, 2002), the num b er of cells, and th us the num b er of data p oints required, gro w s exp onentia lly with the size of the test. I n other words, for a fi xed size dataset, the qualit y of the test degrades exp on entially with the size of its conditioning set. This problem has b een addressed by Brom b erg and Margaritis (2009) usin g Argumen - tation. Their approac h m o deled th e pr oblem as an in consisten t kno wledge base consisting on Pe arl’s axioms of conditional indep end ence as rules, and the triplets and their corre- sp ond ing assignmen ts of indep endence v alues as fact pr edicates. If the u nderlying mo d el is graph-isomorph, its set of indep endencies must satisfy the axioms (see Pearl (198 8); Koller and F riedman (2009) for d etails). In practic e, h o wev er , ind ep endencies a re not queried directly to the underlyin g mo del, bu t to its sampled dataset. These in d ep end encies ma y b e un reliable, and thus ma y violate the rules. Argumentati on is an in ference p ro cedure designed to work in inconsisten t kno wledge bases. Brom b erg and Margaritis (2009) used this framework to infer indep endencies, sometimes resulting in inf er r ed v alues different than measured v alues. T aking the inferred v alue as the correct one, they obtained imp ortan t im- pro vemen ts in the qu alit y of the reliabilit y of statistica l ind ep enden ce tests, and thus of the indep en d ence stru ctures disco ve red. W e p resen t here an alternative appr oac h to the un reliabilit y problem. O u r approac h is inspired b y the w ork of Margaritis and Bromb erg (2009), that d esigned an algorithm that instead of d iscarding str uctures based on outcomes of statistical tests, main tains a d istr ibu- tion ov er structures conditioned on the data, i.e., the p osterior distrib ution of the s tr uctures. T o learn the structure, the algorithm tak es the m aximum-a-p osteriori approac h . In the next section we p resen t the IB - sc or e (ind ep enden ce-based score), an expression f or computing ef- ficien tly the p osterior of some structure based on outcomes of statistical indep endence tests, and in the follo wing s ections w e use this score in t w o d ifferen t algorithms that conduct the searc h f or its maxim um . The resulting algorithms are hybrids of score and indep endence based algorithms. Score-based b ecause they pro ceed by maximizing a score, i.e., the p oste- rior of th e structures given the data or as w e call it, the IB-score; and indep end ence-based, b ecause the IB-score is computed th rough statistical tests of in dep end ence (thus its name). Ho we v er, con trary to previous score-based approac hes, the compu tation of the score (the IB-score) do es not require the estimation of the numerical p arameters Θ and is therefore efficien t. 3. Our approac h: indep endence-based MAP structure learning As discussed in the p revious section, in d ep end ence-based algorithms has the adv an tage of not requiring neither a searc h o ve r structur es, nor an interlea ved estimation of the param- eters estimation at eac h iteration of the searc h (a searc h in itself, (Y u and Ch eng, 2003)). Unfortunately , these adv anta ges are comp ensated by a ma jor r obustness problem as the v ast ma jorit y of the ind ep end en ce-based algorithms rely b lindly on the correctness of the tests they p erform, with the r isk of discarting the true, underlying structure when th e test is incorrect. This pr ob lem is exacerbated by th e fact that the r eliabilit y of statistica l in- dep end ence tests d egrades exp onent ially with the size of the conditioning set of the test 7 (for some fixed size d ataset). T o o verco me th is r obustness problem w e tak e a Ba yesian approac h, insp ired and extended fr om (Margaritis, 2005; Margaritis and Brom b erg, 2009). This app roac h m o dels the problem of MN structur e learning as a distrib ution o v er structur e giv en the data, i.e., the p osterior d istribution of structur es. Under th is m o del, structures that are inconsisten t with the ou tcome of a test are not discarded, but their probabilit y is reduced. T h e app roac h take n is a combinatio n of score and in d ep end ence based algorithms for structure learning. Score-based b ecause we searc h for the structure G ⋆ whose p oste- rior p robabilit y Pr( G | D ) is maximal, that is, we tak e the maximum-a-posteriori ( MAP ) approac h: G ⋆ = arg max G Pr( G | D ) , (2) and indep end ence-based b ecause the expression obtained f or compu ting the p osterior probabilit y is based on the outcome of statistical ind ep end en ce tests, as explained in detail in the follo wing section. Later, in section 4 we present t wo pr actical algorithms for conducting the maximization: I BMAP-HC (In dep en d ence-based m axim um a p osteriori h ill clim b ing) and IBMAP-TS (Indep en d ence-based maxim um a p osteriori tree searc h). 3.1 Indep endence-based p osterior for MN structures: the IB-score In this section we present th e IB-sc or e , a computationally feasible expression for the p os- terior Pr ( G | D ). W e pro ceed b y re-expressing the p osterior of structure G in terms of the p osterior of a particular set of indep endence assertions C ( G ) we call the closur e , and then, through appr o ximating assump tions, obtain an efficient ly compu table exp ression for the p osterior we call the IB-score. Let us first define formally the closur e C ( G ) of a structur e G : Definition 1 (Closure) . A closur e of an undir e cte d indep endenc e structur e G is a set C ( G ) of c onditional indep endenc e assertions that ar e sufficient for determining G . W e can illustrate this definition by a couple of examples: Example 1. A c c or ding to Eq. (1), we c an c onstruct a c losur e for G by adding the assertion I ( X, Y | V − { X , Y } ) for ev e ry p air of variables X , Y ∈ V , X 6 = Y , for which ther e is no e dge in G , i.e., ( X , Y ) / ∈ E ( G ) . Otherwise, if ther e is an e dge b etwe en them, i. e ., ( X , Y ) ∈ E ( G ) , add the assertions ¬ I ( X, Y | Z ) for every Z ⊆ V − { X , Y } . Example 2. Our se c ond example c onsiders any indep endenc e- b ase d algorith m for which exists a pr o of of c orr e ctness; under the usual assumptions of f aithfulness and c orr e ctness of the indep endenc e assertions. That is, pr o of that when pr ovide d with c orr e ct indep endenc e values for e ach indep endenc e inquiry, the structur e G ⋆ output by the algorithm is the only one c onsistent with those values. Being G ⋆ the only p ossible structur e f or those indep en- dencies, the indep endencies determine G ⋆ , and they c onform a closur e. Examples of c orr e ct algorithms for MNs ar e the GSM N and GSIMN algorithms (Br omb er g et al., 2009). W e n o w prov e an imp ortant Lemma that asserts that the p osterior Pr( G | D ) of a structure exactly matc hes the p osterior Pr ( C ( G ) | D ), for any closure of G C ( G ). 8 Lemma 2 (Probabilistic equiv alence of structur es and closures) . F or any undir e cte d inde- p endenc e structur e G and any c losur e C ( G ) of G , it hold s that Pr( G | D ) = Pr ( C ( G ) | D ) . Pro of The p ro of pr o ceeds by incorp orating, in tw o steps, the information of in dep end ence assertions con tained in the closure C ( G ) of G into the p osterior Pr( G | D ). F irst, we mo del as random v ariables the u ncertain ty of ind ep enden ce assertions ob tained th r ough unreliable statistical indep endence tests. F ormally , the uncertaint y in the indep en d ence assertion I ( T ) = t , denoting th at the triplet T is indep endent (dep endent ) when t = true ( t = false ), is formalized b y a rand om v ariable T taking the v alues t ∈ { true , fals e } (note the notation o ve rload). Second, for eac h in dep en d ence assertion ( I ( T i ) = t i ) ∈ C ( G ), i = 1 , . . . , c , and c = |C ( G ) | , w e in corp orate T i (its corresp onding random v ariable) in to th e p osterior using the law of total pr ob ability , n amely: Pr( G | D ) = X t 1 ∈{ t , f } X t 2 ∈{ t , f } . . . X t c ∈{ t , f } Pr( G, T 1 = t 1 , T 2 = t 2 , . . . , T c = t c | D ) where t and f are abb reviations of true and fals e , resp ectiv ely . W e sim p lify this expres- sion by first collapsing the c u n i-dimensional summations o ve r { t, f } int o a single, m ulti- dimensional summation o v er { t, f } c , then abb reviating T i = t i b y t i , and th en { t 1 , t 2 , . . . , t c } b y t 1: c , obtaining Pr( G | D ) = X t 1: c ∈{ t , f } c Pr( G, t 1: c | D ) . Applying the c h ain ru le to the terms in th e sum mation w e obtain Pr( G | D ) = X t 1: c ∈{ t , f } c Pr( G | t 1: c , D ) × Pr( t 1: c | D ) No w, by definition of a closure, a stru cture G is determined b y its indep en dence asser- tions, i.e., the pr ob ab ility of G give n th ese assertions (and an y other v ariable suc h as D ), m u st equal 1. Mo reo ve r, if w e flip th e ind ep endence v alue of an y of these assertions, then it is clear that G cannot b e the s tructure, in other wo rds, its p robabilit y giv en the flipp ed assertions (and an y other v ariable such as D ) must b e 0. This results in the left f actor Pr( G | t 1: c , D ) in all terms of the summ ation b eing 0, except for the term contai ning the as- signmen ts consisten t w ith the closure (where it is 1). If we denote by { t G 1 , t G 2 , . . . , t G c } = t G 1: c these assignmen ts, w e get Pr( G | D ) = Pr( t G 1: c | D ) , and the lemma is prov ed b y noticing that t G 1: c is not more than the closure C ( G ). Unfortunately , to the b est of the authors k n o wledge, there is no metho d for computing the joint Pr( C ( G ) | D ) of many indep endence assertions. W e are forced then to mak e the 9 appro x im ation th at the indep endence assertions in the closure are all m u tually indep endent. This giv es u s the IB-score( G ) of G : c Pr( C ( G ) | D ) = IB-Score( G ) = Y ( I ( T )= t ) ∈C ( G ) Pr( T = t | D ) (3) whic h can now b e compu ted using the Ba y esian test of indep end ence of Margaritis (2005); Margaritis and Brom b erg (2009) to compute the factors Pr( T = t | D ). The appr o ximation implies that our b elief in the indep endence of an y triplet T in the closure is not affected b y our kno wledge that some other triplet T ′ in th e closure is inde- p end ent (or dep end en t). This m y n ot b e true in p ractice. It is certainly f alse w hen the t wo triplets are related through Pearl axioms of ind ep enden ce (Pearl, 1988). In that case they determine eac h other, i.e., Pr( T | T ′ , D ) = 1, and th us their join t prob ab ility is easily computable: P r( T , T ′ | D ) = Pr ( T | T ′ D ) × Pr( T ′ | D ) = Pr( T ′ | D ). F or triplets that are n ot related through Pea rl axioms we are forced into this appro ximation u n til a metho d for computing the j oin t o ver sev eral ind ep end ence assertions is dev elop ed (if this is at all p ossible). T o conclude this section we note th at we had made a single appro xim ation, namely , that the rand om v ariables of indep endence assertions are mutually indep endent. Th e expression found can b e computed efficien tly , with a runtime complexit y p rop ortional to the sum of the complexities of th e statistical tests p erformed for computin g the probability Pr( T = t | D ) of eac h factor. In Bromb erg and Margaritis (2009) it is argued that the computational cost of p erforming a statistical test on data for the triplet ( X , Y | Z ) is prop ortional to the n u m b er of data p oints in the d ataset, i.e., N , times the total num b er of v ariables inv olv ed in the test, i.e., 2 + | Z | . So in the worst case, the complexit y of the IB-score wo uld b e O ( |C ( G ) | .N .τ ∗ ) , (4) where τ ∗ = max T ∈C ( G ) | T | , i.e., the num b er of v ariables in th e triplet, among all trip lets in the closure, with the maxim um num b er of v ariables. 4. Practical algorithms for MAP optimization A full sp ecification of the MAP searc h of Eq. (2) requires the sp ecification of the searc h mec hanism and the closure c hosen for the structur es. W e pr esen t in wh at follo ws t wo approac hes: I BMAP-HC (Ind ep end en ce-based maxim u m a p osteriori h ill clim bing) and IBMAP-TS (Indep endence-based maxim um a p osteriori tree searc h ) that differ in b oth the searc h mec hanism (hill clim b ing and tree searc h, resp ectiv ely), and in the choic e of closure (Mark ov blanket based, and algorithm b ased, resp ectiv ely). The motiv ation for these c hoices is t w o-fold. First, they ser ve as more realistic examples of closures than those giv en in Section 3.1, and second, the more imp lemen tations of the IB-score, more robust the exp erimental conclusions. Let u s d iscuss in detail eac h of these approac h es. 4.1 IBMAP-HC: Indep endence-based MAP structure learning using hill clim bing and Mark o v based closure. W e pr o ceed now with the sp ecification of the closure and searc h pro cedure c hosen for IBMAP-HC. 10 Giv en a domain of v ariables V , n = | V | , we prop ose the h ill climbing lo cal searc h mec hanism for finding the b est structure in the space of all undir ected str uctures of size n . Starting f rom some structure G , the search pro ceeds fin ding th e str u cture G ′ with maxim u m IB-score among all stru cture one e dge-flip aw a y from G . An edge-flip of some p air of v ariables ( X , Y ), consists on removing the edge ( X, Y ) f rom G , if suc h edge exists, or adding it otherwise. The amount of n eigh b ors thus equals the num b er of p airs of v ariables, which is n ( n − 1) / 2. The algorithm conti n u es recursively fr om G ′ , until all stru ctur es one fl ip-a wa y has smaller I B-score, i.e., until the algorithm reac hes a lo cal maxima. As a starting structur e w e chose the structure output by th e GSMN algorithm (Brom b erg et al., 2009). T h is wa y , the hill clim bing searc h can b e seen as a p erturbation of the outpu t of GSMN, with the hop e that the lo cal maxima in the pro x im ity of GSMN has b etter qualit y . Exp erimen tal r esults confirm this is in fact the case. This could b e done of cour se with structur es outpu t by an y other structur e learnin g algorithm, although we exp ect impro v ements only on ind ep end ence- based algorithms. Our exp eriments show resu lts for GSMN only . F or the closure, w e c hose one based on Markov blankets . Let us first define the concept of Mark ov blank et an d then explain ho w it can b e used to sp ecify a closure. Definition (Pea rl (1988 ), p .97) . The Mark ov blanket of a variable X ∈ V is a set B X ⊆ V − { X } of variables that “shields” X of the pr ob abilistic i nfluenc e of variables not in B X . F ormal ly, for ev ery W 6 = X ∈ V , W / ∈ B X ⇒ I ( X , W | B X − { X , W } ) (5) A Mark o v b oundary is a minimal Markov blanket, i.e., non of its pr op er subsets satisfy Eq.(5). The sub straction of X and Y from B X in the consequent of Eq. (5) is redun dan t, as neither X nor Y are in the blank et, and it is mad e explicit for later con ve nience. Also, unless explicitly stated, fr om no w on an y mentio n of Mark ov blanket refers to a minim al Mark o v b lank et, that is, to a b oun dary . It can b e p r o ven that f or Mark ov b ound aries, the opp osite direction of Eq. (5) also holds, that is, Lemma 3. F or ev ery W 6 = X ∈ V , if B X is the Markov b oundary of X , then W / ∈ B X ⇐ I ( X , W | B X − { X , W } ) , (6) The pro of of this Lemma is discuss ed in Ap p end ix A. W e can now present the Mark o v-blanket closure used by IBMAP-HC. W e d o it through the follo wing T heorem: Theorem 4 (Mark o v-blanket closure) . L et V b e a domain of r andom variables, G an indep endenc e structur e over V , and let B X denote the Markov b oundary of a variable X ∈ V . Then, the set of indep endenc es C M B ( G ) = n I ( X, Y | B X − { X , Y } ) | X , Y 6 = X ∈ V , ( X, Y ) / ∈ E ( G ) o [ n ¬ I ( X, Y | B X − { X , Y } ) | X , Y 6 = X ∈ V , ( X, Y ) ∈ E ( G ) o (7) 11 is a closur e of G . That is, for e ach variable X and e ach other variable Y 6 = X , if the p air ( X, Y ) is an e dge in G then add ¬ I ( X , Y | B X − { X, Y } ) to the closur e, otherwise add I ( X, Y | B X − { X , Y } ) . W e need one fi nal r esult to p ro ve the Theorem, a relation b etw een Mark ov b oundaries and indep endence stru ctures: Corollary 2 (P earl (198 8 ), p.98) . The i ndep endenc e structur e G of any strictly p ositive distribution over V c an b e c onstructe d by c onne cting e ach variable X ∈ V to al l memb ers of its Markov b oundary B X . F ormal ly, ∀ Y ∈ B X ⇔ ( X , Y ) ∈ E ( G ) (8) Pro of [Theorem 4] T o pr o ve that C M B ( G ) d etermines G , we must p ro ve the fact that an edge b et wee n X and Y exists or not is d etermined by the in dep en d encies in C M B ( G ). W e d o it separately for existence and non-existence of edges. F or edge existence: Let ( X, Y ) ∈ E ( G ). Is this edge d etermined by C M B ( G )? By d efi nition of C M B ( G ), the assertion ¬ I ( X, Y | B X − { X , Y } ) must b e in C M B ( G ). It is sufficien t then to pro ve that ¬ I ( X , Y | B X − { X , Y } ) ⇒ ( X, Y ) ∈ E ( G ). T his follo ws f rom the counter p ositive of Eq. (5) and Eq. (8). F or edge absence: Let ( X , Y ) / ∈ E ( G ) . Is this lack of edge determined by C M B ( G )? By definition of C M B ( G ), the assertion I ( X , Y | B X − { X , Y } ) m u s t b e in C M B ( G ). It is sufficien t then to pr o ve that I ( X, Y | B X − { X , Y } ) ⇒ ( X , Y ) / ∈ E ( G ). Th is follo w s f rom Eq. (6) and Eq. (8). 4.1.1 Complex ity of IBMAP-HC Let’s fir st discuss the compu tational complexit y of IB-score using th e Marko v blank et clo- sure. According to Eq. (4), th is complexit y is O ( |C M B | N τ ∗ ). T o obtain |C M B | note that for eac h v ariable X in V , and eac h other v ariable Y 6 = X , there is either an edge or not, bu t b oth cases cannot happ en. T hus, f or any pair X 6 = Y either the condition on the l.h.s. of the un ion in Eq. (7) is true, or the condition in the r.h.s. is true, so only one in d ep end ence assertion is added p er pair of v ariables. Therefore, |C M B | = n ( n − 1). W e can also n ote that τ ∗ = 2 + | B X ∗ | , where X ∗ is the v ariable with the largest blanket. A straight- forw ard implemen tation of th e h ill clim b ing compu tes the IB-Score for eac h of the n ( n − 1) / 2 neigh b ors, resulting in a total complexit y of O n 2 ( n − 1) 2 N τ ∗ / 2 . There is a tric k, ho wev er, for reducing the complexit y of eac h neigh b or’s IB-Score by one ord er of magnitud e. T he difference of eac h neigh b or w ith the currently visited stru cture G is exactly one edge, say ( X , Y ). In the t wo cases of an edge b eing remo ved, or an edge b eing added, the b lanket of b oth X and Y w ould c hange, and thus the conditionant of all 2( n − 1) indep en d ence assertions in the closure con taining either X or Y . All other indep endence assertions w ould r emain exactly as in G , and th us, an incremental compu tation of the IB-score wo u ld requ ire only 2( n − 1) statistical tests, resulting in a time complexit y of the (incremen tal) IB-score of O (2( n − 1) N τ ∗ ), and a time complexity of on e hill clim bin g step of 12 O n ( n − 1) 2 N τ ∗ . That is, a r ed uction of a factor n/ 2 with resp ect to the non-increment al alternativ e. Finally , if we denote by M the total num b er of hill clim bin g iterations, the o v erall complexit y of the IBMAP-HC algorithm is O M n ( n − 1) 2 N τ ∗ . Unfortunately M is u n- kno wn , and can only b e obtained through empirical measurement. W e th us rep ort it in our exp eriments. 4.2 IBMAP-TS: Indep endence-based MAP structure learning using tree searc h and GSMN based closure. In this section we in tro duce another algorithm, IBMAP-TS (In dep en d ence-based max- im um a p osteriori using tree searc h ) for learnin g an indep endence structur e using th e indep en d ence-based MAP app roac h of Section 3. Th is algorithm implements the maxi- mization through a tree search, the u niform c ost algorithm , u s ing an algorithm-b ase d closur e describ ed briefly ab ov e in Example 2. The resulting algo rithm is not efficien t, r equiring an exp onentia l num b er of statistical tests to fin d the stru cture with maxim um IB-score. Ho w- ev er, we b eliev e its d escription h ere and the presenta tion of exp erimental results later, to b e helpf ul in t wo w a ys. First, the closure presented is generic, in the sense that can b e eas- ily instan tiated for other indep endence-based algorithm b esides th e GSMN algorithm used here. Also, although the algorithm is exp onenti al in time, the qu alit y improv emen ts ob- tained throu gh exp erimen tation help to reinforce the hyp othesis th at th e IBMAP appr oac h impro ves the qualit y of the structures learned. Let’s start formalizing the pro cess follo wed by an indep enden ce-based algorithm. As men tioned ab o v e in Section 2.1, an indep en dence-based algorithm pro ceeds as follo w s: at eac h iteration i , it pr op oses a triplet T i and p erf orm s a s tatistica l indep endence test (SIT) on d ata to obtain an indep endence assertion T i = t S I T i . The sup erscript S I T is includ ed f or later conv en ience, and d enotes th at the indep end ence v alue considered is the one indicated b y the statistica l indep endence test. Whic h triplet is selected at iteration i d ep ends on T 1: i − 1 = t S I T 1: i − 1 , that is, on the sequence T 1: i − 1 of triplets pr op osed so f ar (in iterations 1 through i − 1), an d the ind ep endence v alues t S I T 1: i − 1 that s tatistica l tests assigned them (with T 1:0 , t S I T 1:0 indicating the empt y set of triplets and assertions, resp ectiv ely). Eac h iteration of an indep endence-based stru cture learning algorithm can th u s b e summ arized as follo ws: T i ← − A ( T 1: i − 1 = t S I T 1: i − 1 ) (9) t S I T i ← − S I T ( T i ) where A denotes the op er ator that decides th e next triplet. These algorithms pro ceed unt il the set of indep endence assertions done so far is su fficien t for determining a structure. By the defin ition of closure, this set is thus a closure. W e call the closure obtained in this wa y an algorithm-b ase d closur e . Ho w can w e then u se th is closure in a MAP search? A t eac h iteration i , w e prop ose considering, b esides the indep endence assertion T i = t S I T i , the alternativ e v alue T i = ¬ t S I T i . In other w ords , we p rop ose to distrust the statistica l test. Int erestingly , this change should not affect the algorithm. It w ould simply contin ue as if the statistical test would ha ve giv en the other v alue. Moreo ver, it w ould also find a structure even tually , and the assertions found d uring its execution w ould thus b e a closure as wel l. Clearly , the structure found 13 w ould b e different. In summary , eac h s u c h b ifurcation in to T i = t S I T i and T i = ¬ t S I T i pro du ces a different family of s tructures whose p osterior can b e computed using as closur e the assertions obtained dur ing its execution. T o finalize, we can notice eac h bifurcation splits the sequence of indep en d ences in t wo, eac h of which is recur s iv ely sp lit in the next iteration. This can b e mo deled by a b inary tree, with eac h no d e corresp ond ing to an ind ep endence assertion, and whose children corresp ond to the tw o assignmen ts for the triplet obtained by applying A to the assertions in th e path from the ro ot to the paren t. An exception is the ro ot no d e, whic h represen ts a d ummy empt y s equence no de. Eac h path fr om the r o ot to a lea v e, n ot only determines a s tr ucture, but it determines a closure { T 1 = t 1 , T 2 = t 2 , . . . , T c = t c } for that structure. This closure can then b e used to compu te the IB-score of the structure b y multiplying the p osterior of the ind ep end ence assertion of eac h no de in the path, i.e., c Q i =1 Pr( T i = t i | D ). Und er this view, findin g the stru cture w ith maxim um IB-score (i.e., the MAP structure) can b e done through an y tree searc h algorithm using as successor function the op erator A , and as cost of eac h actio n − log Pr ( T i = t i | D ). S ince the log of a pr o duct is the sum of the logs, and the log is a monotonous function, finding th e maxim u m I B-score c Q i =1 Pr( T i = t i | D ) is equiv alen t to findin g the path with the minimal p ath-cost, i.e., the sum of the costs of no des in the path or c P i =1 − l og Pr( T i = t i | D ). W e imp lemen ted and tested IBMAP-TS with the closur e constru cted using the GSMN algorithm and u niform cost strategy to searc h th e tree. W e c hose GS MN to demonstrate our approac h for b eing a well established indep end ence-based Marko v net works structure learning algorithm. This algorithm u ses the GS algorithm (Margaritis and Th run, 2000) for learning th e Mark o v blank et of ev ery v ariable X ∈ V , and uses Corollary 2 to build the structure. Results comparing th e qualit y of structures learned by GSMN versus IBMAP-TS with un iform cost and GSMN based closure are sh own in the exp er im ental results section. One im p ortan t adv ant age of uniform cost is that its solutions are optimal. T o impr o ve o ver its exp onen tial r unti me, we tested a f ew heuristics (not rep orted here), but with n o s u ccess in a vo id ing exp onen tial runtimes. W e thus limit our fin d ings to u niform cost. Fig.(4) sho w s an example (partial) search tree f or a small system of three ran d om v ariables V = { 0 , 1 , 2 } . Eac h no de is annotated with b oth the triplet and in d ep en- dence assertion of the triplet (e.g., n o de 1I is labeled b y I (0 , 1 | {} )), the p osterior pr ob- abilit y of this indep endence assertion (e.g. ,Pr( I (0 , 1 | {} ) | D ) = 0 . 6), the lo cal cost (e.g., − log (Pr( I (0 , 1 | {} ) | D )) = 0 . 511 ), th e partial computation of the IB-score (e.g., for 1 I this w ould 0 . 4 × 0 . 6, the pro d uct of costs of all no des from the ro ot to 1 I ), and finally , the partial path-cost as the minus log of the pro d uct (e.g., 1 . 427 for 1 I ). The no d e with th e c hec kmark (and underlined) is th e one with lo west p ath-cost, and th us the next in line to b e expand ed by u niform-cost. 5. Exp erimen tal ev aluation W e describ e sev eral exp eriments for testing the effectiv eness of the IB-score for improv- ing the quality of ind ep end ence structures disco vered by our n o vel indep endence-based algorithms IBMAP-HC and IBMAP-TS (c.f. § 4). T he exp eriments also corrob orate the 14 0 2I t = I (0 , 2 | {} ) P r ( t | D ) = 0 . 4 cost = 0 . 9 16 1I t = I (0 , 1 | {} ) P r ( t | D ) = 0 . 6 cost = 0 . 511 0 . 6 × 0 . 4 = 0 . 24 path-cost= 1 . 427 1D t = ¬ I (0 , 1 | {} ), P r ( t | D ) = 0 . 5 cost = 0 . 693 0 . 5 × 0 . 4 = 0 . 20 path-cost= 1 . 609 2D X t = ¬ I (0 , 2 | {} ) , P r ( t | D ) = 0 . 7 cost = 0 . 357 1I t = I (0 , 1 | 2), P r ( t | D ) = 0 . 75 cost = 0 . 288 0 . 75 × 0 . 7 = 0 . 53 path-cost= 0 . 647 1D X t = ¬ I (0 , 1 | 2), P r ( t | D ) = 0 . 85 cost = 0 . 163 0 . 85 × 0 . 7=0 . 60 path-cost= 0 . 52 Figure 4: Example partial binary tree expanded b y IBMAP-TS with un iform cost search and GSMN-based closure. practicalit y of IBMAP-HC, i.e., its p olynomial ru nning time, as discussed th eoreticall y in Section 4.1.1. 5.1 Exp erimental setup W e d iscuss here the p erformance measures w e use for testing the qu ality of output net works, and the time complexit y of the algorithms, as w ell the d atasets on w hic h these p erformance w as measured. 5.1.1 D a t as ets W e ran our exp eriment s on b enc hm ark (real-w orld) and s ampled (artificial) d atasets. Real w orld d atasets allo w an assessment of the p erform ance of our algorithms in realistic settings with the disadv an tage of lac king the solution net work, thus resulting in approxi mate m ea- sures of qu alit y . W e us ed th e pu b licly a v ailable b enc h mark datasets obtained from the UCI Rep ositories of m achine learning (A. Asuncion, 2007) and KDD datasets (Hettic h and Ba y , 1999). Ar tificial datasets, although more limited in the scop e of the results, are sampled from known n et wo rks allo wing a more systematic and controlle d study of the p erformance of our algorithms. Using a Gibb s sampler, data was sampled from several randomly generated und irected graphical m o dels, eac h with a randomly generated graph and parameters. W e considered mo dels with different n umber of v ariables n (e.g., n = 12 , 50), and different num b er τ of neigh b ors p er no de (we used τ = 1 , 2 , 4 , 8 in all our exp eriments). F or a giv en n an d τ , 10 graphs were generated, connecting r andomly and uniformly , eac h of the n n o des to τ other no des. This was ac h iev ed b y connecting eac h no d e i w ith the first τ n o des of a rand om p ermutatio n of [1 , . . . , i − 1 , i +1 , . . . , n ]. F or eac h of the generated graphs, a set of p arameters w as generated r andomly follo wing a pro cedur e d escrib ed in detail in Brom b erg et al. (2009) 15 that guaran tees dep endencies remains strong for v ariables d istan t in the netw ork. Finally , one dataset w as sampled for eac h of the generated pair of graph and s et of parameters. 5.1.2 Comput a tional cost mea sure One of the h y p othesis w e w anted to prov e with our exp eriments is the p olynomial r u n- time of IBMAP-HC. In Section 4.1.1 w e found the time complexit y of IBMAP-HC to b e O M n ( n − 1) 2 N τ ∗ . F or this exp ression to b e p olynomial b oth M and τ ∗ should at most gro w p olynomially with n . The size of the largest trip let test τ ∗ dep end s only in the con- nectivit y of the net works, w h ic h we kept fixed at τ . Instead, w e h a ve no elemen ts to p redict the b ehavior of M , as it dep ends solely on the lands cap e of the score function. W e th us rep ort M in our exp eriments as a measur e of complexit y . 5.1.3 Error meas ures W e measured qualit y through t wo types of errors b etw een the output net w ork and a mo del considered to b e the correct one: the e dges and indep endenc es Hamming distanc e . F or the case of artificial datasets the comparison w as done against the true, known, und erlying net work, whereas for real datasets the comparison wa s done against the data itself. Let us discuss these quant ities in detail: • T he e dge Hamming distanc e H E ( G, G ′ ) b etw een t wo graphs G and G ′ of equal num b er of no des, represents the num b er of edges that exist in G , and do not exist in G ′ , and vice ve r sa. Put another wa y , it m easures the min im u m n u m b er of edge su bstitutions required to c hange one graph in to the other. T o measur e the err or of a structure G output by a structur e learning algorithm we measure its edges Hamming distance H E ( G ⋆ , G ), or simp ly H ⋆ E ( G ), with the solution net w ork G ⋆ . F ormally , if we define the follo w ing indicator function for ev aluating the existence of an edge b et ween tw o v ariables X and Y in G , E G ( X, Y ) = 1 ( X, Y ) is an edge in G 0 otherwise. (10) the edges Hamming distance is defi n ed as H ⋆ E ( G ) = ( X, Y ∈ V , X 6 = Y E G ( X, Y ) 6 = E G ⋆ ( X, Y ) ) (11) • Given tw o probabilit y distrib utions P and P ′ o ve r the same set of v ariables V , w e define the indep endenc es Hamming distanc e H I ( P , P ′ ) b et wee n them to b e the (nor- malized) num b er of matc hes in a comparison of the indep endence assertions that holds in P and P ′ . T h at is, if T d enotes the set of all p ossible tr iplets o v er V , it is chec k ed for how m any triplets t ∈ T , t is ind ep end ent (or dep enden t) in b oth d istributions, and then n ormalized by T . Unfortunately , the size of T is exp onen tial. W e thus compute the approximat e Hamming d istance ˆ H I ( P , P ′ ) o ver a randomly sampled subset of b T , uniformly distributed f or eac h conditioning set cardinalit y . In all our exp eriments we used | b T | = 2 , 000, constructed as follo ws: f or eac h m = 0 , 1 , 2 , . . . , n − 2, | b T | / ( n − 1) 16 triplets ( X , Y | Z ) with cardinalit y | Z | = m w ere samp led randomly and un iformly b y first generating a random p erm utation [ π 1 , π 2 , . . . , π n ] of the set of all v ariables V , and the assigning X = π 1 , Y = π 2 , and Z = [ π 3 , . . . , π m ]. In what follo ws we are not given a fully sp ecified distr ibution. In s tead, dep endending on the typ e of d ataset b eing artificial or real, we are giv en the ind ep end en ce structur e or a sample (i.e., a dataset), resp ectiv ely . Indep endencies, h o wev er, can b e measured o ve r b oth indep end ence stru ctures and datasets, so in b oth cases w e can measure (appro ximately) the indep endence Hamming distance. Let’s consider b oth cases. T o estimate the error of structur es outpu t b y our algorithms when ru n o v er artificial datasets, we measured their indep endence Hamming distance H I ( G, G ⋆ ) (or simply b H ⋆ I ( G )), with the u nderlying tru e net work G ⋆ , querying ind ep enden ces directly on the structures usin g verte x-separation. F ormally , if we denote I G ⋆ ( t ) the result of a test t ∈ b T p erformed on the true mo del, and b y I G ( t ) the result of th e same test t p erformed on a mo d el G , th en the indep endence Hamming distance b H ⋆ I ( G ) is d efined formally as: b H ⋆ I ( G ) = 1 | b T | { t ∈ b T I G ( t ) 6 = I G ⋆ ( t ) } (12) In exp erimen ts o v er real datasets the un derlying stru cture G ⋆ is unkn o wn. W e th us conducted exp eriments learning the structur e o ve r s m aller datasets w ith s izes 1 / 3 and 1 / 5 of the input dataset D , and compared th e indep endencies in the output structure G , and the complete dataset D . The resu lting Hamming distance is denoted b H I ( G, D ), or simp ly b H D I ( G ). F ormally , if we denote by I D ( t ) the result of a test t ∈ b T p erformed on the complete dataset, then b H D I ( G ) is defined as: b H D I ( G ) = 1 | b T | { t ∈ b T I G ( t ) 6 = I D ( t ) } (13) W e are interested in comparing the errors of structures outp ut by our algorithms (IBMAP- HC , IBMAP-TS) and GSMN, the comp etitor. F or that w e rep ort the ratio r = H ( G H C ) H ( G GS M N ) of the errors of the netw ork G H C output by IBMAP-HC against the error of th e netw ork G GS M N output by GSMN. Similarly , for net work G T S output b y IBMAP-TS, we r ep ort the ratio r = H ( G T S ) H ( G GS M N ) . Being three different t yp es of err ors , the edge Hamming d istance H ⋆ E ( G ) and the t w o in dep end ence Hamming distances b H ⋆ I ( G ) and b H D I ( G ), this results in six p ossible ratios, thr ee for H C and three f or T S : r ⋆ E ( H C ) = H ⋆ E ( G HC ) H ⋆ E ( G GSMN ) , r ⋆ I ( H C ) = b H ⋆ I ( G HC ) b H ⋆ I ( G GSMN ) , r D I ( H C ) = b H D I ( G HC ) b H D I ( G GSMN ) r ⋆ E ( T S ) = H ⋆ E ( G TS ) H ⋆ E ( G GSMN ) , r ⋆ I ( T S ) = b H ⋆ I ( G TS ) b H ⋆ I ( G GSMN ) , r D I ( T S ) = b H D I ( G TS ) b H D I ( G GSMN ) These ratios allo w s a quic k comparison b et we en the t wo algorithms it inv olv es as a ratio equal to on e means the same error in the structures they outpu t, a ratio lo wer than one means a r eduction in the error of th e structures output b y our algorithms (HC or TS) and a ratio greater than one means a redu ction in qualit y b y our algorithms. 17 5.2 Exp erimental results W e sh o w now the r esults of our exp eriments. 5.2.1 Samp led D a t a Experimen ts In our fi rst set of exp erimen ts, we demonstrate that our t wo IBMAP algorithms I BMAP-HC and IBMAP-TS are successful in improving the qualit y o ver artificially generated datasets b y comparing their edge errors H ⋆ E ( G HC ) and H ⋆ E ( G TS ) as well as their in dep end ence errors b H ⋆ I ( G HC ) and b H ⋆ I ( G TS ) against the corresp ondin g errors H ⋆ E ( G GSMN ) b H ⋆ I ( G GSMN ) of GSMN. As the IBMAP-TS algorithm is impr actical for larger domains, we considered t wo sce- narios, one o ve r under lyin g mo d els of size n = 12, comparing er r ors of b oth IBMAP-HC and IBMAP-TS against GSMN, and one ov er larger mo d els of size n = 50, comparing only IBMAP-HC against GSMN (with results sho wn in ). T o assess our algorithms ov er dif- feren t conditions of reliabilit y and connectivit y , w e r an them ov er d atasets with increasing n u m b er of d atap oin ts N = 40 , 200 , 800 , 5000 , 12000, sampled from net wo rks of increasing no de degrees τ = 1 , 2 , 4 , 8. T o increase statistical significance, 10 d atasets w er e sampled for eac h pair ( n, τ ), an d for eac h of th em, one sub sample of size N w as obtained by r andomly selecting N datap oints. T able 1 sho ws the edge errors for n = 12, rep orting the mean v alues and standard deviations (in parent hesis) of th e edge errors H ⋆ E ( G GSMN ), H ⋆ E ( G TS ), and H ⋆ E ( G HC ) of GSMN, IBMAP-TS and IBMAP-HC, resp ectiv ely , for the differen t conditions of connectivit y and reliabilit y . T he last t wo columns sho w their corresp onding ratios r ⋆ E ( T S ) and r ⋆ E ( H C ), indicating in b old the statistically signifi can t imp ro vemen ts (i.e. ratio s lo wer than 1), and underlined the statistically significan t redu ctions in errors (i.e., ratios greater th an 1). These error ratios are plotted also in Figure 5 (left column). The ind ep enden ce errors b H ⋆ I ( G GSMN ), b H ⋆ I ( G TS ) and b H ⋆ I ( G HC ) for n = 12 are sho w n in T able 2 with a similar stru cture, with the ratios also plotted in Figure 5 (righ t column). These r esults sh o w that in m ost cases our prop osed algorithms present qu alit y impr o ve - men ts ov er GSMN. F or datasets with connectivities τ = 1 , 2 , 4, the Hammin g distances are b etter or equal for IBMAP-TS and IBMAP-HC on all cases in T able 1, and almost all cases in T ab le 2. In some cases the improv emen t are drastic (e.g. r ⋆ E ( H C ) = 0 . 058 (0 . 088), for τ = 4, N = 12000 meaning that for appr o ximately 6 wr on g edges in G H C there are 100 wrong edges in G GS M N ). The p our resu lts for datasets with connectivit y τ = 8 can b e explained b y recalli ng the app ro ximation mad e in E q .(3 ), namely , that conditional ind e- p end en ce assertions are mutually indep en d en t. This indep endence is n ot exp ected to h old o ve r assertions inv olving the common v ariables, with the stronger d ep end en ce for larger o ve r laps. This tendency is clearer in the results f or n = 50, sh o wn in T able 3, plotted in Figure 6 . The table s h o ws the mean v alue and standard deviation (in parenthesis) of edge Hamming distance H ⋆ E ( G GSMN ), H ⋆ E ( G HC ) and their ratio r ⋆ E ( H C ) on the left group of column s, and b H ⋆ I ( G GSMN ), b H ⋆ I ( G HC ) and their ratio r ⋆ I ( H C ) on th e right group of column s. Ag ain, b old (underline) signifies an in crease (decrease) in the qu alit y IBMAP-HC o ver the qualit y of GSMN. W e can obs er ve that for the case of edge Hamming distance, as τ increases, the n u m b er of b old ratios decreases (5,4,2, and 2 f or τ = 1 , 2 , 4 , 8, resp ectiv ely), and th e n um b er of und er lin ed ratios incr eases (1,2,3, and 2 f or τ = 1 , 2 , 4 , 8, r esp ectiv ely). 18 Comparison of Hamming distances, n = 12 τ r ⋆ E r ⋆ I 1 0 0.5 1 1.5 2 2.5 40 200 800 5K 12K N r* E (TS) r* E (HC) 0 0.5 1 1.5 2 2.5 40 200 800 5K 12K N r* I (TS) r* I (HC) 2 0 0.5 1 1.5 2 2.5 40 200 800 5K 12K N r* E (TS) r* E (HC) 0 0.5 1 1.5 2 2.5 40 200 800 5K 12K N r* I (TS) r* I (HC) 4 0 0.5 1 1.5 2 2.5 40 200 800 5K 12K N r* E (TS) r* E (HC) 0 0.5 1 1.5 2 2.5 40 200 800 5K 12K N r* I (TS) r* I (HC) 8 0 0.5 1 1.5 2 2.5 40 200 800 5K 12K N r* E (TS) r* E (HC) 0 0.5 1 1.5 2 2.5 40 200 800 5K 12K N r* I (TS) r* I (HC) Figure 5: Av erage of r ⋆ E ( T S ), r ⋆ E ( H C ) (left column), r ⋆ I ( T S ) and r ⋆ I ( H C ) (right column) o ve r 10 datasets with n = 12 and τ = 1 , 2 , 4 , 8 (ro ws ). Error bars r epresent s standard deviation. Th e smaller th e v alue, more imp ortan t is the improv ement, with v alues greater (smaller) than 1 represent redu ction (increase) in the qualit y . 19 Edges Hamming distances, n = 12 τ N H ⋆ E ( G GSMN ) H ⋆ E ( G TS ) H ⋆ E ( G HC ) r ⋆ E ( T S ) r ⋆ E ( H C ) 1 40 20.500(2.471) 10.200(1.875) 12.700(3.920) 0.504( 0.087 ) 0.599( 0.125) 200 10.800(2.505) 4.700(1.630) 3. 700(1.664) 0.441( 0.132) 0 .364(0 .150) 800 3.600( 1. 915) 1.800(0.64 8) 1.000( 0.576) 0.592(0. 266) 0.3 18(0.2 25) 5000 0.800(0.928) 0.900( 1.125) 0.400 (0.493) 1.025(0.056) 0.800(0.247) 12000 0.300(0.341) 0.200 (0.297) 0.000(0.000) 0. 900(0.223) 0.700(0.341) 2 40 20.900(2.453) 13.900(1.864) 16.200(2.044) 0.673( 0.087 ) 0.777( 0.055) 200 12.000(3.487) 5.800(1.363) 7. 800(3.654) 0.524( 0.133) 0 .658(0 .177) 800 4.600( 0. 681) 2.100(0.96 6) 1.200( 0.928) 0.428(0. 171) 0.2 82(0.2 35) 5000 2.100(1.022) 1.400( 0.681) 0.300 (0.476) 0.725(0.24 2) 0.200 (0.24 7) 12000 0.700(0.581) 0.700 (0.581) 0.000(0.000) 1. 000(0.000) 0.500(0.3 72) 4 40 21.000(3.308) 18.100(2.408) 22.200(2.717) 0.880( 0.124 ) 1.073(0.098) 200 13.700(2.352) 10.400(2.402) 13.000(2.955) 0.77 2(0.1 57) 0.947(0.088) 800 8.300( 1. 332) 4.400(1.66 9) 4.600( 1.457) 0.553(0. 203) 0.5 43(0.1 36) 5000 4.400(1.734) 2.200( 0.986) 0.500 (0.499) 0.542(0.13 5) 0.183 (0.22 1) 12000 2.400(0.828) 1.500 (0.685) 0.200(0.297) 0.575(0.245 ) 0.058( 0.088) 8 40 30.600(4.475) 33.600(3.261) 34.300(2.702) 1.116(0.082) 1.145(0.100) 200 23.200(2.634) 25.600(3.086) 28.900(3.414) 1.112(0.103) 1.250(0.079) 800 17.400(2.402) 19.900(2.648) 25.000(2.532) 1.152(0.089) 1.462(0.132) 5000 10.300(1.489) 13.600(1.494) 16.400(1.601) 1.362(0.230) 1.631(0.198) 12000 9.200(2.913) 12.200(2 .613) 12.900(2.810) 1.469(0.356) 1.520(0.290) T able 1: Av erage and stand ard deviation of H ⋆ E ( G GSMN ), H ⋆ E ( G TS ) and H ⋆ E ( G HC ) (columns) for d atasets sampled from 10 random netw orks of n = 12 and τ = 1 , 2 , 4 , 8 (rows). Last t wo columns shows r ⋆ E ( T S ) and r ⋆ E ( H C ), with qualit y imp ro vemen ts w hen r < 1 (in b old), and qualit y reductions when r > 1 (und erlined). The plots in Figure 6 show clearly ho w b oth ratios r ⋆ E ( H C ) (left) and r ⋆ I ( H C ) (right) decrease with N , with the decrease b eing s lo we r as τ increases. Although for small N s there are some p our results for edge errors, these ratios are nev er greater than 1 . 231 (for τ = 4, N = 500), and in most cases h as a corresp onding impr o ve men t in the in d ep end ence error. F or instance, for the same case of τ = 4, N = 500, the indep en dence ratio is 0 . 926( 0 . 061) , a v alue smaller than 1 with statistica l significance. In all other cases, only the four cases of N = 100 sho w n o improv ement, w ith only the case of τ = 4 sh owing an increase in error. The remaining cases of ed ge errors sho w significan t improv ements reac hing in man y cases of large N s ratios smaller th an 0 . 1, w ith prop ortions of 50 to 1 w rong edges in GS MN and IBMAP-HC, resp ectiv ely , for τ = 4, N = 12000. T o conclude this section we p resen t results for M , th e n um b er of h ill clim bs conducted b y IBMAP-HC. W e measured this quanti t y f or ru ns of the algorithms on d atasets sampled from graphs of increasing size n , conn ectivities τ = 1 , 2 , 4 , 8, and three different reliabilit y conditions N = 200 , 1000 , 5000. Figure 7 shows four plots, one p er τ , with 3 curv es eac h, one p er dataset size N . 20 Independences Hamming distances, n = 12 τ N b H ⋆ I ( G GSMN ) b H ⋆ I ( G TS ) b H ⋆ I ( G HC ) r ⋆ I ( T S ) r ⋆ I ( H C ) 1 40 0.593(0.058) 0.293(0.048) 0.322(0.098) 0.497(0 .074) 0.541( 0.139) 200 0.397(0.093 ) 0.186(0.069) 0.113(0.043) 0.550 (0.236 ) 0.396(0. 301) 800 0.164(0.096 ) 0.084(0.054) 0.020(0.013) 0.565(0. 267) 0.235(0 .247) 5000 0.027(0.032) 0.036(0.044) 0.012(0.015) 1.132(0.276) 0 .766(0.280) 12000 0.005(0.006) 0.004(0.005) 0.000(0.000) 0.916(0.229) 0.700(0.341) 2 40 0.444(0.031) 0.379(0.052) 0.376(0.058) 0.858(0 .118) 0.843(0.11 1 ) 200 0.297(0.078 ) 0.208(0.045) 0.254(0.066) 0.742(0. 153) 0.904(0.197) 800 0.166(0.040 ) 0.094(0.050) 0.045(0.036) 0.507(0. 199) 0.273(0 .220) 5000 0.085(0.054) 0.062(0.042) 0.006(0.012) 0.7 77(0.2 28) 0.200(0. 247) 12000 0.030(0.032) 0.031(0.033) 0.000(0.000) 1.000(0.025) 0.500( 0.372) 4 40 0.197(0.032) 0.296(0.034) 0.272(0.033) 1.555(0.244) 1.426(0.225) 200 0.127(0.020 ) 0.134(0.045) 0.152(0.025) 1.071(0.343) 1.238(0.278 ) 800 0.094(0.018 ) 0.056(0.022) 0.052(0.017) 0.597(0. 193) 0.534(0 .110) 5000 0.051(0.023) 0.026(0.011) 0.007(0.009) 0.5 96(0.1 68) 0.203(0. 234) 12000 0.027(0.011) 0.022(0.012) 0.002(0.003) 0.800(0.532) 0.060( 0.093) 8 40 0.238(0.145) 0.291(0.128) 0.271(0.132) 1.382(0.196) 1.246(0.132) 200 0.094(0.013 ) 0.142(0.018) 0.125(0.016) 1.531(0.166) 1.343(0.083 ) 800 0.059(0.006 ) 0.095(0.012) 0.097(0.010) 1.606(0.142) 1.644(0.102 ) 5000 0.031(0.003) 0.044(0.005) 0.052(0.004) 1.453(0.207) 1.713(0.182) 12000 0.024(0.007) 0.033(0.008) 0.036(0.008) 1.488(0.326) 1.600(0.307) T able 2: Av erage and standard deviation of b H ⋆ I ( G GSMN ), b H ⋆ I ( G TS ) and b H ⋆ I ( G HC ) (columns) for datasets with n = 12 an d τ = 1 , 2 , 4 , 8 (ro ws). Last t wo columns sh o ws r ⋆ I ( T S ) and r ⋆ I ( H C ), with qualit y impro vemen ts when r < 1 (in b old), and q u alit y reductions wh en r > 1 (underlin ed ). In all cases, M presen ts a qu asi-linear gro w on n . After in corp orating M as a a linear function on n into the expression O ( M n ( n − 1) 2 N τ ∗ ) for the complexit y of the IBMAP-HC algorithm (c.f. § 5.1.2), w e obtain empirically the ru nt im e grows as O ( n 4 ). T o giv e the reader a sense of the runtime, we rep ort the runtime for the hardest scenario. In a Jav a virtual m achine runn ing on an AMD At h lon p ro cessor of 64 bits and 4800 Mhz and 1 Gb of RAM, the case for n = 50, N = 12000, and τ = 8 to ok 5 da ys , with a reduction to 5 hour s after implement ing a simple cac he f or a voiding the computation of rep eated tests. 5.2.2 Experimen ts on benchma rk da t asets T o conclude the discus s ion of our exp erimen ts we compare qualit y p er f ormances of IBMAP- HC against GSMN on b en chmark datasets. F or this datasets the und er lyin g true net work is u n kno w n, and w e are th u s restricted to indep endence Hamming distances measur ed on the dataset. 21 Comparison of b H D I ( G HC ), n = 50 r ⋆ E r ⋆ I 0 0.2 0.4 0.6 0.8 1 1.2 1.4 100 500 1K 2K 5K 12K N τ = 1 τ = 2 τ = 4 τ = 8 0 0.2 0.4 0.6 0.8 1 1.2 1.4 100 500 1K 2K 5K 12K N τ = 1 τ = 2 τ = 4 τ = 8 Figure 6: r ⋆ E ( H C ) (left) and r ⋆ I ( H C ) (righ t) for datasets with n = 50 and τ = 1 , 2 , 4 , 8 (color-coded) r an on d atasets with increasing num b er of datap oin ts N . Bars represents a ve r age ov er ten different datasets. Error b ars represents standard deviation. Gro wth in the n u m b er of ascen ts of IBMAP-HC 0 50 100 150 200 250 5 10 15 20 25 30 35 40 45 50 n Network size τ =1 N = 200 N=1000 N=5000 0 50 100 150 200 250 5 10 15 20 25 30 35 40 45 50 n Network size τ =2 N = 200 N=1000 N=5000 0 50 100 150 200 250 5 10 15 20 25 30 35 40 45 50 n Network size τ =4 N = 200 N=1000 N=5000 0 50 100 150 200 250 5 10 15 20 25 30 35 40 45 50 n Network size τ =8 N = 200 N=1000 N=5000 Figure 7: Numb er of IBMAP-HC ascent s M on datasets with in creasing num b er of v ariables n , connectivities τ = 1 , 2 , 4 , 8 (four plots), N = 200 , 1000 , 5000 (three curv es). W e ran the IBMAP-HC and GSMN algorithms ten times on eac h of a set of datasets obtained from the UCI Rep ositories of mac hine learning (A. Asuncion, 2007) and KDD datasets (Hettic h and Ba y, 1999). Eac h ran on a differen t randomly sampled sub set of the 22 n = 50 Edges Hamming distances Independences Hammi ng distances τ N H ⋆ E ( G GSMN ) H ⋆ E ( G HC ) r ⋆ E ( H C ) b H ⋆ I ( G GSMN ) b H ⋆ I ( G HC ) r ⋆ I ( H C ) 1 100 193.200( 4.255) 205.800(3.133) 1.066(0.026) 0.789(0.010) 0.770(0.022) 0.977(0.029) 500 156.500( 9.919) 145.200(16.865 ) 0.923(0.06 3) 0.720(0.023) 0.447(0.075) 0.616 (0.08 9) 1000 91 . 200(10.771) 37.300(18.338) 0 .389( 0.160) 0.556(0.034) 0.189(0.072) 0. 333(0. 122) 2000 55 . 000(12.296) 1.556(0.422) 0.030(0.00 9) 0.389(0.075) 0.004(0.002) 0.01 0(0.00 4) 5000 22.200( 3.758) 1.700(0.943) 0. 071(0. 040) 0.163(0.034) 0.005(0.003) 0.0 29(0.0 15) 12000 13.400( 2.514) 0.800(0.728) 0.0 55(0.0 49) 0.098(0.020) 0. 002(0.002) 0.0 18(0. 016) 2 100 186.200( 4.370) 206.200(3.959) 1.108(0.025) 0.605(0.014) 0.615(0.020) 1.016(0.020) 500 153.500( 7.465) 163.900(12.135 ) 1.067(0.055) 0.566(0.022) 0.435(0.036) 0.767(0 .044) 1000 117.100(11.527 ) 93.200(21.019) 0.7 78(0.1 08) 0.502(0.027) 0. 230(0.035) 0.4 57(0.0 59) 2000 81 . 400(10.540) 14.500(13.967) 0 .150( 0.137) 0.433(0.030) 0.067(0.055) 0. 146(0. 119) 5000 35.700( 4.595) 0.900(0.966) 0. 024(0. 025) 0.273(0.028) 0.005(0.005) 0.0 16(0.0 17) 12000 20.600( 3.328) 0.600(0.595) 0.0 34(0.0 37) 0.163(0.019) 0. 003(0.004) 0.0 22(0. 026) 4 100 167.727( 9.113) 199.818(6.557) 1.195(0 .033) 0.257(0.012 ) 0.286(0.012) 1.115(0.047) 500 128.700( 5.097) 158.200(7.175) 1.231(0.056) 0.258(0.012) 0.238(0.016) 0.9 26(0.0 61) 1000 11 8. 900(4.315) 140.900(5.791) 1.186(0.034) 0.243( 0.009) 0.200(0.014 ) 0.8 23(0.0 53) 2000 10 6. 200(6.297) 98.900(12.825) 0.928(0.089) 0.219( 0.008) 0.129(0.021 ) 0.5 85(0.0 81) 5000 85.800( 7.594) 35 .100(14.526) 0.395 (0.142 ) 0.205(0.012) 0.045(0.018) 0.218 (0.08 5) 12000 51.800( 6.200) 0.900(1.348) 0.0 15(0.0 22) 0.145(0.011) 0. 002(0.002) 0.0 12(0. 015) 8 100 296.000( 7.433) 298.600(9.795) 1.009(0.024) 0.157(0.004) 0.150(0.006) 0.961(0.040) 500 261.900( 4.707) 276.700(4.760) 1.057(0.024) 0.137(0.003) 0.130(0.004) 0.9 47(0.0 32) 1000 23 7. 800(9.145) 255.700(8.231) 1.077(0.042) 0.134( 0.004) 0.119(0.002 ) 0.8 88(0.0 33) 2000 244.222(13.415 ) 253.889(10 .707) 1.042(0.045) 0.125(0.005) 0.115(0.005 ) 0.919(0.0 41) 5000 263.000(19.221 ) 225.000(9.314) 0.8 60(0.0 47) 0.127(0.006) 0. 102(0.003) 0.8 07(0.0 36) 12000 232.100(23.718) 188.400(12.461) 0.822(0.0 71 ) 0.112(0 .007) 0.089(0.005) 0.7 93(0. 056) T able 3: Exp erimen ts results of edge (left) and indep endence (right ) Hamming distances for seve ral datasets w ith n = 50, τ = 1 , 2 , 4 , 8 and increasing n umb er of data p oin ts N (ro ws). Standard d eviations are shown in parenthesis. Again, qualit y im p ro vemen ts are in b old, and qualit y reductions are un derlined. whole dataset of 1 / 3 its size. The same was rep eated for s u bsets of 1 / 5 the total size. T he indep en d ence Hamming distances b H D I ( G HC ), and b H D I ( G GSMN ) where then computed com- paring the indep end encies of the output net wo rks with the ind ep enden cies of the complete dataset. Results of these exp erimen ts are s ho wn in T able 4 and Figure 8 (left) for th e 1 / 3 case, and T able 5 and Figure 8 (right) for the 1 / 5 case. On b oth fi gures, the num b ers in the x - axis repr esent the indexes of eac h dataset in the corresp onding table. The tables also sho w on their last tw o columns v alues for r D I ( H C ) and M . These results show impr o ve men ts in most cases, again, shown in b old in the tables and b ars lo wer than one in the figures. Qualit y r eductions are und erlined in b oth tables. 23 Comparison of indep en dence Hamming d istances for b enc hmark data sets N/ 3 N/ 5 0 0.2 0.4 0.6 0.8 1 1.2 1.4 1.6 1 2 3 4 5 6 7 8 9 10 11 12 13 14 15 16 r I D (HC) 0 0.2 0.4 0.6 0.8 1 1.2 1.4 1.6 1 2 3 4 5 6 7 8 9 10 11 12 13 14 15 16 r I D (HC) Figure 8: Exp erimen tal results for real d atasets. The table shows av erage and stand ard deviation of r D I ( H C ) o ve r 10, 1 / 3 sub sets of D (left) and o ver 10, 1 / 5 subsets (righ t). Again, smaller v alues mean greater improv emen ts. # name n N b H D I ( G GSMN ) b H D I ( G HC ) r D I ( H C ) M 1 bridges.csv 12 1 40 0.445( 0.018) 0.450(0.020) 1.012(0.046) 7.700(1 .105) 2 dep endent . csv 3 1000 0.000(0.000) 0.000 (0.000) 1.000(0.000) 1.000(0.000) 3 flare2.csv 13 1 065 0.203(0.009) 0.204(0.01 6) 1.006(0.074) 10.200(2.298) 4 haberman.csv 5 612 0.309(0.029 ) 0.309(0.024) 1.003(0.040) 1.500(0.372) 5 i mp orts-85.csv 25 386 0.601(0.006) 0.602(0.007) 1.001(0.014) 20.667(1.942) 6 balance-scale.csv 5 1250 0.421(0.015) 0.41 2(0.013) 0.980(0.024) 1.100(0.223) 7 car.csv 7 3456 0. 425(0.006) 0.412(0.006) 0. 968(0. 016) 2.000(0.412 ) 8 monks-1.csv 7 1112 0.091(0.011) 0.091(0.031) 0.952(0.158) 1.182(0.39 3) 9 dermatology .csv 35 357 0.724(0.008) 0.687(0.025 ) 0.949(0.0 28) 69.556(6.525) 10 glass.csv 10 2 10 0.449( 0.029) 0.418(0.014) 0.939(0.069) 5.700(1 .054) 11 nursery .csv 9 25 920 0.551(0.035) 0.491(0 .024) 0.895(0.05 3) 4.000( 0. 940) 12 machine.csv 10 201 0.411 (0.044) 0.341(0 .015) 0.839(0.08 3) 6.750( 1.088) 13 ha yes-roth.csv 6 264 0.358(0.056) 0.291(0 .061) 0.816(0.13 3) 3.600( 1. 531) 14 tictactoe.csv 10 1916 0.584(0.021) 0.476 (0.021) 0 .815(0 .024) 9.500(1.459) 15 balo ons.csv 5 20 0.324(0.113) 0.244 (0.087) 0.806( 0.164) 1.900(0.617) 16 lenses.csv 5 48 0.306( 0. 080) 0.145(0.046 ) 0.545(0.2 23) 2.200(0 . 446) T able 4: Real data indep endence Hamming errors exp eriment s for a 1 / 3 of the complete dataset. Qualit y impro vemen ts when r < 1 (in b old), and qualit y reductions when r > 1 (underlined). These r esults s h o w again qualit y improv ements of IBMAP-HC o v er GSMN, with only t wo cases, lenses and flare2 in the 1 / 5 case showing reductions. I m pro v ements o ccurred in the 8 out of 16 in b oth cases. 24 # name n N b H D I ( G GSMN ) b H D I ( G HC ) r D I ( H C ) M 1 lenses.csv 5 48 0.241( 0. 076) 0.294(0.093 ) 1.225(0.174) 1.700(0 .341) 2 balo ons.csv 5 20 0.378 (0.407) 0.417(0 .406) 1.176(0.356) 1.100( 0. 844) 3 flare2.csv 13 1065 0.190(0.004) 0.208(0 .011) 1.099(0.060) 9.300( 1. 792) 4 bridges.csv 12 1 40 0.404( 0.022) 0.407(0.027) 1.011(0.063) 9.000(1 .287) 5 dep endent . csv 3 1000 0.000(0.000) 0.000 (0.000) 1.000(0.000) 1.000(0.000) 6 glass.csv 10 2 10 0.358( 0.041) 0.342(0.015) 0.980(0.123) 7.300(0 .943) 7 m ac hi ne.csv 10 2 01 0.357( 0.047) 0.336(0.024) 0.967(0.130) 5.400(0 .595) 8 haberman.csv 5 612 0.315(0.023 ) 0.302(0.019) 0.965(0.049) 1.900(0.617) 9 dermatology .csv 35 357 0.709(0.006) 0.653(0.012 ) 0.922(0.0 21) 58.100(4.490) 10 imports-85.csv 2 5 386 0.550(0 . 024) 0.495(0.016) 0.9 02(0.0 27) 19.900(2.290) 11 balance-scale.csv 5 1250 0.422(0.033) 0.366( 0.048) 0.871(0.10 7) 1.700 (0.581) 12 nursery .csv 9 25 920 0.469(0.029) 0.405(0 .028) 0.868(0.06 6) 4.100( 0. 966) 13 car.csv 7 3456 0.386(0.034) 0.331(0.04 0) 0.860(0.0 66) 3.000( 0. 940) 14 tictactoe.csv 10 1916 0.584(0.021) 0.476 (0.021) 0 .815(0 .024) 9.500(1.459) 15 monks-1.csv 7 1112 0.126(0.041) 0.096 (0.018) 0 .812(0 .094) 1.300(0.341) 16 ha yes-roth.csv 6 264 0.302(0.062) 0.227(0 .040) 0.782(0.12 0) 1.900( 0. 844) T able 5: Real data indep endence Hamming errors exp eriment s for a 1 / 5 of the complete dataset. Qualit y impro vemen ts when r < 1 (in b old), and qualit y reductions when r > 1 (underlined). 6. Conclusions and future w ork In conclusion, the IBMAP-HC algorithm p ro vid es the p ossibilit y of solving the p roblem for complex systems getting significant qualit y improv emen ts o ve r GSMN. IB-score seems to b e a go o d and efficien t lik eliho o d fu nction. F rom this w ork, sev er al futu re researc h p ossibilities arise that w e are motiv ated to pur- sue, in cluding con tinuing to lo ok into a practical algorithm with low er computational cost (to b e used w ith ev en more complex systems), exp erience with other appro ximate opti- mization algorithms su c h as lo cal b eam Metrop olis Hastings, contin ue w ith the analysis of qualit y measur es and p rop ose new, more efficien t an d reliable scoring fu nctions, and p er- form a thorough comparison of th ese n o vel scoring functions and existing scoring functions suc h as the lik eliho o d of the data given the complete mo del (stru cture plus parameters). 7. Ac knowle dgemen ts This w ork was fu n ded by a p ostdo ctoral fello wsh ip from CO NIC ET, Argen tina; and th e sc holarship program for teac h ers of the National T ec h nological Un iv ersity , Ministry of Sci- ence, T ec hnology and Pr o ductive Inno v ation and the National Agency of S cien tific and T ec h nological Pr omotion, F ONCyT; Argentina. App endix A. Pro of of Lemma 3 All along this work w e made th e ru nning assu m ption of graph-isomorph ism, that is, that the un derlying distrib ution we are trying to learn has a graph that enco des all and only the 25 indep en d encies that holds in the distribution. According to T heorem 2 of [Pe arl (1988), p.97], the f ollo wing pr op erties among ind ep endence h old in an y graph-isomorph distribu tion: • I ntersectio n: I ( X , Y | Z , W ) ∧ I ( X, W | Z , Y ) ⇒ I ( X ; Y , W | Z ) • Decomp osition: I ( X ; Y , W | Z ) ⇒ I ( X, Y | Z ) ∧ I ( X, W | Z ) • S trong Union: I ( X, Y | Z ) ⇒ I ( X, Y | Z , W ) Before pro vin g the main lemma of the app endix w e p resen t an auxiliat y lemma. Auxiliary Lemma 5. F or al l X 6 = Y 6 = W ∈ V and Z ⊆ V − { X , Y , W } , ¬ I ( X, Y | Z ) ∧ I ( X, Y | Z , W ) ⇒ ¬ I ( X, W | Z ) Pro of By Inte rsection and decomp osition, I ( X, Y | Z , W ) ∧ I ( X , W | Z , Y ) ⇒ I ( X ; Y , W | Z ) ⇒ I ( X, Y | Z ) . Then, by the coun ter-p ositiv e of this expr ession and the coun ter-p ositiv e of Strong Union, ¬ I ( X, Y | Z ) ∧ I ( X , Y | Z , W ) ⇒ ¬ I ( X, W | Z , Y ) ⇒ ¬ I ( X, W | Z ) . W e can now p ro ve L emm a 3 , repro du ced h ere for con venience: Lemma 3. F or ev ery W 6 = X ∈ V , and B X the b oundary of X , W / ∈ B X ⇐ I ( X , W | B X − { X , W } ) Pro of W e p ro ve its counter-p ositiv e W ∈ B X ⇒ ¬ I ( X, W | B X − { X , W } ). By min imalit y of B X , there must b e a v ariable Y / ∈ B X suc h that remo ving W fr om the blank et, Y b ecomes dep end en t of X , i.e., ¬ I ( X , Y | B X − { W } − { X, Y } ). Also, sin ce Y / ∈ B X , by the defini- tion of b oundary of Eq. (5 ) it holds that I ( X, Y | B X − { X , Y } ). The lemma follo ws then from Auxiliary Lemma 5 by letting Z = B X − { X , Y } − { W } . 26 References D.J. Newman A. Asuncion. UCI mac hine learning rep ository , 2007. S. Acid and Luis M. de Camp os. Searc hin g for Ba y esian net work structures in the space of restricted acyclic partially d irected graphs. Journal of Artificial Intel ligenc e R ese ar ch , 18:445 –490, 2003 . Alan Agresti. Cate goric al Data Analysis . Wiley , 2nd edition, 2002. C. F. Aliferis, I. Tsamard inos, and A. S tatnik o v . HITON, a n o vel Marko v blank et algo- rithm for optimal v ariable selectio n . In Pr o c e e dings of the Americ an Me dic al Informatics Asso ciation (AMIA) F al l Symp osium , 2003. D. Anguelo v, B. T ask ar, V. Chatalbashev, D. Koller, D. Gupta, G. Heitz, and A. Ng. Discriminativ e learning of Mark ov r andom fields for segmen tation of 3D range data. Pr o c e e dings of the Confer enc e on Computer Vision and P attern R e c o gnition , 2005. J. Besag. Sp acial in teraction and the statistical analysis of lattice systems. Journal of the R oyal Statistic al So ciety, Series B , 1974. J. Besag. Statistica l analysis of non-lattice data. The Statistician , 24(3):1 79–195, 1975 . J. Besag, J. Y ork, and A. Mollie. Ba yesian image restoration with t wo app lications in spatial statistics. A nnals of the Inst. of Stat. M ath. , 43:1–5 9, 1991. F. Bromberg and D. Margaritis. Imp r o ving th e reliabilit y of causal disco very from small data sets us in g argument ation. Journal of Machine L e arning R ese ar ch , 10:301–3 40, F eb 2009. F. Bromb erg, D. Margaritis, and Hona v ar V. Efficient marko v net work s tructure disco v er y using indep endence tests. Journal of Artificial Intel ligenc e R ese ar ch , 35:449– 485, J uly 2009. W. G. Co chran. S ome metho ds of strengthenin g the common χ tests. B i ometrics. , p age 10:417 –451, 1954 . N. F riedman, M. Lin ial, I. Nac hman, and D. Pe’er. Using Ba yesian net wo rks to analyze expression data. Computat ional Biolo gy , 7:601–620, 2000. D. Hec kerman, D. Geiger, and D. M. Ch ic kering. Learn in g Ba yesian n et works: The com bi- nation of kno wledge and statistica l data. Machine L e arning , 1995. S. Hettic h and S. D. Ba y . T he UCI KDD arc hive, 1999. URL http://kd d.ics.u ci.edu . D. Koller and N. F riedman. Pr ob abilistic Gr aphic al Mo dels: Principles and T e chniques . MIT Press, Cam b ridge, MA, 2009. W. L am and F. Bacc hus. Learnin g Ba y esian b elief net works: an approac h based on th e MDL principle. Computatio nal Intel ligenc e , 10:26 9–293, 199 4. 27 S. L. Lauritzen. Gr aphic al Mo dels . Oxford Unive rsit y Press, 1996. D. Margaritis. Distribution-free learning of Ba ye sian net work structure in cont in u ous do- mains. In Pr o c e e dings of A AAI , 2005. D. Margaritis and F. Brom b erg. E fficien t marko v net work d isco ve r y using p article filter. Computation al Intel ligenc e , 25(4) :367–3 94, Sep temb er 2009. D. Margaritis and S. T hrun . Bay esian net w ork in duction via lo cal neighborh o o ds. In S.A. Solla, T.K. Leen, and K.R. M ¨ uller, editors, A dvanc es in Neur al Information P r o c essing Systems 12 , pages 505–511 . MIT Press, 2000. A. McCallum. Effi cien tly ind ucing features of conditional random fi elds . In Pr o c e e dings of Unc ertainty in A rtificial Intel ligenc e (U AI) , 2003. J. P earl. Pr ob abilistic R e asoning in Intel ligent Systems: N etworks of Plausible Infe r enc e . Morgan Kaufmann Publisher s , Inc., 1988. S. Shekh ar, P . Z h ang, Y. Huang, and R. R. V atsa v ai. In H. Kargupta, A. Joshi, K. S iv aku - mar, and Y. Y esha, ed itors, T r ends in Sp atial D ata Mining , chapter 19, pages 357–379. AAAI Press / The MIT Press, 2004. P . Spirtes, C. Glymour , and R. Sc heines. Causation, Pr e diction, and Se ar ch . Ad aptiv e Computation and Mac hine Learning Series. MIT Press, 2000. I. Tsamardinos, C. F. Aliferis, and A. Statnik ov. Algorithms for large scale Mark ov blanket disco ve ry . In Pr o c e e dings of the 16th International FLAIRS Confer enc e , p ages 376–381, 2003. Y. Y u and Q. Cheng. MRF parameter estimation b y an accelerated metho d. P attern R e c o gnition L etters , 24(9-10 ):1251–1259, 2003. 28
Original Paper
Loading high-quality paper...
Comments & Academic Discussion
Loading comments...
Leave a Comment