Hierarchical Clustering for Finding Symmetries and Other Patterns in Massive, High Dimensional Datasets
Data analysis and data mining are concerned with unsupervised pattern finding and structure determination in data sets. "Structure" can be understood as symmetry and a range of symmetries are expressed by hierarchy. Such symmetries directly point to …
Authors: ** 논문 본문에 저자 정보가 명시되지 않았으나, 주요 인용·언급으로 보아 Herbert A. Simon(노벨 경제학상 수상자)과 관련 연구자들의 사상·이론을 바탕으로 작성된 것으로 추정됩니다. **
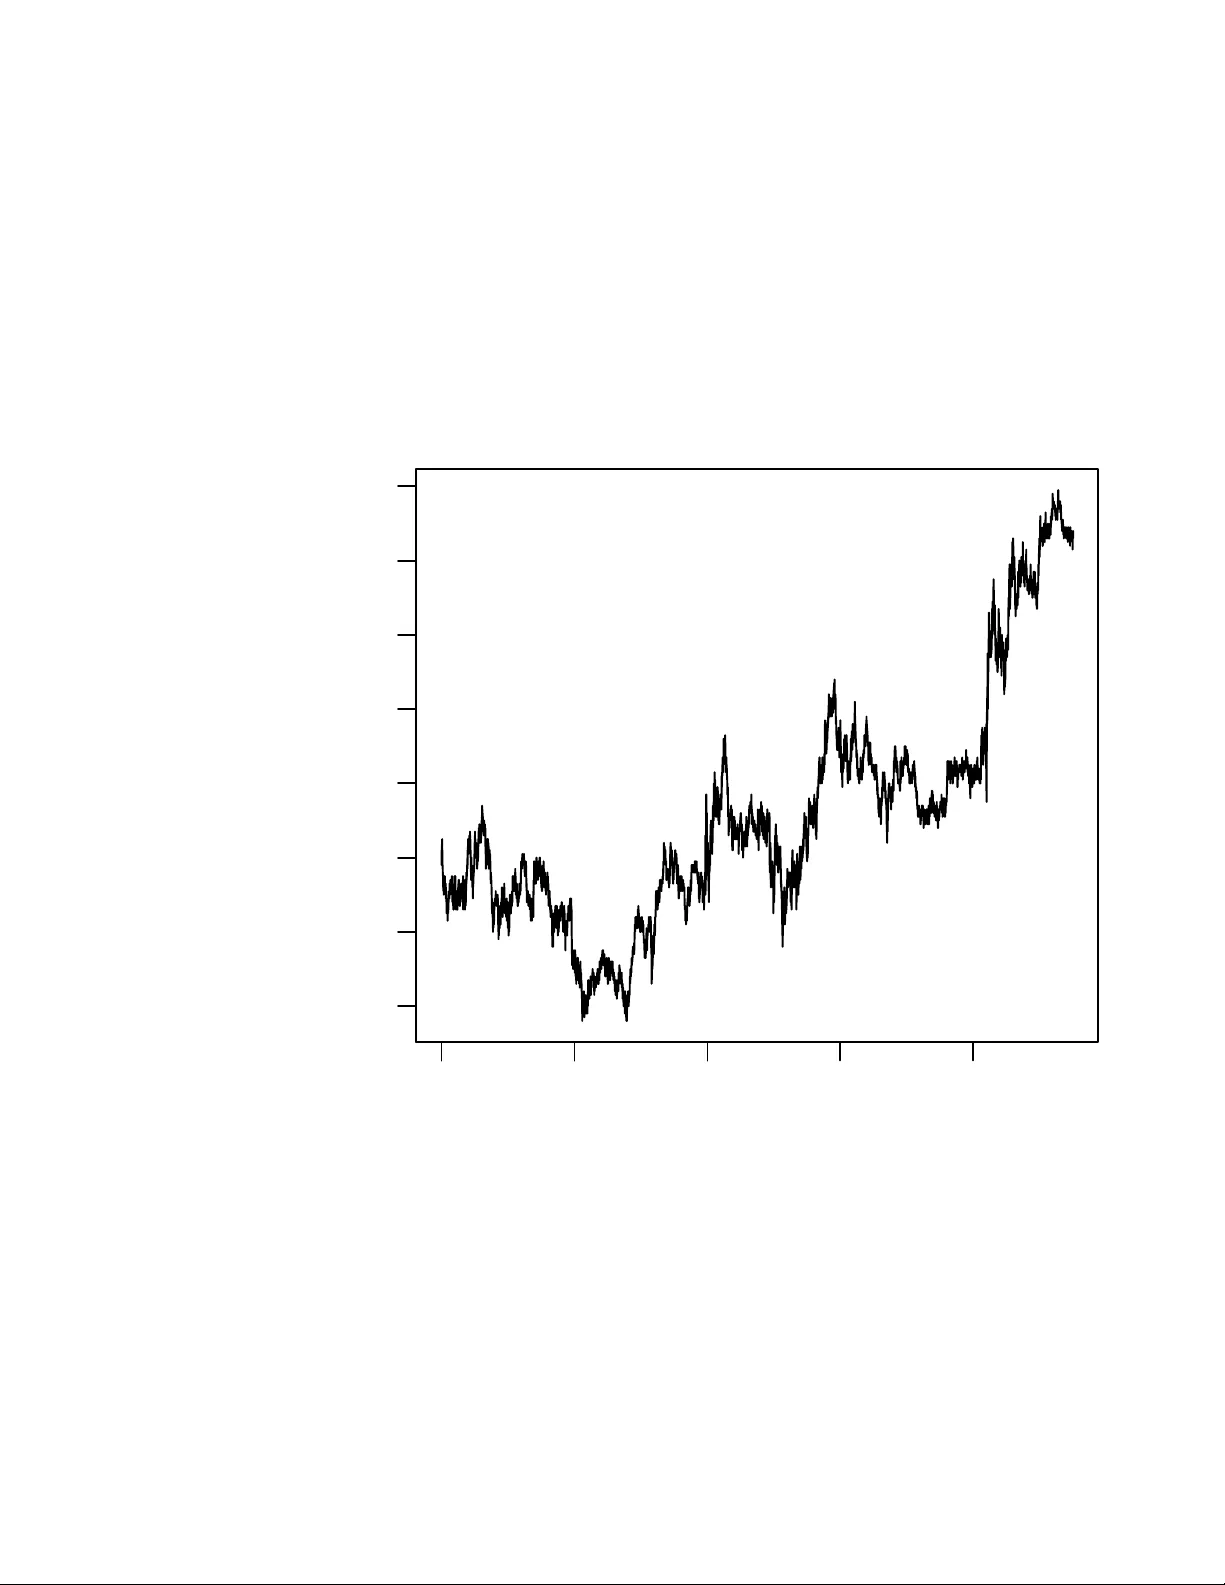
Hierarc hical Clustering for Finding Symmetries and Other P atterns in Massiv e, High Dimensional Datasets Fionn Murtagh (1, 2) and P edro Contreras (2) (1) Science F oundation Ireland, Wilton P ark House, Wilton Place, Dublin 2, Ireland and (2) Departmen t of Computer Science Ro yal Hollo w a y , Universit y of London Egham TW20 0EX, UK fm urtagh@acm.org Ma y 26, 2022 Abstract Data analysis and data mining are concerned with unsup ervised pat- tern finding and structure determination in data sets. “Structure” can b e understo o d as symmetry and a range of symmetries are expressed b y hierarc hy . Suc h symmetries directly p oint to inv arian ts, that pinpoint in trinsic prop erties of the data and of the background empirical domain of in terest. W e review many asp ects of hierarch y here, including ultra- metric topology , generalized ultrametric, link ages with lattices and other discrete algebraic structures and with p-adic n umber representations. By fo cusing on symmetries in data we hav e a p ow erful means of structuring and analyzing massiv e, high dimensional data stores. W e illustrate the p o werfulness of hierarc hical clustering in case studies in chemistry and finance, and we provide pointers to other published case studies. Keyw ords: Data analytics, multiv ariate data analysis, pattern recognition, in- formation storage and retriev al, clustering, hierarc hy , p-adic, ultrametric top ol- ogy , complexity 1 In tro duction: Hierarc h y and Other Symme- tries in Data Analysis Herb ert A. Simon, Nob el Laureate in Economics, originator of “b ounded ratio- nalit y” and of “satisficing”, b elieved in hierarc hy at the basis of the h uman and 1 so cial sciences, as the following quotation shows: “... my central theme is that complexit y frequently takes the form of hierarch y and that hierarc hic systems ha ve some common prop erties indep endent of their sp ecific conten t. Hierar- c hy , I shall argue, is one of the cen tral structural sc hemes that the architect of complexit y uses.” ([74], p. 184.) P artitioning a set of observ ations [75, 76, 49] leads to some v ery simple symmetries. This is one approach to clustering and data mining. But suc h approac hes, often based on optimization, are not of direct interest to us here. Instead we will pursue the theme p ointed to by Simon, namely that the notion of hierarch y is fundamental for in terpreting data and the complex reality which the data expresses. Our work is v ery different to o from the marvelous view of the developmen t of mathematical group theory – but view ed in its own right as a complex, evolving system – presented by F o ote [19]. W eyl [80] makes the case for the fundamen tal importance of symmetry in science, engineering, architecture, art and other areas. As a “guiding principle”, “Whenev er y ou ha ve to do with a structure-endo wed entit y ... try to determine its group of automorphisms, the group of those element-wise transformations whic h leav e all structural relations undisturbed. Y ou can exp ect to gain a deep insigh t in the constitution of [the structure-endow ed en tity] in this wa y . After that you may start to in vestigate symmetric configurations of elemen ts, i.e. configurations which are inv arian t under a certain subgroup of the group of all automorphisms; ...” ([80], p. 144). 1.1 Ab out this Article In section 2, w e describe ultrametric topology as an expression of hierarc hy . This pro vides comprehensive background on the commonly used quadratic computa- tional time (i.e., O ( n 2 ), where n is the n umber of observ ations) agglomerative hierarc hical clustering algorithms. In section 3, we lo ok at the generalized ultrametric context. This is closely link ed to analysis based on lattices. W e use a case study from c hemical database matc hing to illustrate algorithms in this area. In section 4, p-adic enco ding, pro viding a num b er theory v antage p oin t on ultrametric top ology , giv es rise to additional symmetries and wa ys to capture in v ariants in data. Section 5 deals with symmetries that are part and parcel of a tree, repre- sen ting a partial order on data, or equally a set of subsets of the data, some of whic h are embedded. An application of suc h symmetry targets from a dendro- gram expressing a hierarchical em b edding is provided through the Haar wa v elet transform of a dendrogram and wa velet filtering based on the transform. Section 6 deals with new and recent results relating to the remark able sym- metries of massive, and esp ecially high dimensional data sets. An example is discussed of segmenting a financial forex (foreign exchange) trading signal. 2 1.2 A Brief In tro duction to Hierarchical Clustering F or the reader new to analysis of data a very short introduction is now pro- vided on hierarc hical clustering. Along with other families of algorithm, the ob jective is automatic classification, for the purp oses of data mining, or knowl- edge discov ery . Classification, after all, is fundamental in human thinking, and mac hine-based decision making. But we dra w atten tion to the fact that our ob jective is unsup ervise d , as opp osed to sup ervise d classification, also known as discriminan t analysis or (in a general w ay) mac hine learning. So here we are not concerned with generalizing the decision making capability of training data, nor are w e concerned with fitting statistical models to data so that these models can pla y a role in generalizing and predicting. Instead w e are concerned with ha ving “data sp eak for themselves”. That this unsup ervised ob jective of classi- fying data (observ ations, ob jects, even ts, phenomena, etc.) is a huge task in our so ciet y is unquestionably true. One ma y think of situations when precedents are very limited, for instance. Among families of clustering, or unsup ervised classification, algorithms, w e can distinguish the following: (i) arra y p ermuting and other visualization ap- proac hes; (ii) partitioning to form (discrete or o verlapping) clusters through optimization, including graph-based approaches; and – of interest to us in this article – (iii) embedded clusters interrelated in a tree-based wa y . F or the last-mentioned family of algorithm, agglomerative building of the hierarc hy from consideration of ob ject pairwise distances has b een the most common approach adopted. As comprehensive background texts, see [48, 30, 81, 31]. 1.3 A Brief In tro duction to p-Adic Numbers The real n umber system, and a p-adic num b er system for giv en prime, p, are p oten tially equally useful alternativ es. p-Adic n um b ers w ere in tro duced b y Kurt Hensel in 1898. Whether w e deal with Euclidean or with non-Euclidean geometry , we are (nearly) alw ays dealing with reals. But the reals start with the natural n umbers, and from asso ciating observ ational facts and details with such num b ers w e begin the pro cess of measurement. F rom the natural num b ers, w e pro ceed to the rationals, allowing fractions to b e taken into consideration. The following view of ho w we do science or carry out other quantitativ e study w as prop osed by V olovic h in 1987 [78, 79]. See also the surveys in [15, 22]. W e can alwa ys use rationals to mak e measurements. But they will b e approximate, in general. It is b etter therefore to allow for observ ables b eing “con tinuous, i.e. endo w them with a top ology”. Therefore we need a completion of the field Q of rationals. T o complete the field Q of rationals, we need Cauch y sequences and this requires a norm on Q (b ecause the Cauc hy sequence must con verge, and a norm is the to ol used to show this). There is the Archimedean norm suc h that: for any x, y ∈ Q , with | x | < | y | , then there exists an in teger N such that | N x | > | y | . F or conv enience here, w e write: | x | ∞ for this norm. So if this 3 completion is Arc himedean, then we hav e R = Q ∞ , the reals. That is fine if space is taken as comm utative and Euclidean. What of alternatives? Remark ably all norms are known. Besides the Q ∞ norm, we hav e an infinity of norms, | x | p , lab eled by primes, p. By Ostrowski’s theorem [65] these are all the p ossible norms on Q . So we ha ve an unambiguous lab eling, via p, of the infinite set of non-Arc himedean completions of Q to a field endow ed with a top ology . In all cases, w e obtain lo cally compact completions, Q p , of Q . They are the fields of p-adic num b ers. All these Q p are con tinua. Being lo cally compact, they ha ve additive and multiplicativ e Haar measures. As such we can integrate ov er them, such as for the reals. 1.4 Brief Discussion of p-Adic and m-Adic Num b ers W e will use p to denote a prime, and m to denote a non-zero positive in teger. A p-adic num b er is such that any set of p in tegers which are in distinct residue classes mo dulo p may b e used as p-adic digits. (Cf. remark b elow, at the end of section 4.1, quoting from [25]. It makes the p oint that this op ens up a range of alternativ e notation options in practice.) Recall that a ring do es not allo w division, while a field does. m-Adic num b ers form a ring; but p-adic num b ers form a field. So a priori, 10-adic num b ers form a ring. This provides us with a reason for preferring p-adic o ver m-adic n umbers. W e can consider v arious p-adic expansions: 1. P n i =0 a i p i , whic h defines positive integers. F or a p-adic num b er, w e require a i ∈ 0 , 1 , ...p − 1. (In practice: just write the integer in binary form.) 2. P n i = −∞ a i p i defines rationals. 3. P ∞ i = k a i p i where k is an integer, not necessarily p ositive, defines the field Q p of p-adic num b ers. Q p , the field of p-adic num b ers, is (as seen in these definitions) the field of p-adic expansions. The choice of p is a practical issue. Indeed, adelic num b ers use all p ossi- ble v alues of p (see [6] for extensive use and discussion of the adelic num b er framew ork). Consider [14, 37]. DNA (desoxyribonucleic acid) is enco ded using four nucleotides: A, adenine; G, guanine; C, cytosine; and T, th ymine. In RNA (rib on ucleic acid) T is replaced by U, uracil. In [14] a 5-adic enco ding is used, since 5 is a prime and thereby offers uniqueness. In [37] a 4-adic enco ding is used, and a 2-adic enco ding, with the latter based on 2-digit bo olean expressions for the four nucleotides (00, 01, 10, 11). A default norm is used, based on a longest common prefix – with p-adic digits from the start or left of the sequence (see section 4.2 b elow where this longest common prefix norm or distance is used and, b efore that, section 3.3 where an example is discussed in detail). 4 2 Ultrametric T opology In this section we mainly explore symmetries related to: geometric shap e; matrix structure; and lattice structures. 2.1 Ultrametric Space for Represen ting Hierarc hy Consider Figures 1 and 2, illustrating the ultrametric distance and its role in defining a hierarch y . An early , influen tial pap er is Johnson [35] and an imp ortan t surv ey is that of Rammal et al. [67]. Discussion of how a hierarc hy expresses the semantics of change and distinction can b e found in [61]. The ultrametric top ology w as introduced by Marc Krasner [40], the ultra- metric inequality having b een form ulated by Hausdorff in 1934. Essential moti- v ation for the study of this area is provided b y [70] as follo ws. Real and complex fields gav e rise to the idea of studying an y field K with a complete v aluation | . | comparable to the absolute v alue function. Suc h fields satisfy the “strong triangle inequalit y” | x + y | ≤ max( | x | , | y | ). Giv en a v alued field, defining a to- tally ordered Ab elian (i.e. commutativ e) group, an ultrametric space is induced through | x − y | = d ( x, y ). V arious terms are used in terchangeably for analysis in and o ver suc h fields such as p-adic, ultrametric, non-Arc himedean, and isosceles. The natural geometric ordering of metric v aluations is on the real line, whereas in the ultrametric case the natural ordering is a hierarchical tree. 2.2 Some Geometrical Prop erties of Ultrametric Spaces W e see from the follo wing, based on [41] (c hapter 0, part IV), that an ultrametric space is quite different from a metric one. In an ultrametric space everything “liv es” on a tree. In an ultrametric space, all triangles are either isosceles with small base, or equilateral. W e hav e here v ery clear symmetries of shap e in an ultrametric top ology . These symmetry “patterns” can be used to fingerprint data data sets and time series: see [55, 57] for many examples of this. Some further properties that are studied in [41] are: (i) Every point of a circle in an ultrametric space is a center of the circle. (ii) In an ultrametric top ology , ev ery ball is b oth op en and closed (termed clopen). (iii) An ultrametric space is 0-dimensional (see [7, 69]). It is clear that an ultrametric top ology is very differen t from our in tuitive, or Euclidean, notions. The most imp ortant p oint to keep in mind is that in an ultrametric space everything “lives” in a hierarch y expressed by a tree. 2.3 Ultrametric Matrices and Their Prop erties F or an n × n matrix of p ositive reals, symmetric with resp ect to the principal diagonal, to b e a matrix of distances asso ciated with an ultrametric distance on X , a sufficient and necessary condition is that a p ermutation of rows and columns satisfies the following form of the matrix: 5 x y z 1.0 1.5 2.0 2.5 3.0 3.5 Height Figure 1: The strong triangular inequality defines an ultrametric: every triplet of p oints satisfies the relationship: d ( x, z ) ≤ max { d ( x, y ) , d ( y , z ) } for dis- tance d . Cf. b y reading off the hierarc hy , how this is verified for all x, y , z : d ( x, z ) = 3 . 5; d ( x, y ) = 3 . 5; d ( y , z ) = 1 . 0. In addition the symmetry and p ositive definiteness conditions hold for an y pair of p oints. 1. Ab ov e the diagonal term, equal to 0, the elemen ts of the same row are non-decreasing. 2. F or every index k , if d ( k , k + 1) = d ( k , k + 2) = · · · = d ( k, k + ` + 1) then d ( k + 1 , j ) ≤ d ( k, j ) for k + 1 < j ≤ k + ` + 1 and d ( k + 1 , j ) = d ( k , j ) for j > k + ` + 1 Under these circumstances, ` ≥ 0 is the length of the section b eginning, b ey ond the principal diagonal, the interv al of columns of equal terms in ro w k . T o illustrate the ultrametric matrix format, consider the small data set sho wn in T able 1. A dendrogram pro duced from this is in Figure 3. The ultrametric matrix that can b e read off this dendrogram is shown in T able 2. Finally a visualization of this matrix, illustrating the ultrametric matrix prop- erties discussed ab ov e, is in Figure 4. 6 10 20 30 40 5 10 15 20 Property 1 Property 2 ● ● ● ● Isosceles triangle: approx equal long sides Figure 2: How metric data can approximate an ultrametric, or can b e made to appro ximate an ultrametric in the case of a stepwise, agglomerative algorithm. A “query” is on the far right. While we can easily determine the closest target (among the three ob jects represented by the dots on the left), is the closest really that m uch different from the alternatives? This question motiv ates an ultrametric view of the metric relationships shown. 2.4 Clustering Through Matrix Ro w and Column P erm u- tation Figure 4 shows how an ultrametric distance allows a certain structure to b e visible (quite p ossibly , in practice, sub ject to an appropriate row and column p erm uting), in a matrix defined from the set of all distances. F or set X , then, this matrix expresses the distance mapping of the Cartesian pro duct, d : X × X − → R + . R + denotes the non-negative reals. A priori the rows and columns of the function of the Cartesian pro duct set X with itself could b e in any order. The ultrametric matrix prop erties establish what is p ossible when the distance is an ultrametric one. Because the matrix (a 2-wa y data ob ject) inv olves one mo de (due to set X b eing crossed with itself; as opp osed to the 2-mode case where an observ ation set is crossed b y an attribute set) it is clear that both ro ws and columns can be p ermuted to yield the same order on X . A prop ert y of the form of the matrix is that small v alues are at or near the principal diagonal. A generalization op ens up for this sort of clustering by visualization scheme. Firstly , we can directly apply row and column permuting to 2-mo de data, i.e. 7 Sepal.Length Sepal.Width P etal.Length Petal.Width iris1 5.1 3.5 1.4 0.2 iris2 4.9 3.0 1.4 0.2 iris3 4.7 3.2 1.3 0.2 iris4 4.6 3.1 1.5 0.2 iris5 5.0 3.6 1.4 0.2 iris6 5.4 3.9 1.7 0.4 iris7 4.6 3.4 1.4 0.3 T able 1: Input data: 8 iris flow ers characterized by sepal and p etal widths and lengths. F rom Fisher’s iris data [17]. iris1 iris2 iris3 iris4 iris5 iris6 iris7 iris1 0 0.6480741 0.6480741 0.6480741 1.1661904 1.1661904 1.1661904 iris2 0.6480741 0 0.3316625 0.3316625 1.1661904 1.1661904 1.1661904 iris3 0.6480741 0.3316625 0 0.2449490 1.1661904 1.1661904 1.1661904 iris4 0.6480741 0.3316625 0.2449490 0 1.1661904 1.1661904 1.1661904 iris5 1.1661904 1.1661904 1.1661904 1.1661904 0 0.6164414 0.9949874 iris6 1.1661904 1.1661904 1.1661904 1.1661904 0.6164414 0 0.9949874 iris7 1.1661904 1.1661904 1.1661904 1.1661904 0.9949874 0.9949874 0 T able 2: Ultrametric matrix deriv ed from the dendrogram in Figure 3. to the rows and columns of a matrix crossing indices I b y attributes J , a : I × J − → R . A matrix of v alues, a ( i, j ), is furnished b y the function a acting on the sets I and J . Here, each suc h term is real-v alued. W e can also generalize the principle of p ermuting such that small v alues are on or near the principal diagonal to instead allow similar v alues to b e near one another, and thereby to facilitate visualization. An optimized wa y to do this was pursued in [45, 44]. Comprehensiv e surveys of clustering algorithms in this area, including ob jective functions, visualization schemes, optimization approac hes, presence of constrain ts, and applications, can b e found in [46, 43]. See to o [12, 53]. F or all these approaches, underpinning them are row and column p ermu- tations, that can b e expressed in terms of the p ermutation group, S n , on n elemen ts. 2.5 Other Miscellaneous Symmetries As examples of v arious other lo cal symmetries worth y of consideration in data sets consider subsets of data comprising clusters, and recipro cal nearest neighbor pairs. Giv en an observ ation set, X , w e define dissimilarities as the mapping d : X × X − → R + . A dissimilarity is a p ositive, definite, symmetric measure (i.e., d ( x, y ) ≥ 0; d ( x, y ) = 0 if x = y ; d ( x, y ) = d ( y , x )). If in addition the triangular inequalit y is satisfied (i.e., d ( x, y ) ≤ d ( x, z ) + d ( z , y ) , ∀ x, y , z ∈ X ) then the 8 1 3 4 2 5 6 7 0.2 0.4 0.6 0.8 1.0 1.2 Height Figure 3: Hierarchical clustering of 7 iris flo wers using data from T able 1. No data normalization w as used. The agglomerative clustering criterion was the minim um v ariance or W ard one. dissimilarit y is a distance. If X is endow ed with a metric, then this metric is mapp ed onto an ultramet- ric. In practice, there is no need for X to b e endow ed with a metric. Instead a dissimilarit y is satisfactory . A hierarch y , H , is defined as a binary , ro oted, node-ranked tree, also termed a dendrogram [3, 35, 41, 53]. A hierarch y defines a set of embedded subsets of a given set of ob jects X , indexed by the set I . That is to sa y , ob ject i in the ob ject set X is denoted x i , and i ∈ I . These subsets are total ly or der e d by an index function ν , whic h is a stronger condition than the p artial or der required b y the subset relation. The index function ν is represented by the ordinate in Figure 3 (the “height” or “lev el”). A bijection exists b etw een a hierarc hy and an ultrametric space. Often in this article we will refer interc hangeably to the ob ject set, X , and the asso ciated set of indices, I . Usually a constructive approach is used to induce H on a set I . The most efficien t algorithms are based on nearest neighbor chains, which by definition end in a pair of agglomerable recipro cal nearest neigh b ors. F urther information can b e found in [50, 51, 53, 54]. 9 Figure 4: A visualization of the ultrametric matrix of T able 2, where bright or white = highest v alue, and black = low est v alue. 3 Generalized Ultrametric In this subsection, we consider an ultrametric defined on the p ow er set or join semilattice. Comprehensiv e background on ordered sets and lattices can be found in [10]. A review of generalized distances and ultrametrics can b e found in [72]. 3.1 Link with F ormal Concept Analysis T ypically hierarchical clustering is based on a distance (which can b e relaxed often to a dissimilarity , not resp ecting the triangular inequality , and mutatis mutandis to a similarit y), defined on all pairs of the ob ject set: d : X × X → R + . I.e., a distance is a positive real v alue. Usually w e require that a distance cannot b e 0-v alued unless the ob jects are identical. That is the traditional approach. A different form of ultrametrization is achiev ed from a dissimilarity defined on the p ow er se t of attributes c haracterizing the observ ations (ob jects, individ- uals, etc.) X . Here we hav e: d : X × X − → 2 J , where J indexes the attribute (v ariables, characteristics, prop erties, etc.) set. This gives rise to a differen t notion of distance, that maps pairs of ob jects 10 on to elemen ts of a join semilattice. The latter can represent all subsets of the attribute set, J . That is to say , it can represent the p ow er set, commonly denoted 2 J , of J . As an example, consider, say , n = 5 ob jects c haracterized by 3 b o olean (presence/absence) attributes, sho wn in Figure 5 (top). Define dissimilarity b et ween a pair of ob jects in this table as a set of 3 comp onents, corresp onding to the 3 attributes, such that if b oth comp onents are 0, we hav e 1; if either comp onen t is 1 and the other 0, we ha ve 1; and if b oth comp onents are 1 we get 0. This is the simple matching coefficient [33]. W e could use, e.g., Euclidean distance for each of the v alues sought; but we prefer to treat 0 v alues in b oth comp onen ts as signaling a 1 contribution. W e get then d ( a, b ) = 1 , 1 , 0 whic h w e will call d1,d2 . Then, d ( a, c ) = 0 , 1 , 0 which we will call d2 . Etc. With the latter we create lattice no des as shown in the middle part of Figure 5. In F ormal Concept Analysis [10, 24], it is the lattice itself whic h is of primary in terest. In [33] there is discussion of, and a range of examples on, the close relationship betw een the traditional hierarc hical cluster analysis based on d : I × I → R + , and hierarchical cluster analysis “based on abstract p osets” (a p oset is a partially ordered set), based on d : I × I → 2 J . The latter, leading to clustering based on dissimilarities, w as developed initially in [32]. 3.2 Applications of Generalized Ultrametrics As noted in the previous subsection, the usual ultrametric is an ultrametric distance, i.e. for a set I, d : I × I − → R + . The generalized ultrametric is also consisten t with this definition, where the range is a subset of the p ow er set: d : I × I − → Γ, where Γ is a partially ordered set. In other words, the gener alize d ultrametric distance is a set. Some areas of application of generalized ultrametrics will now b e discussed. In the theory of reasoning, a monotonic op erator is rigorous application of a succession of conditionals (sometimes called consequence relations). How- ev er negation or m ultiple v alued logic (i.e. encompassing in termediate truth and falseho o d) require supp ort for non-monotonic reasoning. Th us [28]: “Once one introduces negation ... then certain of the imp ortant op erators are not monotonic (and therefore not contin uous), and in consequence the Knaster-T arski theorem [i.e. for fixed p oints; see [10]] is no longer applicable to them. V arious wa ys hav e b een prop osed to ov ercome this problem. One such [approac h is to use] syntactic conditions on programs ... Another is to consider differen t operators ... The third main solution is to in tro duce tec hniques from top ology and analysis to augmen t argumen ts based on order ... [the latter include:] methods based on metrics ... on quasi-metrics ... and finally ... on ultrametric spaces.” The conv ergence to fixed points that are based on a generalized ultrametric system is precisely the study of spherically complete systems and expansiv e automorphisms discussed in section 4.3 b elow. As expansive automorphisms we see here again an example of symmetry at w ork. 11 v 1 v 2 v 3 a 1 0 1 b 0 1 1 c 1 0 1 e 1 0 0 f 0 0 1 Potential lattice vertices Lattice vertices found Level d1,d2,d3 d1,d2,d3 3 / \ / \ d1,d2 d2,d3 d1,d3 d1,d2 d2,d3 2 \ / \ / d1 d2 d3 d2 1 The set d1,d2,d3 corresp onds to: d ( b, e ) and d ( e, f ) The subset d1,d2 corresp onds to: d ( a, b ) , d ( a, f ) , d ( b, c ) , d ( b, f ) , and d ( c, f ) The subset d2,d3 corresp onds to: d ( a, e ) and d ( c, e ) The subset d2 corresp onds to: d ( a, c ) Clusters defined by all pairwise link age at level ≤ 2: a, b, c, f a, c, e Clusters defined by all pairwise link age at level ≤ 3: a, b, c, e, f Figure 5: T op: example data set consisting of 5 ob jects, characterized by 3 b o olean attributes. Then: lattice corresp onding to this data and its interpreta- tion. 12 3.3 Example of Application: Chemical Database Match- ing In the 1990s, the W ard minimum v ariance hierarchical clustering metho d b e- came the metho d of choice in the chemoinformatics comm unity due to its hi- erarc hical nature and the quality of the clusters pro duced. Unfortunately the metho d reached its limits once the pharmaceutical companies tried pro cessing datasets of more than 500,000 compounds due to: the O ( n 2 ) pro cessing require- men ts of the recipro cal nearest neighbor algorithm; the requiremen t to hold all c hemical structure “fingerprints” in memory to enable random access; and the requiremen t that parallel implementation use a shared-memory architecture. Let us lo ok at an alternative hierarchical clustering algorithm that bypasses these computational difficulties. A direct application of generalized ultrametrics to data mining is the fol- lo wing. The p oten tially huge adv antage of the generalized ultrametric is that it allows a hierarch y to b e read directly off the I × J input data, and bypasses the O ( n 2 ) consideration of all pairwise distances in agglomerative hierarchical clustering. In [62] we study application to chemoinformatics. Pro ximity and b est match finding is an essential op eration in this field. Typically w e hav e one million chemicals upw ards, c haracterized by an approximate 1000-v alued attribute enco ding. Consider first our need to normalize the data. W e divide each b o olean (presence/absence) v alue b y its corresp onding column sum. W e can consider the hierarc hical cluster analysis from abstract p osets as based on d : I × I → R | J | . In [33], the median of the | J | distance v alues is used, as input to a traditional hierarc hical clustering, with alternative schemes discussed. See also [32] for an early elab oration of this approac h. Let us now pro ceed to take a particular approach to this, which has very con vincing computational b enefits. 3.3.1 Ultrametrization through Baire Space Em b edding: Notation A Baire space [42] consists of countably infinite sequences with a metric defined in terms of the longest common prefix: the longer the common prefix, the closer a pair of sequences. The Baire metric, and simultaneously ultrametric, will b e defined in definition 1 in the next subsection. What is of interest to us here is this longest common prefix metric, whic h additionally is an ultrametric. The longest common prefixes at issue here are those of precision of any v alue (i.e., x ij , for c hemical comp ound i , and chemical structure co de j ). Consider t wo suc h v alues, x ij and y ij , whic h, when the context easily allo ws it, we will call x and y . Each are of some precision, and w e take the integer | K | to b e the maxim um precision. W e pad a v alue with 0s if necessary , so that all v alues are of the same precision. Finally , w e will assume for con venience that eac h v alue ∈ [0 , 1) and this can b e arranged by normalization. 13 3.3.2 The Case of One A ttribute Th us we consider ordered sets x k and y k for k ∈ K . In line with our notation, w e can write x K and y K for these num b ers, with the set K no w ordered. (So, k = 1 is the first decimal place of precision; k = 2 is the second decimal place; . . . ; k = | K | is the | K | th decimal place.) The cardinality of the set K is the precision with which a num b er, x K , is measured. Without loss of generalit y , through normalization, we will take all x K , y K ≤ 1. W e will also consider decimal num b ers, only , in this article (hence x k ∈ { 0 , 1 , 2 , . . . , 9 } for all n umbers x , and for all digits k ), again with no loss of generality to non-decimal n umber representations. Consider as examples x K = 0 . 478; and y K = 0 . 472. In these cases, | K | = 3. F or k = 1, we find x k = y k = 4. F or k = 2 , x k = y k . But for k = 3 , x k 6 = y k . W e now in tro duce the following distance: d B ( x K , y K ) = ( 1 if x 1 6 = y 1 inf 2 − n x n = y n 1 ≤ n ≤ | K | (1) So for x K = 0 . 478 and y K = 0 . 472 we hav e d B ( x K , y K ) = 2 − 2 = 0 . 25. The Baire distance is used in denotational semantics where one considers x K and y K as words (of equal length, in the finite case), and then this distance is defined from a common n -length prefix, or left substring, in the t wo words. F or a set of w ords, a prefix tree can b e built to exp edite word matching, and the Baire distance derived from this tree. W e ha ve 1 ≥ d B ( x K , y K ) ≥ 2 −| K | . Identical x K and y K ha ve Baire distance equal to 2 −| K | . The Baire distance is a 1-b ounded ultrametric. The Baire ultrametric defines a hierarch y , which can b e expressed as a mul- tiw ay tree, on a set of num b ers, x I K . So the num b er x iK , indexed by i , i ∈ I , is of precision | K | . It is actually simple to determine this hierarch y . The partition at level k = 1 has clusters defined as all those num b ers indexed by i that share the same 1st digit. The partition at lev el k = 2 has clusters defined as all those n umbers indexed by i that share the same 2nd digit; and so on, until we reac h k = | K | . A strictly finer, or identical, partition is to b e found at each successiv e lev el (since once a pair of num b ers b ecomes dissimilar, d B > 0, this non-zero distance cannot b e rev ersed). Iden tical n umbers at level k = 1 hav e distance ≤ 2 − 1 = 0 . 5. Iden tical num b ers at level k = 2 hav e distance ≤ 2 − 2 = 0 . 25. Iden tical n umbers at lev el k = 3 ha ve distance ≤ 2 − 3 = 0 . 125; and so on, to lev el k = | K | , when distance = 2 −| K | . 3.3.3 Analysis: Baire Ultrametrization from Numerical Precision In this section w e use (i) a random pro jection of vectors into a 1-dimensional space (so each chemical structure is mapp ed onto a scalar v alue, b y design ≥ 0 and ≤ 1) follo wed by (ii) implicit use of a prefix tree constructed on the digits of the set of scalar v alues. First w e will look at this pro cedure. Then we will return to discuss its prop erties. W e seek all i, i 0 suc h that: 14 Sig. dig. c No. clusters 4 6591 4 6507 4 5735 3 6481 3 6402 3 5360 2 2519 2 2576 2 2135 1 138 1 148 1 167 T able 3: Results for the three different data sets, each consisting of 7500 chem- icals, are shown in immediate succession. The num b er of significant decimal digits is 4 (more precise, and hence more different clusters found), 3, 2, and 1 (lo west precision in terms of significant digits). 1. for all j ∈ J , 2. x ij K = x i 0 j K 3. to fixed precision K Recall that K is an ordered set. W e imp ose a user sp ecified upp er limit on precision, | K | . No w rather than | J | separate tests for equality (p oint 1 ab o ve), a sufficient c ondition is that P j w j x ij K = P j w j x i 0 j K for a set of w eights w j . What helps in making this sufficient condition for equalit y w ork w ell in practice is that man y of the x iJ K v alues are 0: cf. the appro ximate 8% matrix o ccupancy rate that holds here. W e exp erimented with suc h p ossibilities as w j = j (i.e., { 1 , 2 , . . . , | J |} and w j = | J | + 1 − j (i.e., {| J | , | J | − 1 , . . . , 3 , 2 , 1 } . A first principal comp onen t would allo w for the definition of the least squares optimal linear fit of the pro jections. The b est choice of w j v alues we found for uniformly distributed v alues in (0 , 1): for each j , w j ∼ U (0 , 1). T able 3 shows, in immediate succession, results for three data sets. The normalizing column sums w ere calculated and applied independently to each of the three data sets. Insofar as x J is directly proportional, whether calculated on 7500 chemical structures or 1.2 million, leads to a constan t of prop ortionality , 15 only , b et ween the tw o cases. As noted, a random pro jection was used. Finally , iden tical pro jected v alues were read off, to determine clusters. 3.3.4 Discussion: Random Pro jection and Hashing Random pro jection is the finding of a low dimensional embedding of a p oint set – dimension equals 1, or a line or axis, in this w ork – such that the distortion of any pair of p oints is b ounded by a function of the low er dimensionality [77]. There is a burgeoning literature in this area, e.g. [16]. While random pro jection p er se will not guarantee a bijection of best match in original and in low er dimensional spaces, our use of pro jection here is effectively a hashing metho d ([47] uses MD5 for nearest neighbor searc h), in order to deliberately find hash collisions – thereby providing a sufficient condition for the mapp ed v ectors to b e identical. Collision of identically v alued vectors is guaran teed, but what of collision of non-iden tically v alued vectors, whic h we w ant to av oid? T o prov e such a result may require an assumption of what distribution our original data follow. A general class is referred to as a stable distribution [29]: this is a distribution such that a limited nu mber of w eighted sums of the v ariables is also itself of the same distribution. Examples include b oth Gaussian and long- tailed or p ow er law distributions. In terestingly , how ever, v ery high dimensional (or equiv alently , very lo w sam- ple size or low n ) data sets, by virtue of high relative dimensionalit y alone, hav e p oin ts mostly lying at the vertices of a regular simplex or p olygon [55, 27]. This in triguing asp ect is one reason, p erhaps, wh y w e ha ve found random pro jection to work well. Another reason is the follo wing: if we work on normalized data, then the v alues on an y t wo attributes j will be small. Hence x j and x 0 j are small. No w if the random weigh t for this attribute is w j , then the random pro jections are, resp ectively , P j w j x j and P j w j x 0 j . But these terms are dominated by the random weigh ts. W e can exp ect near equal x j and x 0 j terms, for all j , to be mapp ed onto fairly close resultan t scalar v alues. F urther work is required to confirm these hypotheses, viz., that high dimen- sional data may b e highly “regular” or “structured” in such a wa y; and that, as a consequence, hashing is particularly well-behav ed in the sense of non-identical v ectors b eing nearly alwa ys collision-free. There is further discussion in [8]. W e remark that a prefix tree, or trie, is well-kno wn in the searching and sorting literature [26], and is used to exp edite the finding of longest common prefixes. A t level one, no des are asso ciated with the first digit. At level t wo, no des are asso ciated with the second digit, and so on through deep er levels of the tree. 3.3.5 Simple Clustering Hierarc hy from the Baire Space Em b edding The Baire ultrametrization induces a (fairly flat) multiw ay tree on the given data set. 16 Consider a partition yielded by identit y (o ver all the attribute set) at a giv en precision lev el. Then for precision levels k 1 , k 2 , k 3 , . . . w e hav e, at each, a partition, suc h that all member clusters are ordered by reverse embedding (or set inclusion): q (1) ⊇ q (2) ⊇ q (3) ⊇ . . . . Call each such sequence of em b eddings a chain. The entire data set is cov ered by a set of such chains. This sequence of partitions is ordered b y set inclusion. The computational time complexity is as follows. Let the num b er of chemi- cals b e denoted n = | I | ; the n umber of attributes is | J | ; and the total n umber of digits precision is | K | . Consider a particular n umber of digits precision, k 0 , where 1 ≤ k 0 ≤ | K | . Then the random pro jection takes n · k 0 · | J | op- erations. A sort follows, requiring O ( n log n ) op erations. Then clusters are read off with O ( n ) op erations. Overall, the computational effort is b ounded by c 1 · | I | · | J | · | K | + c 2 · | I | · log | I | + c 3 | I | (where c 1 , c 2 , c 3 are constants), which is equal to O ( | I | log | I | ) or O ( n log n ). F urther ev aluation and a n umber of further case studies are cov ered in [8]. 4 Hierarc h y in a p-Adic Num b er System A dendrogram is widely used in hierarchical, agglomerativ e clustering, and is induced from observed data. In this article, one of our imp ortant goals is to sho w how it lays bare many div erse symmetries in the observ ed phenomenon represen ted by the data. By expressing a dendrogram in p-adic terms, we op en up a wide range of p ossibilities for seeing symmetries and attendant inv ariants. 4.1 p-Adic Enco ding of a Dendrogram W e will introduce now the one-to-one mapping of clusters (including singletons) in a dendrogram H into a set of p-adically expressed in tegers (a forteriori, ra- tionals, or Q p ). The field of p-adic num b ers is the most imp ortan t example of ultrametric spaces. Addition and multiplication of p-adic integers, Z p (cf. ex- pression in subsection 1.4), are well-defined. Inv erses exist and no zero-divisors exist. A terminal-to-root trav ersal in a dendrogram or binary ro oted tree is defined as follows. W e use the path x ⊂ q ⊂ q 0 ⊂ q 00 ⊂ . . . q n − 1 , where x is a given ob ject sp ecifying a given terminal, and q , q 0 , q 00 , . . . are the em b edded classes along this path, specifying no des in the dendrogram. The ro ot no de is sp ecified b y the class q n − 1 comprising all ob jects. A terminal-to-ro ot trav ersal is the shortest path b etw een the given terminal no de and the root no de, assuming w e preclude rep eated trav ersal (bac ktrack) of the same path b et ween an y tw o no des. By means of terminal-to-ro ot trav ersals, we define the following p-adic en- co ding of terminal no des, and hence ob jects, in Figure 6. 17 x 1 : +1 · p 1 + 1 · p 2 + 1 · p 5 + 1 · p 7 (2) x 2 : − 1 · p 1 + 1 · p 2 + 1 · p 5 + 1 · p 7 x 3 : − 1 · p 2 + 1 · p 5 + 1 · p 7 x 4 : +1 · p 3 + 1 · p 4 − 1 · p 5 + 1 · p 7 x 5 : − 1 · p 3 + 1 · p 4 − 1 · p 5 + 1 · p 7 x 6 : − 1 · p 4 − 1 · p 5 + 1 · p 7 x 7 : +1 · p 6 − 1 · p 7 x 8 : − 1 · p 6 − 1 · p 7 If w e choose p = 2 the resulting decimal equiv alents could b e the same: cf. con tributions based on +1 · p 1 and − 1 · p 1 + 1 · p 2 . Giv en that the co efficients of the p j terms (1 ≤ j ≤ 7) are in the set {− 1 , 0 , +1 } (implying for x 1 the additional terms: +0 · p 3 + 0 · p 4 + 0 · p 6 ), the co ding based on p = 3 is required to av oid am biguity among decimal equiv alen ts. A few general remarks on this encoding follo w. F or the labeled rank ed binary trees that w e are considering (for discussion of com binatorial prop erties based on lab eled, ranked and binary trees, see [52]), w e require the lab els +1 and − 1 for the tw o branches at any no de. Of course we could interc hange these lab els, and hav e these +1 and − 1 lab els reversed at any no de. By doing so we will ha ve differen t p-adic co des for the ob jects, x i . The following properties hold: (i) Unique enc o ding: the decimal co des for eac h x i (lexicographically ordered) are unique for p ≥ 3; and (ii) R eversibility: the dendrogram can be uniquely reconstructed from any such set of unique co des. The p-adic encoding defined for an y ob ject set can be expressed as follo ws for any ob ject x asso ciated with a terminal no de: x = n − 1 X j =1 c j p j where c j ∈ {− 1 , 0 , +1 } (3) In greater detail we ha ve: x i = n − 1 X j =1 c ij p j where c ij ∈ {− 1 , 0 , +1 } (4) Here j is the lev el or rank (root: n − 1; terminal: 1), and i is an ob ject index. In our example we hav e used: c j = +1 for a left branc h (in the sense of Figure 6), = − 1 for a right branch, and = 0 when the no de is not on the path from that particular terminal to the ro ot. A matrix form of this enco ding is as follo ws, where {·} t denotes the transpose of the vector. Let x b e the column vector { x 1 x 2 . . . x n } t . Let p b e the column vector { p 1 p 2 . . . p n − 1 } t . 18 x1 x2 x3 x4 x5 x6 x7 x8 0 1 2 3 4 5 6 7 +1 +1 +1 +1 +1 +1 +1 -1 -1 -1 -1 -1 -1 -1 Figure 6: Lab eled, ranked dendrogram on 8 terminal no des, x 1 , x 2 , . . . , x 8 . Branc hes are labeled +1 and − 1. Clusters are: q 1 = { x 1 , x 2 } , q 2 = { x 1 , x 2 , x 3 } , q 3 = { x 4 , x 5 } , q 4 = { x 4 , x 5 , x 6 } , q 5 = { x 1 , x 2 , x 3 , x 4 , x 5 , x 6 } , q 6 = { x 7 , x 8 } , q 7 = { x 1 , x 2 , . . . , x 7 , x 8 } . 19 Define a characteristic matrix C of the branching co des, +1 and − 1, and an absent or non-existen t branching giv en by 0, as a set of v alues c ij where i ∈ I , the indices of the ob ject set; and j ∈ { 1 , 2 , . . . , n − 1 } , the indices of the dendrogram levels or no des ordered increasingly . F or Figure 6 we therefore ha ve: C = { c ij } = 1 1 0 0 1 0 1 − 1 1 0 0 1 0 1 0 − 1 0 0 1 0 1 0 0 1 1 − 1 0 1 0 0 − 1 1 − 1 0 1 0 0 0 − 1 − 1 0 1 0 0 0 0 0 1 − 1 0 0 0 0 0 − 1 − 1 (5) F or giv en lev el j , ∀ i , the absolute v alues | c ij | give the membership function either by no de, j , whic h is therefore read off columnwise; or by ob ject index, i , whic h is therefore read off rowwise. The matrix form of the p-adic enco ding used in equations (3) or (4) is: x = C p (6) Here, x is the decimal enco ding, C is the matrix with dendrogram branc hing co des (cf. example shown in expression (5)), and p is the vector of p ow ers of a fixed integer (usually , more restrictively , fixed prime) p . The tree enco ding exemplified in Figure 6, and defined with coefficients in equations (3) or (4), (5) or (6), with lab els +1 and − 1 was required (as opp osed to the choice of 0 and 1, which might hav e b een our first thought) to fully cater for the rank ed no des (i.e. the total order, as opp osed to a partial order, on the no des). W e can consider the ob jects that we are dealing with to hav e equiv alen t in teger v alues. T o show that, all we m ust do is work out decimal equiv alents of the p-adic expressions used ab o ve for x 1 , x 2 , . . . . As noted in [25], we hav e equiv alence b etw een: a p-adic num b er; a p-adic expansion; and an element of Z p (the p-adic integers). The co efficients used to sp ecify a p-adic num b er, [25] notes (p. 69), “must be taken in a set of representativ es of the class mo dulo p . The num b ers b etw een 0 and p − 1 are only the most ob vious choice for these represen tatives. There are situations, how ever, where other choices are exp edien t.” W e note that the matrix C is used in [9]. A somewhat trivial view of ho w “hierarc hical trees can b e perfectly scaled in one dimension” (the title and theme of [9]) is that p-adic num b ering is feasible, and hence a one dimensional rep- resen tation of terminal no des is easily arranged through expressing each p-adic n umber with a real num b er equiv alent. 20 4.2 p-Adic Distance on a Dendrogram W e will no w induce a metric top ology on the p-adically enco ded dendrogram, H . It leads to v arious symmetries relative to identical norms, for instance, or iden tical tree distances. W e use the following longest common subsequence, starting at the ro ot: we lo ok for the term p r in the p-adic co des of the tw o ob jects, where r is the low est lev el such that the v alues of the co efficien ts of p r are equal. Let us lo ok at the set of p-adic co des for x 1 , x 2 , . . . ab o ve (Figure 6 and relations 3), to give some examples of this. F or x 1 and x 2 , we find the term we are lo oking for to b e p 1 , and so r = 1. F or x 1 and x 5 , we find the term we are lo oking for to b e p 5 , and so r = 5. F or x 5 and x 8 , we find the term we are lo oking for to b e p 7 , and so r = 7. Ha ving found the v alue r , the distance is defined as p − r [3, 25]. This longest common prefix metric is also known as the Baire distance, and has b een discussed in section 3.3. In top ology the Baire metric is defined on infinite strings [42]. It is more than just a distance: it is an ultrametric bounded from ab ov e by 1, and its infimum is 0 which is relev ant for v ery long sequences, or in the limit for infinite-length sequences. The use of this Baire metric is pursued in [62] based on random pro jections [77], and providing computational b enefits ov er the classical O ( n 2 ) hierarchical clustering based on all pairwise distances. The longest common prefix metric leads directly to a p-adic hier ar chic al classific ation (cf. [5]). This is a sp ecial case of the “fast” hierarchical clustering discussed in section 3.2. Compared to the longest common prefix metric, there are other related forms of metric, and simultaneously ultrametric. In [23], the metric is defined via the in teger part of a real n umber. In [3], for in tegers x, y w e ha ve: d ( x, y ) = 2 − order p ( x − y ) where p is prime, and order p ( i ) is the exp onent (non-negative in teger) of p in the prime decomp osition of an integer. F urthermore let S ( x ) b e a series: S ( x ) = P i ∈ N a i x i . ( N are the natural num b ers.) The order of S ( i ) is the rank of its first non-zero term: order( S ) = inf { i : i ∈ N ; a i 6 = 0 } . (The series that is all zero is of order infinity .) Then the ultrametric similarit y b et ween series is: d ( S, S 0 ) = 2 − order ( S − S 0 ) . 4.3 Scale-Related Symmetry Scale-related symmetry is very imp ortan t in practice. In this subsection we in tro duce an op erator that provides this symmetry . W e also term it a dilation op erator, because of its role in the wa velet transform on trees (see section 5.3 b elo w, and [58] for discussion and examples). This op erator is p-adic multipli- cation by 1 /p . Consider the set of ob jects { x i | i ∈ I } with its p-adic co ding considered ab o ve. T ake p = 2. (Non-uniqueness of corresponding decimal codes is not of concern to us now, and taking this v alue for p is without any loss of generalit y .) 21 Multiplication of x 1 = +1 · 2 1 + 1 · 2 2 + 1 · 2 5 + 1 · 2 7 b y 1 /p = 1 / 2 giv es: +1 · 2 1 + 1 · 2 4 + 1 · 2 6 . Each level has decreased b y one, and the low est lev el has b een lost. Sub ject to the low est level of the tree b eing lost, the form of the tree remains the same. By carrying out the multiplication-b y-1 /p op eration on all ob jects, it is seen that the effect is to rise in the hierarch y by one level. Let us call pro duct with 1 /p the op erator A . The effect of losing the b ottom lev el of the dendrogram means that either (i) eac h cluster (p ossibly singleton) remains the same; or (ii) tw o clusters are merged. Therefore the application of A to all q implies a subset relationship b etw een the set of clusters { q } and the result of applying A , { Aq } . Rep eated application of the op erator A giv es Aq , A 2 q , A 3 q , . . . . Starting with any singleton, i ∈ I , this gives a path from the terminal to the ro ot no de in the tree. Each such path ends with the null element, which we define to be the p-adic encoding corresponding to the root node of the tree. Therefore the in tersection of the paths equals the n ull elemen t. Benedetto and Benedetto [1, 2] discuss A as an expansive automorphism of I , i.e. form-preserving, and lo cally expansive. Some implications [1] of the ex- pansiv e automorphism follow. F or an y q , let us take q , Aq , A 2 q , . . . as a sequence of op en subgroups of I , with q ⊂ Aq ⊂ A 2 q ⊂ . . . , and I = S { q , Aq , A 2 q , . . . } . This is termed an inductive sequence of I , and I itself is the inductive limit ([68], p. 131). Eac h path defined b y application of the expansive automorphism defines a spherically complete system [70, 23, 69], whic h is a formalization of well-defined subset embeddedness. Such a metho dological framework finds application in m ulti-v alued and non-monotonic reasoning, as noted in section 3.2. 5 T ree Symmetries through the W reath Pro d- uct Group In this section the wreath pro duct group, used up to now in the literature as a framework for tree structuring of image or other signal data, is here used on a 2-wa y tree or dendrogram data structure. An example of wreath pro duct in v ariance is provided b y the w av elet transform of suc h a tree. 5.1 W reath Pro duct Group Corresp onding to a Hierar- c hical Clustering A dendrogram lik e that shown in Figure 6 is inv ariant as a representation or structuring of a data set relative to rotation (alternatively , here: p ermutation) of left and righ t c hild no des. These rotation (or p ermutation) symmetries are defined b y the wreath pro duct group (see [20, 21, 18] for an in tro duction and applications in signal and image pro cessing), and can b e used with an y m-ary tree, although we will treat the binary or 2-w ay case here. F or the group actions, with resp ect to whic h w e will seek in v ariance, we consider independent cyclic shifts of the subno des of a giv en no de (hence, at 22 eac h level). Equiv alently these actions are adjacency preserving p ermutations of subno des of a given no de (i.e., for given q , with q = q 0 ∪ q 00 , the p ermutations of { q 0 , q 00 } ). W e hav e therefore cyclic group actions at each no de, where the cyclic group is of order 2. The symmetries of H are giv en by structured p ermutations of the terminals. The terminals will be denoted here by T erm H . The full group of symmetries is summarized by the follo wing generativ e algorithm: 1. F or level l = n − 1 do wn to 1 do: 2. Selected no de, ν ← − no de at level l . 3. And p erm ute subno des of ν . Subno de ν is the ro ot of subtree H ν . W e denote H n − 1 simply b y H . F or a subno de ν 0 undergoing a relo cation action in step 3, the internal structure of subtree H ν 0 is not altered. The algorithm describ ed defines the automorphism group whic h is a wreath pro duct of the symmetric group. Denote the permutation at level ν by P ν . Then the automorphism group is given by: G = P n − 1 wr P n − 2 wr . . . wr P 2 wr P 1 where wr denotes the wreath pro duct. 5.2 W reath Pro duct Inv ariance Call T erm H ν the terminals that descend from the node at level ν . So these are the terminals of the subtree H ν with its ro ot no de at level ν . W e can alternativ ely call T erm H ν the cluster asso ciated with lev el ν . W e will now lo ok at shift in v ariance under the group action. This amounts to the requirement for a constant function defined on T erm H ν , ∀ ν . A conv enient w ay to do this is to define such a function on the set T erm H ν via the ro ot no de alone, ν . By definition then we hav e a constant function on the set T erm H ν . Let us call V ν a space of functions that are constant on T erm H ν . That is to say , the functions are constant in clusters that are defined by the subset of n ob jects. Possibilities for V ν that were considered in [58] are: 1. Basis v ector with | T erm H n − 1 | comp onents, with 0 v alues except for v alue 1 for comp onent i . 2. Set (of cardinalit y n = | T erm H n − 1 | ) of m -dimensional observ ation vectors. Consider the resolution scheme arising from moving from T erm H ν 0 , T erm H ν 00 } to T erm H ν . F rom the hierarchical clustering p oint of view it is clear what this represents, simply , an agglomeration of tw o clusters called T erm H ν 0 and T erm H ν 00 , replacing them with a new cluster, T erm H ν . Let the spaces of functions that are constan t on subsets corresponding to the t wo cluster agglomerands b e denoted V ν 0 and V ν 00 . These tw o clusters are dis- join t initially , which motiv ates us taking the tw o spaces as a couple: ( V ν 0 , V ν 00 ). 23 Sepal.L Sepal.W P etal.L Petal.W 1 5.1 3.5 1.4 0.2 2 4.9 3.0 1.4 0.2 3 4.7 3.2 1.3 0.2 4 4.6 3.1 1.5 0.2 5 5.0 3.6 1.4 0.2 6 5.4 3.9 1.7 0.4 7 4.6 3.4 1.4 0.3 8 5.0 3.4 1.5 0.2 T able 4: First 8 observ ations of Fisher’s iris data. L and W refer to length and width. 5.3 Example of W reath Pro duct In v ariance: Haar W a velet T ransform of a Dendrogram Let us exemplify a case that satisfies all that has b een defined in the con text of the wreath pro duct inv ariance that we are targeting. It is the algorithm discussed in depth in [58]. T ake the constant function from V ν 0 to b e f ν 0 . T ake the constant function from V ν 00 to b e f ν 00 . Then define the constan t function, the sc aling function , in V ν to b e ( f ν 0 + f ν 00 ) / 2. Next define the zero mean function, ( w ν 0 + w ν 00 ) / 2 = 0, the wavelet function , as follows: w ν 0 = ( f ν 0 + f ν 00 ) / 2 − f ν 0 in the supp ort interv al of V ν 0 , i.e. T erm H ν 0 , and w ν 00 = ( f ν 0 + f ν 00 ) / 2 − f ν 00 in the supp ort interv al of V ν 00 , i.e. T erm H ν 00 . Since w ν 0 = − w ν 00 w e hav e the zero mean requirement. W e now illustrate the Haar wa velet transform of a dendrogram with a case study . The discrete w av elet transform is a decomposition of data in to spatial and frequency comp onents. In terms of a dendrogram these components are with resp ect to, resp ectiv ely , within and b etw een clusters of successive partitions. W e show ho w this works taking the data of T able 4. The hierarc hy built on the 8 observ ations of T able 4 is shown in Figure 7. Here w e note the asso ciations of irises 1 through 8 as, resp ectively: x 1 , x 3 , x 4 , x 6 , x 8 , x 2 , x 5 , x 7 . Something more is shown in Figure 7, namely the detail signals (denoted ± d ) and ov erall smo oth (denoted s ), whic h are determined in carrying out the w av elet transform, the so-called forward transform. The in verse transform is then determined from Figure 7 in the follo wing w ay . Consider the observ ation v ector x 2 . Then this v ector is reconstructed exactly b y reading the tree from the ro ot: s 7 + d 7 = x 2 . Similarly a path from ro ot 24 x1 x3 x4 x6 x8 x2 x5 x7 0 1 s7 s6 s5 s4 s3 s2 s1 -d7 -d6 -d5 -d4 -d3 -d2 -d1 +d7 +d6 +d5 +d4 +d3 +d2 +d1 Figure 7: Dendrogram on 8 terminal nodes constructed from first 8 v alues of Fisher iris data. (Median agglomerative metho d used in this case.) Detail or w av elet co efficients are denoted by d , and data smo oths are denoted by s . The observ ation v ectors are denoted b y x and are asso ciated with the terminal no des. Eac h signal smo oth , s , is a vector. The (p ositiv e or negativ e) detail signals , d , are also vectors. All these vectors are of the same dimensionality . s7 d7 d6 d5 d4 d3 d2 d1 Sepal.L 5.146875 0.253125 0.13125 0.1375 − 0 . 025 0.05 − 0 . 025 0.05 Sepal.W 3.603125 0.296875 0.16875 − 0 . 1375 0.125 0.05 − 0 . 075 − 0 . 05 P etal.L 1.562500 0.137500 0.02500 0.0000 0.000 − 0 . 10 0.050 0.00 P etal.W 0.306250 0.093750 − 0 . 01250 − 0 . 0250 0.050 0.00 0.000 0.00 T able 5: The hierarchical Haar wa velet transform resulting from use of the first 8 observ ations of Fisher’s iris data shown in T able 4. W av elet co efficient levels are denoted d1 through d7, and the con tinuum or smooth comp onent is denoted s7. 25 to terminal is used to reconstruct any other observ ation. If x 2 is a vector of dimensionalit y m , then so also are s 7 and d 7 , as well as all other detail signals. This pro cedure is the same as the Haar w av elet transform, only applied to the dendrogram and using the input data. This wa velet transform for the data in T able 4, based on the “key” or inter- mediary hierarch y of Figure 7, is sho wn in T able 5. W av elet regression entails setting small and hence unimp ortant detail co ef- ficien ts to 0 before applying the inv erse wa v elet transform. More discussion can b e found in [58]. Early work on p-adic and ultrametric w av elets can b e found in Kozyrev [38, 39]. While we ha ve treated the case of the wa velet transform on a particular graph, a tree, recen t applications of wa v elets to general graphs are in [34] and, b y representing the graph as a matrix, in [63]. 6 Remark able Symmetries in V ery High Dimen- sional Spaces In the work of [66, 67] it w as shown how as ambien t dimensionality increased distances b ecame more and more ultrametric. That is to sa y , a hierarchical em b edding b ecomes more and more immediate and direct as dimensionality in- creases. A better wa y of quantifying this phenomenon was developed in [55]. What this means is that there is inherent hierarchical structure in high dimen- sional data spaces. It w as shown exp erimentally in [66, 67, 55] how p oints in high dimensional spaces become increasingly equidistant with increase in dimensionality . Both [27] and [13] study Gaussian clouds in v ery high dimensions. The latter finds that “not only are the p oints [of a Gaussian cloud in very high dimensional space] on the conv ex hull, but all reasonable-sized subsets span faces of the con vex hull. This is wildly different than the b ehavior that would b e exp ected b y traditional low-dimensional thinking”. That v ery simple structures come ab out in very high dimensions is not as trivial as it might app ear at first sight. Firstly , even v ery simple structures (hence with man y symmetries) can b e used to support fast and perhaps even constan t time worst case proximit y search [55]. Secondly , as shown in the ma- c hine learning framework by [27], there are important implications ensuing from the simple high dimensional structures. Thirdly , [59] shows that v ery high di- mensional clustered data contain symmetries that in fact can b e exploited to “read off ” the clusters in a computationally efficien t w ay . F ourthly , following [11], what we might wan t to lo ok for in contexts of considerable symmetry are the “impurities” or small irregularities that detract from the o verall dominant picture. See T able 6 exemplifying the change of top ological prop erties as ambien t dimensionalit y increases. It b ehov es us to exploit the symmetries that arise when we hav e to pro cess v ery high dimenionsal data. 26 No. p oints Dimen. Isosc. Equil. UM Uniform 100 20 0.10 0.03 0.13 100 200 0.16 0.20 0.36 100 2000 0.01 0.83 0.84 100 20000 0 0.94 0.94 Hyp ercub e 100 20 0.14 0.02 0.16 100 200 0.16 0.21 0.36 100 2000 0.01 0.86 0.87 100 20000 0 0.96 0.96 Gaussian 100 20 0.12 0.01 0.13 100 200 0.23 0.14 0.36 100 2000 0.04 0.77 0.80 100 20000 0 0.98 0.98 T able 6: Typical results, based on 300 sampled triangles from triplets of p oints. F or uniform, the data are generated on [0 , 1] m ; h yp ercub e v ertices are in { 0 , 1 } m , and for Gaussian on each dimension, the data are of mean 0, and v ariance 1. Dimen. is the ambien t dimensionality . Isosc. is the num b er of isosceles triangles with small base, as a prop ortion of all triangles sampled. Equil. is the n umber of equilateral triangles as a prop ortion of triangles sampled. UM is the prop ortion of ultrametricity-respecting triangles (= 1 for all ultrametric). 27 6.1 Application to V ery High F requency Data Analysis: Segmen ting a Financial Signal W e use financial futures, circa Marc h 2007, denominated in euros from the DAX exc hange. Our data stream is at the millisecond rate, and comprises ab out 382,860 records. Each record includes: 5 bid and 5 asking prices, together with bid and asking sizes in all cases, and action. W e extracted one symbol (commo dit y) with 95,011 single bid v alues, on which w e now report results. See Figure 8. Em b eddings were defined as follows. • Windows of 100 successive v alues, starting at time steps: 1, 1000, 2000, 3000, 4000, . . . , 94000. • Windows of 1000 successiv e v alues, starting at time steps: 1, 1000, 2000, 3000, 4000, . . . , 94000. • Windows of 10000 successive v alues, starting at time steps: 1, 1000, 2000, 3000, 4000, . . . , 85000. The histograms of distances b etw een these windows, or embeddings, in re- sp ectiv ely space s of dimension 100, 1000 and 10000, are shown in Figure 9. Note how the 10000-length windo w case results in p oints that are strongly o verlapping. In fact, w e can say that 90% of the v alues in each window are o verlapping with the next windo w. Not withstanding this ma jor ov erlapping in regard to clusters inv olved in the pairwise distances, if we can still find clusters in the data then we hav e a very versatile wa y of tackling the clustering ob jective. Because of the greater cluster concentration that we exp ect (cf. T able 6) from a greater embedding dimension, w e use the 86 p oints in 10000-dimensional space, not withstanding the fact that these p oints are from ov erlapping clusters. W e mak e the follo wing supposition based on Figure 8: the clusters will consist of successive v alues, and hence will b e justifiably termed segments. F rom the distances histogram in Figure 9, bottom, w e will carry out Gaussian mixture modeling follow ed by use of the Ba yesian information criterion (BIC, [71]) as an approximate Ba yes factor, to determine the b est num b er of clusters (effectiv ely , histogram p eaks). W e fit a Gaussian mixture model to the data shown in the bottom histogram of Figure 9. T o deriv e the appropriate num b er of histogram p eaks we fit Gaus- sians and use the Bay esian information criterion (BIC) as an appro ximate Ba yes factor for mo del selection [36, 64]. Figure 10 sho ws the succession of outcomes, and indicates as b est a 5-Gaussian fit. F or this result, we find the means of the Gaussians to b e as follows: 517, 885, 1374, 2273 and 3908. The corresp onding standard deviations are: 84, 133, 212, 410 and 663. The resp ectiv e cardinal- ities of the 5 histogram peaks are: 358, 1010, 1026, 911 and 350. Note that this relates so far only to the histogram of pairwise distances. W e now wan t to determine the corresp onding clusters in the input data. While we hav e the segmen tation of the distance histogram, w e need the seg- men tation of the original financial signal. If we had 2 clusters in the original 28 0 20000 40000 60000 80000 6790 6810 6830 6850 Time steps Bid price Figure 8: The signal used: a commo dity future, with millisecond time sampling. 29 Dim. 100 0 100 200 300 400 500 600 0 250 Dim. 1000 0 500 1000 1500 2000 0 300 Dim. 10000 0 1000 2000 3000 4000 5000 6000 0 200 Figure 9: Histograms of pairwise distances b etw een embeddings in dimension- alities 100, 1000, 10000. Resp ectively the num b ers of embeddings are: 95, 95 and 86. 30 2 4 6 8 10 −39000 −38500 −38000 −37500 Number of Gaussians BIC value Figure 10: BIC (Ba yesian information criterion) v alues for the succession of results. The 5-cluster solution has the highest v alue for BIC and is therefore the b est Gaussian mixture fit. financial signal, then we could exp ect up to 3 p eaks in the distances histogram (viz., 2 intra-cluster p eaks, and 1 inter-cluster p eak). If we had 3 clusters in the original financial signal, then we could exp ect up to 6 peaks in the dis- tances histogram (viz., 3 intra-cluster peaks, and 3 inter-cluster p eaks). This information is consistent with asserting that the evidence from Figure 10 p oints to tw o of these histogram p eaks b eing appro ximately co-lo cated (alternatively: the distances are approximately the same). W e conclude that 3 clusters in the original financial signal is the most consistent n umber of clusters. W e will no w determine these. One possibility is to use principal coordinates analysis (T orgerson’s, Gow er’s metric m ultidimensional scaling) of the pairwise distances. In fact, a 2-dimensional mapping furnishes a very similar pairwise distance histogram to that seen using the full, 10000, dimensionality . The first axis in Figure 11 accoun ts for 88.4% of the v ariance, and the second for 5.8%. Note therefore ho w the scales of the planar representation in Figure 11 p oint to it b eing very linear. Benz ´ ecri ([4], chapter 7, section 3.1) discusses the Guttman effect, or Guttman scale, where factors that are not mutually correlated, are nonetheless function- ally related. When there is a “fundamen tally unidimensional underlying phe- nomenon” (there are multiple such cases here) factors are functions of Legendre p olynomials. W e can view Figure 11 as consisting of multiple horsesho e shap es. A simple explanation for suc h shap es is in terms of the constraints imp osed by 31 lots of equal distances when the data vectors are ordered linearly (see [56], pp. 46-47). Another view of how embedded (hence clustered) data are capable of b eing w ell mapp ed in to a unidimensional curve is Critchley and Heiser [9]. Critchley and Heiser show one approach to mapping an ultrametric into a linearly or totally ordered metric. W e hav e asserted and then established ho w hierarch y in some form is relev ant for high dimensional data spaces; and then we find a v ery linear pro jection in Figure 11. As a consequence we note that the Critchley and Heiser result is esp ecially relev ant for high dimensional data analysis. Kno wing that 3 clusters in the original signal are wan ted, w e could use Figure 11. There are v arious w ays to do so. W e will use an adjacency-constrained agglomerativ e hierarchical clustering algorithm to find the clusters: see Figure 12. The contiguit y-constrained com- plete link criterion is our only choice here if we are to b e sure that no inv ersions can come ab out in the hierarch y , as explained in [53]. As input, w e use the co ordinates in Figure 11. The 2-dimensional Figure 11 representation relates to o ver 94% of the v ariance. The most complete basis was of dimensionality 85. W e chec k ed the results of the 85-dimensionality embedding which, as noted b elo w, gav e very similar results. Reading off the 3-cluster mem b erships from Figure 12 gives for the signal actually used (with a very initial segment and a v ery final segment deleted): cluster 1 corresponds to signal v alues 1000 to 33999 (p oints 1 to 33 in Figure 12); cluster 2 corresp onds to signal v alues 34000 to 74999 (p oin ts 34 to 74 in Figure 12); and cluster 3 corresp onds to signal v alues 75000 to 86999 (p oints 75 to 86 in Figure 12). This allows us to segment the original time series: see Figure 13. (The clustering of the 85-dimensional em b edding differs minimally . Segmen ts are: p oints 1 to 32; 33 to 73; and 74 to 86.) T o summarize what has b een done: 1. the segmentation is initially guided by the p eak-finding in the histogram of distances 2. with high dimensionality we exp ect simple structure in a low dimensional mapping provided by principal co ordinates analysis 3. either the original high dimensional data or the principal coordinates anal- ysis embedding are used as input to a sequence-constrained clustering metho d in order to determine the clusters 4. which can then b e display ed on the original data. In this case, the clusters are defined using a complete link criterion, implying that these three clusters are determined by minimizing their maxim um internal pairwise distance. This provides a strong measure of signal volatilit y as an explanation for the clusters, in addition to their a verage v alue. 32 −2000 −1000 0 1000 2000 3000 −600 −400 −200 0 200 400 600 Principal coordinate 1 Principal coordinate 2 1 2 3 4 5 6 7 8 9 10 11 12 13 14 15 16 17 18 19 20 21 22 23 24 25 26 27 28 29 30 31 32 33 34 35 36 37 38 39 40 41 42 43 44 45 46 47 48 49 50 51 52 53 54 55 56 57 58 59 60 61 62 63 64 65 66 67 68 69 70 71 72 73 74 75 76 77 78 79 80 81 82 83 84 85 86 Figure 11: An in teresting representation – a type of “return map” – found using a principal co ordinates analysis of the 86 successive 10000-dimensional p oin ts. Again a demonstration that very high dimensional structures can b e of v ery simple structure. The planar pro jection seen here represents most of the information conten t of the data: the first axis accounts for 88.4% of the v ariance, while the second accounts for 5.8%. 33 0 1000 2000 3000 4000 5000 1 2 3 4 5 6 7 8 9 10 11 12 13 14 15 16 17 18 19 20 21 22 23 24 25 26 27 28 29 30 31 32 33 34 35 36 37 38 39 40 41 42 43 44 45 46 47 48 49 50 51 52 53 54 55 56 57 58 59 60 61 62 63 64 65 66 67 68 69 70 71 72 73 74 75 76 77 78 79 80 81 82 83 84 85 86 Figure 12: Hierarchical clustering of the 86 p oints. Sequence is resp ected. The agglomerativ e criterion is the contiguit y-constrained complete link metho d. See [53] for details including pro of that there can be no inv ersion in this dendrogram. 34 0 20000 40000 60000 80000 6790 6800 6810 6820 6830 6840 6850 6860 Time steps Value Figure 13: Boundaries found for 3 segmen ts. 7 Conclusions Among themes not co v ered in this article are data stream clustering. T o provide bac kground and motiv aton, in [60], we discuss p ermutation representations of a data stream. Since hierarchies can also b e represented as p ermutations, there is a ready w ay to asso ciate data streams with hierarc hies. In fact, early computa- tional w ork on hierarchical clustering used p ermutation representation to great effect (cf. [73]). T o analyze data streams in this wa y , in [57] we dev elop an ap- proac h to ultrametric em b edding of time-v arying signals, including biomedical, meteorological, financial and other. This work has b een pursued in ph ysics by Khrennik ov. Let us no w wrap up on the exciting p ersp ectiv es op ened up by our work on the theme of symmetry-finding through hierarch y in very large data collections. “My thesis has b een that one path to the construction of a nontrivial theory of complex systems is b y wa y of a theory of hierarch y .” Th us Simon ([74], p. 216). W e ha ve noted symmetry in man y guises in the represen tations used, in the transformations applied, and in the transformed outputs. These symmetries are non-trivial to o, in a wa y that would not b e the case were we simply to lo ok at classes of a partition and claim that cluster members were mutually similar in some w ay . W e ha ve seen ho w the p-adic or ultrametric framework pro vides significan t fo cus and commonality of viewp oin t. F urthermore we hav e highlighted the computational scaling prop erties of 35 our algorithms. They are fully capable of addressing the data and information deluge that we face, and pro viding us with the b est interpretativ e and decision- making to ols. The full elaboration of this last p oint is to sought in each and ev ery application domain, and face to face with old and new problems. In seeking (in a general wa y) and in determining (in a fo cused w ay) structure and regularit y in massive data stores, we see that, in line with the insights and ac hievemen ts of Klein, W eyl and Wigner, in data mining and data analysis we seek and determine symmetries in the data that express observed and measured realit y . References [1] J.J. Benedetto and R.L. Benedetto. A wa velet theory for local fields and related groups. The Journal of Ge ometric Analysis , 14:423–456, 2004. [2] R.L. Benedetto. Examples of wa velets for local fields. In D. Larson C. Heil, P . Jorgensen, editor, Wavelets, F r ames, and Op er ator The ory, Contemp o- r ary Mathematics V ol. 345 , pages 27–47. 2004. [3] J.-P . Benz´ ecri. L’A nalyse des Donn´ ees. T ome I. T axinomie . Duno d, Paris, 2nd edition, 1979. [4] J.-P . Benz ´ ecri. L’Analyse des Donn´ ees. T ome II, Corr esp ondanc es . Duno d, P aris, 2nd edition, 1979. [5] P .E. Bradley . Mumford dendrograms. Computer Journal , 53:393–404, 2010. [6] L. Brekke and P .G.O. F reund. p-Adic num b ers in ph ysics. Physics R ep orts , 233:1–66, 1993. [7] P . Chakrab orty . Lo oking through newly to the amazing irrationals. T ec h- nical rep ort, 2005. arXiv: math.HO/0502049v1. [8] P . Contreras. Se ar ch and R etrieval in Massive Data Col le ctions . PhD thesis, Roy al Hollo wa y , Univ ersity of London, 2010. F orthcoming. [9] F. Critchley and W. Heiser. Hierarchical trees can be p erfectly scaled in one dimension. Journal of Classific ation , 5:5–20, 1988. [10] B.A. Dav ey and H.A. Priestley . Intr o duction to L attic es and Or der . Cam- bridge Universit y Press, 2nd edition, 2002. [11] F. Delon. Espaces ultram´ etriques. Journal of Symb olic L o gic , 49:405–502, 1984. [12] S.B. Deutsch and J.J. Martin. An ordering algorithm for analysis of data arra ys. Op er ations R ese ar ch , 19:1350–1362, 1971. 36 [13] D.L. Donoho and J. T anner. Neighborliness of randomly-pro jected sim- plices in high dimensions. Pr o c e e dings of the National A c ademy of Scienc es , 102:9452–9457, 2005. [14] B. Dragovic h and A. Dragovic h. p-Adic mo delling of the genome and the genetic co de. Computer Journal , 53:432–442, 2010. [15] B. Drago vich, A.Y u. Khrenniko v, S.V. Kozyrev, and I.V. V olovic h. On p-adic mathematical physics. P-A dic Numb ers, Ultr ametric A nalysis, and Applic ations , 1:1–17, 2009. [16] D. Dutta, R. Guha, P . Jurs, and T. Chen. Scalable partitioning and ex- ploration of c hemical spaces using geometric hashing. Journal of Chemic al Information and Mo deling , 46:321–333, 2006. [17] R.A. Fisher. The use of multiple measurements in taxonomic problems. The Annals of Eugenics , pages 179–188, 1936. [18] R. F o ote. An algebraic approach to multiresolution analysis. T r ansactions of the Americ an Mathematic al So ciety , 357:5031–5050, 2005. [19] R. F o ote. Mathematics and complex systems. Scienc e , 318:410–412, 2007. [20] R. F o ote, G. Mirchandani, D. Rockmore, D. Healy , and T. Olson. A wreath pro duct group approac h to signal and image pro cessing: P art I – m ultireso- lution analysis. IEEE T r ansactions on Signal Pr o c essing , 48:102–132, 2000. [21] R. F o ote, G. Mirchandani, D. Rockmore, D. Healy , and T. Olson. A wreath pro duct group approach to signal and image pro cessing: Part I I – conv olu- tion, correlations and applications. IEEE T r ansactions on Signal Pr o c ess- ing , 48:749–767, 2000. [22] P .G.O. F reund. p-Adic strings and their applications. In Z. Rakic B. Dragovic h, A. Khrenniko v and I. V olovic h, editors, Pr o c. 2nd Interna- tional Confer enc e on p-A dic Mathematic al Physics , pages 65–73. American Institute of Physics, 2006. [23] L. Ga ji´ c. On ultrametric space. Novi Sad Journal of Mathematics , 31:69– 71, 2001. [24] B. Ganter and R. Wille. F ormal Conc ept A nalysis: Mathematic al F ounda- tions . Springer, 1999. F ormale Be griffsanalyse. Mathematische Grund lagen , Springer, 1996. [25] F.Q. Gouv ˆ ea. p-A dic Numb ers: An Intr o duction . Springer, 2003. [26] D. Gusfield. Algorithms on Strings, T r e es, and Se quenc es: Computer Sci- enc e and Computational Biolo gy . Cambridge Universit y Press, 1997. 37 [27] P . Hall, J.S. Marron, and A. Neeman. Geometric representation of high dimensional, lo w sample size data. Journal of the R oyal Statistic al So ciety B , 67:427–444, 2005. [28] P . Hitzler and A.K. Seda. The fixed-point theorems of Priess-Cramp e and Rib en b oim in logic programming. Fields Institute Communic ations , 32:219–235, 2002. [29] P . Indyk, A. Andoni, M. Datar, N. Immorlica, and V. Mirrokni. Lo cally- sensitiv e hashing using stable distributions. In T. Darrell, P . Indyk, and G. Shakhnarovic h, editors, Ne ar est Neighb or Metho ds in L e arning and Vi- sion: The ory and Pr actic e , pages 61–72. MIT Press, 2006. [30] A.K. Jain and R.C. Dub es. Algorithms F or Clustering Data . Prentice-Hall, 1988. [31] A.K. Jain, M.N. Murty , and P .J. Flynn. Data clustering: a review. ACM Computing Surveys , 31:264–323, 1999. [32] M.F. Jano witz. An order theoretic mo del for cluster analysis. SIAM Journal on Applie d Mathematics , 34:55–72, 1978. [33] M.F. Jano witz. Cluster analysis based on abstract posets. T echnical rep ort, 2005–2006. http://dimax.rutgers.edu/ ∼ melj. [34] M. Jansen, G.P . Nason, and B.W. Silv erman. Multiscale methods for data on graphs and irregular multidimensional situations. Journal of the R oyal Statistic al So ciety B , 71:97–126, 2009. [35] S.C. Johnson. Hierarchical clustering sc hemes. Psychometrika , 32:241–254, 1967. [36] R.E. Kass and A.E. Raftery . Ba yes factors and mo del uncertaint y . Journal of the Americ an Statistic al Asso ciation , 90:773–795, 1995. [37] A.Y u. Khrenniko v. Gene expression from p olynomial dynamics in the 2- adic information space. T echnical rep ort, 2006. arXiv:q-bio/06110682v2. [38] S. V. Kozyrev. W av elet theory as p-adic spectral analysis. Izvestiya: Math- ematics , 66:367–376, 2002. [39] S. V. Kozyrev. W av elets and sp ectral analysis of ultrametric pseudo differ- en tial op erators. Sb ornik: Mathematics , 198:97–116, 2007. [40] M. Krasner. Nom bres semi-r´ eels et espaces ultram´ etriques. Comptes- R endus de l’A c ad´ emie des Scienc es, T ome II , 219:433, 1944. [41] I.C. Lerman. Classific ation et Analyse Or dinale des Donn ´ ees . Duno d, P aris, 1981. [42] A. Levy . Basic Set The ory . Do ver, Mineola, NY, 2002. (Springer, 1979). 38 [43] S.C. Madeira and A.L. Oliveira. Biclustering algorithms for biological data analysis: a survey . IEEE/ACM T r ansactions on Computational Biolo gy and Bioinformatics , 1:24–45, 2004. [44] S.T. March. T echniques for structuring database records. Computing Sur- veys , 15:45–79, 1983. [45] W.T. McCormic k, P .J. Sc hw eitzer, and T.J. White. Problem decomp osition and data reorganization by a clustering technique. Op er ations R ese ar ch , 20:993–1009, 1982. [46] I. V an Mechelen, H.-H. Bo ck, and P . De Bo ec k. Two-mode clustering metho ds: a structured o verview. Statistic al Metho ds in Me dic al R ese ar ch , 13:363–394, 2004. [47] M.L. Miller, M.A. Ro driguez, and I.J. Cox. Audio fingerprin ting: nearest neigh b or search in high dimensional binary spaces. Journal of VLSI Signal Pr o c essing , 41:285–291, 2005. [48] B. Mirkin. Mathematic al Classific ation and Clustering . Kluw er, 1996. [49] B. Mirkin. Clustering for Data Mining . Chapman and Hall/CRC, Bo ca Raton, FL, 2005. [50] F. Murtagh. A survey of recen t adv ances in hierarchical clustering algo- rithms. Computer Journal , 26:354–359, 1983. [51] F. Murtagh. Complexities of hierarchic clustering algorithms: state of the art. Computational Statistics Quarterly , 1:101–113, 1984. [52] F. Murtagh. Counting dendrograms: a survey . Discr ete Applie d Mathe- matics , 7:191–199, 1984. [53] F. Murtagh. Multidimensional Clustering Algorithms . Physica-V erlag, Hei- delb erg and Vienna, 1985. [54] F. Murtagh. Comments on: Parallel algorithms for hierarchical clustering and cluster v alidity . IEEE T r ansactions on Pattern A nalysis and Machine Intel ligenc e , 14:1056–1057, 1992. [55] F. Murtagh. On ultrametricity , data co ding, and c omputation. Journal of Classific ation , 21:167–184, 2004. [56] F. Murtagh. Corr esp ondenc e Analysis and Data Co ding with R and Java . Chapman and Hall/CRC Press, 2005. [57] F. Murtagh. Iden tifying the ultrametricit y of time series. Eur op e an Physic al Journal B , 43:573–579, 2005. [58] F. Murtagh. The Haar wa v elet transform of a dendrogram. Journal of Classific ation , 24:3–32, 2007. 39 [59] F. Murtagh. The remark able simplicity of very high dimensional data: application to model-based clustering. Journal of Classific ation , 26:249– 277, 2009. [60] F. Murtagh. Symmetry in data mining and analysis: a unifying view based on hierarc hy . Pr o c e e dings of Steklov Institute of Mathematics , 265:177–198, 2009. [61] F. Murtagh. The corresp ondence analysis platform for unco vering deep structure in data and information (sixth Annual Boole Lecture). Computer Journal , 53:304–315, 2010. [62] F. Murtagh, G. Downs, and P . Contreras. Hierarchical clustering of mas- siv e, high dimensional data sets b y exploiting ultrametric embedding. SIAM Journal on Scientific Computing , 30:707–730, 2008. [63] F. Murtagh, J.-L. Starc k, and M. Berry . Ov ercoming the curse of dimen- sionalit y in clustering by means of the wa velet transform. Computer Jour- nal , 43:107–120, 2000. [64] F. Murtagh and J.L. Starc k. Quan tization from Bay es factors with applica- tion to multilev el thresholding. Pattern R e c o gnition L etters , 24:2001–2007, 2003. [65] A. Ostrowski. ¨ Ub er einige L¨ osungen der Funktionalgleic hung φ ( x ) · φ ( y ) − φ ( xy ). A cta Mathematic a , 41:271–284, 1918. [66] R. Rammal, J.C. Angles d’Auriac, and B. Doucot. On the degree of ultra- metricit y . L e Journal de Physique – L ettr es , 46:L–945–L–952, 1985. [67] R. Rammal, G. T oulouse, and M.A. Virasoro. Ultrametricity for ph ysicists. R eviews of Mo dern Physics , 58:765–788, 1986. [68] H. Reiter and J.D. Stegeman. Classic al Harmonic Analysis and L o c al ly Comp act Gr oups . Oxford Universit y Press, Oxford, 2nd edition, 2000. [69] A.C.M. V an Ro oij. Non-A r chime de an F unctional Analysis . Marcel Dekker, 1978. [70] W.H. Sc hikhof. Ultr ametric Calculus . Cambridge Universit y Press, Cam- bridge, 1984. (Chapters 18, 19, 20, 21). [71] G. Sch warz. Estimating the dimension of a mo del. Annals of Statistics , 6:461–464, 1978. [72] A.K. Seda and P . Hitzler. Generalized distance functions in the theory of computation. Computer Journal , 53:443–464, 2010. [73] R. Sibson. Slink: an optimally efficient algorithm for the single-link cluster metho d. Computer Journal , 16:30–34, 1980. 40 [74] H.A. Simon. The Scienc es of the A rtificial . MIT Press, Cam bridge, MA, 1996. [75] D. Steinley . K-means clustering: a half-cen tury synthesis. British Journal of Mathematic al and Statistic al Psycholo gy , 59:1–3, 2006. [76] D. Steinley and M.J. Brusco. Initializing K-means batch clustering: a critical ev aluation of several techniques. Journal of Classific ation , 24:99– 121, 2007. [77] S.S. V empala. The R andom Pr oje ction Metho d . American Mathematical So ciet y , 2004. V ol. 65, DIMACS Series in Discrete Mathematics and The- oretical Computer Science. [78] I.V. V olo vich. Num b er theory as the ultimate physical theory . T echnical rep ort, 1987. Preprin t No. TH 4781/87, CERN, Genev a. [79] I.V. V olovic h. p-Adic string. Classic al Quantum Gr avity , 4:L83–L87, 1987. [80] H. W eyl. Symmetry . Princeton Universit y Press, 1983. [81] Rui Xu and D. W unsch. Survey of clustering algorithms. IEEE T r ansac- tions on Neur al Networks , 16:645–678, 2005. 41
Original Paper
Loading high-quality paper...
Comments & Academic Discussion
Loading comments...
Leave a Comment