Mapping eQTL networks with mixed graphical Markov models
Expression quantitative trait loci (eQTL) mapping constitutes a challenging problem due to, among other reasons, the high-dimensional multivariate nature of gene-expression traits. Next to the expression heterogeneity produced by confounding factors …
Authors: Inma Tur, Alberto Roverato, Robert Castelo
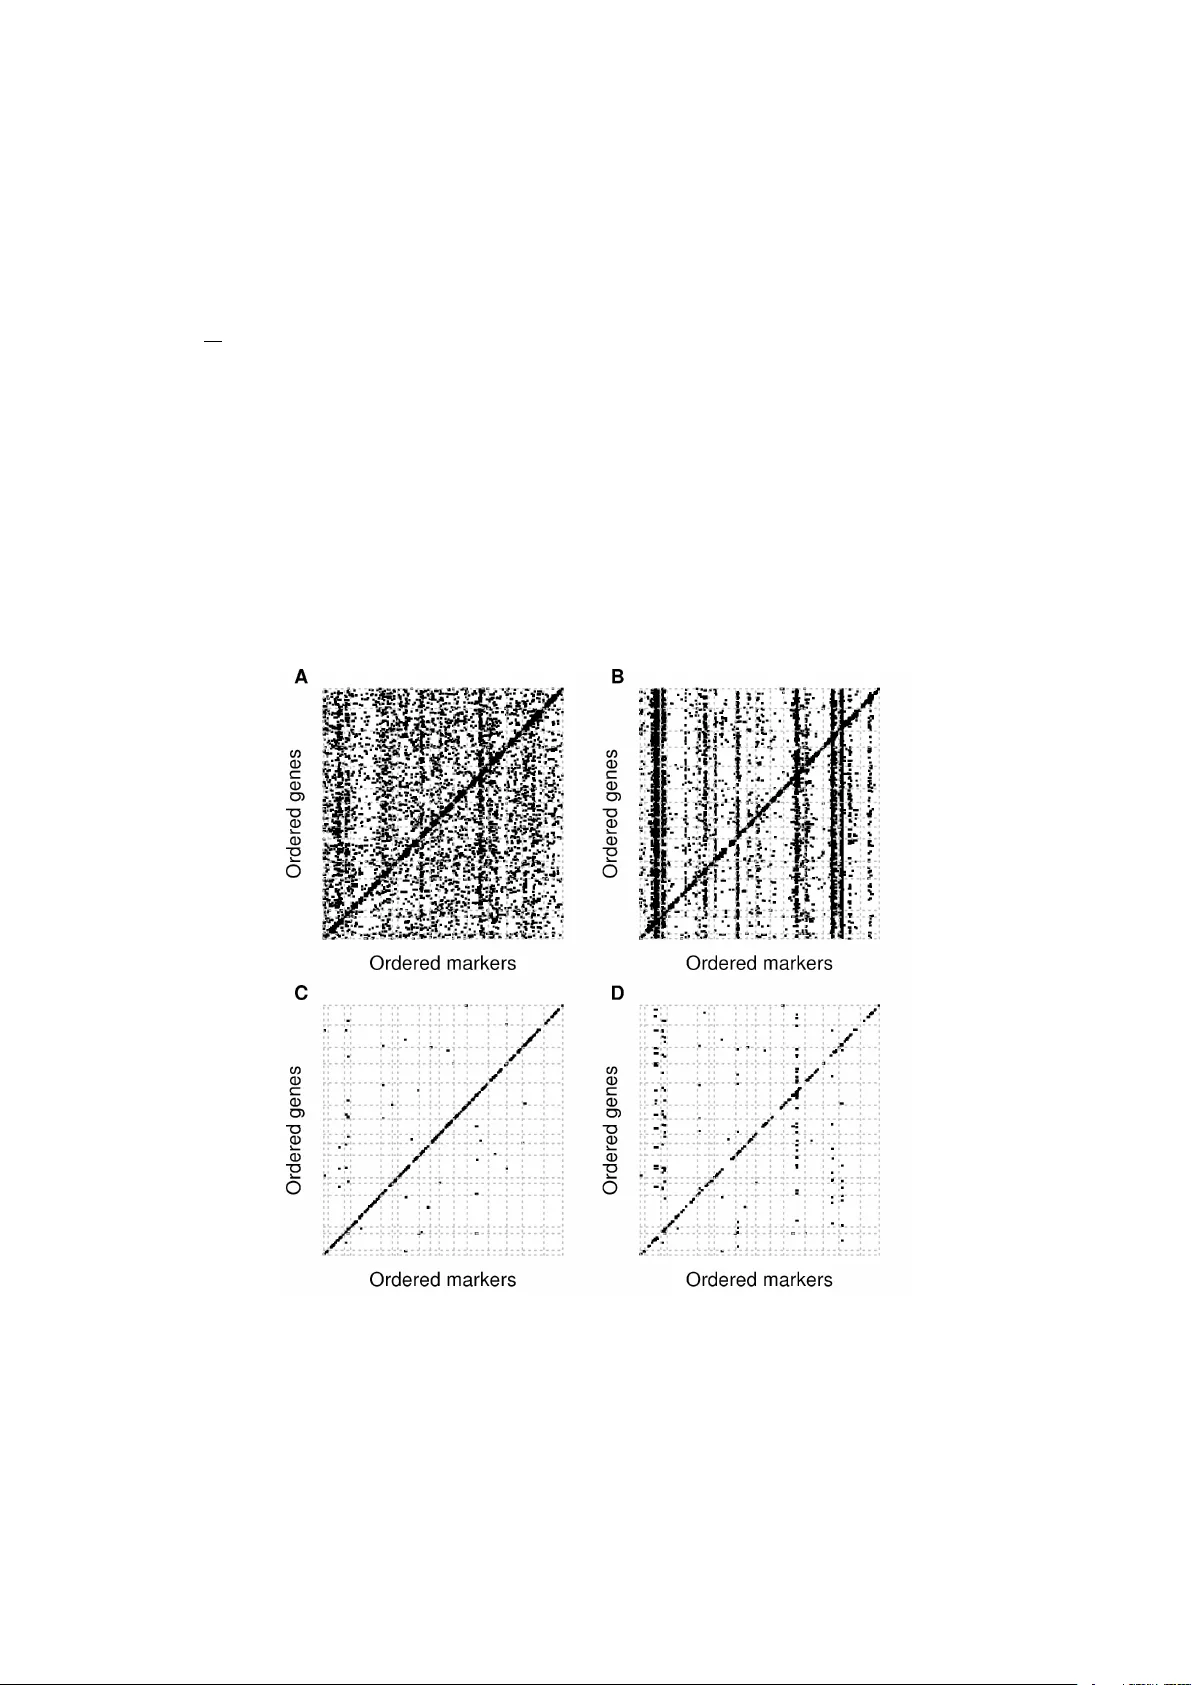
Mapping eQTL net w orks with mixed graphical Mark o v mo dels Inma T ur ∗ † Alb erto Ro v erato ‡ Rob ert Castelo ∗ † ∗ Dept. of Exp erimen tal and Health Sciences, Univ ersitat Pompeu F abra, E-08003 Barcelona, Spain † Researc h Programme on Biomedical Informatics, Institut Hospital del Mar d’Inv estigacions M ` ediques, E-08003 Barcelona, Spain ‡ Dept. of Statistical Sciences, Univ ersit` a di Bologna, I-40126 Bologna, Italy 1 Short running title: Mapping eQTL net works with mixed GMMs Key w ords: eQTL, gene net w ork, exact lik eliho o d ratio test, conditional Gaussian distri- bution, mixed graphical Mark ov mo del Corresp onding author: Rob ert Castelo GRIB-UPF-PRBB Dr. Aiguader 88 E-08003 Barcelona Spain T elf.: + 34 933 160 514 Email: robert.castelo@upf.edu 2 Abstract Expression quan titative trait loci (eQTL) mapping constitutes a challenging problem due to, among other reasons, the high-dimensional multiv ariate nature of gene-expression traits. Next to the expression heterogeneity pro duced by con- founding factors and other sources of un w anted v ariation, indirect effects spread throughout genes as a result of genetic, molecular and en vironmental p erturba- tions. F rom a m ultiv ariate p ersp ective one w ould like to adjust for the effect of all of these factors to end up with a netw ork of direct asso ciations connecting the path from genot yp e to phenotype. In this pap er we approach this challenge with mixed graphical Marko v mo dels, higher-order conditional indep endences and q -order cor- relation graphs. These mo dels show that additiv e genetic effects propagate through the net w ork as function of gene-gene correlations. Our estimation of the eQTL net- w ork underlying a well-studied yeast data set leads to a sparse structure with more direct genetic and regulatory associations that enable a straigh tforward comparison of the genetic con trol of gene expression across chromosomes. In terestingly , it also rev eals that eQTLs explain most of the expression v ariability of net w ork h ub genes. 3 INTR ODUCTION The simultaneous assay of gene-expression profiling and genot yping on the same samples with high-throughput technologies provides one of the primary types of in tegrativ e ge- nomics data sets, the so-called genetic al genomics data ( Jansen and Nap 2001). First studies pro ducing such data show ed that, for many genes, gene expression is an herita- ble trait ( Brem et al. 2002). F ollowing this observ ation, it so on b ecame evident that gene expression may act as an in termediate data tier that can p otentially increase our p o w er to map the genetic comp onent of phenotypic v ariabilit y in complex traits, such as human disease ( Schadt et al. 2003). The genetic v ariants asso ciated with each of these thousands of molecular phenot yp es are known as expression quan titativ e trait lo ci (eQTL) and they can b e broadly categorized into cis -acting and tr ans -acting asso cia- tions, dep ending on their lo cation relativ e to the gene whose expression levels map to the eQTL 1 . Because the relativ e concentration of RNA molecules reflects functional re- lationships b et ween genes, o v erlaying the correlation structure of gene expression on the eQTL asso ciations provides an eQTL network which can help to approac h the problem of reverse engineering the genot yp e-phenot yp e map with natural v ariation ( Rockman 2008). A straigh tforw ard wa y to map eQTL net w orks to the genome is by treating gene ex- pression profiles as indep enden t contin uous traits and applying classical QTL mapping tec hniques suc h as single mark er regression ( Tesson and Jansen 2009). Ho w ever, dif- feren tly than higher-level phenotypes such as disease onset, adult heigh t or yeast growth rates, gene expression is a high-dimensional multiv ariate trait in v olving measurements from thousands of genes co ordinately acting under complex molecular regulatory pro- grams. This feature mak es eQTL mapping a c hallenging problem for, at least, tw o rea- sons. One is that gene expression profiles can b e highly correlated as a pro duct of gene regulation, thereb y complicating the distinction b etw een direct and indirect effects when marginally insp ecting eQTL asso ciations that only inv olv e one gene at a time. The other is that high-throughput expression profiling can b e v ery sensitive to nonbiological factors of v ariation suc h as batch effects ( Leek and Storey 2007; Leek et al. 2010), intro- ducing heterogeneity and spurious correlations b etw een gene expression measurements. These artifacts may compromise the statistical pow er to map truly biological eQTLs ( Stegle et al. 2010) or show up as interesting genetic switches with broad pleiotropic effects affecting a large n um b er of genes, commonly known as eQTL hotsp ots ( Leek and Storey 2007; Breitling et al. 2008). These problems can b e addressed b y estimating and including the confounding factors in the mo del as main ( Leek and Storey 2007; 1 W e use here the terms cis and tr ans to refer to what is also known as lo c al and distant QTLs ( R ockman and Krugl y ak 2006), resp ectively . 4 Stegle et al. 2010) or mixed effects ( Kang et al. 2008; Listgar ten et al. 2010) and restricting the eQTL search to cis -acting v ariants lo cated in the regulatory regions of the gene to whic h they are asso ciated ( Montgomer y et al. 2010). Y et, tr ans -acting eQTL ha ve prov en to b e crucial to our understanding of complex regulatory mechanisms. A canonical example is lo cus control regions ( Li et al. 2002) that enhance the expression of distal genes under tissue-sp ecific conditions suc h as the one affecting the h uman β -globin lo cus. Recen t contributions hav e sho wn that tr ans - acting mec hanisms often mediate the genetic basis of disease ( Westra et al. 2013). The importance of iden tifying nonspurious tr ans -acting eQTLs has b een widely recog- nized and a large num b er of approaches that aim to address the problems described ab o v e exist in the literature. They can b e broadly categorized into those extending univ ariate single marker regression mo dels to adjust for confounding effects ( Leek and Storey 2007; Stegle et al. 2010; Listgar ten et al. 2010) and those using m ultiv ariate ap- proac hes. The latter can b e further categorized in to Ba yesian netw orks using conditional m utual information with constrain t-based algorithms ( Zhu et al. 2004), empirical Bay es hierarc hical mixtures ( Kendziorski et al. 2006), directed versions of the PC algorithm ( Chaibub Neto et al. 2008), structural equation models ( Liu et al. 2008), sparse partial least squares ( Chun and Keles ¸ 2009), fused lasso regression metho ds ( Kim and Xing 2009), random forests ( Michaelson et al. 2010), mixed Bay esian netw orks using the Ba yesian information criterion (BIC) with homogeneous conditional Gaussian regression mo dels ( Chaibub Neto et al. 2010), mixed graphical Mark ov mo dels restricted to tree net work top ologies ( Edw ards et al. 2010), sparse factor analysis ( P ar ts et al. 2011), and conditional indep endence tests of order one ( Bing and Hoeschele 2005; Chen et al. 2007; Kang et al. 2010; Chaibub Neto et al. 2013). Mixed graphical Marko v mo dels and conditional indep endence constitute a natural extension of classical QTL mapping to multiv ariate phenot yp e vectors. This enables a smo oth transition from mapping single phenotypes to building eQTL netw orks pro viding an easier statistical in terpretation of the resulting asso ciations. How ev er, a main short- coming of currently av ailable metho ds based on mixed graphical Marko v mo dels and conditional indep endence is that they are restricted to conditioning on one other gene to disen tangle direct and indirect relationships. Using higher-order conditional indep endences on high-dimensional data, such as the one pro duced b y genetical genomics exp erimen ts, is not trivial. The main purp ose of this article is tw ofold: first, to show a wa y to use higher-order conditional indep endence and mixed graphical Marko v mo dels in eQTL mapping by means of q -order correlation graphs, and second, to demonstrate that this approach can help to obtain v aluable insight in to the genetic regulatory architecture of gene expression in yeast. 5 MA TERIALS AND METHODS Expression measuremen ts and genot yping Throughout this article w e use a well-studied genetical genomics data set generated from tw o yeast strains, a wild-type (RM11-1a) and a lab strain (BY4716) that w ere crossed to generate 112 segregants, whic h w ere genotyped and whose gene expression was profiled using t wo-c hannel microarray c hips, including a dye-sw ap ( Brem and Krugl y ak 2005). W e applied bac kground correction, discarded con trol prob es and normalized the ra w expression data within and b et ween arrays using the limma pack age ( Smyth and Speed 2003; Ritchie et al. 2007). T o correct for p ossible dy e effects, we av eraged the normalized expression v alues of the dye-sw app ed arrays. This first set of normalized data consisted of 6,216 genes and 2,906 genotype markers, i.e., a total of p = 9 , 122 features, b y n = 112 samples. Using the geno.table() and findDupMarkers() functions from the R/qtl pac k age ( Br oman et al. 2003) w e iden tified 274 markers with > 5% missing genotypes and 749 mark ers with duplicated genotypes in other 260 markers. These 274+749=1,023 mark ers w ere discarded from further analysis. Among the remaining 1,883 we discarded 26 sho wing Mendelian segregation distortion at Holm’s FWER < 0 . 01. W e also remov ed 75 genes that could not b e found in the Marc h 2014 version of the sgdGene annotation table for the sacCer3 v ersion of the yeast genome at the UCSC Genome Browser ( http: //www.genome.ucsc.edu ). These filtering steps resulted in a final data set of 1,857 mark ers and 6,141 genes, i.e., a total of p = 7 , 998 features, by n = 112 samples. Missing genot yp es were treated b y complete-case analysis. The use of marginal distributions in the next section enables this approac h. Soft ware and repro ducibilit y The algorithms describ ed in this article are implemen ted in the op en source R/Bio conductor pac k age qpgraph av ailable for do wnload at http://www.bioconductor.org . Scripts with the R co de repro ducing the results of this article are av ailable at http://functionalgenomics. upf.edu/supplements/eQTLmixedGMMs . Mixed Graphical Mark o v mo dels of eQTL net works W e assumed that gene expression forms a p -m ultiv ariate sample following a condi- tional Gaussian distribution given the join t probability of all genetic v arian ts. Under this assumption a sensible mo del for an eQTL net work is a mixed graphical Mark o v mo del -GMM- ( Lauritzen and Wermuth 1989). A mixed GMM enables the in tegration 6 of the joint distribution of discrete genot yp es with the joint distribution of con tinuous expression measurements in a single multiv ariate statistical mo del satisfying a set of re- strictions of conditional indep endence enco ded by means of a graph; see ( Lauritzen 1996; Ed w ards 2000) for a comprehensive description of this type of statistical mo del. Here, w e review part of the mixed GMM theory required for this pap er. Mixed GMMs are statistical mo dels represen ting probability distributions inv olving discrete random v ariables (r.v.’s), denoted by I δ with δ ∈ ∆, and con tinuous r.v.’s, denoted by Y γ with γ ∈ Γ. This class of GMMs are determined b y mark ed graphs G = ( V , E ) with p marked v ertices V = ∆ ∪ Γ, and edge set E ⊆ V × V . V ertices δ ∈ ∆ are depicted by solid circles, γ ∈ Γ by op en ones and the entire set of them, V , index the vector of r.v.’s X = ( I , Y ). In our context, con tinuous r.v.’s Y correspond to genes and discrete r.v.’s I to mark ers or eQTLs; see Figure 1A for a graphical represen tation of one suc h mixed GMM. W e denote the join t sample space of X by x = ( i, y ) = { ( i δ ) δ ∈ ∆ , ( y γ ) γ ∈ Γ } , (1) where i δ are discrete v alues corresp onding to genotype alleles from the mark er or eQTL I δ and y γ are contin uous v alues of expression from gene Y γ . The set of all possible join t discrete levels i is denoted as I . F ollowing ( Lauritzen and Wermuth 1989), we assume that the joint distribution of the v ariables X is conditional Gaussian (also kno wn as CG-distribution) with densit y function: f ( x ) = f ( i, y ) = p ( i ) | 2 π Σ( i ) | − 1 2 × exp − 1 2 ( y − µ ( i )) T Σ( i ) − 1 ( y − µ ( i )) . (2) This distribution has the prop erty that contin uous v ariables follow a m ultiv ariate normal distribution N | Γ | ( µ ( i ) , Σ( i )) conditioned on the discrete v ariables. The parameters ( p ( i ) , µ ( i ) , Σ( i )) are called moment c haracteristics where p ( i ) is the probability that I = i , and µ ( i ) and Σ( i ) are the conditional mean and co v ariance matrix of Y which dep end on join t discrete level i . If the cov ariance matrix is constant across the levels of I , that is, Σ( i ) ≡ Σ, the mo del is homo gene ous . Otherwise, the mo del is said to b e heter o gene ous . Throughout this article we assume an homogeneous mixed GMM underlying the eQTL net work. This implies that genotypes affect only the mean expression lev el of genes and not the correlations b etw een them. W e can write the logarithm of the densit y in terms of the canonical parameters ( g ( i ) , h ( i ) , K ( i )): log f ( i, y ) = g ( i ) + h ( i ) T y − 1 2 y T K ( i ) y , (3) 7 where g ( i ) = log ( p ( i )) − 1 2 log | Σ( i ) | − 1 2 µ ( i ) T Σ( i ) − 1 µ ( i ) − | Γ | 2 log(2 π ) , (4) h ( i ) = Σ( i ) − 1 µ ( i ) , (5) K ( i ) = Σ( i ) − 1 . (6) CG-distributions satisfy the Mark ov prop erty if and only if their canonical parameters are expanded in to interaction terms suc h that only interactions betw een adjacent v ertices are presen t ( Lauritzen 1996). Th us, g ( i ) = X d ⊆ ∆ λ d ( i ) , h γ ( i ) = X d ⊆ ∆ η d ( i ) γ , k γ η ( i ) = X d ⊆ ∆ ψ d ( i ) γ η , (7) where λ d ( i ) > 0, with d ⊆ ∆ complete in G , represent the discrete in teractions among the v ariables indexed b y d ; η d ( i ) γ > 0, with d ∪ { γ } complete in G , represen t the mixed in teractions b et ween X γ and the v ariables indexed by d ; and ψ d ( i ) γ η > 0, with d ∪ { γ , η } complete in G , represen t the quadratic interactions b etw een X γ , X η and the v ariables indexed b y d . If the mo del is homogeneous, there are no mixed quadratic interactions, i.e., ψ d ( i ) γ η = 0 for d 6 = ∅ . Plugging these expansions in Eq. (3) we obtain log f ( i, y ) = X d ⊆ ∆ λ d ( i ) + X d ⊆ ∆ X γ ∈ Γ η d ( i ) γ y γ − 1 2 X d ⊆ ∆ X γ ,η ∈ Γ ψ d ( i ) γ η y γ y η . (8) Decomp osable mixed GMMs: An imp ortan t sub class of mixed GMMs is defined b y decomp osable marked graphs. A triple ( A, B , C ) of disjoint subsets of V form a decomp osition of an undirected marked graph G if V = A ∪ B ∪ C and: (1) C is a complete subset of V ; (2) C separates A from B ; and (3) C ⊆ ∆ or B ⊆ Γ. An undirected mark ed graph G is said to b e de c omp osable if it is complete, or if there exists a prop er decomp osition ( A, B , C ) such that the subgraphs G A ∪ C and G B ∪ C are decomp osable. In different terms, when G is undirected, decomp osability of G holds if and only if G do es not contain chordless cycles of length larger than 3 and do es not contain an y path b et w een tw o non-adjacent discrete v ertices passing through contin uous vertices only . Maxim um Likelihoo d Estimates of mixed GMMs: Let X = { x ( ν ) } = { i ( ν ) , y ( ν ) } b e a sample of ν = 1 , ..., n indep endent and identically distributed observ ations from a CG-distribution. F or an arbitrary subset A ⊆ V , we abbreviate to i A = i A ∩ ∆ , I A = I ∆ ∩ A 8 and y A = y A ∩ Γ and the follo wing sampling statistics are defined: n ( i ) = # ν : i ( ν ) = i , (9) s ( i ) = X ν : i ( ν ) = i y ( ν ) , (10) ¯ y ( i ) = s ( i ) /n ( i ) , (11) ss ( i ) = X ν : i ( ν ) = i y ( ν ) ( y ( ν ) ) T , (12) ssd ( i ) = ss ( i ) − s ( i ) s ( i ) T /n ( i ) , (13) ssd A ( A ) = X i A ∈I A ssd A ∩ Γ ( i A ) . (14) The likelihoo d function for the homogeneous, saturated mo del attains its maximum if and only if n ≥ | Γ | + |I | , which is almost surely equal to n ( i ) > 0 for all i ∈ I ( La uritzen 1996, Prop. 6.10). In suc h a case the maxim um lik eliho o d estimates (MLEs) of the momen t characteristics are defined as ˆ p ( i ) = n ( i ) /n, ˆ µ ( i ) = ¯ y ( i ) , ˆ Σ = ssd V ( V ) /n = ssd/n . (15) It follows, then, that saturated mixed GMMs cannot be directly estimated from data with p n , using only the formulas describ ed ab ov e. F or the unsaturated case, decomp osable mixed GMMs also admit explicit MLEs. In the homogeneous decomp osable case it can b e shown ( La uritzen 1996, Prop. 6.21) that the MLE exists almost surely if and only if n ( i C ) ≥ | C ∩ Γ | + |I C | for all cliques C of G and i C ∈ I C . In this case, MLEs are defined with the follo wing canonical parameters ( Lauritzen 1996, pg. 189): ˆ p ( i ) = k Y j =1 n ( i C j ) n ( i S j ) , (16) ˆ h ( i ) = n ( k X j =1 ssd C j ( C j ) − 1 ¯ y C j ( i C j ) | Γ | − ssd S j ( S j ) − 1 ¯ y S j ( i S j ) | Γ | ) , (17) ˆ K = n ( k X j =1 ssd C j ( C j ) − 1 | Γ | − ssd S j ( S j ) − 1 | Γ | ) , (18) where S 1 = ∅ . The matrices [ M ] | Γ | of Eq. (18) are defined as follows. Giv en a matrix M = { m γ η } | A |×| A | of dimension | A | × | A | with A ⊆ Γ, [ M ] | Γ | is a | Γ | × | Γ | matrix suc h that 9 [ M ] | Γ | γ η = m γ η , if { γ , η } ∈ A , 0 , otherwise . Analogously , in Eq. (17), [ M ] | Γ | is a | Γ | -length vector obtained from a | A | -length v ector M . Sim ulation of eQTL net w ork mo dels with mixed GMMs In this subsection, w e describ e how to sim ulate eQTL netw orks with homogeneous mixed GMMs and data from them. W e restrict ourselves to the case of a back cross, in whic h each genot yp e marker can hav e t wo different alleles AA and AB. How ev er, these pro cedures could b e extended to more complex cross mo dels allowing for other than linear additiv e effects (co dominan t mo del) on the mixed asso ciations, such as dominance effects. Sim ulation of eQTL net work structures: The first step to simulate a GMM consists of simulating its asso ciated graph G = ( V , E ) that defines the structure of the eQTL net w ork. eQTLs and expression profiles are represen ted in G by discrete v ertices ∆ and contin uous v ertices Γ, resp ectively , such that V = ∆ ∪ Γ and | V | = p . In the context of genetical genomics data w e make the assumption that discrete genotypes affect gene- expression measurements and not the other wa y around. Th us, we consider the underlying graph G as a marked graph where some edges are directed and represen ted by arro ws and some are undirected. More concretely , G will ha ve arrows p ointing from discrete vertices to contin uous ones, undirected edges b etw een con tinuous vertices and no edges b et w een discrete vertices. F rom this restriction, it follows that there are no semi-directed cycles and allows one to in terpret these GMMs as chain gr aphs , whic h are graphs formed b y undirected subgraphs connected b y directed edges ( Lauritzen 1996). Sim ulation of parameters of a homogeneous mixed GMM: Here w e show ho w to simulate the parameters of the homogeneous CG-distribution represented b y G with giv en marginal linear correlations of magnitude ρ on the pure contin uous (gene-gene) asso ciations and giv en additiv e effects of magnitude a on the mixed (eQTL) ones. Covarianc e matrix. Giv en the structure of a graph G , a random cov ariance matrix Σ can b e sim ulated as follows. Let G Γ ⊆ G denote the subgraph of p Γ = | Γ | pure con tinuous vertices and let ρ denote the desired mean marginal correlation b et ween each pair of contin uous r.v.’s ( X γ , X η ) suc h that ( γ , η ) ∈ G Γ . Let S + ( G Γ ) ⊂ S + denote the set of all p Γ × p Γ p ositiv e definite matrices in S + suc h that ev ery matrix S ∈ S + ( G Γ ) satisfies that { S − 1 } ij = 0 whenev er i 6 = j and ( i, j ) 6∈ G Γ . W e simulate Σ such that Σ ∈ S + ( G Γ ) in t wo steps. First, we build an initial p ositive definite matrix ˜ Σ 0 ∈ S + and, from this, we build the inc omplete matrix Σ 0 with elements { σ 0 ij } if either i = j or ( i, j ) ∈ G Γ , and the remaining elements unsp ecified. Second, w e 10 searc h for a p ositive c ompletion of Σ 0 , which consists of filling up Σ 0 in such a w a y that the resulting Σ ∈ S + ( G Γ ). It can b e sho wn ( Grone et al. 1984) that the incomplete matrix Σ 0 admits a p ositive completion and that it is unique. This means that, given Σ 0 , w e can use algorithms for maxim um-likelihoo d estimation or Bay esian conjugate inference ( Ro vera to 2002) as matrix completion algorithms. T o this end, we first dra w Σ 0 from a Wishart distribution W p Γ (Λ , p Γ ) with Λ = D ˜ Σ 0 D , D = diag( { p 1 /p Γ } p Γ ) and ˜ Σ 0 = { ˜ Σ 0 ij } p Γ × p Γ where ˜ Σ 0 ij = 1 for i = j and ˜ Σ 0 ij = ρ for i 6 = j . It is required that Λ ∈ S + and this happ ens if and only if − 1 / ( p Γ − 1) < ρ < 1 ( Seber 2007, pg. 317). Finally , we apply the iterative regression pro cedure introduced by Hastie et al. (2009, pg. 634) for maximum-lik eliho o d estimation of Gaussian GMMs with kno wn structure, as matrix completion algorithm to obtain Σ from Σ 0 . Pr ob ability of discr ete levels. Since we are simulating a back cross, each discrete r.v. tak es tw o p ossible v alues i δ = { 1 , 2 } with equal probability p ( i δ = 1) = p ( i δ = 2) = 0 . 5. F or the sole purp ose of simulating eQTL netw orks w e made the simplifying assumption that discrete r.v.’s representing eQTLs are marginally indep endent b et ween them. F rom these t wo assumptions it follows that joint levels i ∈ I are uniformly distributed, that is, p ( i ) = 1 / |I | , ∀ i ∈ I . Conditional me an ve ctor. Let a discrete v ariable I δ ha ve an additiv e effect a δ γ on the con tinuous v ariable Y γ . In the case of a bac kcross this implies that: a δ γ = µ γ (1) − µ γ (2) = 1 |I | / 2 X i 0 : i δ =1 µ ( i 0 ) − 1 |I | / 2 X i 0 : i δ =2 µ ( i 0 ) . (19) Using Eq. (5) we can calculate the conditional mean v ector as µ ( i ) = Σ · h ( i ). This enables simulating the cov ariance matrix indep endently from discrete r.v.’s while inter- preting it as a conditional one to generate µ ( i ). The v alues of the canonical parameter h ( i ) = { h γ ( i ) } γ ∈ Γ determine the strength of the mixed interactions b et ween discrete and con tinuous r.v.’s. Using Eq. (7) they can b e calculated as follows: h γ ( i ) = η ∅ γ , if ( δ, γ ) 6∈ E ∀ δ ∈ ∆ , { η δ ( i δ ) γ } i δ ∈I δ = { η δ (1) γ , η δ (2) γ } , if ( δ, γ ) ∈ E , δ ∈ ∆ . Without loss of generalit y , v alues η ∅ γ are set to zero. T o set v alues η δ (1) γ and η δ (2) γ , so that b oth Eqs. (5) and (19) are satisfied, w e pro ceed as follows. Assume that an eQTL I δ has a pleiotropic effect on a set of genes { Y γ } γ ∈ A δ , where A δ = { γ ∈ Γ : ( δ, γ ) ∈ E } . 11 By com bining Eqs. (5) and (19), for each γ ∈ A δ w e hav e that a δ γ = 1 |I | / 2 X i 0 : i δ =1 X ζ ∈ Γ σ γ ζ h ζ ( i 0 ) − 1 |I | / 2 X i 0 : i δ =2 X ζ ∈ Γ σ γ ζ h ζ ( i 0 ) = = 1 |I | / 2 X ζ ∈ Γ σ γ ζ ( X i 0 : i δ =1 h ζ ( i 0 ) − X i 0 : i δ =2 h ζ ( i 0 ) ) . Note that if j, k ∈ I are tw o discrete levels suc h that j δ = 1, k δ = 2 and j ∆ \{ δ } = k ∆ \{ δ } , then h ζ ( j ) = h ζ ( k ) for all ζ / ∈ A δ . It follo ws that for all ζ / ∈ A δ the terms h ζ ( i 0 ) in b oth summations cancel out and w e obtain, a δ γ = 2 |I | X ζ ∈ A δ σ γ ζ ( X i 0 : i δ =1 h ζ ( i 0 ) − X i 0 : i δ =2 h ζ ( i 0 ) ) = = 2 |I | X ζ ∈ A δ σ γ ζ |I | 2 η δ (1) γ − |I | 2 η δ (2) γ = X ζ ∈ A δ σ γ ζ { η δ (1) γ − η δ (2) γ } . Let η δ γ = η δ (1) γ − η δ (2) γ and the v ectors a δ A δ = { a δ γ } γ ∈ A δ , η δ A δ = { η δ γ } γ ∈ A δ , η 1 A δ = { η δ (1) γ } γ ∈ A δ and η 2 A δ = { η δ (2) γ } γ ∈ A δ . W e write the matrix form of the pre- vious expression as, a δ A δ = Σ { A δ ,A δ } η δ A δ , η δ A δ = Σ − 1 { A δ ,A δ } a δ A δ , η 1 A δ = Σ − 1 { A δ ,A δ } a δ A δ + η 2 A δ . Sim ulation of eQTL net w ork mo dels of exp erimen tal crosses W e hav e integrated the algorithms presented ab ov e with functions from the R/qtl pac k age ( Broman et al. 2003) to simulate eQTL net w ork mo dels of exp erimen tal crosses and data from them in the following w a y . First, we simulate a genetic map with a given n umber of c hromosomes and markers using the sim.map() function of the R/qtl pack age. Second, we sim ulate a homogeneous mixed GMM in tw o steps: (a) we define the, p ossibly random, underlying regulatory mo del of eQTLs and gene-gene asso ciations; (b) w e sim ulate the parameters ( p ( i ) , µ ( i ) , Σ) of this homogeneous mixed GMM according to the pro cedures describ ed ab ov e. Third, w e sim ulate data from the previous eQTL netw ork mo del with the function sim.cross() from the R/qtl pack age. This function is o v erloaded in qpgraph to plug the eQTL asso ciations into the corresp onding genetic lo ci and return a R/qtl cross ob ject. The function sim.cross() defined in the qpgraph pac k age pro ceeds as follo ws. First, 12 the genotype data is simulated by the pro cedures implemen ted in the R/qtl pack age. Genot yp es are sampled at each mark er from a Marko v chain with transition probabilities that dep end on the distance b etw een mark ers and a mapping function. eQTLs are placed at the mark ers and, in particular, if eQTLs are lo cated sufficien tly a wa y from each other, w e can assume that the corresp onding discrete r.v.’s are marginally indep endent b etw een them. Finally , qpgraph simulates gene expression v alues according to the homogeneous mixed GMM by sampling contin uous observ ations from the corresp onding parameters of the CG-distribution N | Γ | ( µ ( i ) , Σ), given the sampled genotype i from all joint eQTLs. Conditional indep endence tests parametrized b y mixed GMMs Approac hes to learning the structure of a mixed GMM using higher-order correlations require testing for conditional indep endence b et ween an y tw o r.v.’s X α and X β , such that β ⊆ Γ, given a set of conditioning ones X Q , denoted b y X α ⊥ ⊥ X β | X Q . T o this end, w e use a lik eliho o d-ratio test (LR T) b etw een tw o mo dels: a saturated mo del M 1 , determined b y the complete graph G 1 = ( V , E 1 ), where V = { α , β , Q } and E 1 = V × V , and a constrained mo del M 0 , determined by G 0 = ( V , E 0 ) with exactly one missing edge b et w een the tw o vertices α, β and thus E 0 = { V × V }\ ( α, β ) and Q = V \{ α, β } . Since G 1 is complete and ( α, β , Q ) is a prop er decomp osition of G 0 , M 1 and M 0 are b oth decomp osable, and therefore, they admit explicit MLEs (Eqs. 16-18). Giv en that V = ∆ ∪ Γ, we denote by ( γ , ζ ) a pair of contin uous r.v.’s (i.e., γ , ζ ∈ Γ), and b y ( δ, γ ) a pair of mixed r.v.’s with δ ∈ ∆ and, γ ∈ Γ, so that either Q = V \{ γ , ζ } or Q = V \{ δ, γ } are the conditioning subsets. In the con text of homogeneous mixed GMMs, the null hypothesis of conditional inde- p endence for the pure contin uous case, γ ⊥ ⊥ ζ | Q , corresp onds to a zero v alue in the ( γ , ζ ) and ( ζ , γ ) entries of the canonical parameter K (see Eqs. 7, 8). The log-likelihoo d-ratio statistic, whic h is twice the difference of the log-likelihoo ds of mo dels M 0 and M 1 , is reduced to (see La uritzen 1996, pg. 192): D γ ζ .Q = − 2 ln L 0 L 1 = − 2 ln | ssd Γ || ssd Γ \{ γ ,ζ } | | ssd Γ \{ γ } || ssd Γ \{ ζ } | n/ 2 = − 2 ln (Λ γ ζ .Q ) n/ 2 . (20) The n ull hypothesis of conditional indep endence in the mixed case, δ ⊥ ⊥ γ | Q , corre- sp onds to an expansion of the canonical parameter h γ ( i ) where the terms corresp onding to δ are zero, η δ ( i ) γ = 0 (see Eqs. 7, 8). In this case, the log-lik eliho o d-ratio statistic is ( La uritzen 1996, pg. 194): D δ γ .Q = − 2 ln | ssd Γ || ssd Γ ∗ (∆ ∗ ) | | ssd Γ ∗ || ssd Γ (∆ ∗ ) | n/ 2 = − 2 ln (Λ δ γ .Q ) n/ 2 , (21) 13 where Γ ∗ = Γ \{ γ } and ∆ ∗ = ∆ \{ δ } . Since mo dels M 1 and M 0 are decomp osable, they are collapsible onto the same set of v ariables X V \{ γ } ; see ( Edw ards 2000, pg. 86-87) and ( Didelez and Edw ards 2004). This prop erty implies that the density functions f of M 1 and M 0 can b e factorized as f V = f V \{ γ } · f γ | V \{ γ } suc h that the marginal and conditional densities, f V \{ γ } ∈ M V \{ γ } and f γ | V \{ γ } ∈ M γ | V \{ γ } , resp ectively , can b e parametrized separately . Therefore, the lik eliho o d function of M 1 and M 0 can b e computed as the pro duct of the likelihoo d of the marginal and the conditional mo dels, L 1 = L 1 γ | V \{ γ } · L 1 V \{ γ } and L 0 = L 0 γ | V \{ γ } · L 0 V \{ γ } , resp ectiv ely . It follows that the second term of these factorizations corresp onds to the same satu- rated mo del induced b y the complete subgraph formed b y the v ertices in V \{ γ } , L 1 V \{ γ } = L 0 V \{ γ } , and w e hav e that D γ ζ .Q = − 2 ln L 0 L 1 = − 2 ln L 0 γ | V \{ γ } L 1 γ | V \{ γ } ! = − 2 ln ˆ σ 0 γ | V \{ γ } ˆ σ 1 γ | V \{ γ } ! − n/ 2 , (22) where ˆ σ 0 γ | V \{ γ } and ˆ σ 1 γ | V \{ γ } denote the estimates of the conditional v ariance of the r.v. X γ giv en the rest of the r.v.’s under the null and the alternativ e conditional mo dels M 0 γ | V \{ γ } and M 1 γ | V \{ γ } , resp ectiv ely . In particular, these conditional mo dels are equiv alent to the ANCO V A mo dels ( Edw ards 2000, pg. 91) in which the con tinuous r.v. γ ∈ Γ is the resp onse v ariable and the rest are explanatory . In this context, we hav e that ˆ σ 0 γ | V \{ γ } = RSS 0 /n and ˆ σ 1 γ | V \{ γ } = RSS 1 /n , where RSS is the residual sum of squares of the corresp onding ANCO V A mo del and n is the sample size. The ANCOV A mo del corresp onding to M 1 γ | V \{ γ } for the case of a bac kcross is, X γ = µ + β δ Z δ + X κ ∈ ∆ ∗ β κ Z κ + | ∆ | X κ 1 =2 ( | ∆ | κ 1 ) X κ 2 =1 " β κ 1 κ 2 κ 1 Y κ =1 Z κ !# + X λ ∈ Γ ∗ β λ X λ + . (23) In this mo del, µ is the phenotype’s mean, the term β δ Z δ represen ts the effect of the discrete v ariable δ ∈ ∆ that we are testing and we assume that ∼ N 0 , σ 2 γ . The con tinuous r.v.’s in Q , Γ ∗ , are mo deled as a linear combination of r.v.’s (third summation of the equation). On the other hand, the join t levels of δ and of the discrete r.v.’s in Q , ∆, are enco ded through ( |I | − 1) terms where some of them represen t the main effects of eac h discrete r.v. (first summation). The rest of the terms enco de all the interacting effects b etw een the discrete r.v.’s (second summation). Eac h v ariable Z κ is an indicator v ariable that, in the case of a back cross, takes v alues 0 or 1 if the genotype of I κ is AA or AB, resp ectiv ely . The coun t of the num b er of parameters in the mo del of Eq. (23) is as follows: | ∆ | 14 parameters come from the term enco ding the main effect of Z δ and the first summation; the second summation inv olv es 2 | ∆ | − 1 − | ∆ | terms whereas the third one in volv es | Γ | − 1 terms. Thus, the saturated mo del M 1 γ | V \{ γ } describ ed in Eq. (23) has 2 | ∆ | + | Γ | − 2 free parameters in total, and therefore, n − 2 | ∆ | − | Γ | + 2 degrees of freedom, where n is the sample size of the data. F or the pure con tinuous case, the conditional mo del corresp onding to M 0 γ | V \{ γ } is the same as the one in Eq. (23) except that we remov e the term of the third summation that corresp onds to the v ariable X ζ . In this case, this mo del has n − 2 | ∆ | − | Γ | + 3 degrees of freedom. Therefore, under the n ull h yp othesis, the statistic D γ ζ .Q follo ws asymptotically a χ 2 d f distribution with d f = 1 degree of freedom. In general, we can derive the degrees of freedom for the pure contin uous case by writing explicitly the conditional exp ectation of X γ giv en X V \{ γ } . Under M 1 γ | V \{ γ } this corresp onds to, E ( X γ | ∆ , Γ \{ γ } ) = α ( i ∆ ) + X λ ∈ Γ \{ γ } β γ λ | Γ \{ γ } X λ , (24) where α ( i ∆ ) = µ γ ( i ∆ ) − P λ ∈ Γ \{ γ } β γ λ | Γ \{ γ } µ λ ( i ∆ ) and β γ λ | Γ \{ γ } is the partial regression co efficien t that is found through the canonical parameter K = { k γ ζ } , ∀ γ , ζ ∈ Γ, as β γ λ | Γ \{ γ } = − k γ λ /k γ γ ( La uritzen 1996, pg. 130). This mo del has n − |I | − | Γ | + 1 degrees of freedom since it has |I | parameters that come from the first term in Eq. (24) and | Γ | − 1 from the second term. On the other hand, the conditional exp ectation of X γ giv en X V \{ γ } under M 0 γ | V \{ γ } is E ( X γ | ∆ , Γ \{ γ , ζ } ) = α ( i ∆ ) + X λ ∈ Γ \{ γ ,ζ } β γ λ | Γ \{ γ ,ζ } X λ , whic h leads to n − |I | − | Γ | + 2 degrees of freedom. By computing the difference in the degrees of freedom of b oth mo dels, we ha v e that D γ ζ .Q follo ws asymptotically a χ 2 d f distribution with d f = 1 degree of freedom. In the mixed case, the lik eliho o d-ratio statistic D δ γ .Q of Eq. (21) is related to the LOD score used in QTL mapping LOD = log 10 L 1 L 0 , through the follo wing transformation of the LOD score: D δ γ .Q = 2 ln(10)LOD . (25) In fact, since the ratio b etw een L 1 and L 0 is equiv alen t to the ratio b etw een L 1 γ | V \{ γ } and 15 L 0 γ | V \{ γ } w e hav e that LOD = log 10 L 1 L 0 = log 10 L 1 γ | V \{ γ } L 0 γ | V \{ γ } ! . (26) In this case, the conditional saturated mo del M 1 γ | V \{ γ } for a back cross is the same as the one in Eq. (23). By contrast, in the conditional constrained mo del M 0 γ | V \{ γ } w e delete all the terms of Eq. (23) that in v olve the r.v. X δ . This constrained mo del has n − 2 | ∆ |− 1 − | Γ | + 2 free parameters. Th us, for a back cross the likelihoo d-ratio statistic D δ γ .Q , and therefore, the transformation of the LOD score (Eq. 25), follows a χ 2 d f distribution with d f = 2 | ∆ |− 1 degrees of freedom. Again, we can derive the degrees of freedom of the χ 2 d f distribution of the general case b y lo oking at the conditional exp ectation of mo dels M 1 γ | V \{ γ } (Eq. 24), and M 0 γ | V \{ γ } written as E ( X γ | ∆ \{ δ } , Γ \{ γ } ) = α ( i ∆ \{ δ } ) + X λ ∈ Γ \{ γ } β γ λ | Γ \{ γ } X λ . (27) Here, the first term inv olv es |I ∆ ∗ | parameters and the second | Γ | − 1, so that the con- strained mo del has n − | Γ | − |I ∆ ∗ | + 1 free parameters. Hence, we hav e that D δ γ .Q , and therefore, the transformed LOD score in Eq. (25) follows a χ 2 d f distribution with d f = |I ∆ ∗ | ( |I δ | − 1) degrees of freedom. In fact, La uritzen (1996, pg. 192 to 194) observed that, for decomp osable mixed GMMs, the lik eliho o d ratios Λ γ ζ .Q in Eq. (20) and Λ δ γ .Q in Eq. (21) follow exactly a b eta distribution. In order to enable such an exact test for homogeneous mixed GMMs, we pro ceed to deriv e their corresp onding parameters. Due to the decomp osabilit y and collapsibilit y of the saturated M 1 and constrained M 0 mo dels, we hav e seen that the analysis of the joint densities is equiv alent to the study of the univ ariate conditional densities of X γ giv en the rest of the v ariables. Concretely , for the pure contin uous case, the likelihoo d ratio statistic Λ γ ζ .Q is equiv alent to the ratio RSS 1 / RSS 0 where RSS 0 and RSS 1 are the residual sum of squares of the constrained and the saturated univ ariate mo dels, resp ectively , and b oth follo w a χ 2 k distribution, where k is the n umber of free parameters of each mo del. Let RSS 1 . 0 denote the difference RSS 0 − RSS 1 . F ollowing ( Ra o 1973, pg. 166), if a r.v. X follows a χ 2 k with k degrees of freedom it also follows a gamma distribution Γ( k / 2 , 2). Hence, RSS 1 ∼ Γ n − | Γ | − |I | + 1 2 , 2 , RSS 0 ∼ Γ n − | Γ | − |I | + 2 2 , 2 and RSS 1 . 0 ∼ Γ (1 / 2 , 2). Moreov er, if X and Y are tw o indep endent r.v.’s suc h that 16 X ∼ Γ ( k 1 , θ ) and Y ∼ Γ ( k 2 , θ ), then it can b e shown ( Rao 1973, pg. 165) that X X + Y ∼ B ( k 1 , k 2 ) , (28) where B ( k 1 , k 2 ) denotes the b eta distribution with shap e parameters k 1 and k 2 . Finally , if w e let X = RSS 1 and Y = RSS 1 . 0 , it follo ws that, Λ γ ζ .Q = RSS 1 RSS 0 ∼ B n − | Γ | − |I | + 1 2 , 1 2 . By an argumen t analogous to the pure con tinuous case, the likelihoo d-ratio statistic raised to the p ow er 2 /n for the null hypothesis of a missing mixed edge follows a b eta distribution with these parameters: Λ δ γ .Q ∼ B n − | Γ | − |I | + 1 2 , |I ∆ ∗ | ( |I δ | − 1) 2 . (29) Hence, the follo wing transformation of the LOD score, Λ δ γ .Q = 10 − 2 n LOD , follo ws a b eta distribution with parameters giv en in Eq. (29). On the other hand, if w e let p 1 = k 1 / 2 and p 2 = k 2 / 2 in Eq. (28), it can b e shown ( Rao 1973, pg. 167) that F = ( X/k 1 ) / ( Y /k 2 ) ∼ F ( k 1 , k 2 ). This means that we can also p erform an exact conditional indep endence test in terms of the F -distribution parametrized with a mixed GMM, b y first calculating F γ ζ .Q = 1 n − | Γ | − |I | + 1 · Λ γ ζ .Q 1 − Λ γ ζ .Q , F δ γ .Q = |I ∆ ∗ | ( |I δ | − 1) n − | Γ | − |I | + 1 · Λ δ γ .Q 1 − Λ δ γ .Q , for the pure contin uous and mixed cases, resp ectiv ely , and then using the fact that they follo w the F-distribution under the null, sp ecified here b elo w as, F γ ζ .Q ∼ F (1 , n − | Γ | − |I | + 1) , F δ γ .Q ∼ F ( |I ∆ ∗ | ( |I δ | − 1) , n − | Γ | − |I | + 1) . The prop ortion, denoted by η 2 , of (phenot ypic) v ariance of X γ explained by an eQTL X δ while controlling for the rest of r.v.’s X V \{ γ } , can b e estimated as the difference b etw een the estimated conditional v ariances of X γ giv en X V \{ γ } under the saturated and the 17 constrained mo dels, divided b y the total v ariance of X γ : η 2 = v ar { E( X γ | X V \{ γ } ) } − v ar { E( X γ | X Q ) } v ar( X γ ) , (30) whic h, after applying the law of total v ariance, leads to η 2 = ˆ σ 0 γ | V \{ γ } − ˆ σ 1 γ | V \{ γ } ˆ σ γ γ = RSS 0 − RSS 1 ( n − 1) · v ar( X γ ) . (31) Note that when V \{ γ } = { δ } , that is, Q = ∅ , the estimated conditional v ariance un- der the constrained mo del, RSS 0 /n , is equal to the unconditional v ariance of X γ ; i.e., RSS 0 /n = v ar( X γ ). In this case, the prop ortion of the phenotypic v ariance explained by the eQTL reduces to ( Broman and Sen 2009, pg. 77), η 2 = RSS 0 − RSS 1 RSS 0 = 1 − Λ δ γ .Q . (32) q -Order correlation graphs There is a wide sp ectrum of strategies based on testing for conditional indep endence, whic h can b e follow ed to learn a mixed GMM from data, similarly as with Gaussian GMMs for pure contin uous data; see, e.g., ( Castelo and R o vera to 2006; Kalisch and B ¨ uhlmann 2007). In the context of estimating eQTL netw orks from genetical genomics data the num b er of genes and genot yp e markers p exceeds by far the sample size n ; i.e., p n . This fact precludes conditioning directly on the rest of the genes and markers X V \{ i,j } when testing for an eQTL asso ciation ( i, j ) while adjusting for all p ossible indirect effects. In other words, we cannot directly test for full-order conditional indep endences X i ⊥ ⊥ X j | X V \{ i,j } . W e approach this problem using limited-order correlations, an strategy successfully applied to Gaussian GMMs ( Castelo and R overa to 2006). It consists of testing for conditional indep endences of order q < ( p − 2), i.e., X i ⊥ ⊥ X j | X Q with | Q | = q , exp ecting that many of the indirect relationships b et ween i and j can b e explained b y subsets Q of size q . The exten t to which this can happ en dep ends on the sparseness of the underlying net work structure G and on the num b er of av ailable observ ations n . The mathematical ob ject that results from testing q -order correlations is called a q -order correlation graph, or qp-graph ( Castelo and R overa to 2006), and it is defined as follows. Let P V b e a probability distribution which is Mark o v ov er an undirected graph G = ( V , E ) with | V | = p and an integer 0 ≤ q ≤ ( p − 2). A qp-graph of order q with resp ect to G is the undirected graph G ( q ) = ( V , E ( q ) ) where ( i, j ) 6∈ E ( q ) if and only if there 18 exists a set U ⊆ V \{ i, j } with | U | ≤ q such that X i ⊥ ⊥ X j | X U holds in P V ( Castelo and R overa to 2006). Assuming there are no additional indep endence restrictions in P V than those in G , it can b e shown ( Castelo and Ro vera to 2006) that G ⊆ G ( q ) in the sense that ev ery edge that is present in the true underlying net work G is also present in the qp-graph G ( q ) . F rom this fact it follows that a qp-graph G ( q ) approac hes G as q gro ws large, and therefore, G ( q ) can b e seen as an approximation to G ; see Castelo and R o vera to (2006) for further details. Because separation in undirected mark ed graphs with mixed discrete and contin uous v ertices works the same as in undirected pure graphs with either one of these t wo t yp es of vertices, it follows that the definition of qp-graph also holds for mixed v ertices and CG-distributions P V . Estimation of eQTL netw orks with qp-graphs Instead of directly approaching the problem of inferring the graph structure G of the underlying eQTL netw ork from genetical genomics data with p n , we prop ose to calculate a qp-graph estimate ˆ G ( q ) . F or this purp ose, we measure the association b etw een t wo r.v.’s by means of a quantit y called the non-r eje ction r ate (NRR), which is defined as follo ws. Let Q q ij = { Q ⊆ V \{ i, j } : | Q | = q } and let T q ij b e a binary r.v. asso ciated with the pair of v ertices ( i, j ) that takes v alues from the following three-step pro cedure: 1) an element Q is sampled from Q q ij according to a (discrete) uniform distribution; 2) test the n ull hypothesis of conditional indep endence H 0 : X i ⊥ ⊥ X j | X Q ; and 3) if the null h yp othesis H 0 is rejected then T q ij tak es v alue 0, otherwise takes v alue 1. W e hav e that T q ij follo ws a Bernoulli distribution and the non-rejection rate, denoted as ν q ij , is defined as its exp ectancy ν q ij := E[ T q ij ] = Pr( T q ij = 1) . The NRR measure w as originally developed to learn qp-graphs from pure con tin uous data ( Castelo and R overa to 2006). Ho w ever, note that by using a suitable test for the n ull hypothesis H 0 : X i ⊥ ⊥ X j | X Q , w e can also use the NRR in mixed data sets such as those pro duced b y genetical genomics exp erimen ts. It can b e shown ( Castelo and R overa to 2006) that the theoretical NRR is a function of the probability α of the type-I error of the test, the mean v alue β ij of the t yp e-I I error of the test for all subsets Q , and the prop ortion π q ij of subsets Q of size q 19 that separate i and j in the underlying G : ν q ij = β ij (1 − π q ij ) + (1 − α ) π q ij . (33) This expression helps understanding the information con vey ed by the NRR in the follow- ing w a y . If a pair of v ertices ( i, j ) is connected in G , then π q ij = 0 and ν q ij = β ij . This means that for asso ciations present in G , the NRR ν q ij is 1 minus the statistical p ow er to detect that asso ciation. In such a case, ν q ij dep ends on the strength of the asso ciation b et w een X i and X j o ver all marginal distributions of size ( q + 2). Moreov er, note that from Eq. (33) it follo ws that a ν q ij v alue close to zero implies that b oth, β ij and π q ij , are close to zero. This means that either ( i, j ) is in G or q is to o small. Analogously , if ν q ij is large, then either π q ij or β ij are large, and w e can conclude that either ( i, j ) is not present in G or, otherwise, there is no sufficient statistical p ow er to detect that asso ciation. As the statistical p o wer to reject the null hypothesis H 0 dep ends on n − q , the latter circumstance may b e due to an insufficient sample size n , a v alue of q that is to o large, or b oth. F rom these observ ations it follows that a NRR v alue ν q ij close to zero indicates that ( i, j ) ∈ G ( q ) while a v alue close to one p oints to the con trary , ( i, j ) 6∈ G ( q ) . The estimation of ν q ij for a pair of r.v.’s ( X i , X j ) can b e obtained by testing the conditional independence X i ⊥ ⊥ X j | X Q for ev ery Q ∈ Q q ij . Ho wev er, the n um b er of subsets Q in Q q ij can b e prohibitiv ely large. An effective approach to addressing this problem ( Castelo and Ro vera to 2006) consists of calculating an estimate ˆ ν q ij on the basis of a limited n umber subsets Q ∈ Q q ij , suc h as 100, sampled uniformly at random. W e may b e interested in explicitly adjusting for confounding factors and other cov ari- ates C = { C 1 , C 2 , . . . , C k } . It is straigh tforw ard to incorp orate them in to a NRR ν q ij. C b y sampling subsets Q from Q q ij. C = { Q ⊆ { V \{ i, j }} ∪ C : C ⊆ Q and | Q | = q } . Note that cov ariates in C can b e kno wn or, in the case of unknown confounding factors, estimated with algorithms such as SV A ( Leek and Storey 2007) or PEER ( Stegle et al. 2010). Finally , the qp-graph estimate ˆ G ( q ) of the underlying eQTL net work structure G can b e obtained b y selecting those edges ( i, j ) that meet a maximum cutoff v alue : ˆ G ( q ) := { ( V , E ( q ) ) : ( i, j ) ∈ E ( q ) ⇔ ν q ij < } . 20 RESUL TS Flo w of genetic additiv e effects through gene expression Using the R/qtl pack age ( Broman and Sen 2009) we simulated a genetic map formed b y one single c hromosome 100 cM long and 10 equally-spaced mark ers. W e built an eQTL net work of p Γ = 5 genes forming a chain, where the first of them had one eQTL placed randomly among the 10 mark ers (Fig. 1A). W e simulated 10 mixed GMMs with the eQTL net work structure sho wn in Figure 1A, under increasing v alues of the marginal correlation b et w een the genes ( ρ = { 0 . 25 , 0 . 5 , 0 . 75 } ) and of the additive effect from the eQTL on gene 1 ( a = { 0 . 5 , 1 , 2 . 5 , 5 } ). W e sampled 1,000 data sets of n = 100 observ ations from eac h of these 10 mo dels. W e estimated the additive effect of the eQTL on eac h of the 5 genes, av eraged o v er the 10,000 data sets at each combination of additive effect and marginal correlation. Note that only the additiv e effect on gene 1 is direct (Fig. 1A). Figure 1 Propagation of indirect eQTL additive effects. (A) Structure of the eQTL net wo rk underlying the mixed GMM emplo yed to simulate the data shown in B-D. (B-D) Average estimated additive effects of the eQTL on each gene across 10,000 data sets simulated from different combinations of nominal gene-gene co rrelations ( ρ ) and additive effects ( a ). Gray lines were calculated from all data while black lines recreate the effect of selection bias b y using only eQTL asso ciations with LOD > 3 . 21 Figure 1, B-D, gray lines, sho ws the estimated a verage additiv e effects for the three differen t marginal correlation v alues on the gene-gene asso ciations. These plots demon- strate that additive effects propagate as a function of gene-gene correlations ρ . More concretely , when ρ ≥ 0 . 5 mo derate to large additiv e effects may easily show up as indi- rect eQTL asso ciations when insp ecting the margin of the data formed b y one genetic v ariant and one gene-expression profile. Black lines w ere calculated from the same data, but discarding additive effects corresp onding to LOD scores ≤ 3. This recreates the effect of selection bias ( Broman and Sen 2009) and sho ws that indirect genetic additive effects are amplified under this circumstance. Higher-order conditioning adjusts for confounding effects Confounding effects in gene-expression data affect most of the genes b eing profiled. Sometimes the sources of confounding are kno wn, or can b e estimated with metho ds such as SV A ( Leek and Storey 2007) or PEER ( Stegle et al. 2010), and may b e explicitly adjusted by including them as main effects into the mo del. Often, ho wev er, these sources are unkno wn and it may b e difficult to adjust or remov e them without affecting the biological signal and underlying correlation structure that we wan t to estimate. Using sim ulations, here w e sho w that confounding effects affecting all genes can b e implicitly adjusted b y using higher-order conditioning. Using the same genetic map we sim ulated b efore, we built an eQTL net work with 100 genes without asso ciations b et w een them and where one of the genes has an eQTL placed randomly among the 10 markers with a fixed additive effect of a = 2 . 5. A con tinuous confounding factor w as included under tw o mo dels with ρ = 0 . 5: a systematic one where the confounding factor affects all genes, and a sp ecific one where it affects only the t wo genes, or the gene and marker, b eing tested. W e considered a fixed sample size of n = 100 and conditioning orders q = { 0 , 1 , . . . , 50 } , where q = 0 corresp onds to the marginal asso ciation without conditioning. W e tested the presence of a gene-gene asso ciation and of an eQTL asso ciation b et ween the marker con taining the sim ulated eQTL and one of the genes not asso ciated with that eQTL. Note that none of these asso ciations were presen t in the simulated eQTL net w ork. F or ev ery q order with q > 0, a subset Q of size q w as sampled uniformly at random among the rest of the genes not b eing tested, and used for conditioning. When considering the explicit adjustment of the confounding factor, this one was added to Q except when q = 0 since then Q = {∅} . Once Q was fixed, 100 data sets were sampled from the corresp onding mixed GMM and tw o conditional indep endence tests w ere conducted in eac h data set for the presence of b oth, the eQTL and the gene-gene asso ciation, given the sampled genes in Q . 22 Figure 2 Explicit and implicit adjustment of confounding with higher-order conditional indep endence tests. Empirical type-I error rate for conditional indep endence tests from simulated data at a nominal level α = 0 . 05 (dotted horizontal line) as function of the conditioning order q . (A) Results on testing for an absent eQTL asso ciation; (B) results for an absent gene-gene asso ciation. Solid lines correspond to the mo del under which confounding affects only the tested genes while dashed lines correspond to a confounding effect on all genes. Dotted lines from b oth confounding mo dels overlap b ecause they correspond to the inclusion of the confounding effect in the conditioning subsets, thereb y explicitly adjusting for it. Figure 2 shows the empirical t yp e-I error rate as function of the conditioning order q , where Figure 2A corresp onds to the eQTL asso ciation and Figure 2B to the gene-gene asso ciation. This figure shows that, as exp ected, the explicit inclusion of the confounding factor in the conditioning subset Q (dotted lines) adjusts the confounding effect immedi- ately with q > 0 in b oth situations, when either all genes are affected or only the tested ones. When the confounding effect is not included in Q and affects only the tested genes (solid lines), it yields high type-I error rates that only decrease linearly with n − q , quan tit y on whic h statistical p o wer depends. Ho wev er, when confounding affects all genes (dashed lines) the type-I error rate has an exp onential decay , and for q > 20 the confounding effect is effectiv ely adjusted in these data. qp-Graph estimates of eQTL net works are enric hed for cis- acting asso ciations Expression QTLs acting in cis hav e more direct mechanisms of regulation than those acting in tr ans ( R ockman and Krugl y ak 2006; Cheung and Spielman 2009). This h yp othesis is supp orted by the observ ation that cis -acting eQTLs often explain a larger fraction of expression v ariance and show larger additive effects, than those acting in tr ans ( Rockman and Krugl y ak 2006; Petretto et al. 2006; Cheung and Spielman 2009). On the other hand, spurious eQTL asso ciations tend to inflate the discov ery of tr ans -acting eQTLs ( Breitling et al. 2008). F rom this p ersp ective, it makes sense to 23 exp ect an enric hmen t of cis -eQTLs when indirect asso ciations are effectiv ely discarded ( Kang et al. 2008; Listgar ten et al. 2010). W e NRR v alues ν q ij on every pair ( i, j ) of mark er and gene from the y east data set of n = 112 segregants for different q = { 25 , 50 , 75 , 100 } orders, restricting conditioning subsets to b e formed by genes only . The resulting estimates ˆ ν q k ij , q k ∈ q , w ere av eraged, ˆ ν ¯ q ij = 1 | q | P q k ˆ ν q k ij , to accoun t for the uncertain t y in the c hoice of the conditioning order q ( Castelo and R o vera to 2009). W e ranked mark er-gene pairs ( i, j ) by a v erage NRR v alues ˆ ν ¯ q ij and made a comparison against the ranking b y p -v alue of the (exact) LR T for marginal indep endence (i.e., where q = 0) to directly assess the added v alue of higher-order conditioning under the same t yp e of statistical test. W e considered conserv ative and liberal cutoff v alues = { 0 . 1 , 0 . 5 } on the av erage NRR ˆ ν ¯ q ij and obtained tw o different qp-graph estimates of the underlying eQTL netw ork, denoted b y ˆ G ( ¯ q ) = ( V , E ( ¯ q ) ), eac h of them ha ving | E ( ¯ q ) 0 . 1 | = 3 , 553 and | E ( ¯ q ) 0 . 5 | = 55 , 562 eQTL edges. Figure 3 Enrichment of cis -acting e QTL asso ciations. Dot plots of eQTL asso ciations in yeast, where the x -axis and y -axis represent p ositions along the genome of mark ers and genes, resp ectively . Diagonal bands a rise from cis -eQTLs while vertical ones from tr ans -eQTLs. Each row of tw o plots shows the top- k eQTLs with largest strength in terms of non-rejection rates (A and C) and p -values for the null hyp othesis of marginal indep endence (B and D), where k is the numb er of eQTLs meeting a lib eral (A) and conservative (C) cutoff on the non-rejection rate. He nce, plots in each ro w contain the same numb er of eQTLs. 24 W e then selected the top- k num b er of marker-gene pairs ( i, j ) with low est p -v alue in the marginal indep endence test, where k = {| E ( ¯ q ) |} , which led to tw o other estimates of the eQTL netw ork, denoted b y ˆ G (0) . Note that b oth, ˆ G ( ¯ q ) and ˆ G (0) , ha ve the same n umber of edges, in this case, pairs ( i, j ) of eQTL asso ciations b et ween a mark er and a gene, thereb y enabling a direct comparison of the fraction of cis - and tr ans -acting selected eQTL asso ciations. T able 1 Enrichment of cis -eQTL asso ciations. Numb er of cis -eQTL asso ciations in yeast found by the metho d intro duced in this article ( qpgraph ) and by a marginal test of indep endence. Different columns co rresp ond to different cutoffs (conservative, lib eral) employ ed by qpgraph to select eQTLs, and different distances (500bp and 10Kb) to the gene TSS. Conserv ativ e cutoff (3,553 eQTLs) Lib eral cutoff (55,562 eQTLs) Metho d cis dist. 500bp cis dist. 10Kb cis dist. 500bp cis dist. 10Kb qpgraph 104 1,469 369 5,878 marginal 56 784 225 3,390 Enric hment 85% 87% 64% 73% In Figure 3 we can see dot plots of the eQTL asso ciations present in qp-graphs ˆ G ( ¯ q ) (Figure 3, A and C), and those present in ˆ G (0) using the marginal approach (Figure 3, B and D). Given the same n um b er of eQTL asso ciations, Figure 3 sho ws that qp-graph estimates of the underlying eQTL netw ork hav e a higher num b er of cis -acting eQTLs than the marginal test, with an enric hmen t b et ween 64% and 73% using the lib eral cutoff, whic h increases to 85% and 87% using the conserv ative cutoff (see T able 1). Note that with the marginal approach more vertical bands of tr ans -acting asso ciations remained presen t among the strongest selected eQTLs (Figure 3D), than with the qp-graph estimate (Figure 3C). W e interpret this observ ation as evidence of the propagation of additive effects due to strong gene-gene correlations either present in the underlying eQTL net w ork or created by confounding effects, and possibly aggra v ated b y selection bias, as previously sho wn in Figure 1. P erformance comparison against another metho d W e compared the p erformance of the metho dology introduced in this pap er with a recen t approac h for causal inference among pairs of phenot yp es ( Chaibub Neto et al. 2013). This approach, called causal mo del selection tests (CMSTs), is implemen ted in the R/CRAN pac k age qtlhot and can b e used in 3 different w ays (parametric, non- parametric and join t parametric), with tw o different p enalized log-likelihoo d functions (AIC and BIC); see Chaibub Neto et al. (2013, pg. 1005) for details. 25 W e ran the CMST analysis on the yeast data analyzed in this pap er following the pro cedure describ ed in ( Chaibub Neto et al. 2013, pg. 1008-1010), which assessed p erformance using differen tial expression relationships obtained from a database of 247 kno c k-out (K O) exp eriments in yeast ( Hughes et al. 2000; Zhu et al. 2008). T o enable the comparison we used the ra w CMST p -v alue of the so-called “ M 3 indep enden t mo del” (see Chaibub Neto et al. 2013, Figure 1) to build a ranking of 30,192 p otential regula- tory relationships, where each pair of genes had a common eQTL. W e compared it against a corresp onding ranking of NRR v alues estimated from the same data. Among these pre- dicted asso ciations 1,634 formed part of the database of 247 K O-exp erimen ts and using them as a bronze standard, we compared the tw o rankings by means of precision-recall curv es. These are shown in Figure 4A and show nearly identical p erformance among all compared metho ds. Figure 4 Compa rison of qpgraph with qtlhot/CMST. Precision-recall curves calculated from predicted regula- to ry relationships inferred from a y east cross data set using the app roach intro duced in this pap er ( qpgraph ) and 6 different configurations of the qtlhot /CMST metho d. (A) Predictions are compa red against a bronze standa rd formed by relationships formed b y kno cked-out genes and their putative targets derived from dif- ferential expression ( Hughes et al. 2000; Zhu et al. 2008). (B) This bronze standard is further restricted to relationships also present in the Y eastract database ( Teixeira et al. 2014) of curated transcriptional regulato ry asso ciations. The horizontal gray dotted line indicates the baseline precision attained by a random p redicto r. Since a KO-gene may pro duce a cascade of expression c hanges, man y of the 1,634 relationships in the bronze standard ma y actually b e indirect, whic h would explain the similar p erformance using either low er (CMST) or higher ( qpgraph ) conditioning. W e attempted to build a bronze standard of more direct regulatory relationships by first restricting the initial set of 30,192 p ossible asso ciations to 3,074 that inv olved at least one transcription factor gene. Among these, w e found 94 that w ere present in the database 26 of K O exp eriments and in the Y eastract database of curated transcriptional regulatory relationships ( Teixeira et al. 2014) and considered them as new bronze standard for comparison. The resulting precision-recall curv es are shown in Figure 4B and rev eal that NRR v alues estimated with qpgraph hav e larger discriminativ e p o w er than CMSTs to iden tify direct regulatory in teractions. Concretely , the area under the curve (AUC) for qpgraph is b et ween 49% and 80% larger than the AUC of the different versions of CMSTs. The genetic con trol of a gene-expression net work in a yeast cross W e p erformed all pairwise exact tests of marginal indep endence on every mark er- gene and gene-gene pair and corrected the resulting p -v alues by FDR to select those asso ciations with FDR < 1%. The resulting graph, denoted by ˆ G (0) , had 92,710 eQTL and 2,203,119 gene-gene asso ciations. The graph ˆ G (0) constitutes a first estimate of the underlying eQTL netw ork and it could b e also obtained b y the classical approac h in QTL analysis of p erm uting phenotypes to test for the global n ull hypothesis of no QTL an ywhere in the genome. Ob viously , b ecause the asso ciations hav e b een selected only using the margin of the data formed by one marker and one gene, or tw o genes, man y of them will b e indirect or spurious. T o remov e those asso ciations we used the previously calculated a v erage NRR v alues ν ( ¯ q ) ij and selected a conserv ativ e cutoff of = 0 . 1, so that a present asso ciation requires at least 90% of the conditional indep endence tests to b e rejected. This resulted in an estimate ˆ G ( ¯ q ) 0 . 1 ⊆ ˆ G (0) formed by 3,498 eQTL and 1,799 gene-gene asso ciations. Note that while the estimation of ˆ G (0) requires some treatment of multiple testing, the NRR av oids this problem b y actually exploiting the fact that is p erforming many tests to inform, by means of a Bernoulli v ariable, how close or far tw o genes, or a mark er and a gene, are lo cated in the net w ork. The genetic connected comp onents of the eQTL netw ork inv olv ed 450 genes and 3,498 eQTLs on 1,493 different lo ci, with a median of 6 eQTLs p er gene. A substan tial p ercen tage of genes (27%) had > 10 eQTLs on their o wn chromosome. Since eQTLs in ˆ G ( ¯ q ) 0 . 1 w ere indep enden tly mapp ed from each other, a fraction of those targeting a common gene may b e tagging the same causal v arian t. W e remov ed redundan t eQTLs b y the follo wing forward selection pro cedure. F or each gene, w e ordered its link ed eQTLs by increasing NRR v alues ν ( ¯ q ) ij and pro ceeded o ver the ranked eQTLs to test the conditional indep endence of the gene and the eQTL, given the eQTLs o ccurring b efore in the ranking using again the exact test describ ed in the Metho ds section. An eQTL asso ciation w as retained if the test was rejected at p < 0 . 05 and the selection procedure stopp ed whenev er p > 0 . 05 to contin ue on the next gene. The genetic connected comp onents w ere substan tially pruned and the v ast ma jority of genes (402/450) were left with just one eQTL, 46 genes with tw o, and only tw o had 27 Figure 5 Va riance explained in the eQTL netw ork. (A) Distribution of the p ercentage of gene expression va riance explained by eQTLs. The cumulative p ercentage of genes is rep orted on top of each bar. (B) Scatter plot of the na rro w-sense heritability h 2 as function of the p ercentage of va riance explained by eQTLs. The diagonal line is drawn at values where this p ercentage equals h 2 , and it is only shown as a visual guide. Op en circles correspond to genes with exclusively eQTL asso ciations while solid ones indicate also the presence of at least one asso ciation with other gene. The legend contains the color key for the degree of asso ciation in the netw ork. (C) Percentage of variance explained by eQTLs as function of the degree of asso ciation with other genes in the netw ork. The legend sp ecifies the color key fo r the average distance from the transcription sta rt site (TSS) of the gene to its eQTLs. 3 eQTLs. This final eQTL netw ork comprised 500 eQTLs and 1,391 genes, the v ast ma jority of them (941) forming gene-gene asso ciations without any eQTL. Hub genes ha v e tr ans- acting eQTLs with large genetic effects: F or eac h of the 450 genes ha ving at least one eQTL, w e calculated the p ercentage of v ariance explained b y eQTLs using Eq. (31). The distribution of resulting v alues is shown in Fig. 5A. Ab out 70% of the genes had eQTLs explaining 50% or less of their expression v ariabilit y , and only in ab out 10% of them their eQTLs explained > 70%. Using a metho d based on linear mixed modeling and exploiting the relatedness matrix built from all pairs of segregan ts ( Lee et al. 2011; Bloom et al. 2013) we estimated the narro w-sense heritability h 2 for these 450 genes and compared it against the p ercentage of v ariance explained b y the eQTLs (Fig. 5B). Setting the p ercentage explained to the exp ected maximum h 2 when the former was larger, the fraction of missing heritabilit y ranges from 0% to 62%. This figure also shows that the connectivity degree to other genes correlates p ositively with both, h 2 and p ercentage of v ariance explained. In fact, as Figure 5C sho ws, there are 24 genes connected to 9 or more other genes, for which all their eQTLs explain 68% or more of their expression v ariability . In terestingly , this figure also rev eals that half of them hav e a tr ans -acting eQTL lo cated in a different c hromosome. In fact, these particular tr ans -eQTLs map all of them to chromosomes I I and I I I (T able 2). Concretely , the eQTL of gene SCW11 is lo cated in p osition 553,857 of chromosome I I, 2.6Kb a w ay from the AMN1 gene. This gene carries a loss-of-function mutation in the BY strain ( Yver t et al. 2003) affecting the expression of daughter-cell-specific genes. 28 The eQTLs in chromosome I I I map to the MA T and LEU2 lo ci, the latter b eing one of the engineered deletions in the BY strain. T able 2 Hub genes connected to 9 or more other genes in the eQTL netw ork. The column “P athw a y” sp ecifies the p rima ry pathwa y or molecular process in which the gene is involved, where (*) indicates that the gene has unknown function and its pathwa y has b een predicted using the eQTL netw ork. The column “Lo cation” rep orts the chromosomes where the gene’s eQTLs a re lo cated. When b oth gene and eQTLs are in the same chromosome, the column distance rep orts the average distance b etw een them. Columns h 2 and η 2 rep o rt, resp ectively , the na rrow-sense heritability and the fraction of variance explained by the eQTL. The column “Deg.” (degree) gives the numb er of associated genes in the netw ork. Gene Chr P athw ay Lo cation Distance h 2 η 2 Deg. STE2 VI Mating reg. I I I NA 0.89 0.83 23 YKL177W XI Mating reg. I I I NA 0.77 0.78 21 STE3 XI Mating reg. I I I NA 0.90 0.84 21 BAR1 IX Mating reg. I I I NA 0.83 0.82 20 MF(ALPHA)1 XVI Mating reg. I I I NA 0.84 0.82 20 STE6 XI Mating reg. I I I NA 0.95 0.90 19 AFB1 XII Mating reg. I I I NA 0.93 0.86 19 HMLALPHA2 I I I Mating reg. I I I 188156 0.55 0.70 18 MA T ALPHA1 I I I Mating reg. I I I 732 0.98 0.85 18 HMLALPHA1 I I I Mating reg. I I I 187892 0.84 0.82 17 YCL065W I I I Mating reg. (*) I I I 187423 0.94 0.78 15 YCR041W I I I Mating reg. (*) I I I 263 0.68 0.70 15 MA T ALPHA2 I I I Mating reg. I I I 996 0.63 0.73 14 ASP3-3 XI I Nitr. starv ation XI I 14538 0.98 0.88 14 ASP3-1 XI I Nitr. starv ation XI I 10806 1.00 0.89 13 ASP3-2 XI I Nitr. starv ation XI I 5046 0.94 0.84 13 LEU1 VI I Leu biosynthesis I I I NA 0.93 0.76 12 YCR097W-A II I Mating reg. (*) I I I 105944 0.75 0.83 11 HMRA1 I I I Mating reg. I I I 88278 0.63 0.80 10 BA T1 VI I I Leu biosynthesis I I I NA 0.83 0.68 10 O AC1 XI Leu biosynthesis II I NA 0.90 0.68 10 ASP3-4 XI I Nitr. starv ation XI I 18190 0.98 0.85 10 SCW11 VI I Daugh. cell sep. I I NA 0.86 0.80 9 MF A2 XIV Mating reg. I I I NA 0.84 0.78 9 Genes YCL065W , YCR041W and YCR097W-A in T able 2 hav e currently unkno wn function. Ho wev er, a Gene Ontology (GO) enric hmen t analysis on each subset of genes connected to them in the eQTL netw ork show ed that they are p oten tially in volv ed in mating-sp ecific regulatory pro cesses (Holm’s FWER < 0 . 05). Therefore, these highly-connected genes, sho wn in T able 2, are in volv ed in regulatory pro cesses related to mating-sp ecific expression, reacting up on nitrogen starv ation, par- ticipation in the leucine biosynthesis path wa y and daughter cell separation. These are fundamen tal pathw a ys for yeast gro wth and render these results consistent with previ- ous evidence from yeast genetic interaction net works deriv ed from double-m utant screens 29 ( Cost anzo et al. 2010), where highly-connected genes were inv olv ed in primary cellular functions ( Bar yshnik o v a et al. 2013). Differen tial genetic control of gene expression across c hromosomes: W e also in vestigated how genetic v ariation affects gene expression differently across the yeast chro- mosomes. F or this purp ose, we pro duced hiv e plots ( Krzywinski et al. 2012) shown in Figure 6, using the R/CRAN pack age Hiv eR ( Hanson 2014). A first observ ation is that eQTLs o ccurring within the same chromosome (edges betw een the markers axis and genes axis of the same chromosome) mostly lead to concentric edges, p ointing to cis -regulatory mec hanisms acting at differen t distances. A remark able exception is chromosome I I I where many of those edges cross through each other. This c hromosome is also distinctiv e in that it has a lo wer density of cis -acting eQTLs than the rest of the genome. Figure 6 eQTL netw ork of a yeast cross. Hive plots of an eQTL netw ork estimated from a yeast cross, involving only connected comp onents with at least one eQTL asso ciation. F o r each chromosome, the hive plot sho ws three axes, where mark ers and genes are ordered from the center acco rding to their genomic location. V ertical and left axes represent the chromosome in the corresponding plot, while the right axis represents the entire yeast genome alternating black and gray along consecutive chromosomes. Edges b etw een genes axes correspond to gene-gene asso ciations. Edges where at least one of their endp oints corresponds to a transcription facto r or RNA-binding coding gene, are highlighted in orange and blue, resp ectively . 30 Bet ween 81Kb and 92Kb from the b eginning of chromosome I I I there is a cis -acting eQTL on genes LEU2 and NFS1 . This eQTL is also tr ans -asso ciated with genes BA T1 , O AC1 , LEU1 and BAP2 lo cated in different c hromosomes and inv olv ed in the leucine biosyn thesis pathw a y . According to the UCSC Genome Bro wser ( http://genome.ucsc. edu ) they all hav e upstream a binding site of LEU3 , a ma jor regulatory switc h in this path wa y . The engineered deletion of LEU2 affects LEU3 in a feedback lo op and this w ould lead to expression changes in its targets ( Chin et al. 2008). Do wnstream, at ab out 200Kb of the b eginning of chromosome I I I, w e find the MA T lo cus whose genetic comp osition determines the mating type of yeast. This eQTL is cis -asso ciated with the gene MA T ALPHA1 which is expressed in haploids of the alpha mating t yp e and which has b een previously rep orted as a candidate regulator of the rest of genes asso ciated with this lo cus ( Yver t et al. 2003; Cur tis et al. 2013). This lo cus is tr ans -asso ciated with tw o other genes in the same c hromosome ( HMLALPHA1 , HMRA1 ) and to a set of genes distributed throughout the genome ( STE2 , STE3 , STE6 , AFB1 , BAR1 , MF(ALPHA)1 , MF A2 ) which are all inv olv ed in the regulation of mating-type sp ecific transcription. In chromosome V, around the lo cus of URA3 w e find a cis -acting eQTL which has a tr ans -acting effect on URA1 (chrom. XI) and URA4 (chrom. XI I), the three of them taking part in the biosyn thesis of p yrimidines ( Yver t et al. 2003; Cur tis et al. 2013). As it can b e easily seen from Figure 6, and consisten t with previous observ ations ( Yver t et al. 2003), few of the eQTLs affect directly transcription factors, such as the ARR1 gene in c hromosome XI, or RNA-binding proteins, such as NOP8 in chromosome V. The edges b et ween the genes axes, corresp ond to gene-gene asso ciations from the cor- resp onding chromosome to the rest of the genome and where at least one of the genes has an eQTL. This is a fraction (503) of a total of 1,799 gene-gene asso ciations on the entire eQTL netw ork, more directly affected by the genetic control of gene expression. W e ob- serv ed a systematic pattern of association b etw een genes from the same chromosome (see, e.g., chrom. XVI). Replacing the axis displa ying genes from all chromosomes b y another gene axis again of the same chromosome (data not shown) reveals that a fraction of the gene-gene asso ciations in whic h one of the genes has a cis -acting eQTL, o ccur b etw een genes close to each other on the c hromosome. It ma y b e p ossible that inherited co expres- sion segregates due to link age disequilibrium and/or that tandem gene duplication even ts render genes close to eac h other b eing co expressed. Using the strategies introduced in this pap er further, such as conditioning these asso ciations on nearb y genes, may help to elucidate what fraction of them are of genetic, molecular or ev olutionary origin. 31 DISCUSSION Gene expression is a high-dimensional m ultiv ariate trait whose v ariability is the result of genetic, molecular and environmen tal p erturbations, and often different kinds of con- founding effects. Dissecting the comp onents of this v ariability and b eing able to adjust for some of them is a ma jor goal in ev ery study using genetical genomics data. Here we ha ve used a class of statistical mo dels with a graphical interpretation, mixed GMMs, to approac h this c hallenge from a multiv ariate p ersp ective. Using simulations we hav e shown that genetic effects can propagate prop ortionally to the marginal correlation b et ween the genes, and that this effect may b e amplified under selection bias (Fig. 1), underscoring the need to adjust for indirect asso ciations. Using standard linear theory and basic principles from mixed GMMs, w e ha ve deriv ed the parameters, in terms of a mixed GMM, for an exact likelihoo d-ratio test (LR T) on data from conditional Gaussian distributions that accommo date b oth linear and inter- action effects b et ween genetic v arian ts and contin uous gene-expression profiles. Higher- order conditioning on mixed data unlo cks a num b er of strategies that one ma y follow to disen tangle direct and indirect effects in genetical genomics exp erimen ts. W e exploited it b y using marginal distributions and q -order correlation graphs. W e show ed that this ap- proac h allo ws one to adjust for confounding effects (Fig. 2), increases our p ow er to identify cis -acting eQTLs (Fig. 3) and direct regulatory relationships (Fig. 4), and help ed compar- ing the genetic con trol of gene expression b et ween chromosomes (Fig. 6) and throughout the gene netw ork (Fig. 5). In particular, w e could see that the degree of connections of eac h eQTL gene to other genes in the eQTL net work correlated p ositively with b oth, narro w-sense heritability and fraction of v ariance explained by eQTLs (Fig. 5). An im- p ortan t fraction of large genetic effects w ere in fact due to tr ans -acting eQTLs from those genes with more connections. Using those connections we could predict p oten tial path- w ays inv olving three such h ub genes of unkno wn function. Genetical genomics data from large exp erimental crosses are b ecoming increasingly a v ailable to the communit y . W e b e- liev e that mixed GMMs can play a crucial role in harnessing these data to explore linear and in teracting eQTL asso ciations of arbitrary order and adv ance our understanding of the genetic con trol of gene expression. A CKNOWLEDGMENTS This work has b een supp orted by a grant from the Spanish Ministry of Economy and Comp etitiv eness to R.C. (ref. TIN2011-22826). W e thank M.M. Alb` a, D.R. Cox, M. F rancesconi, S.L. Lauritzen, B. Lehner and N. W ermuth for helpful discussions on differ- en t parts of this pap er, and the tw o anon ymous reviewers for their v aluable comments 32 that hav e improv ed this pap er. W e thank R. Brem for kindly providing raw expression data files from the y east data set analyzed in this pap er. LITERA TURE CITED Bar yshnik o v a, A. , M. Cost anzo , C. L. Myers , B. Andrews , and C. Boone , 2013 Genetic interaction netw orks: T o ward an understanding of heritabilit y . Ann u Rev Genom Hum G 14 : 111–133. Bing, N. , and I. Hoeschele , 2005 Genetical genomics analysis of a yeast segregan t p opulation for transcription net w ork inference. Genetics 170 : 533–42. Bloom, J. S. , I. M. Ehrenreich , W. T. Loo , T.-L. V. Lite , and L. Krugl y ak , 2013 Finding the sources of missing heritability in a y east cross. Nature 494 : 234–237. Breitling, R. , Y. Li , B. M. Tesson , J. Fu , C. Wu , et al. , 2008 Genetical genomics: sp otligh t on QTL hotsp ots. PLoS Genet 4 : e1000232. Brem, R. B. , and L. Krugl y ak , 2005 The landscap e of genetic complexit y across 5,700 gene expression traits in y east. P Natl Acad Sci USA 102 : 1572–7. Brem, R. B. , G. Yver t , R. Clinton , and L. Krugl y ak , 2002 Genetic dissection of transcriptional regulation in budding y east. Science 296 : 752–755. Br oman, K. W. , and S. Sen , 2009 A guide to QTL mapping with R/qtl . Springer. Br oman, K. W. , H. Wu , S. Sen , and G. A. Churchill , 2003 R/qtl: QTL mapping in exp erimen tal crosses. Bioinformatics 19 : 889–890. Castelo, R. , and A. Ro vera to , 2006 A robust pro cedure for Gaussian graphical mo del searc h from microarray data with p larger than n. J Mach Learn Res 7 : 2621–50. Castelo, R. , and A. R overa to , 2009 Reverse engineering molecular regulatory net- w orks from microarray data with qp-graphs. J Comput Biol 16 : 213–227. Chaibub Neto, E. , A. T. Broman , M. P. Keller , A. D. A ttie , B. Zhang , et al. , 2013 Mo deling causalit y for pairs of phenot yp es in systems genetics. Genetics 193 : 1003–1013. Chaibub Neto, E. , C. T. Ferrara , A. D. A ttie , and B. S. Y andell , 2008 Inferring causal phenot yp e net works from segregating p opulations. Genetics 179 : 1089–100. Chaibub Neto, E. , M. P. Keller , A. D. A ttie , and B. S. Y andell , 2010 Causal graphical mo dels in systems genetics: a unified framework for joint inference of causal net work and genetic architecture for correlated phenot yp es. Ann Appl Stat 4 : 320–339. Chen, L. S. , F. Emmer t-Streib , and J. D. Storey , 2007 Harnessing naturally randomized transcription to infer regulatory relationships among genes. Genome Biol 8 : R219. 33 Cheung, V. G. , and R. S. Spielman , 2009 Genetics of human gene expression: map- ping DNA v ariants that influence gene expression. Nat Rev Genet 10 : 595–604. Chin, C.-S. , V. Chubuko v , E. R. Joll y , J. DeRisi , and H. Li , 2008 Dynamics and design principles of a basic regulatory arc hitecture controlling metab olic path wa ys. PLoS Biol 6 : e146. Chun, H. , and S. Keles ¸ , 2009 Expression quantitativ e trait lo ci mapping with m ulti- v ariate sparse partial least squares regression. Genetics 182 : 79–90. Cost anzo, M. , A. Bar yshniko v a , J. Bella y , Y. Kim , E. D. Spear , et al. , 2010 The genetic landscap e of a cell. Science 327 : 425–431. Cur tis, R. E. , S. Kim , J. L. W oolf ord Jr , W. Xu , and E. P. Xing , 2013 Structured asso ciation analysis leads to insight into Saccharom yces cerevisiae gene regulation by finding m ultiple contributing eQTL hotsp ots asso ciated with functional gene mo dules. BMC Genomics 14 : 1–17. Didelez, V. , and D. Edw ards , 2004 Collapsibility of graphical cg-regression mo dels. Scand J Stat 31 : 535–551. Ed w ards, D. , 2000 Intr o duction to gr aphic al mo del ling . Springer. Ed w ards, D. , G. C. G. de Abreu , and R. Labouriau , 2010 Selecting high- dimensional mixed graphical mo dels using minimal aic or bic forests. BMC Bioin- formatics 11 : 18. Gr one, R. , C. Johnson , E. S ´ a , and H. W olko wicz , 1984 Positiv e definite comple- tions of partial Hermitian matrices. Linear Algebra Appl 58 : 109–124. Hanson, B. A. , 2014 HiveR: 2D and 3D Hive plots for R . R/CRAN pkg. v er. 0.2-27. Hastie, T. , R. Tibshirani , and J. Friedman , 2009 The elements of statistic al le arn- ing . Springer. Hughes, T. R. , M. J. Mar ton , A. R. Jones , C. J. R ober ts , R. Stoughton , et al. , 2000 F unctional discov ery via a comp endium of expression profiles. Cell 102 : 109–126. Jansen, R. C. , and J.-P. Nap , 2001 Genetical genomics: the added v alue from segre- gation. T rends Genet 17 : 388–390. Kalisch, M. , and P. B ¨ uhlmann , 2007 Estimating high-dimensional directed acyclic graphs with the p c-algorithm. J Mac h Learn Res 8 : 613–636. Kang, E. Y. , C. Ye , I. Shpitser , and E. Eskin , 2010 Detecting the presence and absence of causal relationships betw een expression of yeast genes with v ery few samples. J Comput Biol 17 : 533–46. Kang, H. M. , C. Ye , and E. Eskin , 2008 Accurate disco very of expression quantitativ e trait lo ci under confounding from spurious and gen uine regulatory hotsp ots. Genetics 180 : 1909–25. 34 Kendziorski, C. , M. Chen , M. Yuan , H. Lan , and A. A ttie , 2006 Statistical metho ds for expression quantitativ e trait lo ci (eQTL) mapping. Biometrics 62 : 19–27. Kim, S. , and E. P. Xing , 2009 Statistical estimation of correlated genome asso ciations to a quan titative trait netw ork. PLoS Genet 5 : e1000587. Krzywinski, M. , I. Birol , S. J. Jones , and M. A. Marra , 2012 Hive plots–rational approac h to visualizing netw orks. Brief Bioinform 13 : 627–644. La uritzen, S. , 1996 Gr aphic al Mo dels . Oxford Univ ersit y Press. La uritzen, S. , and N. Wermuth , 1989 Graphical mo dels for asso ciations b et ween v ariables, some of which are qualitative and some quan titative. Ann Stat 17 : 31–57. Lee, S. H. , N. R. Wra y , M. E. Goddard , and P. M. Visscher , 2011 Estimating missing heritability for disease from genome-wide association studies. Am J Hum Genet 88 : 294–305. Leek, J. T. , R. B. Scharpf , H. C. Bra v o , D. Simcha , B. Langmead , et al. , 2010 T ackling the widespread and critical impact of batch effects in high-throughput data. Nat Rev Genet 11 : 733–739. Leek, J. T. , and J. D. Storey , 2007 Capturing heterogeneity in gene expression studies b y surrogate v ariable analysis. PLoS Genet 3 : e161. Li, Q. , K. R. Peterson , X. F ang , and G. St ama to y annopoulos , 2002 Lo cus con trol regions. Blo o d 100 : 3077–3086. Listgar ten, J. , C. Kadie , and D. Heckerman , 2010 Correction for hidden con- founders in the genetic analysis of gene expression. P Natl Acad Sci USA 107 : 16465– 16470. Liu, B. , A. de la Fuente , and I. Hoeschele , 2008 Gene net work inference via structural equation mo deling in genetical genomics exp eriments. Genetics 178 : 1763– 76. Michaelson, J. J. , R. Alber ts , K. Schughar t , and A. Beyer , 2010 Data-driven assessmen t of eQTL mapping metho ds. BMC genomics 11 : 502. Montgomer y, S. B. , M. Sammeth , M. Gutierrez-Arcelus , R. P. Lach , C. In- gle , et al. , 2010 T ranscriptome genetics using second generation sequencing in a cau- casian p opulation. Nature 464 : 773–777. P ar ts, L. , O. Stegle , J. Winn , and R. Durbin , 2011 Joint genetic analysis of gene expression data with inferred cellular phenot yp es. PLoS Genet 7 : e1001276. Petretto, E. , J. Mangion , N. J. Dickens , S. A. Cook , M. K. Kumaran , et al. , 2006 Heritability and tissue sp ecificity of expression quantitativ e trait lo ci. PLoS Genet 2 : e172. Ra o, C. , 1973 Line ar Statistic al Infer enc e and Its Applic ations . John Wiley & Sons. Ritchie, M. E. , J. Sil ver , A. Oshlack , M. Holmes , D. Diy agama , et al. , 2007 35 A comparison of background correction metho ds for t wo-colour microarra ys. Bioinfor- matics 23 : 2700–2707. R ockman, M. V. , 2008 Rev erse engineering the genotype–phenotype map with natural genetic v ariation. Nature 456 : 738–744. R ockman, M. V. , and L. Krugl y ak , 2006 Genetics of global gene expression. Nat Rev Genet 7 : 862–872. R overa to, A. , 2002 Hyp er in verse Wishart distribution for non-decomp osable graphs and its application to Bay esian inference for Gaussian graphical mo dels. Scand J Stat 29 : 391–411. Schadt, E. E. , S. A. Monks , T. A. Drake , A. J. Lusis , N. Che , et al. , 2003 Genetics of gene expression surv eyed in maize, mouse and man. Nature 422 : 297–302. Seber, G. , 2007 A matrix handb o ok for statisticians . Wiley-Interscience. Smyth, G. K. , and T. Speed , 2003 Normalization of cDNA microarray data. Metho ds 31 : 265–273. Stegle, O. , L. P ar ts , R. Durbin , and J. Winn , 2010 A Ba yesian framework to ac- coun t for complex non-genetic factors in gene expression levels greatly increases p ow er in eQTL studies. PLoS Comp Biol 6 : e1000770. Teixeira, M. C. , P. T. Monteiro , J. F. Guerreiro , J. P. Gonc ¸ al ves , N. P. Mira , et al. , 2014 The YEASTRA CT database: an upgraded information system for the analysis of gene and genomic transcription regulation in Saccharom yces cerevisiae. Nucleic Acids Res 42 : D161–D166. Tesson, B. M. , and R. C. Jansen , 2009 eQTL analysis in mice and rats. In Car dio- vascular Genomics , volume 573 of Metho ds in Mole cular Biolo gy . Springer, 285–309. Westra, H.-J. , M. J. Peters , T. Esko , H. Y a ghootkar , C. Schurmann , et al. , 2013 Systematic identification of trans eQTLs as putative drivers of known disease asso ciations. Nat Genet 45 : 1238–1243. Yver t, G. , R. B. Brem , J. Whittle , J. M. Akey , E. F oss , et al. , 2003 T rans-acting regulatory v ariation in Sacc harom yces cerevisiae and the role of transcription factors. Nat Genet 35 : 57–64. Zhu, J. , P. Y. Lum , J. La mb , D. GuhaThakur t a , S. W. Edw ards , et al. , 2004 An in tegrative genomics approach to the reconstruction of gene netw orks in segregating p opulations. Cytogenet Genome Res 105 : 363–74. Zhu, J. , B. Zhang , E. N. Smith , B. Drees , R. B. Brem , et al. , 2008 Integrat- ing large-scale functional genomic data to dissect the complexity of yeast regulatory net works. Nat Genet 40 : 854–861. 36
Original Paper
Loading high-quality paper...
Comments & Academic Discussion
Loading comments...
Leave a Comment