Measuring Influence in Twitter Ecosystems using a Counting Process Modeling Framework
Data extracted from social media platforms, such as Twitter, are both large in scale and complex in nature, since they contain both unstructured text, as well as structured data, such as time stamps and interactions between users. A key question for …
Authors: Donggeng Xia, Shawn Mankad, George Michailidis
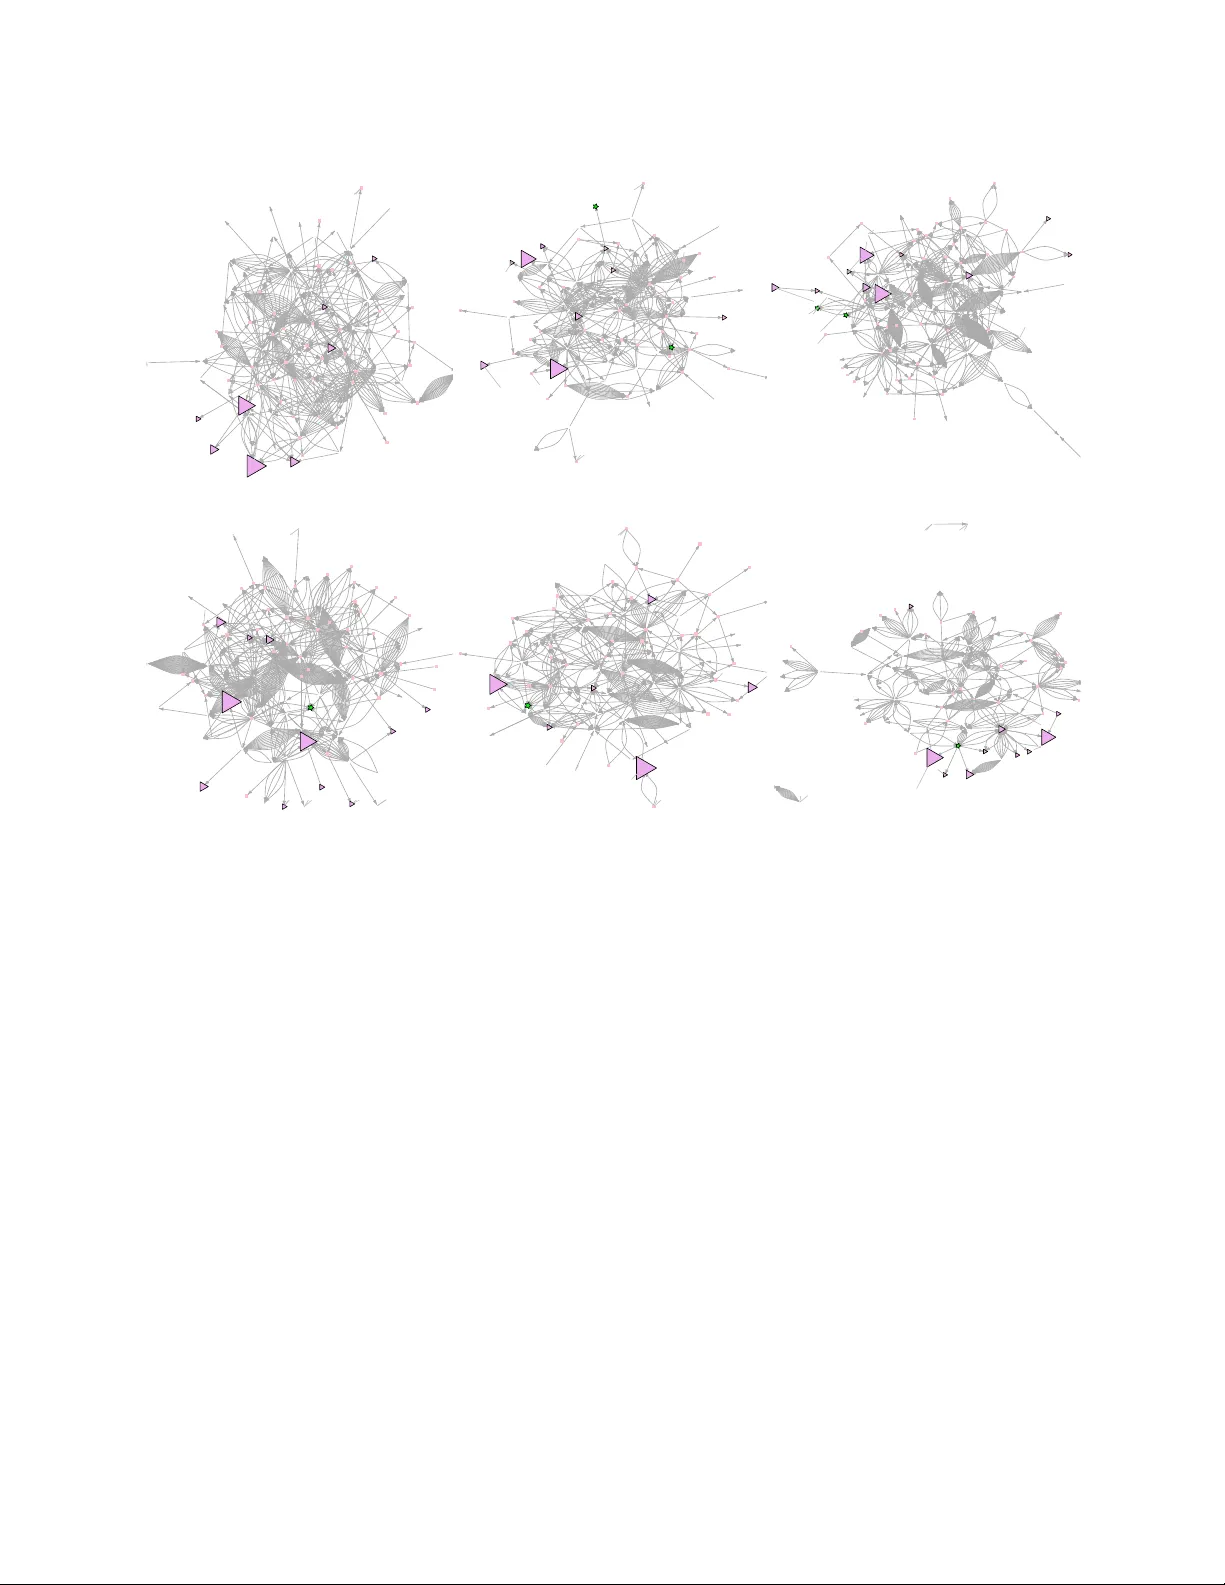
Measuring Influence in Twitter Ecosystems using a Coun ting Pro ccess Mo deling F ramew ork Donggeng Xia ∗ 1 , Sha wn Mankad ∗ 2 , and George Michailidis 1 1 Dep artment of Statistics, University of Michigan 2 Dep artment of De cision, Op er ations & Information T e chnolo gies, University of Maryland Abstract Data extracted from so cial media platforms, suc h as Twitter, are both large in scale and complex in nature, since they con tain b oth unstructured text, as well as structured data, suc h as time stamps and in teractions b et ween users. A k ey question for such platforms is to determine influen tial users, in the sense that they generate interactions betw een members of the platform. Common mea- sures used b oth in the academic literature and b y companies that pro vide analytics services are v arian ts of the p opular w eb-search PageRank algorithm applied to netw orks that capture connec- tions betw een users. In this w ork, w e dev elop a mo deling framew ork using multiv ariate interacting coun ting pro cesses to capture the detailed actions that users undertake on suc h platforms, namely p osting original con tent, reposting and/or mentioning other users’ postings. Based on the proposed mo del, we also derive a no v el influence measure. W e discuss estimation of the mo del parameters through maximum likelihoo d and establish their asymptotic prop erties. The prop osed mo del and the accompan ying influence measure are illustrated on a data set co v ering a fiv e year p erio d of the Twitter actions of the members of the US Senate, as well as mainstream news organizations and media p ersonalities. ∗ Authors con tributed equally to this work 1 1. INTR ODUCTION Leading business and non-profit organizations are in tegrating growing v olumes of increasingly com- plex structur e d and unstructur e d data to create big data ecosystems for con ten t distribution, as well as to gain insigh ts for decision making. A recent, substantial area of gro wth has b een online review and so cial media platforms, whic h hav e fundamen tally altered the public discourse b y providing easy to use forums for the distribution and exchange of news, ideas and opinions. The fo cus in div erse areas, including marketing, business analytics and so cial netw ork analysis, is to identify trends and extract patterns in the v ast amoun t of data pro duced b y these platforms, so that more careful targeting of con tent distribution, propagation of ideas, opinions and products, as w ell as resource optimization is achiev ed. One platform that has become of cen tral imp ortance to both business and non-profit en terprises is Twitter. According to its second quarter 2014 financial results announcement, Twitter had more than half a billion users in July 2014, out of whic h more than 271 million were activ e ones (Twitter, 2014). Although Twitter lags b ehind in terms of active users to F aceb o ok, it is nev ertheless p er- ceiv ed by most businesses and non-profit organizations as an in tegral part of their digital presence (Bulearca and Bulearca, 2010). The mec hanics of Twitter are as follo ws: the basic communication unit is the accoun t. The platform allows account users to p ost messages of at most 140 c haracters, and thus has b een describ ed as the Short Message Service (SMS) of the Internet. As of mid-2014, ov er half a billion messages w ere p osted on a daily basis. F urther, Twitter allows accoun ts to “follo w” other accoun ts, whic h means the follow er receiv es notification whenever the follo wed account p osts a new message. Th us, the follo w-follow er relations serv e as a primary c hannel for con ten t to spread within the social net working platform. Accounts tend to in teract with each other o ver these c hannels in tw o directed w ays. First, an accoun t can c opy or r ebr o adc ast another accoun t’s t weet, whic h is referred to as a “ret weeting”. Second, an accoun t can mention another account within a t weet by referring to their account name with the @ symbol as a prefix. These t wo actions, retw eeting and mentioning, are directed resp onses from one account to another and th us, provide the mec hanisms for online con versation. The mechanics of Twitter, together with the original messages generated by users, give rise to 1 ric h Big Data. Sp ecifically , the con tent of the message, together with easily searc hable key terms or topics that use the # symbol as a prefix, constitute a large corpus of unstructured text. The hash tag function enables searc hes to iden tify emerging themes and topics of discussion. In 2014, more than 2.1 billion searc h queries were generated (Twitter, 2014). F urther, the follo wing built-in capabilit y , creates a net work for p otential information flow and dissemination , while the ret weeting and mentioning actions create subnetw orks of actual inter actions b etw een user accounts. A k ey problem in all social net working platforms is that of iden tifying user influenc e , since suc h users are capable of driving action (e.g. steer discussions to particular themes and topics) or prov oking interactions amongst other users. F urther, users exhibiting high influence are also p oten tially more v aluable to businesses (T rusov et al., 2010). The ranking of Twitter users based on their influence constitutes b oth an activ e researc h topic and a business opp ortunit y , as manifested b y services suc h as Klout (Klout, 2014) and PeerIndex (PeerIndex, 2014) that market and sell to businesses and other organizations influence scoring metrics. The most standard metric employ ed is the num b er of follo wers an account has. Ho wev er, a num b er of studies (Cha et al., 2010; W eng et al., 2010) ha ve concluded that it is not a go od indicator, since most follow ers fail to engage with the messages that ha ve b een broadcast. F or that reason, the n umber of retw eets an accoun t receiv es (Kw ak et al., 2010) is a better measure of influence. Since w e are in terested in ranking of users, more sophisticated influence measures based on the p opular PageRank (Page et al., 1999) and HITS (Klein b erg, 1999) ranking algorithms, widely used for ranking search results on the W eb, hav e b een used (Kwak et al., 2010; Ga y o-Avello et al., 2011). Ho wev er, these algorithms ha v e b een applied to the follo w ers netw ork. The latter clearly captures the p opularit y of users, but not necessarily of their influence. F or example, the top tw en ty most follow ed accoun ts with a minim um of 25 million follo wers comprise of entertainers and athletes, the sole exception b eing President Obama. In this pap er, we prop ose to measure an account/user’s influence on the Twitter so cial media platform, by taking into consideration b oth their ability to pro duce new conten t b y p osting mes- sages, but also to generate interactions from other accoun ts through ret w eeting and men tioning. T o that end, we build a statistical mo del for an account’s actions and interactions with other ac- coun ts. It uses a coun ting pro cess framew ork to capture the p osting, ret w eeting and mentioning actions. In addition, based on this mo del w e in tro duce a nov el influenc e me asur e that lev erages 2 Coons W ashingtonPost Udall [CO] W yden W arner NYTimes Alexander cspan SeanHannity FoxNews A yotte Pryor Crapo Cruz Obama Cardin Leahy Heitkamp Thune Kirk Corker Graham Menedez Carper Shaheen Bennet Franken Heller Blunt Gillibrand Harkin Boxer Boozman Lee Durbin Rockefeller Schumer Shelby Reid Kaine Coburn 2011−09−26 Murkowski W yden Corker ft Landrieu V itter cspan Reid Graham SeanHannity W arner Booker Crapo Risch Murray Sanders Rubio Mikulski Collins Boxer Gillibrand Carper Hagan Bennet Shaheen McCain Markey Coats Paul Heller Flake Pryor A yotte WhiteHouse Schumer McCaskill T oomey W ashingtonPost 2012−09−03 ● ● ● ● ● ● ● ● ● ● ● ● ● ● ● ● ● ● ● ● ● ● ● ● ● ● ● ● ● ● ● ● ● ● ● ● ● ● ● ● ● ● ● ● ● ● ● ● ● ● ● 2013−01−28 ● ● ● ● ● ● ● ● ● ● ● ● ● ● ● ● ● ● ● ● ● ● ● ● ● ● ● ● ● ● ● ● ● ● ● ● ● ● ● ● ● ● ● ● ● ● ● ● ● 2014−06−02 Figure 1: W eekly Twitter (men tions and ret w eet) netw ork statistic time-series and drawings. The no des (Twitter accounts) con tain demo cratic senators (blue circles), republican senators (red squares), media (purple triangles), and gov ernmen t agencies (green stars). b oth the follow er netw ork (that captures the potential for p osted messages to generate in teractions with other users) and the intensity o ver time of the basic actions in v olved (p osting, retw eeting and men tioning). Hence, underlying the mo del in this pap er is the idea that con v ersations, and in particular the rate of directed activit y , b et ween accoun ts reveal their real-world p osition and influence. W e illustrate the mo del on a closely knit comm unity , namely that of the mem b ers of the United States Senate, the upp er legislative house in the bicameral legislativ e b ody for the United States. Tw o senators are demo cratically elected to represen t eac h state for six y ear terms. W e further augmen t the set of Twitter accoun ts analyzed by including selected prominen t news organizations (e.g. Financial Times, W ashington P ost, CNN), as w ell as p opular bloggers (e.g. Nate Silver, Ezra Klein), the accoun ts of President Obama and the White House, and t w o influential federal agencies (the US Arm y and the F ederal Reserve Board); for details refer to Section 6. The ret weeting and men tions in teractions from our data are drawn as directed edges in Fig- ure 1. Giv en this sequence of netw ork snapshots, we identify particular senators and news agencies that tend to elicit in teractions from other accoun ts (i.e., hav e man y incoming edges relativ e to 3 ho w often they t weet), th us revealing their influence on Twitter. Our results further indicate 6 that the proposed approach produces influence measures for the U.S. Senators that correspond more closely with their legislativ e imp ortance than purely netw ork-based solutions based on the P ageRank algorithm. The remainder of the pap er is organized as follo ws: in Section 2, w e introduce the modeling framew ork and the proposed influence measure. Section 3 presen ts the algorithm to obtain the mo del parameter estimates, as well as establish their statistical properties and those of the influence measure. The performance of the mo del is ev aluated on synthetic data sets in Section 4, while the US Senate application is presen ted in Section 5. Finally , some concluding remarks are drawn in Section 6. 2. THE MODEL AND THE INFLUENCE MEASURE W e start our presen tation b y defining some k ey quan tities for future dev elopments. Let G = ( V , L ) denote the follow ers netw ork, where V corresp onds to the set of no des of all the Twitter accounts under consideration and L = { L i,j , 1 ≤ i 6 = j ≤ n } the edge set b et w een them and captures whether an accoun t foillo ws another accoun t.. Note that the netw ork is bidirectional in nature and not necessarily symmetric, since account i may follow accoun t j , but not vice versa. In principle, L can b e dynamically ev olving, but in this work w e consider L to b e static and not c hanging ov er time. As explained in the introductory Section, in the Twitter platform, accounts (no des) can undertak e the follo wing three actions: p ost a new message, ret weet a message posted by another accoun t that they follow and finally mention another account that they follow. F urther, the v ast ma jority of messages posted, ret weeted or men tioned hav e k ey terms (wth a ] prefix) that iden tify the topic(s) that are b een discussed. Next, we define the following tw o key counting pro cesses. Let N j ( t ) denote the total num b er of ret weets and men tions that accoun t j generates on topic l b y time t and by A j ( t, l ) the total n umber of p osted messages b y account j on topic l by time t . Define α j to b e a parameter that captures the long-term capabilit y of accoun t j to generate resp onses by other accoun ts from the con tent p osted, and β j a parameter that captures the long term susceptibility of accoun t j to resp ond (retw eet/men tion) to the p ostings of the accounts it follows. W e mo del { N j ( t, l ) } n i =1 as a 4 set of counting pro cesses through their hazard rates, using a version of Co x (Andersen and Gill, 1982) prop ortional hazard mo del; sp ecifically , the hazard rate λ j,l ( t ) of pro cess N j ( t, l ) is given b y λ j,l ( t ) = λ 0 ,l ( t ) exp X i 6 = j L ij ( α i + β j ) log( M i ( t, l ) + 1) , (1) where M j ( t, l ) = A j ( t, l ) + N j ( t, l ) the total num b er of p osting, retw eets and men tions for account j on topic l by time t . W e assume that the parameters α i , β i ∈ ( −∞ , ∞ ), since accoun ts and their users ma y b e p ositiv ely or negatively inclined tow ards other accounts, as w ell as b eing more k een in joining sp ecific con v ersations or passively retw eeting messages from fa vorite accounts. The nonparametric baseline component λ 0 ,l ( t ) is time v arying. In general, w e w ould exp ect this baseline to b e small for large times t , since topics in so cial media platforms hav e a high ch urn rate; they b ecome ”hot” and generate a lot of action ov er short time scales and afte awhile it stops b eing discussed. The mo del p osits that accoun t j in teracts with other accoun ts at a baseline level λ 0 ,l ( t ), mo dulated by its ability to generate resp onses b y accounts in its follow ers net work, as w ell as its o wn susceptibilit y to respond to accoun ts it follo ws postings and rebroadcasting of messages. Note that we mo del the retw eet-men tion pro cess N j ( t, l ), since it reflects interactions b et w een nodes and use the total activity pro cess M j ( t, l ) as a cov ariate. T o com plete the modeling framew ork, denote the set of topics in the data as { 1 , . . . , Γ } . F urther, let T l j = n T l j, 1 , . . . , T l j,n j o , t = 1 , · · · , n j , denote the set of time p oin ts that account j took action (p ost, retw eet, mention) on topic l . Finally , for identificaiton purp oses, we require one member of the parameter v ector Ω = ( α 1 , α 2 , . . . , α n , β 1 , . . . , β n ) to be set to a fixed v alue, and without loss of generailty we set α 1 = 0. F ollowing, (Andersen and Gill, 1982), we emplo y a partial-lik eliho o d function to obtain estimates of Ω. Sp ecificially , w e treat the baseline λ 0 ,l ( t ) as a nuisance parameter and decomp osing the full-likelihoo d to obtain P L = Y 1 ≤ l ≤ Γ Y 1 ≤ j ≤ n Y 1 ≤ k ≤ n j λ j ( T l j,k ) P 1 ≤ i ≤ n λ i ( T l j,k ) Plugging the exact form of the hazard rate from (1) into the partial-lik eliho o d function (PL), we get: P L = Y 1 ≤ l ≤ Γ Y 1 ≤ j ≤ n Y 1 ≤ k ≤ n j exp P i 6 = j L ij ( α i + β j ) log ( M i ( T l j,k , l ) + 1) P 1 ≤ i ≤ n exp P u 6 = i L ui ( α u + β i ) log ( M u ( T l j,k , l ) + 1) (2) 5 2.1 The Influence Measure Lev eraging the structure of the mo del, w e propose to measure an account’s (node) influence as the total hazard rate change it will bring to its follo wers. Specifically , for an account j its hazard rate at time t is giv en b y: H j = exp P k 6 = j log( M k ( t ) + 1) L kj ( α k + β j ) . F urther, the con tribution of no de i is H ( i ) j = exp (log( M i ( t ) + 1) L ij ( α i + β j )). Then, after some algebra we obtain that the total hazard rate change i brings to its follow ers can b e written as: T H ( i ) = X j 6 = i L ij · exp (log ( M i ( t ) + 1)( α i + β j )) . (3) Since M i ( t ) is a random v alue, w e approximate it b y its observ ed av erage v alue, ¯ M i , calculated from the data. Hence, the influence measure b ecomes ˜ T H ( i ) = X j 6 = i L ij · exp log( ¯ M i + 1)( α i + β j ) . (4) Finally , w e express it in a log-scale, so as to linearize the scale and make it compatible with the range of v alues of the resp onse and susceptibility parameters α and β : Ξ ( i ) = log X j 6 = i L ij · exp log( ¯ M i + 1)( α i + β j ) . (5) 3. COMPUT A TION AND INFERENCE Next, w e presen t a Newton-type algorithm for computing the parameter estimates Ω. The ob jectiv e function corresp onds to the logarithm of the partial likelihoo d function (2) given b y LL = log( P L ) = X 1 ≤ l ≤ Γ X 1 ≤ j ≤ n X 1 ≤ k ≤ n j X i 6 = j L ij ( α i + β j ) log ( M i ( T l j,k , l ) + 1) − X 1 ≤ j ≤ n X 1 ≤ k ≤ n j log X 1 ≤ i ≤ n exp X u 6 = i L ui ( α u + β i ) log ( M u ( T l j,k , l ) + 1) (6) Due to its smo othness w e emplo y Newton’s algorithm that uses the gradient and the Hessian of LL . The detailed expressions for the gradient v ector G ≡ ∇ Ω LL and the Hessian H ≡ ∇ Ω ∇ Ω ( LL ) are given in the App endix. 6 Algorithm 1 Estimating the parameters by Newton’s algorithm 1: Initialize the vector Ω v alue b y α 1 = . . . = α n = β 1 . . . = β n = c = 0 2: Define s as a p ositiv e thresholding constant for the minimum step size 3: while t > s do 4: Calculate G b y using (9) and (10) 5: Calculate H by using (11) to (16) 6: Find the optim um p ositiv e τ v alue suc h that Ω − τ · H − 1 G will maximize the log-partial- lik eliho o d (6) 7: Up date Ω ← Ω − τ · H − 1 G . 8: In the up dated Ω, set α 1 = 0. 9: end while 10: return Ω The steps of the optimization are given in Algorithm 1. As stated in the algorithm, s is a p ositiv e constan t to judge the con vergence of the the Newton’s algorithm. The computational complexity of this algorithm is dominated by the computation of H . Denote by m n = max 1 ≤ j ≤ n { n j } . Based on (9) and (10), it costs O (Γ nm n ) op erations to calculate an en try of G . F urther, siince G is of dimension 2 n , it takes O (Γ n 2 m n ) to obtain the entire G vector. Analogously , based on (11) to (16), it costs O (Γ nm n ) operations to calculate an entry of H , if prop er b o ok-k eeping is used on the results obtained for the gradien t G . F urther, since H is of dimension n 2 , it tak es O (Γ n 3 m n ) to obtain the entire H matrix. Hence, the o verall time complexit y for each iteration of the algorithm is of the order O (max { Γ n 3 m n } ). 4. PR OPER TIES OF THE ˆ Ω ESTIMA TES Next, we establish that the estimator ˆ Ω which maximizes (6) will con v erge to the true parameter Ω in probability in probability under certain regularity conditions. Before w e state the main result, 7 w e presen t some definitions. Let E j ( t, Ω) = Γ − 1 X l λ j,l ( t ) = Γ − 1 X l λ 0 ,l exp X i,i 6 = j L ij ( α i + β j ) log ( M i ( t, l ) + 1) Φ j = ( φ 1 , . . . , φ n ) := ( α 1 + β j , . . . , α n + β j ) Φ 0 j = ( φ 0 1 , . . . , φ 0 n ) := ( α 0 1 + β 0 j , . . . , α 0 n + β 0 j ) 0 E (1) j ( t, Ω) = ∂ E j ( t, Ω) ∂ φ 1 , . . . , ∂ E j ( t, Ω) ∂ φ n E (1) j ( t, Ω 0 ) = ∂ E j ( t, Ω 0 ) ∂ φ 0 1 , . . . , ∂ E j ( t, Ω 0 ) ∂ φ 0 n Then, we can establish the following result. Theorem 1. Supp ose there exists time point t 0 , suc h that all the observ ed time p oints satisfy T k j,k ≤ t 0 . F urther, for eac h topic l , the observ ation times T l j,k , 1 ≤ k ≤ n j are differen t, for all 1 ≤ l ≤ Γ. (Note ho wev er, that for differen t topics we allow ov erlap of ev en t o ccuring times.) F urther, we assume that (A) (Finite in terv al) R t 0 0 λ 0 ( u ) du < ∞ . (B) There exists e (Ω 0 , t ) such that sup t ∈ [0 ,t 0 ] , Ω 0 X j | E j ( t, Ω 0 ) − e (Ω 0 , t ) | → P 0 0 And if w e denote e (1) j ( t, Ω 0 ) = ∂ e j ( t, Ω 0 ) ∂ φ 0 1 , . . . , ∂ e j ( t, Ω 0 ) ∂ φ 0 n e (2) j ( t, Ω 0 ) = ∂ 2 e j ( t, Ω 0 ) ∂ φ 0 i ∂ φ 0 j ! then also, sup t ∈ [0 ,t 0 ] , Ω 0 X j k E (1) j ( t, Ω 0 ) − e (1) (Ω 0 , t ) k → P 0 sup t ∈ [0 ,t 0 ] , Ω 0 X j k E (2) j ( t, Ω 0 ) − e (2) (Ω 0 , t ) k → P 0 where again k · k is the L 2 norm of a vector or matrix. (C) e (Ω 0 , t ) is b ounded a wa y from zero. e (Ω 0 , t ) and e (1) (Ω 0 , t ) are contin uous functions of Ω 0 , uniformly in t ∈ [0 , t 0 ]. e (2) (Ω , t ) is p ositive definite. Then, under condistions (A-C), w e ha ve that ˆ Ω → P Ω . 8 The detailed pro of is given in the App endix. Based on Theorem 1, by leveraging the prop erties of con tin uous functions, w e can establish the consistency of the prop osed inflience measure. Prop osition 1 . Let Ξ( t ) = (Ξ 1 ( t ) , · · · , Ξ n ( t )) denote the n -dimensional v ector of influence measures at time t . F urther, denote by ˆ Ξ( t ) = ( ˆ Ξ 1 ( t ) , · · · , ˆ Ξ n ( t )) their empirical estimates. Under the conditions of Theorem 1, we ha ve that ˆ Ξ( t ) − Ξ( t ) → P 0 (7) for any t ≥ 0. Based on Theorem 1, the pro of of the prop osition is straightforw ard, since each elemen t of the v ector ˆ Ξ is a contin uous function of ˆ Ω. 5. PERF ORMANCE EV ALUA TION In this section, w e ev aluate the prop osed mo del and influence measure on synthetic data. W e start b y outlining the data generation mec hanism. Step 1 : Building the follow ers netw ork L . The steps emplo yed for this task are presented next. • First, for each no de i , generate K 1 ( i ) from a uniform distribution on the in tegers { 1 , . . . , K } , where K = b∗ n/ 2 c and b∗·c is the flo or function that returns the maximum integer not larger than the v alue inside. • Generate F 1 ( i ) for node i by randomly sampling K 1 ( i ) users from { 1 , . . . , n }\{ i } . If k ∈ F 1 ( i ), let L ik = 1, 1 ≤ i ≤ n . • F or eac h no de j , sample K 2 ( j ) uniformly from the set { 1 , . . . , K } . Generate F 2 ( i ) for no de j b y randomly sampling K 2 ( j ) users from { 1 , . . . , n }\{ j } . If k ∈ F 2 ( j ), let L kj = 1, 1 ≤ j ≤ n . A t the end of this pro cedure, every no de in the netw ork has at least one follow er and at least an accoun t that it follo ws. Step 2 . Generate the p ost, retw eets and mentions sequences. Since the baseline hazard rate λ 0 ,l ( t ) alwa ys gets canceled in the partial- lik eliho o d function (2), 9 w e select λ 0 ,l ( t ) as λ 0 ,l ( t ) = a , whenev er 0 ≤ t ≤ t 0 and λ 0 ,l ( t ) = 0 when t > t 0 , where a is a small p ositiv e constant. W e then generate actions on this netw ork withthe follo wing algorithm b elo w for eac h topic l ∈ { 1 , . . . , Γ } . In this algorithm, w e let the no des send tw eets with probabilit y p at each time point 0 , 1 , . . . , b∗ t 0 c , while w e generate the retw eets and mentions in the standard survial analysis wa y , b y using the hazard rate (1). Algorithm 2 Generate Group A actions 1: Initialize Indicator which is the sequence to record the nodes that hav e mentioned or retw eeted as an empt y sequence. 2: Initial t=0. Let eac h no de has a tw eet with probability p . 3: Let eac h no de send out tw eets from Binomial( J, p ). 4: while t < t 0 (stopping time for all topics) do 5: Generate surviv al time for each node with its hazard rate (1) 6: Find no de i with the shortest time t s . 7: if t + t s < t 0 then 8: Up date t to b e t + t s . Record the no de that has done this retw eet or men tion. 9: end if 10: if t + t s > t 0 then 11: Break 12: end if 13: end while 14: return Indicator W e first illustrate the performance of the Newton estimation algorithm, on a random net work of v arying size. W e set the parameter a = 0 . 5 for the baseline hazard rate and c ho ose a time horizon of t 0 = 7, to em ulate a w eek’s worth of data. W e also select the parameters Ω uniformly at random in the interv al [ − 0 . 3 , 0 . 3]. With different net work sizes n and n umber of topics generated Γ, w e obtain the follo wing tw o plots to sho w the mean squared error of the parameter and influence estimates k ˆ Ω − Ω k √ 2 n − 1 and k ˆ Ξ − Ξ k √ n , where k · k corresponds to the ` 2 norm of a vector. The results are based on 20 replicates of the underlying follow ers net w orks, as well as the actions (p ostings, retw eets and 10 men tions) data. Figure 2: Mean squared error of the mo del parameter estimates Ω (left) and Ξ (right). It can be seen that the quality of the estimates impro ves as a function of the num b er Γ of topics discussed, while it deteriorates as a function of the num b er of nodes in the follo w ers net w ork L . Another wa y to lo ok at the qualit y of the estimates, is to examine the relativ e error of the parameter and influence estimates, giv en b y k ˆ Ω − Ω k k Ω k and k ˆ Ξ − Ξ k k Ξ k . It can b e seen in the following Figure that esp ecially the influence measure whic h is of prime in terest in applications, exhibits a small (less than 10%) relativ e error rate. Figure 3: Mean relative error of the mo del parameter estimates Ω (left) and Ξ (right). Next, we use a size 10 netw ork, specially constructed to gain insigh t into the workings of the proposed influence measure. The settings for the data generation are as follo ws: Γ = 500, α 1 = 0 , α 2 = − 2 , α 3 = · · · = α 10 = 0 . 2 and β 1 = · · · = β 10 = 0. Finally , the top ology of the follo wers net works is given in Figure 5. 11 Since α 2 = − 2, no de 2 is an “unp opular” one and hence can hardly generate any retw eets and men tions of its p ostings. On the other hand, all no des hav e approximately an equal num b er of follow ers, which suggests that their ranking according to the P ageRank metric (or many other p opular ones based on that netw ork) will b e approximately similar. The results based on a single realization of the use r actions data generation pro cess is sho wn iin Figure 5. It can b e seen that relying on the follo w ers netw ork structure gives a false impression, while the prop osed influence measure that incorp orates the actions of the accounts provides a more insightful picture. 6. IDENTIFYING INFLUENTIAL SENA TORS Tw eets and follow er lists are collected using Twitter’s API and consist of appro ximately 200,000 t weets and 4671 follo wer links within the set of 120 accoun ts from April 2009 to July 2014. The 12 ret weeting and men tions in teractions are drawn in Figure 1, where accounts are registered to 55 Demo cratic p oliticians (U.S. Senators and the President of the U.S.), 46 Republican Senators, 2 gov ernmen t organizations (U.S. Army and the F ederal Reserve Board), and 16 media outlets, including newspap ers (Financial Times, W ashington Post, New Y ork Times, Huffington P ost), television net works (MSNBC, F ox News, CNN, CSP AN), reporters (Nate Silver (538), Ezra Klein) and television hosts (Bill O’Reilly , Sean Hannity). The figure shows some p erio ds of increased activit y , as in the months surrounding the inauguration of President Obama (January 2013), the debate on raising the debt ceiling of the US gov ernmen t and its temp orary susp ension around April 2013 and the summer of 2014 (so ccer W orld Cup). Note that the sudden increase during the summer of 2014 may b e an artifact of rate limiting data acquisition. Sp ecifically , Twitter’s API allows access to only the past 3000 tw eets for any account. As a consequence, for extremely high volume users, lik e newspap ers and television netw orks, our data traces their Twitter usage for mon ths. F or the least active users in our data, 3000 tw eets dates bac k m ultiple y ears. An insp ection of actual tw eets in T able 1 sho ws, consisten t with Golb eck et al. (2010), that senators tend to ret w eet and men tion as a means of self or legislativ e promotion. In fact, w e see a num b er of references to legislative activit y , suc h as calls for gun reform, carb on emissions, and references to actual bills on ov ertime pay , domestic violence protections, among others. Senators often cite news cov erage by retw eeting or mentioning news media accoun ts that support their p olitical agenda, whic h would suggest that the media outlets collectively ha v e enormous influence. This also suggests that Twitter is utilized b y senators as part of a larger strategy to build and coalesce public supp ort in order to pass bills through congress . T o test these h yp otheses and also rigorously compare the proposed influence measure to PageR- ank applied to the follo w ers net works (which constitutes the bac kb one of many ranking algorithms of Twitter accoun ts), we p erform a regression analysis to assess how well eac h measure explains le gislative le adership in Congress. Our resp onse v ariable is the leadership score, published b y www.govtrack.us (Go vT rack.us, 2014). GovT rac k creates the leadership score by applying the P ageRank algorithm to the adjacency matrix of bill cosp onsorship data. Th us, the leadership score for each senator is a num b er b et w een 0 and 1, where higher v alues denote greater legislative 13 T able 1: Actual t weets men tioning or retw eeting the most influential accoun ts o ver from May 15, 2014 to July 3, 2014. Date Accoun t Tw eet 05/19/2014 Menendez “.@SenBlumenthal & in #NJ the a vg student loan debt is o v er $29K. It’s unacceptable! #GameofLoans h ttp://t.co/hUJMSeJbfd” 05/23/2014 Corn yn “R T @nytimes: F ormer Defense Secretary Gates Is Elected Presiden t of the Bo y Scouts http://t.co/C7STUSVIP3” 05/27/2104 Blumen thal “R T @msn b c: @SenBlumen thal calls for reviving gun reform debate after mass sho oting near Santa Barbara: h ttp://t.co/7sqtf1IAFy” 06/02/2014 Mark ey “R T @w ashingtonp ost: A h uge ma jorit y of Amer- icans supp ort regulating carbon from p o wer plan ts h ttp://t.co/lj6ieL5D1Y h ttp://t.co/2CA63hTqmm” 06/17/2014 Mark ey “Proud to in tro new bill w @SenBlumen thal 2 pro- tect domestic violence victims from #gunviolence h ttp://t.co/MsgK40oLiT h ttp://t.co/ynEHrEbh2x” 06/20/2014 Blumen thal “Proud to stand w/ @CoryBo ok er & others on enhancing rules to reduce truck driver fatigue. Their safety & safety of others is paramoun t. -RB” 06/20/2014 Mark ey “Proud to supp ort our w orkers and this commonsense bill w @SenatorHarkin Keeping T rack: Overtime P ay , via @nytimes h ttp://t.co/TnAS96Hro5” 06/25/2014 Durbin “W atc h no w: @OfficialCBC @HispanicCaucus @CAP A C @USProgressiv es @SenatorCardin on racial profiling #MoreThanAProfile http://t.co/ZX0Eu65dgi 06/25/2014 Cardin “R T @TheTR CP: Thank you @SenatorCardin for standing with sp ortsmen to da y for #CleanW ater #protectcleanw ater” 06/27/2014 Mark ey “Thanks @alfrank en @CoryBo ok er @amyklobuc har @SenBlumen thal for joining me in supp ort of commu- nit y #broadband http://t.co/O8Px2MzrCg” 06/27/2014 Menendez “T o ok m y first #selfie at #NJs @ALJBS! Hop e @CoryBooker is proud of his NJ Sen colleague. h ttp://t.co/F rEJonUy9d 06/28/2014 Bo ok er “Thanks Adam R T @AIsaacs7 Props to @CoryBo ok er and @SenRandP aul for their bipartisanship in introducing their amendmen t #MedicalMarijuana” 14 leadership. The regression mo del we are interested in is Leadership = β Influence + ΘCon trols , (8) where Influence con tains the prop osed measure and/or P ageRank, and Controls includes part y affiliation, gender, age, and num b er of years in the senate. Seniorit y endows a num b er of b enefits including preferential assignment to committees. Thus, these con trol v ariables likely asso ciate strongly with legislativ e leadership. T o estimate the prop osed influence measure, the data is organized in to weekly interv als after using the follow-follo w er relations to construct the adjacency matrix L . In Twitter it is common to use “hash tags” or the # sym b ol follow ed by a user-sp ecified category to identify context, which, as men tioned in Section 1 can be used as an indicator of differen t con versations. How ever, w e find that senators do not utilize hashtags often. T o ov ercome this challenge, we follow previous w orks on Twitter (Hong and Davison, 2010; Ramage et al., 2010) b y applying probabilistic topic mo deling, which was first introduced in Blei et al. (2003). Extensive work in computer science and applied statistics has led to fast algorithms capable of analyzing extremely big text archiv es. Due to space constrain ts, for statistical and algorithmic details on the topic mo del, see Blei (2012); Blei and Lafferty (2007) and references therein. T opic mo deling applied to the data results in a soft clustering of tw eets in to groups (topics), whic h is appropriate since a single tw eet could touc h on multiple issues. Thus, t weets are assigned to topics that had at least 0 . 25 probabilit y . Given the fast mo ving landscap e of so cial media, new topics are assigned each week, leading to 2770 topics in total for the en tire data set. After prepro cessing, we apply Algorithm 1 to estimate the α and β parameters for every account using all data. The final influence measure is constructed by computing the influence measure vector ˆ Ξ ov er differen t time in terv als to study ho w influence ev olv ed; i.e. ˆ Ξ was computed by using the a verage M i ( T m ), where T m denotes the m − th time in terv al of interest. The first time interv al T 1 w e inv estigate is Ma y 15, 2014 - July 3, 2014, which captures the most activ e p erio d in our data and also represen ts a p erio d when rate limiting is not a concern, i.e., the data for even high v olume users extends this far. During this time sev eral ma jor even ts o ccurred w orldwide, including the soccer W orld Cup, debate on immigration reform, and the Islamic State in Iraq and the Lev ant (also kno wn as the ISIS or ISIL) b egan an offensive in northern Iraq. T able 2 15 ● ● ● ● ● ● ● ● ● ● ● ● ● ● ● ● ● ● ● ● ● ● ● ● ● ● ● ● ● ● ● ● ● ● ● ● ● ● ● ● ● ● ● ● ● ● ● ● ● ● ● ● ● ● ● ● ● ● ● ● ● ● ● ● ● ● ● ● ● ● ● ● ● ● ● ● ● Booker Ezra Klein NYTimes F oxNews Cardin Blumenthal MSNBC W ashingtonP ost 2014−05−22 to 2014−05−28 ● ● ● ● ● ● ● ● ● ● ● ● ● ● ● ● ● ● ● ● ● ● ● ● ● ● ● ● ● ● ● ● ● ● ● ● ● ● ● ● ● ● ● ● ● ● ● ● ● ● ● ● ● ● ● ● ● ● ● ● ● ● ● ● ● ● ● ● ● ● ● ● ● W ashingtonP ost Blumenthal F oxNews Ezra Klein Booker NYTimes Cardin 2014−05−29 to 2014−06−04 ● ● ● ● ● ● ● ● ● ● ● ● ● ● ● ● ● ● ● ● ● ● ● ● ● ● ● ● ● ● ● ● ● ● ● ● ● ● ● ● ● ● ● ● ● ● ● ● ● ● ● ● ● ● ● ● ● ● ● ● ● ● ● ● ● ● ● ● ● ● ● Ezra Klein Nate Silver(538) Blumenthal F oxNews W ashingtonP ost NYTimes Cardin MSNBC Booker 2014−06−05 to 2014−06−11 ● ● ● ● ● ● ● ● ● ● ● ● ● ● ● ● ● ● ● ● ● ● ● ● ● ● ● ● ● ● ● ● ● ● ● ● ● ● ● ● ● ● ● ● ● ● ● ● ● ● ● ● ● ● ● ● ● ● ● ● ● ● ● ● ● ● ● ● ● ● ● ● ● ● ● ● ● ● ● ● ● Ezra Klein W ashingtonP ost Blumenthal NYTimes MSNBC F oxNews Cardin Booker 2014−06−12 to 2014−06−18 ● ● ● ● ● ● ● ● ● ● ● ● ● ● ● ● ● ● ● ● ● ● ● ● ● ● ● ● ● ● ● ● ● ● ● ● ● ● ● ● ● ● ● ● ● ● ● ● ● ● ● ● ● ● ● ● ● ● ● ● ● ● ● ● ● ● ● ● ● ● ● NYTimes Booker Blumenthal W ashingtonP ost F oxNews MSNBC Cardin 2014−06−19 to 2014−06−25 ● ● ● ● ● ● ● ● ● ● ● ● ● ● ● ● ● ● ● ● ● ● ● ● ● ● ● ● ● ● ● ● ● ● ● ● ● ● ● ● ● ● ● ● ● ● ● ● ● ● ● ● ● ● ● ● ● ● ● ● ● ● ● ● ● ● NYTimes Blumenthal F oxNews Cardin MSNBC W ashingtonP ost 2014−06−26 to 2014−07−02 Figure 4: W eekly Twitter retw eet and men tion netw ork drawings for the 2014 summer. T op ten most influen tial accounts are lab eled and node sizes are prop ortional to the estimated influence under the prop osed mo del. The no des (Twitter accoun ts) contain democratic senators (blue circles), republican senators (red squares), media (purple triangles), and gov ernmen t agencies (green stars). sho ws the top ten most influen tial accoun ts under the prop osed method and P ageRank (Page et al., 1999) calculated from the follow ers net work. Both metho ds estimate that the Financial Times is the most influen tial Twitter accoun t, and in general find that the media has an enormous influence that facilitates online conv ersation b et ween p oliticians. W e see from Figure 4 that these top accoun ts w ere activ ely ret weeted and mentioned throughout this p erio d. Next, we estimate the regression mo del in Equation 8. W e note that Senators Baucus, Kerry , Co wan, Lauten b erg, and Chiesa are scored b y govtrac k.us, but are not in our analysis. Max Baucus and John Kerry are left out, b ecause they v acated their Senate seats to b ecome, resp ectiv ely , 16 T able 2: T op ten rankings according to the prop osed mo del and P ageRank from Ma y 15, 2014 - July 3, 2014. Rank Prop osed Measure P ageRank 1 Financial Times Financial Times 2 W ashington Post U.S. Army 3 NYTimes CNN 4 MSNBC Barac k Obama 5 Ezra Klein CSP AN 6 F o x News New Y ork Times 7 Cory Bo ok er W ashington Post 8 Ben Cardin Cory Bo ok er 9 Nate Silver (538) MSNBC 10 Ric hard Blumen thal W all Street Journal T able 3: Estimated R-squared v alues for different regression mo dels, where the prop osed measure and/or P ageRank is included in the set of indep endent v ariables and the influence is computed for the en tire data sample. W e consisten tly find that the prop osed measure is a b etter indicator of legislativ e imp ortance. Resp onse Prop osed Measure P ageRank R 2 0.311 leadership 0.276 0.311 0.114 log ( leadership 1 − leadership ) 0.098 0.114 17 T able 4: Regression estimates, where the resp onse v ariable is the raw leadership scores from Gov- T rac k.us and influence is computed for the entire data sample. R 2 = 0 . 311; F = 8 . 228 on 5 and 92 DF (p-v alue: 0 . 000) V ariable Estimate Std. Error t v alue P ( > | t | ) In tercept -0.086 0.232 -0.368 0.714 Prop osed Influence 0.062 0.028 2.241 0.027 Republican -0.154 0.039 -3.945 0.000 Age 0.002 0.003 0.923 0.359 Y ears in Senate 0.007 0.003 2.518 0.014 Male 0.020 0.050 0.395 0.694 Am bassador to China and U.S. Secretary of State. Mo Cow an succeeded Kerry and was senator from F ebruary 1, 2013 to July 16, 2013 until a sp ecial election could b e held. Co wan c hose not to run in the election. Likewise, due to the death of Senator F rank Lauten b erg, Jeffrey Chiesa was app oin ted b y Go vernor Chris Christie to b e the junior senator from New Jersey from June 6, 2013 to Octob er 31, 2013. He declined to run in the sp ecial election and thus, is also not included in the analysis. Since the leadership score pro vided by GovT rack are b et ween 0 and 1, w e estimate t w o mo d- els. One mo del uses the raw leadership scores, and another uses l og ( leadership 1 − leadership ) for the resp onse v ariable. In b oth cases, as shown in T able 3, we consistently find that the prop osed influence mea- sure explains more v ariation in leadership and when b oth the proposed and P ageRank influence measures are included as independent v ariables, P ageRank do es not pro vide additional explanatory p o w er. T ables 4 and 5 sho w a significan t p ositiv e co efficien t for the proposed influence measure, meaning that senators who are more influen tial in Twitter by successfully steering conv ersation of their colleagues on to particular topics, tend to b e more influen tial in real life in passing legis- lation. These results are consistent across different time in terv als. F or instance, in the App endix w e present similar results, where influence is calculated from Jan uary 1, 2013 to Marc h 1, 2013 corresp onding to sequestration and also from Nov em b er 1, 2012 to Jan uary 31, 2013 corresponding to the presiden t’s reelection and subsequen t inauguration. 18 T able 5: Regression estimates, where the resp onse v ariable is log ( leadership 1 − leadership ), where leaderhip is from Go vT rac k.us and influence is computed for the entire data sample. R 2 = 0 . 114; F = 2 . 334 on 5 and 92 DF (p-v alue: 0 . 048) V ariable Estimate Std. Error t v alue P ( > | t | ) In tercept -3.590 2.604 -1.379 0.171 Prop osed Influence 0.437 0.308 1.416 0.160 Republican -1.112 0.438 -2.538 0.013 Age 0.009 0.029 0.323 0.747 Y ears in Senate 0.034 0.032 1.063 0.290 Male 0.470 0.563 0.834 0.407 7. DISCUSSION The goal in this pap er was to characterize the influence of users in a large scale so cial media platform when giv en information about the detailed actions users tak e on it. Our comprehensiv e analysis of the US Senators and related accounts demonstrated that con versations, and in particular the rate of directed activity , b et ween accounts are correlated with their real-w orld position and influence. W e exp ect similar conclusions to hold broadly for other t yp es of directed in teraction data when the no des form a clearly defined ecosyste m or closely knit so cial group/comm unity . The modeling and statistical inference issues, asso ciated with these large scale data are different from those in the related literature on netw ork comm unity detection (Kolaczyk, 2009; Fienberg, 2012; Salter-T o wnshend et al., 2012), where the goal is to iden tify relatively dense groups of no des (users), ev en though the underlying data (observed adjacency matrices) are the same. Relativ e to other recent work on mo deling directed netw orks, as in Perry and W olfe (2013), our study has imp ortan t modeling differences motiv ated by the online social media platform domain. F or instance, our approac h incorp orates the fundamental differences b et ween actions like retw eeting, men tioning, and p osting. As a consequence, our final influence measure, which sums all possible influences from the so cial net w ork, is able to outperform traditional top ology driv en approaches lik e PageRank (Page et al., 1999). Perhaps most imp ortan tly , giv en the massiv e volumes of data generated b y platforms lik e Twitter, w e presented a fast estimation algorithm and established 19 statistical prop erties for the mo del estimates and those of the final influence measure. These results suggest that the prop osed mo del can be a relativ ely straigh tforw ard technique to iden tifying influen tial individuals within Twitter ecosystems, and that it can complement the significan tly more inv olved text mining based conten t analysis of the raw messages for related tasks (T addy, 2013). APPENDIX 8. PROOFS 8.1 Expressions for the gradient v ector and Hessian matrix of the LL function Some rather straightforw ard algebra yields the follo wing expressions for the elemen ts of the gradien t v ector G ≡ ∇ Ω LL : ∂ LL ∂ α i = X 1 ≤ l ≤ Γ X 1 ≤ j ≤ n,j 6 = i X 1 ≤ k ≤ n j L ij log( M i ( T l j,k , l ) + 1) − X 1 ≤ j ≤ n X 1 ≤ k ≤ n j P v 6 = i L iv log( M i ( T l j,k , l ) + 1) exp P u 6 = v L uv ( α u + β v ) log ( M u ( T l j,k , l ) + 1) P 1 ≤ v ≤ n exp P u 6 = v L uv ( α u + β v ) log ( M u ( T l j,k , l ) + 1) (9) for 2 ≤ i ≤ n , and ∂ LL ∂ β j = X 1 ≤ l ≤ Γ X 1 ≤ k ≤ n j X i 6 = j L ij M i ( T l j,k , l ) − X 1 ≤ s ≤ n X 1 ≤ k ≤ n s P u 6 = j L uj log( M u ( T l s,k , l ) + 1) exp P u 6 = j L uj ( α u + β j ) log ( M u ( T l s,k , l ) + 1) P 1 ≤ v ≤ n exp P u 6 = v L uv ( α u + β v ) log ( M u ( T l s,k , l ) + 1) (10) for 1 ≤ j ≤ n . Next, w e obtain the necessary expressions for the Hessian matrix H ( LL ). W e start by computing the sub-matrix of H that includes the second partial deriv atives of LL with respect to the α parameters. W e get ∂ 2 LL ∂ α 2 i = X 1 ≤ l ≤ Γ − X 1 ≤ j ≤ n X 1 ≤ k ≤ n j P v 6 = i L iv log( M 2 i ( T l j,k , l ) + 1) exp P u 6 = v L uv ( T l j,k )( α u + β v ) log ( M u ( T l j,k , l ) + 1) P 1 ≤ v ≤ n exp P u 6 = v L uv ( α u + β v ) log ( M u ( T l j,k , l ) + 1) + X 1 ≤ j ≤ n X 1 ≤ k ≤ n j h P v 6 = i L iv log( M i ( T l j,k , l ) + 1) exp P u 6 = v L uv ( α u + β v ) log ( M u ( T l j,k , l ) + 1) i 2 h P 1 ≤ v ≤ n exp P u 6 = v L uv ( α u + β v ) log ( M u ( T l j,k , l ) + 1) i 2 (11) 20 When i 6 = q , we similarly hav e ∂ 2 LL ∂ α i ∂ α q = X 1 ≤ l ≤ Γ − X 1 ≤ j ≤ n X 1 ≤ k ≤ n j P v 6 = i,q L iv log( M i ( T l j,k , l ) + 1) L q v log( M q ( T l j,k , l ) + 1) P 1 ≤ v ≤ n exp P u 6 = v L uv ( α u + β v ) log ( M u ( T l j,k , l ) + 1) · exp X u 6 = v L uv ( α u + β v ) log ( M u ( T l j,k , l ) + 1) + X 1 ≤ j ≤ n X 1 ≤ k ≤ n j P v 6 = i L iv log( M i ( T l j,k , l ) + 1) exp P u 6 = v L uv ( α u + β v ) log ( M u ( T l j,k , l ) + 1) h P 1 ≤ v ≤ n exp P u 6 = v L uv ( α u + β v ) log ( M u ( T l j,k , l ) + 1) i 2 · X v 6 = q L q v log( M q ( T l j,k , l ) + 1) exp X u 6 = v L uv ( α u + β v ) log ( M u ( T l j,k , l ) + 1) (12) Next, we obtain the sub-matrix of H that includes the second partial deriv ativ es of LL with respect to the β parameters and get ∂ 2 LL ∂ β 2 j = X 1 ≤ l ≤ Γ X 1 ≤ s ≤ n X 1 ≤ k ≤ n s h P u 6 = j L uj log( M u ( T l s,k , l ) + 1) exp P u 6 = j L uj ( α u + β j ) log ( M u ( T l s,k , l ) + 1) i 2 h P 1 ≤ v ≤ n exp P u 6 = v L uv ( α u + β v ) log ( N u ( T l s,k , l ) + 1) i 2 − X 1 ≤ s ≤ n X 1 ≤ k ≤ n s P u 6 = j L uj log( M u ( T l s,k , l ) + 1) 2 exp P u 6 = j L uj ( α u + β j ) log ( M u ( T l s,k , l ) + 1) P 1 ≤ v ≤ n exp P u 6 = v L uv ( α u + β v ) log ( M u ( T l s,k , l ) + 1) (13) for 1 ≤ j ≤ n . When j 6 = q , we can similarly hav e ∂ 2 LL ∂ β j ∂ β q = X 1 ≤ l ≤ Γ X 1 ≤ s ≤ n X 1 ≤ k ≤ n s P u 6 = j L uj log( M u ( T l s,k , l ) + 1) exp P u 6 = j L uj ( α u + β j ) log ( M u ( T l s,k , l ) + 1) h P 1 ≤ v ≤ n exp P u 6 = v L uv ( α u + β v ) log ( M u ( T l s,k , l ) + 1) i 2 · X q 6 = j L uq log( M u ( T l s,k , l ) + 1) exp X u 6 = q L uj ( α u + β q ) log ( M u ( T l s,k , l ) + 1) (14) 21 Finally , we pro vide expressions for the cross-partials ∂ 2 LL ∂ α i ∂ β i = X 1 ≤ l ≤ Γ X 1 ≤ s ≤ n X 1 ≤ k ≤ n s P u 6 = i L ui log( M u ( T l s,k , l ) + 1) exp P u 6 = i L ui ( α u + β i ) log ( M u ( T l s,k , l ) + 1) h P 1 ≤ v ≤ n exp P u 6 = v L uv ( α u + β v ) log ( M u ( T l s,k , l ) + 1) i 2 · X v 6 = i L iv log( M i ( T l s,k , l ) + 1) exp X u 6 = v L uv ( α u + β v ) log ( M u ( T l s,k , l ) + 1) (15) When i 6 = j , ∂ 2 LL ∂ α i ∂ β j = X 1 ≤ l ≤ Γ X 1 ≤ s ≤ n X 1 ≤ k ≤ n s P u 6 = j L uj log( M u ( T l s,k , l ) + 1) exp P u 6 = j L uj ( α u + β j ) log( M u ( T l s,k , l ) + 1) h P 1 ≤ v ≤ n exp P u 6 = v L uv ( α u + β v ) log( M u ( T l s,k , l ) + 1) i 2 · X v 6 = i L iv log( M i ( T l s,k , l ) + 1) exp X u 6 = v L uv ( α u + β v ) log( M u ( T l s,k , l ) + 1) − X 1 ≤ s ≤ n X 1 ≤ k ≤ n s P u 6 = j L uj log( M u ( T l s,k , l ) + 1) L ij log( M i ( T l s,k , l ) + 1) exp P u 6 = j L uj ( α u + β j ) log( M u ( T l s,k , l ) + 1) P 1 ≤ v ≤ n exp P u 6 = v L uv ( α u + β v ) log( M u ( T l s,k , l ) + 1) (16) 8.2 Pro of of Theorem 1 Note that since the baseline hazard rate λ 0 ,l ( t ) is canceled out in the partial likelihoo d and the estimation of the parameter v ector Ω will not dep end on its v alue, in the rest of the pro of, w e can safelyl ignore it. Next, consider the pro cess X (Ω 0 , t ) = Γ − 1 ( LL (Ω 0 , t ) − LL (Ω , t )) , where recall that Γ denotes the num b er of topics under consideration. Then, given Ω, it is straigh tforward to see that ˆ Ω is the unique maximum p oint (with probability going to 1) of X (Ω , t 0 ) (Andersen and Gill, 1982) and X (Ω , t 0 ) is a conca v e function. T o simplify notation, w e let T N ( t, l ) = P i N i ( t, l ). Then, we can expand X (Ω 0 , t ) as: X (Ω 0 , t ) = Γ − 1 X l Z t 0 X j X i,i 6 = j L ij ( α 0 i + β 0 j − α i − β j ) log( M i ( u, l ) + 1) dN j ( u, l ) − Z t 0 log P j exp P i,i 6 = j L ij ( α 0 i + β 0 j ) log( M i ( u, l ) + 1) P j exp P i,i 6 = j L ij ( α i + β j ) log( M i ( u, l ) + 1)) dT N ( u, l ) Notice that by the definitions of the hazard rates, b y defining E j ( t, l ) = N j ( t, l ) − Z t 0 exp X i,i 6 = j L ij ( u )( α i + β j ) log( M i ( u, l ) + 1) du (17) 22 j = 1 , . . . , n , we can easily establish that E j ( t, l )s are lo cal martingales on the time interv al [0 , t 0 ]. Then, in X (Ω 0 , t ), w e replace dN j ( t, l ) with the hazard rates of N j ( t, l ), which is exp X i 6 = j L ij ( t )( α i + β j ) log( M i ( t, l ) + 1) Then, w e can get A (Ω 0 , t ) = Γ − 1 X l Z t 0 X j X i,i 6 = j L ij ( α 0 i + β 0 j − α i − β j ) log( M i ( u, l ) + 1) exp X i 6 = j L ij ( t )( α i + β j ) log( M i ( t, l ) + 1) du − Z t 0 log P j exp P i,i 6 = j L ij ( α 0 i + β 0 j ) log( M i ( u, l ) + 1) P j exp P i,i 6 = j L ij ( α i + β j ) log( M i ( u, l ) + 1) X j exp X i 6 = j L ij ( α i + β j ) log( M i ( t, l ) + 1) du (18) Some algebra shows that X (Ω 0 , t ) − A (Ω 0 , · ) can b e written as a finite sum of the square integrable lo cal martingales E j ( t, l ) in (17). Then, the lastter is also a lo cal square in tegrable martingale. By Theorem 2.4.3 in (Fleming and Harrington, 2013), we ha ve < X (Ω 0 , t ) − A (Ω 0 , t ) , X (Ω 0 , t ) − A (Ω 0 , t ) > = B (Ω 0 , t ) , where B (Ω 0 , t ) = Γ − 2 X l X j Z t 0 S j ( u, l ) 2 λ 0 exp X i,i 6 = j L ij ( α i + β j ) log ( M i ( u, l ) + 1) du, (19) where in (19) ab o ve, S j ( u, l ) is giv en b y S j ( u, l ) = X i,i 6 = j L ij ( α 0 i + β 0 j − α i − β j ) log ( M i ( u, l )+1) − log P j exp P i,i 6 = j L ij ( α 0 i + β 0 j ) log ( M i ( u, l ) + 1) P j exp P i,i 6 = j L ij ( α i + β j ) log ( M i ( u, l ) + 1) Since Γ · B (Ω 0 , · ) con verges in probabilit y to some finite quan tity (b y the law of large n umbers, dep ending on Ω), X (Ω 0 , t ) should conv erge to the same limit as A (Ω 0 , t ) for each Ω 0 (if A (Ω 0 , t ) con verges). Note that b y using the notation employ ed in Condition (A) and (B) in Theorem 1, A (Ω 0 , t ) can b e simplified to A (Ω 0 , t ) = Z t 0 X j (Φ 0 j − Φ j ) 0 E (1) j ( u, Ω) − log ( P j E j ( u, Ω 0 ) P j E j ( u, Ω) ) X j E j ( u, Ω) du It follows that by conditions (A), (B) and (C), for each Ω 0 , as Γ → ∞ , A (Ω 0 , t 0 ) → P P (Ω 0 , t 0 ) , 23 where P (Ω 0 , t 0 ) = Z t 0 0 X j (Φ 0 j − Φ j ) 0 e (1) j ( u, Ω) − log ( P j e j ( u, Ω 0 ) P j e j ( u, Ω) ) X j e j ( u, Ω) du No w, we wan t to establish that P (Ω 0 , t 0 ) remains conv ex. W e ev aluate the first and second deriv ativ e of P 1 (Ω 0 , t 0 ) to sho w its conv exity . By Condition (C), w e can compute the first deriv atives as ∂ P (Ω 0 , t 0 ) ∂ β 0 j = Z t 0 0 " e (1) j ( u, Ω) − e (1) j ( u, Ω 0 ) P j e j ( u, Ω) P j e j ( u, Ω 0 ) # du and ∂ P (Ω 0 , t 0 ) ∂ α 0 i = Z t 0 0 X j I 0 i e (1) j ( u, Ω) − ( α 0 1 , . . . , α 0 n ) 0 X j I 0 i e (1) j ( u, Ω 0 ) P j e j ( u, Ω) P j e j ( u, Ω 0 ) du where I i is a n -dimensional vector with all zeros exp ect one on the i -th entry . Note that the ab o ve parital deriv ativ es are all zero at Ω 0 = Ω. F urther, the second deriv ativ es are Z t 0 0 " e (2) j ( u, Ω) + e (1) j ( u, Ω) ⊗ 2 P j e j ( u, Ω) P j e j ( u, Ω 0 ) # du, whic h is a p ositiv e semidefinite matrix for an y Ω 0 and p ositiv e definite at Ω. Thus, X (Ω 0 , t 0 ) con verges in probability to a conv ex function of Ω 0 with a unique maxim um at Ω. Since ˆ Ω maximizes the conca ve function X (Ω 0 , t 0 ), it follo ws by a standard result in con vex analysis (Rock afellar, 1970) that ˆ Ω → P Ω. This completes the pro of of the Theorem. APPENDIX 9. ADDITIONAL SENA TOR RESUL TS T able 6 shows the top ten most influential accoun ts under the prop osed metho d for different time p eriods. W e see consistent results with the findings from summer 2014. Imp ortan t newspap ers lik e the Financial Times and W ashington P ost still app ear in the top ten when utilizing the full data. Other prominen t accoun ts include senators that ha ve leadership p ositions, lik e Harry Reid (Senate Ma jorit y Leader) and several others with high profile committee chairmanships or ranking app oin tmen ts. T ables 7 and 8 sho w regression results for the sequestration p eriod, and T ables 9 and 10 sho w regression results for the inauguration p erio d. The results are consisten t with the results presen ted in the main text. Regressing directly on the leadership scores shows a strongly significant and 24 T able 6: T op ten rankings under the prop osed mo del for differen t time interv als. Rank Sequestration 2014 Inauguration Entire Data 1 Leah y Leahy Financial Times 2 Grassley Grassley Grassley 3 Mikulski Begic h Leah y 4 Begic h Mikulski Cruz 5 Shaheen Johanns W ashington Post 6 McCaskill Reid Reid 7 Reid McCaskill Begic h 8 Blun t Graham Mikulski 9 Graham Shaheen Ezra Klein 10 Collins Hagan Sc hatz p ositiv e coefficient for the prop osed influence measure. The regressions with transformed leadership scores show effects are mo derately significant. REFERENCES Andersen, P . K., and Gill, R. D. (1982), “Cox’s regression mo del for counting pro cesses: a large sample study ,” The annals of statistics , pp. 1100–1120. Blei, D. M. (2012), “Probabilistic topic mo dels,” Communic ations of the A CM , 55(4), 77–84. Blei, D. M., and Laffert y , J. D. (2007), “A correlated topic mo del of science,” The A nnals of Applie d Statistics , pp. 17–35. Blei, D. M., Ng, A. Y., and Jordan, M. I. (2003), “Latent dirichlet allocation,” the Journal of machine L e arning r ese ar ch , 3, 993–1022. Bulearca, M., and Bulearca, S. (2010), “Twitter: a viable marketing to ol for SMEs?,” Glob al Business and Management R ese ar ch: A n International Journal , 2(4), 296–309. Cha, M., Haddadi, H., Beneven uto, F., and Gummadi, P . K. (2010), “Measuring User Influence in Twitter: The Million F ollow er F allacy .,” ICWSM , 10, 10–17. 25 T able 7: Regression estimates, where the resp onse v ariable is the raw leadership scores from Gov- T rac k.us and influence is computed from January 1, 2013 to March 1, 2013. R 2 = 0 . 327; F = 8 . 839 on 5 and 92 DF (p-v alue: 0 . 000) V ariable Estimate Std. Error t v alue P ( > | t | ) In tercept -0.153 0.228 -0.669 0.505 Prop osed Influence 0.074 0.028 2.689 0.009 Republican -0.153 0.039 -3.960 0.000 Age 0.002 0.003 0.833 0.407 Y ears in Senate 0.007 0.003 2.532 0.013 Male 0.020 0.050 0.397 0.692 T able 8: Regression estimates, where the resp onse v ariable is log ( leadership 1 − leadership ), where leaderhip is from GovT rac k.us and influence is computed from January 1, 2013 to March 1, 2013. R 2 = 0 . 119; F = 2 . 466 on 5 and 92 DF (p-v alue: 0 . 038) V ariable Estimate Std. Error t v alue P ( > | t | ) In tercept -3.925 2.574 -1.525 0.131 Prop osed Influence 0.504 0.312 1.614 0.110 Republican -1.103 0.437 -2.526 0.013 Age 0.008 0.029 0.267 0.790 Y ears in Senate 0.033 0.031 1.062 0.291 Male 0.465 0.561 0.830 0.409 26 T able 9: Regression estimates, where the resp onse v ariable is the raw leadership scores from Gov- T rac k.us and influence is computed from No v ember 1, 2012 to Jan uary 31, 2013. R 2 = 0 . 328; F = 8 . 839 on 5 and 92 DF (p-v alue: 0 . 000) V ariable Estimate Std. Error t v alue P ( > | t | ) In tercept -0.132 0.220 -0.597 0.552 Prop osed Influence 0.072 0.026 2.726 0.008 Republican -0.154 0.039 -3.978 0.000 Age 0.002 0.003 0.797 0.427 Y ears in Senate 0.007 0.003 2.616 0.010 Male 0.020 0.050 0.395 0.693 T able 10: Regression estimates, where the resp onse v ariable is l og ( leadership 1 − leadership ), where leaderhip is from GovT rack.us and influence is computed from No v ember 1, 2012 to January 31, 2013. R 2 = 0 . 117; F = 2 . 402 on 5 and 92 DF (p-v alue: 0 . 043) V ariable Estimate Std. Error t v alue P ( > | t | ) In tercept -3.578 2.495 -1.434 0.155 Prop osed Influence 0.452 0.297 1.521 0.132 Republican -1.105 0.437 -2.527 0.013 Age 0.007 0.029 0.255 0.800 Y ears in Senate 0.035 0.031 1.113 0.269 Male 0.460 0.561 0.819 0.415 27 Fien b erg, S. E. (2012), “A Brief History of Statistical Mo dels for Net work Analysis and Op en Challenges,” Journal of Computational and Gr aphic al Statistics , 21(4), 825–839. URL: http://www.tandfonline.c om/doi/abs/10.1080/10618600.2012.738106 Fleming, T., and Harrington, D. (2013), Counting Pr o c esses and Survival A nalysis , Wiley Series in Probabilit y and Statistics Wiley . URL: http://b o oks.go o gle.c om/b o oks?id=i85dAAAACAAJ Ga yo-Av ello, D., Metaxas, P . T., and Mustafara j, E. (2011), Limits of electoral predictions using t witter.,, in ICWSM . Golb ec k, J., Grimes, J. M., and Rogers, A. (2010), “Twitter use by the U.S. Congress,” Journal of the Americ an So ciety for Information Scienc e and T e chnolo gy , 61(8), 1612–1621. URL: http://dx.doi.or g/10.1002/asi.21344 Go vT rack.us (2014), “GovT rac k.us: T racking the United States Congress,”, https://www. GovTrack.us . Accessed: 2014-10-26. Hong, L., and Davison, B. D. (2010), Empirical study of topic mo deling in twitter,, in Pr o c e e dings of the First Workshop on So cial Me dia Analytics , ACM, pp. 80–88. Klein b erg, J. M. (1999), “Authoritative sources in a h yperlinked en vironment,” J. ACM , 46(5), 604– 632. URL: www.cs.c ornel l.e du/home/kleinb er/auth.p df Klout (2014), “Klout — Be Known for What you Lo ve,”, www.Klout.com . Accessed: 2014-11-01. Kolaczyk, E. D. (2009), Statistic al A nalysis of Network Data: Metho ds and Mo dels , Springer Series in Statistics, New Y ork, NY, USA: Springer Publishing Company , Incorp orated. Kw ak, H., Lee, C., P ark, H., and Moon, S. (2010), What is Twitter, a so cial netw ork or a news media?,, in Pr o c e e dings of the 19th international c onfer enc e on World wide web , ACM, pp. 591– 600. P age, L., Brin, S., Mot wani, R., and Winograd, T. (1999), “The P ageRank citation ranking: Bringing order to the w eb.,” , . 28 P eerIndex (2014), “PeerIndex – Think People,”, www.PeerIndex.com . Accessed: 2014-11-01. P erry , P . O., and W olfe, P . J. (2013), “Poin t pro cess mo delling for directed interaction net works,” Journal of the R oyal Statistic al So ciety: Series B (Statistic al Metho dolo gy) , 75(5), 821–849. Ramage, D., Dumais, S., and Liebling, D. (2010), Characterizing Microblogs with T opic Mo dels,, in Pr o c. ICWSM 2010 , American Asso ciation for Artificial Intelligence. URL: http://r ese ar ch.micr osoft.c om/apps/pubs/default.aspx?id=131777 Ro c k afellar, R. (1970), Convex Analysis , Con vex Analysis Princeton Universit y Press. URL: http://b o oks.go o gle.c om/b o oks?id=1TiOka9bx3sC Salter-T o wnshend, M., White, A., Gollini, I., and Murphy , T. B. (2012), “Review of statisti- cal net work analysis: mo dels, algorithms, and softw are,” Statistic al Analysis and Data Mining , 5(4), 243–264. T addy , M. (2013), “Measuring Political Sentimen t on Twitter: F actor Optimal Design for Multi- nomial Inv erse Regression,” T e chnometrics , 55(4), 415–425. URL: http://dx.doi.or g/10.1080/00401706.2013.778791 T ruso v, M., Bo dapati, A. V., and Bucklin, R. E. (2010), “Determining influential users in in ternet so cial net works,” Journal of Marketing R ese ar ch , 47(4), 643–658. Twitter, I. (2014), “Ab out Twitter, Inc.,”, https://about.twitter.com/company . Accessed: 2014-09-19. W eng, J., Lim, E.-P ., Jiang, J., and He, Q. (2010), Twitterrank: finding topic-sensitive influential t witterers,, in Pr o c e e dings of the thir d A CM international c onfer enc e on Web se ar ch and data mining , ACM, pp. 261–270. 29
Original Paper
Loading high-quality paper...
Comments & Academic Discussion
Loading comments...
Leave a Comment