A random forest system combination approach for error detection in digital dictionaries
When digitizing a print bilingual dictionary, whether via optical character recognition or manual entry, it is inevitable that errors are introduced into the electronic version that is created. We investigate automating the process of detecting error…
Authors: Michael Bloodgood, Peng Ye, Paul Rodrigues
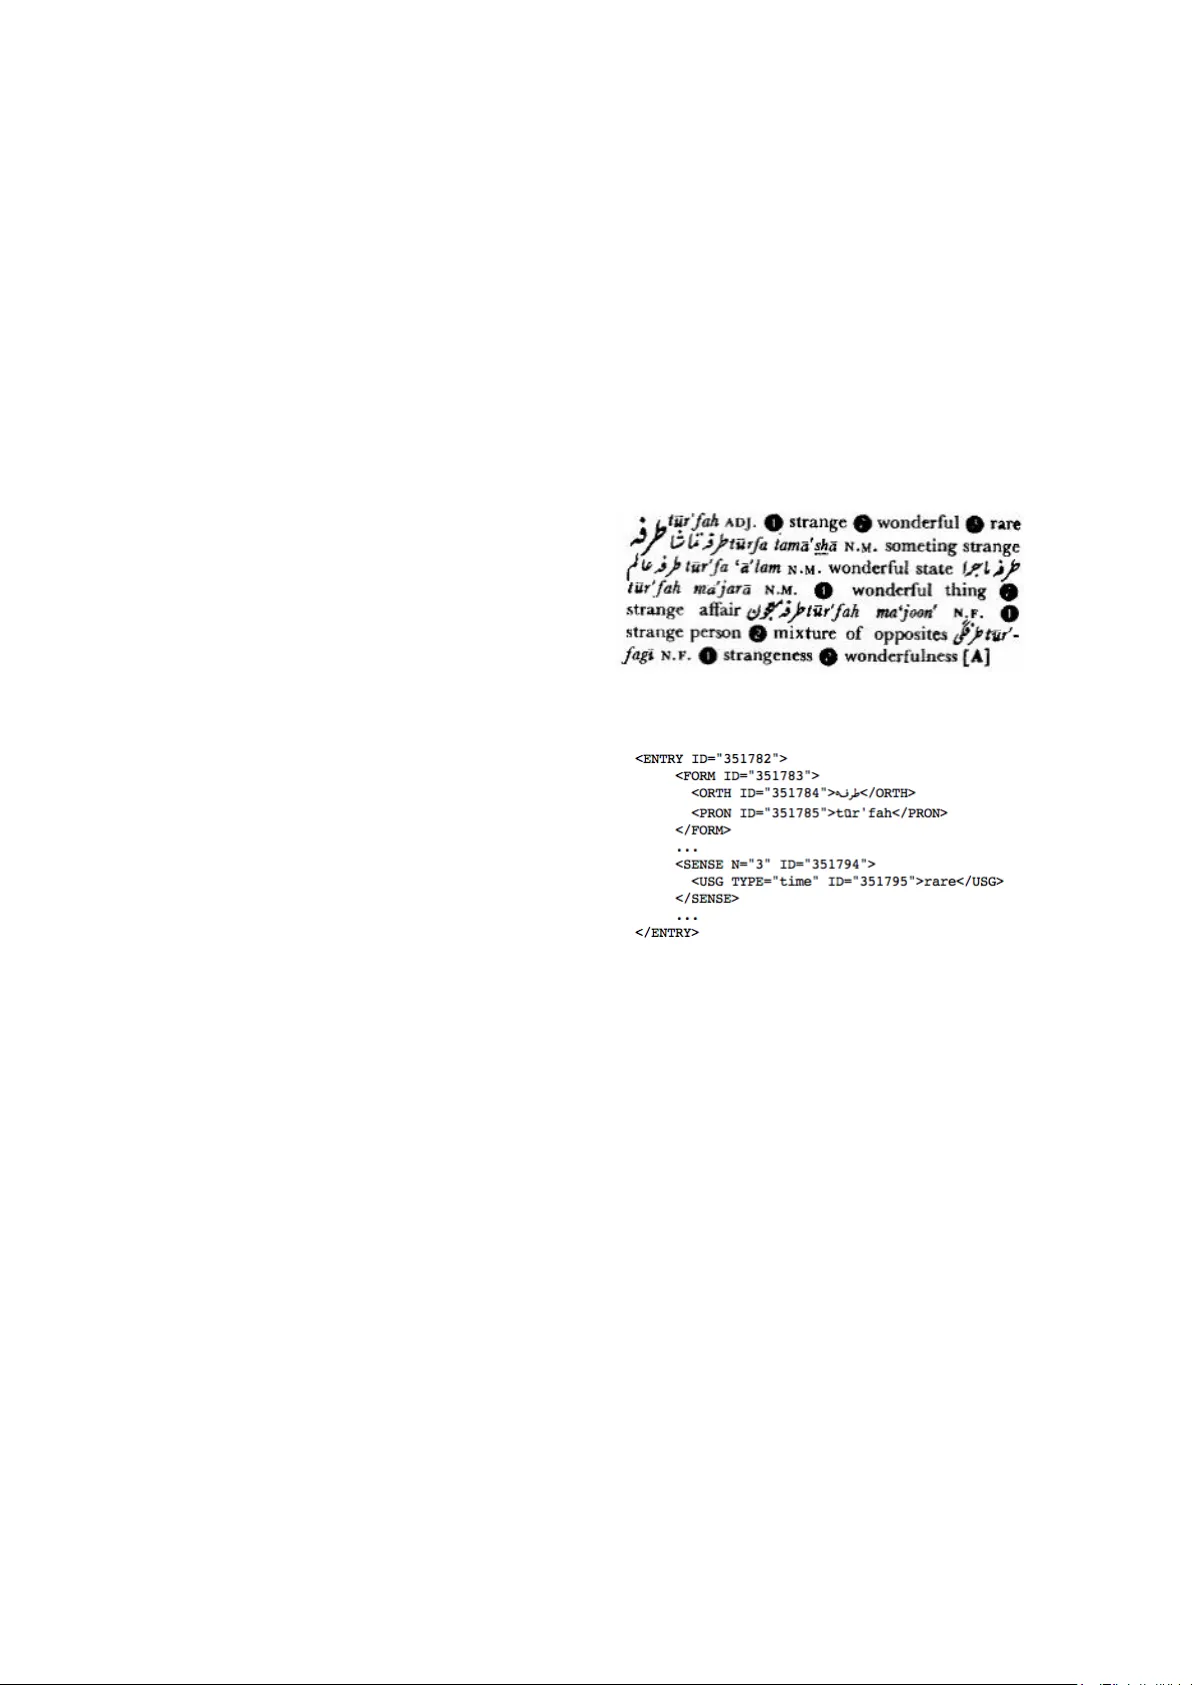
A random f or est system combination approach f or err or detection in digital dictionaries Michael Bloodgood and Peng Y e and Paul Rodrigues and Da vid Zajic and David Doermann Uni versity of Maryland College P ark, MD meb@umd.edu, pengye@umiacs.umd.edu, prr@umd.edu, dzajic@casl.umd.edu, doermann@umiacs.umd.edu Abstract When digitizing a print bilingual dictionary , whether via optical character recognition or manual entry , it is inevitable that errors are introduced into the electronic version that is created. W e inv estigate automating the pro- cess of detecting errors in an XML repre- sentation of a digitized print dictionary us- ing a hybrid approach that combines rule- based, feature-based, and language model- based methods. W e in vestigate combin- ing methods and show that using random forests is a promising approach. W e find that in isolation, unsupervised methods ri- val the performance of supervised methods. Random forests typically require training data so we inv estigate how we can apply random forests to combine individual base methods that are themselves unsupervised without requiring large amounts of training data. Experiments reveal empirically that a relati vely small amount of data is suf fi- cient and can potentially be further reduced through specific selection criteria. 1 Introduction Digital versions of bilingual dictionaries often hav e errors that need to be fixed. For example, Figures 1 through 5 show an example of an er- ror that occurred in one of our development dic- tionaries and how the error should be corrected. Figure 1 shows the entry for the word “turfah” as it appeared in the original print copy of (Qureshi and Haq, 1991). W e see this word has three senses with slightly different meanings. The third sense is “rare”. In the original digitized XML v ersion of (Qureshi and Haq, 1991) depicted in Figure 2, this was misrepresented as not being the meaning Figure 1: Example dictionary entry Figure 2: Example of error in XML of “turfah” but instead being a usage note that fre- quency of use of the third sense was rare. Figure 3 sho ws the tree corresponding to this XML repre- sentation. The corrected digital XML representa- tion is depicted in Figure 4 and the corresponding corrected tree is sho wn in Figure 5. Zajic et al. (2011) presented a method for re- pairing a digital dictionary in an XML format us- ing a dictionary markup language called DML. It remains time-consuming and error-prone howe ver to hav e a human read through and manually cor- rect a digital version of a dictionary , e ven with languages such as DML av ailable. W e therefore in vestigate automating the detection of errors. W e in vestigate the use of three individual meth- ods. The first is a supervised feature-based method trained using SVMs (Support V ector Ma- chines). The second is a language-modeling This paper was published within the Pr oceedings of the W orkshop on Innovative Hybrid Appr oaches to the Pr ocessing of T extual Data, pag es 78-86, A vignon, F rance, April 23 2012. c 2012 Association for Computational Linguistics . . . . ENTR Y . . . . . . . · · · . . . . . . . SENSE . . . . . USG . . . . . rare . . . . . . . · · · . . . . . F ORM . . . . . . . PR ON . . . . . tūr’fah . . . . . OR TH . . . . . ɾǨ Figure 3: T ree structure of error Figure 4: Example of error in XML, fixed . . . . ENTR Y . . . . . . . · · · . . . . . . . SENSE . . . . . TRANS . . . . . TR . . . . . rare . . . . . . . · · · . . . . . F ORM . . . . . . . PR ON . . . . . tūr’fah . . . . . OR TH . . . . . ɾǨ Figure 5: T ree structure of error , fixed method that replicates the method presented in (Rodrigues et al., 2011). The third is a simple rule inference method. The three indi vidual meth- ods hav e different performances. So we in vesti- gate how we can combine the methods most effec- ti vely . W e experiment with majority v ote, score combination, and random forest methods and find that random forest combinations work the best. For man y dictionaries, training data will not be av ailable in large quantities a priori and therefore methods that require only small amounts of train- ing data are desirable. Interestingly , for automati- cally detecting errors in dictionaries, we find that the unsupervised methods have performance that ri vals that of the supervised feature-based method trained using SVMs. Moreover , when we com- bine methods using the random forest method, the combination of unsupervised methods works bet- ter than the supervised method in isolation and al- most as well as the combination of all av ailable methods. A potential drawback of using the ran- dom forest combination method ho we ver is that it requires training data. W e in vestigated ho w much training data is needed and find that the amount of training data required is modest. Furthermore, by selecting the training data to be labeled with the use of specific selection methods reminiscent of acti ve learning, it may be possible to train the random forest system combination method with e ven less data without sacrificing performance. In section 2 we discuss pre vious related work and in section 3 we explain the three individual methods we use for our application. In section 4 we explain the three methods we explored for combining methods; in section 5 we present and discuss experimental results and in section 6 we conclude and discuss future work. 2 Related W ork Classifier combination techniques can be broadly classified into two categories: mathematical and behavioral (T ulyako v et al., 2008). In the first category , functions or rules combine normalized classifier scores from individual classifiers. Ex- amples of techniques in this category include Ma- jority V oting (Lam and Suen, 1997), as well as simple score combination rules such as: sum rule, min rule, max rule and product rule (Kittler et al., 1998; Ross and Jain, 2003; Jain et al., 2005). In the second category , the output of indi vidual clas- sifiers are combined to form a feature vector as the input to a generic classifier such as classifi- cation trees (P . and Chollet, 1999; Ross and Jain, 2003) or the k-nearest neighbors classifier (P . and Chollet, 1999). Our method falls into the second category , where we use a random forest for sys- tem combination. The random forest method is described in (Breiman, 2001). It is an ensemble classifier con- sisting of a collection of decision trees (called a random forest) and the output of the random for- est is the mode of the classes output by the indi- vidual trees. Each single tree is trained as follo ws: 1) a random set of samples from the initial train- ing set is selected as a training set and 2) at each node of the tree, a random subset of the features is selected, and the locally optimal split is based on only this feature subset. The tree is fully grown without pruning. Ma et al. (2005) used random forests for combining scores of sev eral biometric de vices for identity verification and hav e shown encouraging results. They use all fully supervised methods. In contrast, we explore minimizing the amount of training data needed to train a random forest of unsupervised methods. The use of active learning in order to re- duce training data requirements without sacri- ficing model performance has been reported on extensi vely in the literature (e.g., (Seung et al., 1992; Cohn et al., 1994; Lewis and Gale, 1994; Cohn et al., 1996; Freund et al., 1997)). When training our random forest combination of indi- vidual methods that are themselv es unsupervised, we explore how to select the data so that only small amounts of training data are needed because for many dictionaries, gathering training data may be expensi ve and labor-intensi ve. 3 Three Single Method A pproaches f or Error Detection Before we discuss our approaches for combining systems, we briefly explain the three individual systems that form the foundation of our combined system. First, we use a supervised approach where we train a model using SVM lig ht (Joachims, 1999) with a linear kernel and default regularization pa- rameters. W e use a depth first trav ersal of the XML tree and use unigrams and bigrams of the tags that occur as features for each subtree to make a classification decision. W e also explore two unsupervised approaches. The first unsupervised approach learns rules for when to classify nodes as errors or not. The rule- based method computes an anomaly score based on the probability of subtree structures. Giv en a structure A and its probability P(A), the ev ent that A occurs has anomaly score 1-P(A) and the e vent that A does not occur has anomaly score P(A). The basic idea is if a certain structure hap- pens rarely , i.e. P(A) is very small, then the oc- currence of A should hav e a high anomaly score. On the other hand, if A occurs frequently , then the absence of A indicates anomaly . T o obtain the anomaly score of a tree, we simply take the maximal scores of all e vents induced by subtrees within this tree. The second unsupervised approach uses a reim- plementation of the language modeling method described in (Rodrigues et al., 2011). Briefly , this methods works by calculating the probabil- ity a flattened XML branch can occur , gi ven a probability model trained on the XML branches from the original dictionary . W e used (Stolcke, 2002) to generate bigram models using Good T ur- ing smoothing and Katz back of f, and e valuated the log probability of the XML branches, ranking the likelihood. The first 1000 branches were sub- mitted to the hybrid system marked as an error , and the remaining were submitted as a non-error . Results for the individual classifiers are presented in section 5. 4 Three Methods f or Combining Systems W e in vestigate three methods for combining the three indi vidual methods. As a baseline, we in- vestigate simple majority vote. This method takes the classification decisions of the three methods and assigns the final classification as the classifi- cation that the majority of the methods predicted. A drawback of majority vote is that it does not weight the votes at all. Ho wev er , it might make sense to weight the votes according to factors such as the strength of the classification score. For ex- ample, all of our classifiers make binary decisions but output scores that are indicativ e of the confi- dence of their classifications. Therefore we also explore a score combination method that consid- ers these scores. Since measures from the differ - ent systems are in different ranges, we normal- ize these measurements before combining them (Jain et al., 2005). W e use z-score which com- putes the arithmetic mean and standard deviation of the giv en data for score normalization. W e then take the summation of normalized measures as the final measure. Classification is performed by thresholding this final measure. 1 Another approach would be to weight them by the performance lev el of the various constituent classifiers in the ensemble. W eighting based on performance le vel of the individual classifiers is dif ficult because it would require extra labeled data to estimate the various performance lev- els. It is not clear ho w to translate the differ - ent performance estimates into weights, or how to hav e those weights interact with weights based on strengths of classification. Therefore, we did not weigh based on performance le vel explicitly . W e believ e that our third combination method, the use of random forests, implicitly cap- tures weighting based on performance lev el and strengths of classifications. Our random forest ap- proach uses three features, one for each of the in- di vidual systems we use. W ith random forests, strengths of classification are taken into account because they form the v alues of the three fea- tures we use. In addition, the performance lev el is taken into account because the training data used to train the decision trees that form the for- est help to guide binning of the feature v alues into appropriate ranges where classification decisions are made correctly . This will be discussed further in section 5. 5 Experiments This section explains the details of the experi- ments we conducted testing the performance of the various individual and combined systems. Subsection 5.1 explains the details of the data we experiment on; subsection 5.2 provides a sum- mary of the main results of our experiments; and subsection 5.3 discusses the results. 5.1 Experimental Setup W e obtained the data for our experiments using a digitized version of (Qureshi and Haq, 1991), the same Urdu-English dictionary that Zajic et al. (2011) had used. Zajic et al. (2011) pre- sented DML, a programming language used to fix errors in XML documents that contain lexico- graphic data. A team of language experts used 1 In our experiments we used 0 as the threshold. Recall Precision F1-Measure Accuracy LM 11.97 89.90 21.13 57.53 R ULE 99.79 70.83 82.85 80.37 FV 35.34 93.68 51.32 68.14 T able 1: Performance of individual systems at ENTR Y tier . DML to correct errors in a digital, XML repre- sentation of the Kitabistan Urdu dictionary . The current research compared the source XML doc- ument and the DML commands to identify the el- ements that the language experts decided to mod- ify . W e consider those elements to be errors. This is the ground truth used for training and ev alua- tion. W e ev aluate at two tiers, corresponding to two node types in the XML representation of the dictionary: ENTR Y and SENSE. The example de- picted in Figures 1 through 5 shows an example of SENSE. The intuition of the tier is that errors are detectable (or learnable) from observing the ele- ments within a tier , and do not cross tier bound- aries. These tiers are specific to the Kitabistan Urdu dictionary , and we selected them by observ- ing the data. A limitation of our work is that we do not know at this time whether they are generally useful across dictionaries. Future work will be to automatically discover the meaningful ev alua- tion tiers for a new dictionary . After this process, we hav e a dataset with 15,808 Entries, of which 47.53% are marked as errors and 78,919 Senses, of which 10.79% are marked as errors. W e per- form tenfold cross-validation in all experiments. In our random forest experiments, we use 12 de- cision trees, each with only 1 feature. 5.2 Results This section presents experimental results, first for individual systems and then for combined sys- tems. 5.2.1 Perf ormance of individual systems T ables 1 and 2 sho w the performance of lan- guage modeling-based method (LM), rule-based method (R ULE) and the supervised feature-based method (FV) at different tiers. As can be seen, at the ENTR Y tier , R ULE obtains the highest F1- Measure and accuracy , while at the SENSE tier , FV performs the best. Recall Precision F1-Measure Accuracy LM 9.85 94.00 17.83 90.20 R ULE 84.59 58.86 69.42 91.96 FV 72.44 98.66 83.54 96.92 T able 2: Performance of individual systems at SENSE tier . 5.2.2 Impro ving individual systems using random f orests In this section, we show that by applying ran- dom forests on top of the output of indi vidual sys- tems, we can have gains (absolute gains, not rel- ati ve) in accuracy of 4.34% to 6.39% and gains (again absolute, not relati ve) in F1-measure of 3.64% to 11.39%. T ables 3 and 4 show our e x- perimental results at ENTR Y and SENSE tiers when applying random forests with the rule-based method. 2 These results are all obtained from 100 iterations of the experiments with different parti- tions of the training data chosen at each iteration. Mean v alues of dif ferent e v aluation measures and their standard de viations are shown in these ta- bles. W e change the percentage of training data and repeat the experiments to see ho w the amount of training data af fects performance. It might be surprising to see the gains in per - formance that can be achieved by using a ran- dom forest of decision trees created using only the rule-based scores as features. T o shed light on why this is so, we show the distrib ution of R ULE-based output scores for anomaly nodes and clean nodes in Figure 6. They are well separated and this explains why R ULE alone can have good performance. Recall R ULE classifies nodes with anomaly scores larger than 0.9 as errors. How- e ver , in Figure 6, we can see that there are many clean nodes with anomaly scores larger than 0.9. Thus, the simple thresholding strategy will bring in errors. Applying random forest will help us identify these errorful regions to impro ve the per - formance. Another method for helping to identify these errorful regions and classify them correctly is to apply random forest of R ULE combined with the other methods, which we will see will ev en further boost the performance. 2 W e also applied random forests to our language mod- eling and feature-based methods, and saw similar gains in performance. 0 . 5 5 0 . 6 0 . 6 5 0 . 7 0 . 7 5 0 . 8 0 . 8 5 0 . 9 0 . 9 5 1 0 500 1000 1500 o u t p u t sco r e o f r u l e - b a se d sy st e m o ccu r r e n ce s a n o m a l y cl e a n Figure 6: Output anomalies score from R ULE (ENTR Y tier). 5.2.3 System combination In this section, we explore different methods for combining measures from the three systems. T able 5 sho ws the results of majority voting and score combination at the ENTR Y tier . As can be seen, majority voting performs poorly . This may be due to the fact that the performances of the three systems are very different. R ULE sig- nificantly outperforms the other two systems, and as discussed in Section 4 neither majority voting nor score combination weights this higher perfor - mance appropriately . T ables 6 and 7 sho w the results of combining R ULE and LM. This is of particular interest since these two systems are unsupervised. Combin- ing these two unsupervised systems works better than the indi vidual methods, including supervised methods. T ables 8 and 9 sho w the results for com- binations of all av ailable systems. This yields the highest performance, b ut only slightly higher than the combination of only unsupervised base meth- ods. The random forest combination technique does require labeled data ev en if the underlying base methods are unsupervised. Based on the ob- serv ation in Figure 6, we further study whether choosing more training data from the most error- ful regions will help to improv e the performance. Experimental results in T able 10 show how the choice of training data af fects performance. It appears that there may be a weak trend tow ard higher performance when we force the selection of the majority of the training data to be from ENTR Y nodes whose R ULE anomaly scores are T raining % Recall Precision F1-Measure Accuracy 0.1 78.17( 14.83) 75.87( 3.96) 76.18( 7.99) 77.68( 5.11) 1 82.46( 4.81) 81.34( 2.14) 81.79( 2.20) 82.61( 1.69) 10 87.30( 1.96) 84.11( 1.29) 85.64( 0.46) 86.10( 0.35) 50 89.19( 1.75) 83.99( 1.20) 86.49( 0.34) 86.76( 0.28) T able 3: Mean and std of ev aluation measures from 100 iterations of experiments using R ULE+RF . (ENTR Y tier) T raining % Recall Precision F1-Measure Accuracy 0.1 60.22( 12.95) 69.66( 9.54) 63.29( 7.92) 92.61( 1.57) 1 70.28( 3.48) 86.26( 3.69) 77.31( 1.39) 95.55( 0.25) 10 71.52( 1.23) 91.26( 1.39) 80.18( 0.41) 96.18( 0.07) 50 72.11( 0.75) 91.90( 0.64) 80.81( 0.39) 96.30( 0.06) T able 4: Mean and std of ev aluation measures from 100 iterations of experiments using R ULE+RF . (SENSE tier) larger than 0.9. Howe ver , the magnitudes of the observed dif ferences in performance are within a single standard deviation so it remains for future work to determine if there are ways to select the training data for our random forest combination in ways that substantially improve upon random selection. 5.3 Discussion Majority voting (at the entry le vel) performs poorly , since the performance of the three individ- ual systems are very different and majority v oting does not weight votes at all. Score combination is a type of weighted voting. It takes into account the confidence level of output from different sys- tems, which enables it to perform better than ma- jority v oting. Ho wever , score combination does not take into account the performance levels of the different systems, and we believe this limits its performance compared with random forest com- binations. Random forest combinations perform the best, but the cost is that it is a supervised combination method. W e in vestigated how the amount of train- ing data af fects the performance, and found that a small amount of labeled data is all that the random forest needs in order to be successful. Moreov er , although this requires further exploration, there is weak evidence that the size of the labeled data can potentially be reduced by choosing it carefully from the region that is expected to be most error- ful. For our application with a rule-based system, this is the high-anomaly scoring region because although it is true that anomalies are often errors, it is also the case that some structures occur rarely but are not errorful. R ULE+LM with random forest is a little bet- ter than R ULE with random forest, with gain of about 0.7% on F1-measure when ev aluated at the ENTR Y le vel using 10% data for training. An examination of e xamples that are marked as being errors in our ground truth but that were not detected to be errors by any of our systems sug- gests that some examples are decided on the ba- sis of features not yet considered by any system. For example, in Figure 7 the second FORM is well-formed structurally , but the Urdu text in the first FORM is the be ginning of the phrase translit- erated in the second FORM. Automatic systems detected that the first FORM was an error, how- e ver did not mark the second FORM as an error whereas our ground truth marked both as errors. Examination of false negati ves also re vealed cases where the systems were correct that there was no error but our ground truth wrongly indi- cated that there was an error . These were due to our semi-automated method for producing ground truth that considers elements mentioned in DML commands to be errors. W e discovered instances in which merely mentioning an element in a DML command does not imply that the element is an er- ror . These cases are useful for making refinements to ho w ground truth is generated from DML com- mands. Examination of false positiv es rev ealed two categories. One was where the element is indeed an error but was not marked as an element in our ground truth because it was part of a larger error Method Recall Precision F1-Measure Accuracy Majority voting 36.71 90.90 52.30 68.18 Score combination 76.48 75.82 76.15 77.23 T able 5: LM+R ULE+FV (ENTR Y tier) T raining % Recall Precision F1-Measure Accuracy 0.1 77.43( 15.14) 72.77( 6.03) 74.26( 8.68) 75.32( 6.71) 1 86.50( 3.59) 80.41( 1.95) 83.27( 1.33) 83.51( 1.11) 10 88.12( 1.12) 84.65( 0.57) 86.34( 0.46) 86.76( 0.39) 50 89.12( 0.62) 87.39( 0.56) 88.25( 0.30) 88.72( 0.29) T able 6: System combination based on random forest (LM+R ULE). (ENTR Y tier , mean (std)) T raining % Recall Precision F1-Measure Accuracy 0.1 65.85( 12.70) 71.96( 7.63) 67.68( 7.06) 93.38( 1.03) 1 80.29( 3.58) 84.97( 3.13) 82.45( 1.36) 96.31( 0.28) 10 82.68( 2.49) 90.91( 2.37) 86.53( 0.41) 97.22( 0.07) 50 83.22( 2.43) 92.21( 2.29) 87.42( 0.35) 97.42( 0.04) T able 7: System combination based on random forest (LM+R ULE). (SENSE tier , mean (std)) T raining % Recall Precision F1-Measure Accuracy 20 91.57( 0.55) 87.77( 0.43) 89.63( 0.23) 89.93( 0.22) 50 92.04( 0.54) 88.85( 0.48) 90.41( 0.29) 90.72( 0.28) T able 8: System combination based on random forest (LM+R ULE+FV). (ENTR Y tier , mean (std)) T raining % Recall Precision F1-Measure Accuracy 20 86.47( 1.01) 90.67( 1.02) 88.51( 0.26) 97.58( 0.06) 50 86.50( 0.81) 92.04( 0.85) 89.18( 0.30) 97.73( 0.06) T able 9: System combination based on random forest (LM+R ULE+FV). (SENSE tier , mean (std)) Recall Precision F1-Measure Accuracy 50% 85.40( 4.65) 80.71( 3.49) 82.82( 1.57) 82.63( 1.54) 70% 86.13( 3.94) 80.97( 2.64) 83.36( 1.33) 83.30( 1.21) 90% 85.77( 3.61) 81.82( 2.72) 83.65( 1.45) 83.69( 1.35) 95% 85.93( 3.46) 82.14( 2.98) 83.89( 1.32) 83.94( 1.18) random 86.50( 3.59) 80.41( 1.95) 83.27( 1.33) 83.51( 1.11) T able 10: Effect of choice of training data based on rule based method (Mean ev aluation measures from 100 iterations of experiments using R ULE+LM at ENTR Y tier). W e choose 1% of the data for training and the first column in the table specifies the percentage of training data chosen from Entries with anomalous score larger than 0.9. Figure 7: Example of error in XML that got deleted and therefore no DML command e ver mentioned the smaller element but lexicog- raphers upon inspection agree that the smaller el- ement is indeed errorful. The other category was where there were actual errors that the dictionary editors didn’t repair with DML but that should hav e been repaired. A major limitation of our work is testing how well it generalizes to detecting errors in other dic- tionaries besides the Urdu-English one (Qureshi and Haq, 1991) that we conducted our experi- ments on. 6 Conclusions W e explored hybrid approaches for the applica- tion of automatically detecting errors in digitized copies of dictionaries. The base methods we explored consisted of a v ariety of unsupervised and supervised methods. The combination meth- ods we explored also consisted of some methods which required labeled data and some which did not. W e found that our base methods had differ - ent lev els of performance and with this scenario majority voting and score combination methods, though appealing since they require no labeled data, did not perform well since they do not weight votes well. W e found that random forests of decision trees was the best combination method. W e hypothe- size that this is due to the nature of our task and base systems. Random forests were able to help tease apart the high-error region (where anoma- lies take place). A drawback of random forests as a combination method is that they require la- beled data. Howe ver , experiments rev eal empiri- cally that a relativ ely small amount of data is suf- ficient and the amount might be able to be further reduced through specific selection criteria. Acknowledgments This material is based upon work supported, in whole or in part, with funding from the United States Gov ernment. An y opinions, findings and conclusions, or recommendations expressed in this material are those of the author(s) and do not necessarily reflect the views of the Univ ersity of Maryland, College Park and/or any agency or en- tity of the United States Government. Nothing in this report is intended to be and shall not be treated or construed as an endorsement or recom- mendation by the Uni versity of Maryland, United States Government, or the authors of the product, process, or service that is the subject of this re- port. No one may use any information contained or based on this report in advertisements or pro- motional materials related to any company prod- uct, process, or service or in support of other com- mercial purposes. References Leo Breiman. 2001. Random forests. Mac hine Learning , 45:5–32. 10.1023/A:1010933404324. David A. Cohn, Les Atlas, and Richard Ladner . 1994. Improving generalization with activ e learning. Ma- chine Learning , 15:201–221. David A. Cohn, Zoubin Ghahramani, and Michael I. Jordan. 1996. Activ e learning with statistical mod- els. Journal of Artificial Intelligence Resear ch , 4:129–145. Y oa v Freund, H. Sebastian Seung, Eli Shamir , and Naftali Tishby . 1997. Selectiv e sampling using the query by committee algorithm. Machine Learning , 28:133–168. Anil K. Jain, Karthik Nandakumar , and Arun Ross. 2005. Score normalization in multimodal biometric systems. P attern Recognition , pages 2270–2285. Thorsten Joachims. 1999. Making large-scale SVM learning practical. In Bernhard Sch ¨ olkopf, Christo- pher J. Burges, and Alexander J. Smola, editors, Ad- vances in K ernel Methods – Support V ector Learn- ing , chapter 11, pages 169–184. The MIT Press, Cambridge, US. J. Kittler , M. Hatef, R.P .W . Duin, and J. Matas. 1998. On combining classifiers. P attern Analysis and Machine Intelligence, IEEE T ransactions on , 20(3):226 –239, mar . L. Lam and S.Y . Suen. 1997. Application of majority voting to pattern recognition: an analysis of its be- havior and performance. Systems, Man and Cyber- netics, P art A: Systems and Humans, IEEE T rans- actions on , 27(5):553 –568, sep. David D. Lewis and W illiam A. Gale. 1994. A se- quential algorithm for training text classifiers. In SIGIR ’94: Proceedings of the 17th annual inter- national A CM SIGIR confer ence on Resear ch and development in information r etrieval , pages 3–12, New Y ork, NY , USA. Springer-V erlag New Y ork, Inc. Y an Ma, Bojan Cukic, and Harshinder Singh. 2005. A classification approach to multi-biometric score fusion. In A VBP A ’05 , pages 484–493. V erlinde P . and G. Chollet. 1999. Comparing deci- sion fusion paradigms using k-nn based classifiers, decision trees and logistic regression in a multi- modal identity verification application. In Pr oceed- ings of the 2nd International Confer ence on Audio and V ideo-Based Biometric P erson Authentication (A VBP A) , pages 189–193. Bashir Ahmad Qureshi and Abdul Haq. 1991. Stan- dar d T wenty Fir st Century Urdu-English Dictio- nary . Educational Publishing House, Delhi. Paul Rodrigues, David Zajic, David Doermann, Michael Bloodgood, and Peng Y e. 2011. Detect- ing structural irregularity in electronic dictionaries using language modeling. In Pr oceedings of the Confer ence on Electr onic Lexico graphy in the 21st Century , pages 227–232, Bled, Slov enia, Novem- ber . Trojina, Institute for Applied Slo vene Studies. Arun Ross and Anil Jain. 2003. Information fusion in biometrics. P attern Recognition Letters , 24:2115– 2125. H. S. Seung, M. Opper, and H. Sompolinsky . 1992. Query by committee. In COLT ’92: Pr oceedings of the fifth annual workshop on Computational learn- ing theory , pages 287–294, New Y ork, NY , USA. A CM. Andreas Stolcke. 2002. Srilm - an extensible language modeling toolkit. In Pr oceedings of the Interna- tional Confer ence on Spok en Languag e Pr ocessing . Serge y T ulyakov , Stefan Jaeger , V enu Govindaraju, and David Doermann. 2008. Revie w of classi- fier combination methods. In Machine Learning in Document Analysis and Recognition , volume 90 of Studies in Computational Intelligence , pages 361– 386. Springer Berlin / Heidelberg. David Zajic, Michael Maxwell, David Doermann, Paul Rodrigues, and Michael Bloodgood. 2011. Cor- recting errors in digital lexicographic resources us- ing a dictionary manipulation language. In Pr o- ceedings of the Confer ence on Electr onic Lexicog- raphy in the 21st Century , pages 297–301, Bled, Slov enia, November . Trojina, Institute for Applied Slov ene Studies.
Original Paper
Loading high-quality paper...
Comments & Academic Discussion
Loading comments...
Leave a Comment