Gaussian process test for high-throughput sequencing time series: application to experimental evolution
Motivation: Recent advances in high-throughput sequencing (HTS) have made it possible to monitor genomes in great detail. New experiments not only use HTS to measure genomic features at one time point but to monitor them changing over time with the a…
Authors: H, e Topa, Agnes Jonas
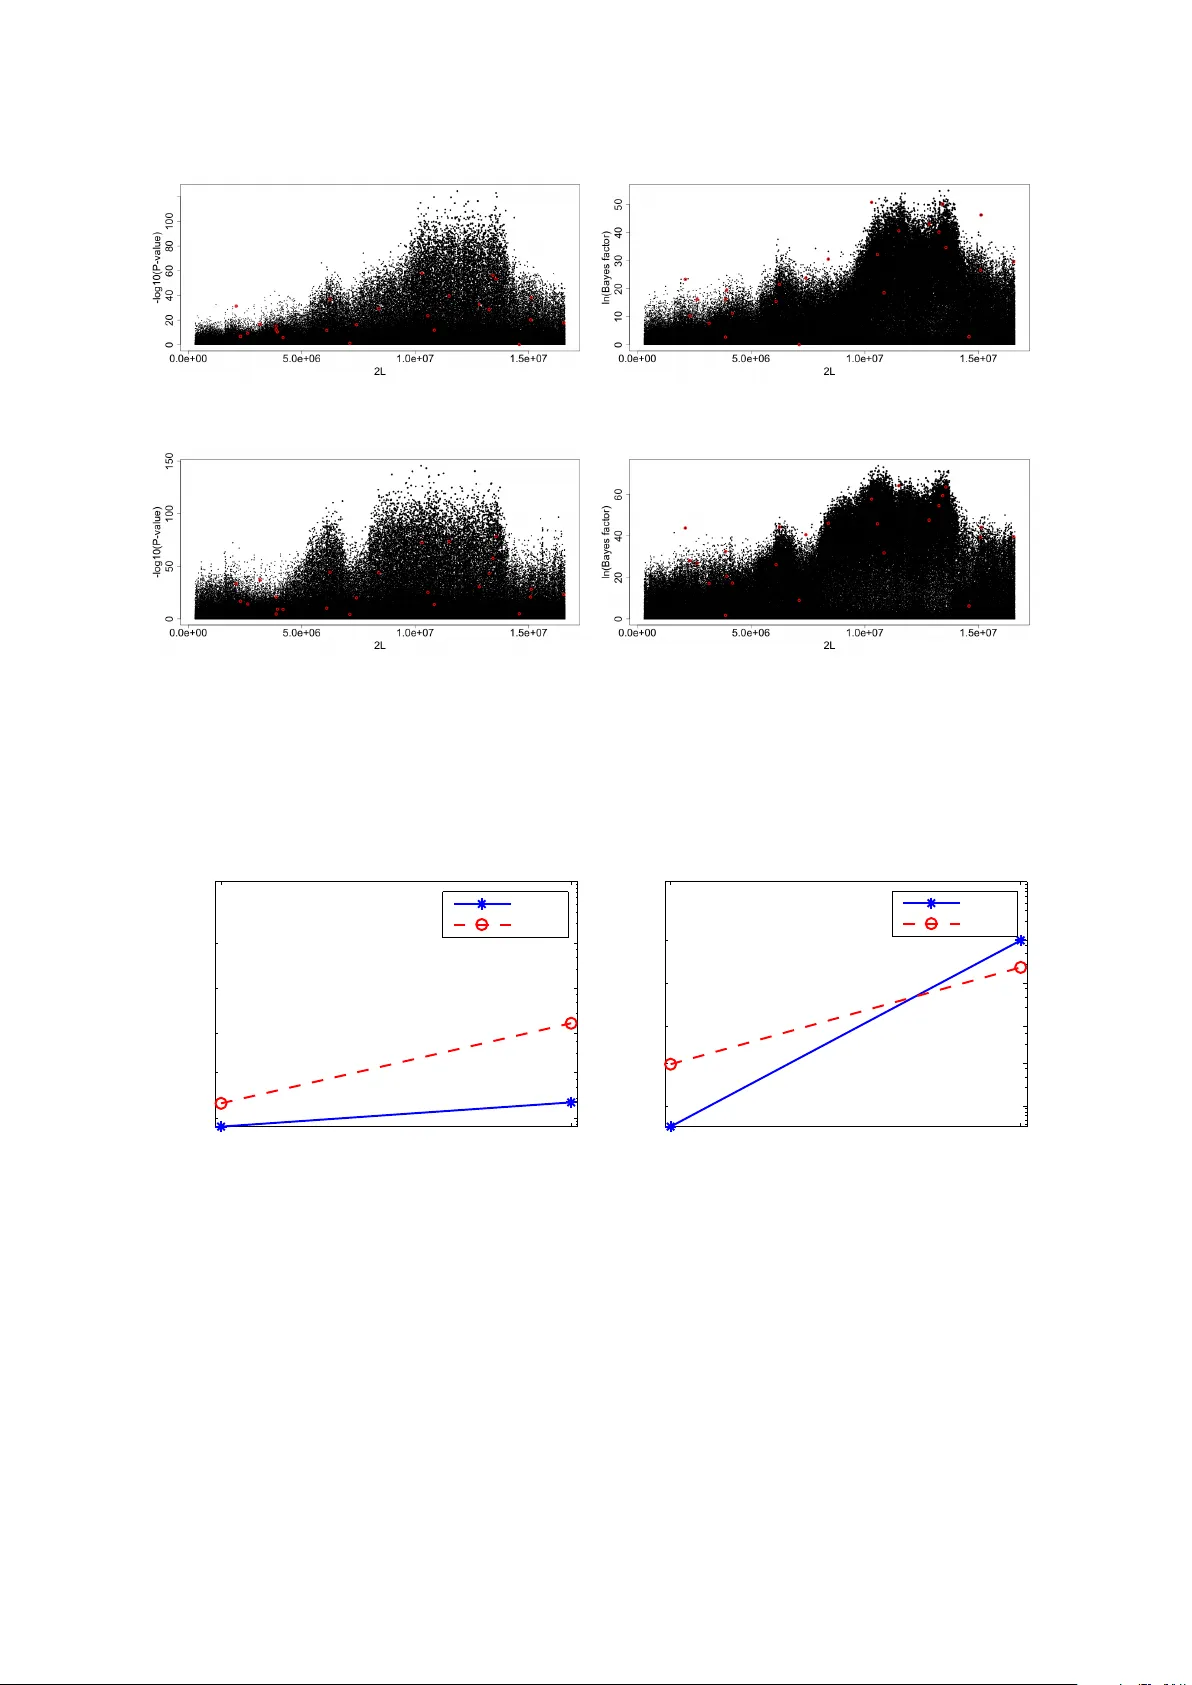
Gaussian pro cess test for high-throughput sequencing time series: application to exp erimen tal ev olution Hande T opa 1 , ∗ , ´ Agnes J´ on´ as 2 , 3 ∗ , Rob ert Kofler 2 , Carolin Kosiol 2 and An tti Honk ela 4 1 Helsinki Institute for Information T echnology HIIT, Department of Information and Computer Science, Aalto Univ ersity , Esp oo, Finland 2 Institut f ¨ ur P opulationsgenetik, V etmeduni Vienna, 1210 Wien, Austria 3 Vienna Graduate Sc ho ol of P opulation Genetics, Wien, Austria 4 Helsinki Institute for Information T echnology HIIT, Department of Computer Science, Univ ersity of Helsinki, Helsinki, Finland Abstract Motiv ation: Recen t adv ances in high-throughput sequencing (HTS) ha ve made it p ossible to monitor genomes in great detail. New exp erimen ts not only use HTS to measure genomic features at one time point but to monitor them changing ov er time with the aim of iden- tifying significant c hanges in their abundance. In p opulation genetics, for example, allele frequencies are monitored ov er time to detect significant frequency c hanges that indicate selection pressures. Previous attempts at analysing data from HTS exp erimen ts hav e b een limited as they could not simultaneously include data at intermediate time p oin ts, replicate exp erimen ts and sources of uncertaint y sp ecific to HTS such as sequencing depth. Results: W e presen t the b eta-binomial Gaussian pro cess (BBGP) mo del for ranking fea- tures with significant non-random v ariation in abundance ov er time. The features are as- sumed to represen t prop ortions, such as prop ortion of an alternative allele in a p opulation. W e use the b eta-binomial mo del to capture the uncertain ty arising from finite sequencing depth and combine it with a Gaussian pro cess mo del ov er the time series. In simulations that mimic the features of exp erimen tal evolution data, the prop osed metho d clearly out- p erforms classical testing in a v erage precision of finding selected alleles. W e also present sim ulations exploring differen t experimental design choices and results on real data from Drosophila exp erimen tal evolution exp eriment in temp erature adaptation. Av ailability: R softw are implementing the test is av ailable at https://github.com/ handetopa/BBGP . 1 In tro duction Most biological pro cesses are dynamic and analysis of time series data is necessary to understand them. Recen t adv ances in high-throughput sequencing (HTS) technologies hav e pro vided new exp erimen tal approac hes to collect genome-wide time series. F or example, exp erimen tal ev olu- tion no w uses a new ev olve and re-sequencing (ER) approach to understand whic h genes are ∗ The authors wish it to b e kno wn that in their opinion, the first tw o authors should be regarded as join t first authors. 1 targeted by selection and ho w (Burke and Long, 2012, Kaw ec ki et al. , 2012). Suc h exp erimen ts enable phenot ypic divergence to b e forced in resp onse to changes in only few environmen tal conditions in the lab oratory while other conditions are k ept constant. The evolv ed p opulations are then sub jected to HTS. Exp erimen tal ev olution in micro organisms has fo cused on the fate new m utations. F or example, in Escherichia c oli (Barric k et al. , 2009) and Sac char omyc es c er evisae (Lang et al. , 2013) new m utations w ere studied. In con trast, ER exp erimen ts with sexually reproducing m ulticellular organisms address selection on standing v ariation and allele frequency changes (AFCs) in small p opulations where drift pla ys an important role. F or example, for Dr osophila melano gaster ( Dmel ), several phenot ypic traits, suc h as accelerated dev elopment (Burk e et al. , 2010), bo dy size v ariation (T urner et al. , 2011), h yp o xia-tolerance (Zhou et al. , 2011) and temp erature adaptation (Orozco-T er W engel et al. , 2012) hav e b een in v estigated. Motiv ated by these ex- p erimen tal studies, w e b eliev e that exp erimental evolution com bined with HTS supplies a go od basis for studying AF C through time series molecular data. T o p erform allele frequency comparisons, pairwise statistical tests b et w een base and evolv ed p opulations were t ypically carried out. Burke et al. (2010) combined Fisher’s exact tests with a sliding-window approach to identify genomic regions that show allele frequency differences b et w een p opulations selected for accelerated dev elopment and controls without direct selection. T urner et al. (2011) developed a pairwise summary statistic, called ”diff-Stat” to estimate the observed distribution of allele frequency differences and compared this to the exp ected distribution without selection. Orozco-T er W engel et al. (2012) iden tify SNPs with a consistent AF C among replicates by p erforming a Co chran-Man tel-Haenszel test (CMH) (Agresti, 2002). The latter is an extension of the Fisher’s exact test to multiple replicates. All ab o ve-men tioned statistical metho ds are based on pairwise comparisons b et w een the base and ev olved populations and they do not take full adv an tage of the time series data now av ailable. Bollbac k et al. (2008) dev elop ed a metho d to analyse time series data based on p opulation genetic mo dels and estimated the effectiv e population size N e of a bacteriophage from a single lo cus. Illingworth et al. (2012) deriv ed a mo del for time series data from large p opulations of micro organisms ( N e ≈ 10 8 ) where drift can b e ignored and the p opulation allele frequencies evolv e ”quasi- deterministically”. Here, w e propose an alternative Gaussian pro cess (GP) based approach to study AF Cs o ver the entire time series exp erimen t genome-wide for small p opulations ( N e ≈ 10 2 − 10 3 ). GP is a non-parametric statistical mo del that is extremely w ell-suited for mo delling HTS time series data which usually hav e relatively few time p oin ts that ma y b e irregularly sampled. Recen tly , there hav e b een some works applying GP mo dels with parameters describing the pro cess of evolution (e.g., Jones and Moriarty, 2013 account for phylogenetic relationships, P alacios and Minin, 2013 for effective population size). GPs hav e also recen tly b een applied to gene expression time series by a num b er of authors (Y uan, 2006; Gao et al. , 2008; Kirk and Stumpf, 2009; Liu et al. , 2010; Honkela et al. , 2010; Stegle et al. , 2010; Co ok e et al. , 2011; Kalaitzis and Lawrence, 2011; Titsias et al. , 2012; Liu and Niranjan, 2012; ¨ Aij¨ o et al. , 2013; Hensman et al. , 2013). In differential analysis, GPs hav e b een applied to detect differences in gene expression time series in a t wo-sample setting by Stegle et al. (2010) and for detecting significan t changes by Kalaitzis and La wrence (2011). While these metho ds provide a very sensible basis for detecting the changing alleles, they fail to prop erly tak e into account all asp ects of the av ailable HTS data, such as differences in sequencing depth b et ween differen t alleles and time p oints. These differences can hav e a huge impact in the reliabilit y of different measured allele frequencies and taking them in to account is vital for ac hieving goo d accuracy with the a v ailable short time series. 2 2 Metho ds T o identify the candidate alleles which ev olve under selection, we mo del the allele frequencies b y Gaussian Pro cess (GP) regression. W e fit time-dep enden t and time-indep enden t GP mo dels and rank the alleles according to their corresponding Bay es factors, i.e. the ratio of the marginal lik eliho ods under the differen t mo dels. GPs pro vide a conv enien t approac h for modelling short time series. Ho wev er, when applying them to a large n umber of short parallel time series as in many genomic applications, naive application leads to ov erfitting or underfitting in some examples. While these problems are rare, the bad examples can easily dominate the ranking. W e ov ercome these challenges by excluding nonsensical parameter v alues, for example using a goo d v ariance mo del that can be incorp orated into the GP mo dels. 2.1 Data and Prepro cessing In the follo wing, w e use the term SNP for the markers and alleles under study , but the metho ds can b e applied to any features whose abundance can b e quan tified in a similar manner. W e consider SNPs that are bi-allelic for a specific p osition of the genome in a p opulation. Multi- allelic SNPs, how ev er, exist but are rare and likely to b e sequencing errors (Burke et al. , 2010). Multi-allelic cases can b e treated by simply ignoring the least frequent allele or transformed to bi-allelic site b y summing up the frequencies of the most infrequen t alleles. Here, w e assumed that only t wo of the alleles from (A, T, C, G) can b e observed at each SNP p osition. W e first determine the abundances of these t wo sp ecific alleles and we aim to mo del the time dep endency of the rising allele’s frequency ov er several generations. W e will refer to generations as time p oin ts for simplicit y . W e denote the replicate index of each observ ation by r j and the time p oin t b y t j , j = 1 , ..., J , with J denoting the total num b er of observ ations. F or eac h of these p oints, w e assume HTS reads hav e b een aligned to a reference genome with y ij reads with a sp ecific allele at SNP p osition i . W e use n ij to denote the total sequencing depth at the p osition. 2.2 Mean and V ariance Inference: Beta-Binomial Mo del W e mo del y ij as a dra w from a binomial distribution with parameters n ij and p ij : y ij | n ij , p ij ∼ Bin( n ij , p ij ) , (1) where p ij denotes the frequency of the sp ecific allele in the p opulation. W e set a uniform Beta(1,1) prior on p ij : p ij | α, β ∼ Beta( α, β ) , (2) where α = 1, β = 1. Since b eta prior is conjugate to the binomial likelihoo d, the p osterior distribution will also b e a b eta distribution: p ij | y ij , n ij , α, β ∼ Beta( α ∗ ij , β ∗ ij ) , (3) where α ∗ ij = α + y ij , β ∗ ij = β + n ij − y ij . 3 Then, the p osterior mean and v ariance of p ij can b e calculated as: E( p ij | y ij , n ij , α, β ) = α ∗ ij α ∗ ij + β ∗ ij = α + y ij α + β + n ij (4) V ar( p ij | y ij , n ij , α, β ) = α ∗ ij β ∗ ij ( α ∗ ij + β ∗ ij ) 2 ( α ∗ ij + β ∗ ij + 1) = ( α + y ij )( β + n ij − y ij ) ( α + β + n ij ) 2 ( α + β + n ij + 1) . (5) The inferred p osterior means and p osterior v ariances are used to fit the GP mo dels as describ ed in the following sections. As the results will show, this step is very imp ortan t for incorp orating the av ailable uncertain ty information in to the GP models b y taking in to account different se- quencing depths. F or example, b eta-binomial mo del assigns larger v ariances to the alleles with lo wer sequencing depths (Fig. 1). Moreov er, the Beta(1,1) prior on p ij leads to a symmetry in the p osterior mean and v ariance. Therefore, the result of our metho d is not affected whichev er allele is c hosen from the alternative alleles. 0 0.2 0.4 0.6 0.8 1 0 0.05 0.1 0.15 0.2 Frequencies Posterior standard deviation n=10 n=30 n=60 Figure 1: P osterior standard deviations of the allele frequencies with sequencing depths 10, 30, and 60. 2.3 Gaussian Pro cess Regression A Gaussian pro cess (GP) is a collection of random v ariables, any finite num b er of whic h ha ve a joint Gaussian distribution. W e write f ( t ) ∼ G P ( m ( t ) , K ( t, t 0 )) (6) to denote that f ( t ) follo ws a Gaussian pro cess with mean function m ( t ) = E[ f ( t )] and cov ariance function K ( t, t 0 ) = E[( f ( t ) − m ( t ))( f ( t 0 ) − m ( t 0 ))]. W e let y = ( y i ) N i =1 b e a v ector of the noisy observ ations measured at p oin ts t = ( t i ) N i =1 satisfying y i = f ( t i ) + , (7) where is Gaussian observ ation noise with zero mean and a diagonal cov ariance matrix Σ . T o simplify the algebra w e assume the mean function m ( t ) = 0 and subtract the mean of y . 4 Gaussian pro cesses allow marginalising the latent function to obtain a marginal likelihoo d. The co v ariance function K and the noise cov ariance Σ dep end on hyperparameters and parameters θ that can b e estimated b y maximising the log marginal likelihoo d: log( p ( y | t , θ )) = − 1 2 y T [ K ( t , t ) + Σ ] − 1 y − 1 2 log | K ( t , t ) + Σ | − N 2 log(2 π ) , (8) where K ( t , t ) denotes the co v ariance matrix constructed b y ev aluating the cov ariance function at p oints t . It is also p ossible to compute the posterior mean and cov ariance at non-sampled time p oin ts t ∗ , given the noisy observ ations y at sampled time p oin ts t . This is often useful for visualisation purp oses. W e obtain (Rasmussen and Williams, 2006): f ∗ | y ∼ N( m ∗ , Σ ∗ ) , (9) where m ∗ = E[ f ∗ | y ] = K ( t ∗ , t )[ K ( t , t ) + Σ ] − 1 y , Σ ∗ = K ( t ∗ , t ∗ ) − K ( t ∗ , t )[ K ( t , t ) + Σ ] − 1 K ( t , t ∗ ) . In our GP mo dels w e use the squared exponential cov ariance matrix to mo del the underlying smo oth function. The squared exp onen tial cov ariance K S E ( t, t 0 ) = σ 2 f e − ( t − t 0 ) 2 2 l 2 (10) has tw o parameters: the length scale, l , and the signal v ariance, σ 2 f . Length scale sp ecifies the distance beyond whic h any tw o inputs become uncorrelated. A small length scale means that the function fluctuates very quickly , whereas a large length scale means that the function b eha v es like a constant function. Three example realisations generated with squared exponential co v ariance matrix can b e seen in Fig. 2 (a). In the standard GP mo del the observ ation noise is assumed to b e white: the noise at different time p oin ts is indep enden t and iden tically distributed. The corresp onding cov ariance matrix Σ = Σ W = σ 2 n I (11) is an identit y matrix m ultiplied b y the noise v ariance parameter, σ 2 n . Three example realisations generated with white noise cov ariance matrix can b e seen in Fig. 2 (b). (a) K S E (b) Σ W (c) Σ F B B Figure 2: Example realisations from GPs and noise pro cesses with different cov ariance struc- tures. 5 2.4 BBGP: Beta-Binomial Gaussian Pro cess The Beta-Binomial Gaussian Pro cess (BBGP) metho d combines b eta-binomial mo del with the GP mo del in the sense that the p osterior means and p osterior v ariances of the frequencies, whic h are inferred b y beta-binomial mo del, are used to fit the GP mo del using an additional noise co v ariance matrix which we call fixed b eta-binomial (FBB) cov ariance matrix. Returning to Sec. 2.2, let us denote the p osterior mean and v ariance of p ij b y m ij and s 2 ij , resp ectiv ely . That is, m ij = E( p ij | y ij , n ij , α, β ) (12) s 2 ij = V ar( p ij | y ij , n ij , α, β ) . (13) T o fit the BBPG mo del, w e assume m ij = f i ( t j ) + µ m i + , (14) where f i ( t ) ∼ G P (0 , K S E ( t, t 0 )) and ∼ N (0 , Σ W + Σ F B B ). The mean µ m i is eliminated by subtracting the mean from m ij . Because of Σ F B B this is an approximation that may fail if n ij v ary significantly , but it sp eeds up inference significantly . The additional cov ariance Σ F B B = diag( s 2 ij ) (15) is a diagonal fixed b eta-binomial (FBB) cov ariance matrix which is used to include known v ari- ance information for eac h observ ation in the GP mo del. The elements of Σ F B B are determined b y the frequency v ariance vector which is inferred from b eta-binomial mo del in Sec. 2.2. Three example realisations generated with fixed b eta-binomial cov ariance matrix can b e seen in Fig. 2 (c), where larger v ariance v alues w ere inferred for the later time p oin ts. f i ( t 1 ) ... f i ( t j ) ... f i ( t J ) m i 1 m ij ... ... m iJ µ m i σ 2 n (a) Time-dependent mo del m i 1 ... m ij ... m iJ µ m i σ 2 n (b) Time-independent mo del Figure 3: Graphical models for the (a) time-dep enden t and (b) time-indep enden t BBGP models. 2.5 BBGP-based test W e fit the “time-dependent” BBGP mo del of Eq. (14) and a “time-independent” model without the GP term f i ( t j ) for each SNP i . As can b e seen from the graphical mo dels in Fig. 3, “time- indep enden t” mo del assumes that the observ ations are randomly generated around a constant mean with no temporal dep endency , whereas “time-dep enden t” mo del captures the dependency b et w een the observ ations b y the function f i ( t ), whic h follo ws a GP with the squared exponential co v ariance function. Thereb y the parameters of the squared exp onen tial cov ariance ( K S E , 6 Eq. 10) in the time-dep enden t mo del and the white noise cov ariance (Σ W , Eq. 11) in b oth mo dels are fitted by maximising the marginal lik eliho od. The fixed beta-binomial co v ariance (Σ F B B , Eq. 15) do es not contain any free h yp erparameters. If the mo del is actually time- indep enden t, the length scale in the squared exp onential cov ariance is estimated to b e v ery large, which makes the maximum likelihoo d of the time-dep enden t mo del equiv alent to that of time-indep enden t mo del. Fig. 4 shows an example of the time-dep enden t (left) and time- indep enden t (right) BBGP mo dels. W e maximise the log marginal likelihoo d functions for the mo dels by scaled conjugate gradien t metho d using the “gptk” R pack age b y Kalaitzis and La wrence (2011). W e use a grid searc h o ver the parameter space and initialise the parameters to the grid v alue with highest likelihoo d. W e also set a low er b ound equal to the shortest spacing b et ween observ ations for the length scale parameter to a void ov erfitting. W e compute the Bay es factor (BF) for SNP i as (Stegle et al. , 2010; Kalaitzis and La wrence, 2011): BF i = p ( m i | ˆ θ 1 , “time-dep enden t mo del”) p ( m i | ˆ θ 2 , “time-indep enden t mo del”) , (16) where ˆ θ 1 and ˆ θ 2 con tain the maximum likelihoo d estimates of the h yp erparameters in the corresp onding BBGP mo dels. Ba yes factors indicate the degree of the mo dels to b e “time- dep enden t” rather than “time-indep enden t”. Time Frequencies ● ● ● ● ● ● ● ● ● ● ● ● ● ● ● ● ● ● ● ● Log−likelihood: 11.71 0 15 23 27 37 0.0 0.2 0.4 0.6 0.8 1.0 Time Frequencies ● ● ● ● ● ● ● ● ● ● ● ● ● ● ● ● ● ● ● ● Log−likelihood: 1.01 0 15 23 27 37 0.0 0.2 0.4 0.6 0.8 1.0 Time-dep enden t mo del: Time-indep enden t mo del: m ij = f i ( t j ) + µ m i + m ij = µ m i + Figure 4: BBGP fits for the time-dep enden t and time-indep enden t mo dels for an example SNP taken from the real data set (Orozco-T er W engel et al. , 2012). Confidence regions are sho wn for ± 2 standard deviation. Similarly , error bars indicate ± 2 standard deviation (from FBB) in terv al. Replicates at the same time p oin ts are shifted b y 0.5 for better visualisation. Maxim um lik eliho od estimates of the parameters: ˆ θ 1 = { ˆ ` = 15 . 53, ˆ σ 2 f = 0 . 05, ˆ σ 2 n = 3 . 6 × 10 − 8 } ; ˆ θ 2 = { ˆ σ 2 n = 0 . 05 } . 2.6 Co c hran-Man tel-Haenszel T est W e compare BBPG against the Co chran-Man tel-Haenszel test (CMH), whic h was used by Orozco-T er W engel et al. (2012) to iden tify alleles with consisten t allele frequency c hange across replicates. The CMH test has b een prov en to b e the b est-p erforming test statistic applied on HTS evolutionary data so far (Kofler and Sc hl¨ otterer, 2014). Therefore, we take it as the basis of comparison with BBGP . CMH allows to test whether the joint o dds ratio of replicated ( r = 1 , . . . , R ) allele counts in a 2 × 2 × R contingency table (T ab. 1) is significantly different from one. Significan t deviation 7 Base gen. (B) End gen. (E) P SNP i allele 1 y (1) iB r y (1) iE r y (1) i. r SNP i allele 2 y (2) iB r y (2) iE r y (2) i. r P n iB r n iE r n i. r T able 1: 2 × 2 contingency table of allele counts for the r -th replicate. from one implies dependence of allele counts b et w een t w o time p oin ts that is consistent among replicates. The CMH tests pairwise observ ations of the tw o alternativ e allele coun ts y (1) ij and y (2) ij . In our bi-allelic case y (1) ij = y ij and y (2) ij = n ij − y ij . T o compare the coun ts for all replicates r = 1 , . . . , R at the base (B) and the end (E) time p oin ts for eac h SNP p osition i , w e denote B r = { j | t j = B , r j = r } and E r = { j | t j = E , r j = r } . The CMH test statistic (see Agresti (2002) and Section A.1) compares the cell counts in T ab. 1 to their null exp ected v alues and it follo ws a chi-squared distribution with one degree of freedom χ 2 ( d f =1) . W e p erformed CMH tests on the sim ulated and real data for each SNP p osition indep enden tly , using the implementati on of the soft ware PoP o olation2 (Kofler et al. , 2011). 2.7 Sim ulations T o ev aluate the p erformances of the BBGP and the CMH tests, we simulated data that mimics the dynamics of evolving Dmel p opulations at the ge nomic level. F or this aim, w e first simulated three sets of genome-scale data to ev aluate the ov e rall p erformances of the metho ds under the exp erimen tal design whic h is close to the natural settings. Additionally , we also carried out smaller size sim ulations on one c hromosome arm to in vestigate the further influences of differen t parameter settings on the metho ds. Whole-genome simulations W e carried out forw ard W righ t-Fisher simulations of genome- wide allele frequency tra jectories of p opulations using the MimicrEE simulation to ol (Kofler and Sc hl¨ otterer, 2014). The initial haplot yp es w ere tak en from Kofler and Sc hl¨ otterer (2014) and they capture the natural v ariation of Dmel p opulation. By sampling from the initial set, w e established r = 5 replicated base p opulations using H = 200 founder haplotypes and let eac h of them ev olv e for g = 60 generations at a constan t census size of N = 1000. W e used the spatially v arying recombination rate defined for Dmel by Fiston-Lavier et al. (2010). Low recom bining regions were excluded from the sim ulations b ecause of the elev ated false p ositiv e rate in these regions (Kofler and Schl¨ otterer, 2014). W e follow ed the evolution of the total n umber of 1,939,941 autosomal SNPs among whic h 100 were selected with selection co efficien t of s = 0 . 1 and semi-dominance ( h = 0 . 5). F urthermore, we required the selected SNPs to hav e a starting frequency in the range [0 . 12 , 0 . 8], not to lose the minor allele in the course of time due to drift. W e recorded the nucleotide counts for every second generation and p erformed P oisson sampling with λ = 45 (ov erall mean cov erage in Orozco-T er W engel et al. , 2012) on the count data to pro duce cov erage information (see Section A.2). W e rep eated the whole sim ulation exp erimen t three times, eac h time using a different set of selected SNPs. Single-c hromosome-arm simulations F or exp erimen tal design, additional sim ulations were carried out on a single chromosome arm ( ∼ 16Mb) with 25 selected SNPs to assess the p erfor- mance under v arious parameter combin ations, such as p opulation size ( N ), num b er of founder haplot yp es ( H ), selection co efficien t ( s ), lev el of dominance ( h ), num b er of generations ( g ) and 8 n umber of replicates ( r ). W e defined a basic set up with parameter space close to that of the whole genome simulations, i.e., N = 1000 , H = 200 , r = 5 , g = 60 , s = 0 . 1 , h = 0 . 5, and in- v estigated the effect on the p erformance when only one parameter is p erturb ed from its basic v alue. 2.8 Ev aluation Metrics The metho ds were ev aluated based on precision, recall and av erage precision (AP) (Manning et al. , 2008). Precision and recall are commonly used metrics to measure the fraction of relev ant items that are retrieved when comparing ranking based metho ds. Precision and recall are defined as pr e ( k ) = numb er of sele cte d SNPs in k top SNPs k , (17) r ec ( k ) = numb er of sele cte d SNPs in k top SNPs numb er of sele cte d SNPs . (18) The curv e obtained by plotting the precision at every p osition in the ranked sequence of items as a function of recall is called the precision-recall curve. The area under the curve can b e summarised using the av erage precision (Manning et al. , 2008), which is defined as the av erage of pr e ( k ) after every returned selected SNP: av eP = P N k =1 ( pr e ( k ) 1 sel ( k )) numb er of sele cte d SNPs , (19) where N is the total num b er of SNPs and 1 sel ( k ) = ( 1 , if item at rank k is a selected SNP , 0 , otherwise . (20) 3 Results 3.1 Sim ulated Whole Genome Data W e applied the BBGP and CMH genome-wide on the simulated data with different num b ers of time p oin ts (i.e., generations) and replicates. T o ev aluate the effect of the n umber of time p oin ts used, we tested the metho d using subsets of different sizes of the nine time p oin ts { 0 , 6 , 14 , 22 , 28 , 38 , 44 , 50 , 60 } (see Section A.3 for details). W e p erformed BBGP separately for eac h of the sampling sc hemes while CMH can only use t wo time p oin ts (first and last). All sim ulated SNPs were scored using Bay es factors for the BBGP , and p -v alues for the CMH test (e.g., see Fig. 8 for a graphical visualisation of the scores). T o in vestigate the effect of the n umber of replicates ( r ), we chose up to five replicates at eac h sampled time p oin t. W e first p erformed CMH tests with all p ossible r -replicate combinations. W e then applied BBGP only to the b est-performing replicate combinations of each size according to av erage precision in the CMH ev aluations. This strategy ensures a fair comparison b et w een the methods as BBGP is alwa ys ev aluated against the best CMH results. W e also compared BBGP to the standard GP of Kalaitzis and Lawrence (2011) that do es not use the fixed b eta- binomial mo del v ariances using the same replicate com binations as BBGP with 6 time p oin ts. 9 2 3 4 5 0 0.01 0.02 0.03 0.04 0.05 0.06 0.07 Number of replicates Average precision BBGP, t=9 BBGP, t=6 BBGP, t=3 GP, t=6 CMH CMH (mean AP) Figure 5: A ver age pr e cisions (AP) for CMH, BBGP, and standar d GP with differ ent numb er of r eplic ates. The used replicates hav e b een selected as the b est-p erforming r -replicate combi- nations in the CMH test, except for the CMH mean AP which has b een computed b y taking the mean of the av erage precisions ov er all r -replicate combinations for r = 2 , 3 , 4 , 5. The corresp onding precision-recall curves are shown in Figs. 9 and 10. As sho wn in Fig. 5 (see also Fig. 9, Fig. 10), BBGP achiev es a higher av erage precision th an the standard GP and the CMH. Somewhat surprisingly , CMH seems to b enefit very little from more replicates while the p erformance of the GP metho ds impro v es noticeably . The CMH is very sensitive to the sp ecific replicates included, as including the fifth replicate in the optimal sequence actually leads to worse p erformance than four replicates (Fig. 10 (c-d)). W e did not observ e similar behaviour with the GP metho ds. On av erage ov er all possible r - replicate com binations, adding more replicates helps the CMH as well (mean AP in Fig. 5). The p erformance of the standard GP approaches that of BBGP as the num b er of replicates increases, whic h is consistent with the view that the stronger prior information from sequencing depth is most important when the data are otherwise scarce, as is often the case in real experiments. In contrast to more replicates, adding more time p oints impro v ed the BBGP p erformance very little (Fig. 5). W e also in vestigated whether the t wo methods identify differen t t yp es of selected SNPs. W e calculated allele frequency change (AF C) for each SNP based on the a verage difference b et w een the base and end p opulations across replicates. The CMH is very sensitive to large AFCs, while the candidates detected b y the BBGP hav e a muc h more uniform distribution of AF Cs (Fig. 12). In general, w e would exp ect a uniform distribution of AFCs, as very large AFCs are only p ossible for SNPs with low starting frequency giving them the p otential to rapidly increase. BBGP is muc h more accurate than CMH in all AFC classes as demonstrated by the p erformance breakdown in Fig. 13. F urthermore, we p erformed a generalised CMH test (gCMH) that can b e applied to more than t wo time p oin ts but requires a proper w eigh ting sc heme (Section A.1.1). As there is no straigh tforward w ay to find weigh ts that accurately reflect natural selection, we used mid-ranks assigned to time p oin ts. With three time p oin ts, the gCMH does best, ho wev er, the performance drops with increasing num b er of time p oints (Fig. 14). W e also see a precision decline as the n umber of replicates rises (Fig. 14), which is consisten t with our previous observ ation that is the CMH is v ery sensitive to inconsistency among replicates. The p erformance of the metho ds can v ary noticeably b et ween different exp erimen ts dep ending on their difficulty . F or example, there is a 10-fold difference in AP b etw een Exp erimen t 1 and 10 Exp erimen t 3 for b oth metho ds (Fig. 11, see also Kofler and Sc hl¨ otterer (2014) for the CMH), but the BBGP-based test consistently outp erforms the CMH test. The running time needed to analyse 1000 SNPs in a 4 replicates- 6 time p oin ts setting is ≈ 30 min utes on a desktop running Ubuntu 12.04 with Intel(R) Xeon(R) CPU E3-1230 V2 at 3.30GHz. 3.2 Influence of Parameter Choice W e hav e shown ab o v e that for simulated data with realistic parameters, our metho d can b e applied on a genome-wide lev el. F or the purpose of exp erimen tal design, w e also inv estigated further parameter settings on the single chromosome arm of 2L. 3.2.1 P opulation size and n um b er of founder haplotypes In finite p opulations, genetic drift has a large impact on shaping the p opulation allele frequen- cies. W e studied the effect of census p opulations size ( N ) and the n um b er of founder haplot yp es ( H ) on our metho d. H can b e though t as the num b er of differen t individuals (isofemale lines) in the base p opulation. The p opulations w ere established by randomly choosing N individuals with replacement out of the H founders. The simulation results sho w that AP increases with increasing N (Fig. 6 (a)). This has also b een observed by Kofler and Schl¨ otterer (2014) for the CMH test. The AP is the highest with the ratio of H / N = 0 . 5 in all cases (Fig. 6 (a), Figs. 15-17) and the BBGP consisten tly outp erforms the CMH test. Kofler and Schl¨ otterer (2014) rep orted that the true p ositiv e rate for CMH test increases with H but the incremen t lev els off with H / N = 0 . 5 for N = 1000. Baldwin-Bro wn et al. (2014) detected a constant increase in the pow er to lo calise a candidate SNP , how ev er, they used a differen t method and in vestigated differen t parameter settings not comparable to ours. W e hypothesise that as more lo w frequency v ariants are presen t in the p opulation with H / N > 0 . 5, the selected SNPs with m ultiple linked backgrounds are comp eting with eac h other, resulting in an AP drop. 3.2.2 Selection strength and lev el of dominance W e inv estigated the performance using v arious selection co efficien ts ( s ) and fixed semidominance ( h = 0 . 5). F or mo derate and strong selection ( s > 0 . 01), the BBGP outp erforms the CMH test (Figs. 6 (b), 18). The BBGP reac hes the highest precision at s = 0 . 1, whereas the CMH test is the most precise at s = 0 . 05 which is consisten t with Kofler and Schl¨ otterer (2014). F or strong selection ( s = 0 . 2) the precision drops for b oth metho ds. The p erformance decay is presumably due to interference b et ween selected sites, known as the Hill-Rob ertson effect, i.e., link age b et w een sites under selection will reduce the o v erall effectiv eness of selection in finite p opulations (Hill and Rob ertson, 1966). Also, w e hypothesise that long-range asso ciations b ecome more apparent as the strength of selection increases (Fig. 19) resulting in larger blo cks rising in frequency together, whic h was also observed by T obler et al. (2014). F or w eak selection ( s ≤ 0 . 01), it b ecomes hard to distinguish b et ween selection and drift in small p opulations. Th us, for low s , b oth metho ds p erform rather p o orly and the CMH has a slightly higher AP in these cases. Ho wev er, for a more ideal parameter choice of N = 5000 , H = 2500 and a long run time of the exp erimen t ( g = 120), the BBGP gains a large p erformance improv emen t o ver the CMH test for s = 0 . 01 (see Figs. 20, 21) even in the difficult scenario of weak selection. 11 0.02 0.04 0.1 0.2 0.5 1 1 10 40 160 640 H/N AP x 10 3 BBGP, N=5000 CMH, N=5000 BBGP, N=1000 CMH, N=1000 BBGP, N=200 CMH, N=200 (a) P opulation size 0.005 0.01 0.050.07 0.1 0.14 0.2 0.02 0.05 0.1 0.2 0.5 1 2 5 s AP x 10 3 BBGP CMH (b) Selection strength 2 3 4 5 6 7 8 9 10 11 12 13 14 15 0.3 1 2 4 8 16 r AP x 10 3 BBGP CMH (c) Num b er of replicates 30 60 120 0.25 0.5 1 2 g AP x 10 3 BBGP, t=9 BBGP, t=6 BBGP, t=3 CMH (d) Time p oin ts and spacing Figure 6: Aver age pr e cision for differ ent exp erimental designs. Log scale was used on b oth axes for (a), (b), (d), and on the y -axis for (c). Other parameters are as in the basic setup in Section 2.7. W e also sim ulated evolving p opulations using different lev el of dominance. The following relative fitness v alues were used on genotypes AA, Aa and aa : w AA = 1 + s, w Aa = 1 + hs, w aa = 1, where s = 0 . 1. As the level of dominance ( h ) v aries, w e observed differen t b ehaviour of the metho ds. The AP of the CMH test increases as w e are mo ving from complete recessivit y ( h = 0, recessiv e phenot yp e is selected) to complete dominance ( h = 1, dominan t phenot yp e is selected) (Figs. 22, 23). Selection on completely recessive allele results in a gradual initial c hange in AF with more rapid c hange in later generations and even tual fixation. On the other hand, the c hange in AF of a completely dominant allele is initially rapid but nev er reaches fixation since the recessive allele is shielded from natural selection in the heterozygote. When the fitness of the heterozygote is intermediate b et w een the t w o homozygotes (additivit y , h = 0 . 5) the allele frequency tra jectory is the combination of the ab o v e mentioned ones, i.e., rapid initial change and quic k fixation. BBGP reaches the highest AP with the additive scenario and relativ ely high AP in the recessive case (Fig. 22). When the dominant phenot yp e is selected ( h ∼ 1) and the unfa voured allele stays presen t in the population at low frequency , it is likely to result in an inconsisten t b eha viour of replicates, which low er the p ow er of the BBGP . 3.2.3 Num b er of replicates In addition to the whole-genome exp eriments with a maximum of 5 replicates, we sim ulated up to r = 15 replicates for the single c hromosome arm. W e observed a constant increase in p erformance for the BBGP up to r = 6 (Figs. 6(c), 24). The AP kept increasing up to r = 12 but rather in a fluctuating manner and then dropp ed with adding even more replicates. Consisten tly with the whole-genome sim ulations, w e did not observe a large p erformance impro vemen t with 12 increasing the n umber of replicates for the CMH test. 3.2.4 Length of the experiment and spacing of the samples W e also examined the p erformance with increasing the length of the exp erimen ts up to g = 120 generations. F or longer exp erimen ts, more recom bination e v ents can happ en, whic h uncouples link ed sites letting them evolv e indep enden tly . The AP rises rapidly for longer exp erimen ts (Figs. 6(d), 25). Thereby the p erformance gain is noticeably higher for the BBGP . W e also in vestigated the spacing of the sampled time p oin ts ( t ∈ { 3 , 6 , 9 } ) for the BBGP and observed similar pattern that of the whole-genome sim ulations, i.e., an in termediate num b er of sample time p oin ts is sufficien t as shap e of selected tra jectories is simple. 3.3 Real Data Application Orozco-T er W engel et al. (2012) applied the ev olve and re-sequencing with HTS on Dmel p opula- tions adapting to elev ated temp erature regime to iden tify evolutionary tra jectories of selectively fa voured alleles. They established replicated base p opulations from isofemale lines collected in P ortugal. The p opulations w ere propagated at a constan t size of 1000 for 37 generations under fluctuating temp erature regime (12h at 18 ◦ C and 12h at 28 ◦ C). DNA p ool of 500 females (P o ol-Seq) w as extracted and sequenced in multiple replicates at the following time p oin ts: three replicates at the base generation 0 (B); tw o replicates at generation 15, an additional replicate at generation 23 and at generation 27; three replicates at the end generation 37 (E). CMH tests w ere p erformed on a SNP-wise basis to identify significant allele frequency changes b et w een th e B and E p opulations (see Orozco-T er W engel et al. (2012) and Section A.4). W e ap- plied the BBGP metho d on 1,547,765 SNPs from the experiment and compared the results with that of the B-E comparison of the CMH test. The o v erlap betw een the top 2000 candidate SNPs of the CMH and the BBGP w as rather small (524 SNPs). How ever, the p eaks of b oth metho ds co vered the same regions (Fig. 7). Using a gene set enrichmen t analysis (see Section A.5), we also found that the top rank ed significantly enric hed Gene On tology categories w ere similar for b oth tests (T abs. 4, 5, Fig. 26). F urthermore, Fig. 7 shows ho w well the posterior b eta-binomial v ariance inference can handle false signals resulting from uneven co v erage. While the CMH test is mislead by strong signal coming from high co verage of the c horion cluster with high copy n umber v ariation, the BBGP test do es not falsely indicate signatures of selection (Fig. 7, green region on 3L). Although Dmel generally has rather small levels of link age, link age disequilibrium (LD) might ha ve built up during the course of the experiment. In fact, LD had a ma jor effect on the n umber of candidate SNPs iden tified b y the CMH as w ell as the BBGP based test. As the flanking SNPs sho wed signs of hi tchhiking, the observ ed AF C of the flanking SNPs w ere also significant (see also Manhattan plot for the simulated SNPs, Fig. 8) and this made it difficult to narro w do wn functionally imp ortan t regions for thermoadaptation. 4 Discussion Our results in detecting SNPs that are ev olving under selection using a GP mo del clearly demonstrate the imp ortance of careful mo delling of the measurement uncertain t y through a go o d noise mo del, in our case using the beta-binomial mo del of sequencing data. Especially when 13 (a) Genome-wide distribution of CMH -log( p -v alues). (b) Genome-wide distribution of BBGP ln(Ba yes fac- tors). Figure 7: Manhattan plots of genome-wide SNP-values. (a) − log 10 ( p -v alues) for the CMH test B-E comparison. p -v alues b elo w 1e-30 were clipp ed to 1e-30 on the plot. (b) ln(Bay es factors) for the BBGP . Only those SNPs are indicated for whic h w e calculated b oth the p -v alues and the Ba yes factors (w e did not infer Bay es factors for fixed SNPs). A 1 Mb region w as excluded from the analysis on 3R as a low frequency haplot ype spreads during the exp erimen t. Previously , the chorion gene cluster on 3L was also excluded as this region has extremely high co verage (Orozco-T er W engel et al. , 2012). Regions that were excluded from the analysis are sho wn in green. The red horizontal line indicates the top 2000 candidate cutoff. The common candidates among the top 2000 are highligh ted in magen ta. Figure (b) sho ws ho w w ell the b eta-binomial v ariance control can handle high cov erage problem of the excluded region on 3L. data are scarce, the BBGP approac h leads to muc h higher accuracy than standard maxim um lik eliho od estimation of noise v ariances. Incorp orating the non-Gaussian likelihoo d directly to the GP would also be p ossible, but it would lead to computationally more demanding inference. In terms of exp erimen tal design, the most effective wa y to impro ve p erformance is to use a larger p opulation ( N ) and a larger num b er of founder haplotypes ( H ). As exp ected, alleles under mo derate to strong selection ( s = 0.05-0.1) are easier to detect than alleles changing under weak selection ( s ≤ 0 . 01). How ev er, for v ery strong selection ( s ≥ 0 . 2), it is again hard to detect the causal SNPs. In a real exp erimen t the strength of selection migh t also not b e known and often cannot b e changed for the trait of in terest. Adding more replicates can also help improv e p erformance up to some p oin t. Compared to the CMH test, the BBGP is clearly superior in utilising additional replicates. W e susp ect this is b ecause CMH assumes all replicates should ha ve similar odds ratios b et w een the tw o time points and this is not sufficiently satisfied b y the noisy data. Longer exp erimen ts can help significantly (Fig. 20), but the b enefit of adding more in termediate time p oints seems s maller. This may b e b ecause the shap e of selected tra jectories is a simple sigmoid and adding more p oin ts pro vides limited help in estimating them. The presented GP-based test is sensitiv e to SNPs with a consistent time-v arying profile. A statistically more accurate mo del could b e deriv ed by assuming each replicate to follow an indep enden t GP , but this would require differen t kind of constrain ts to differentiate b et ween selection and drift, which may b e difficult to formulate for multiple interacting SNPs whic h do not follo w a simple parametric mo del. Exploring hierarchical GP mo dels to capture the correct dep endence structure in a sensible test is an in teresting av enue of future research. In a whole-genome exp erimen t, link age disequilibrium b et w een nearby mark ers and interactions b et w een nearb y selected SNPs are imp ortant confounders in identifying the selected markers. 14 Based on our simulations, w e b eliev e that esp ecially for mo derate-sized p opulations the inter- actions can b e quite problematic, leading to v ery large segmen ts in the genome raising together in frequency (Fig. 19). The issue do es not app ear when simulating only a single selected SNP (Fig. 27), which strongly suggests it is caused by the interactions. The issue can b e most effec- tiv ely mitigated by using larger p opulations (Fig. 28 (c-d)). An artificially high recom bination rate (Fig. 28 (a-b)) could also break the interactions. W orking with larger fixed windo w sizes migh t not improv e the p erfomance as a substan tial n umber of hitchhik ers can still b e found h undereds of kb from the selected SNPs (See Fig. 29: The remov al of nearb y hitc hhikers did not impro ve the av erage precision noticeably). It is p ossible to extend the GP mo dels for join t analysis of m ultiple SNPs, and this is clearly an imp ortan t av en ue of future research. This is p oten tially a further adv antage of the GP , b ecause it is muc h more difficult to similarly extend the frequen tist tests. 5 Conclusion In this pap er, we dev elop ed a new test that is based on combining GP mo dels with a b eta- binomial model of sequencing data, and compared it with the CMH test that allo ws the pairwise comparison of base and ev olved p opulations across sev eral replicates. Our results demonstrate that GP mo dels are well-suited for analysing quantitativ e genomic time series data b ecause they can effectively utilise the a v ailable data, making go od use of additional time p oin ts and replicates unhindered by unev en sampling and consistently sho w p erformance sup erior to the CMH test. The GP framew ork is v ery flexible which enables extensions utilising for example link age disequi- librium o ver nearby alleles. As GP mo dels can easily incorp orate additional information on the data, w e en visage that further promising com binations of the GP approac h with ev olutionary mo dels will emerge. Ac kno wledgemen t C.K. w ould like to thank the Institute of Pure and Applied Mathematics (IP AM) for a stay at the Genomics programme at whic h the idea of w orking on ev olutionary time series data ev olved. F unding: The work w as supp orted under the Europ ean ERASysBio+ initiative pro ject “SYN- ER GY” through the Academ y of Finland [135311]. A.H. w as also supp orted by the Academ y of Finland [259440] and H.T. was supp orted b y Alfred Kordelin F oundation. A.J. is mem ber of the Vienna Graduate School of Population Genetics which is supp orted b y a grant of the Austrian Science F und (FWF) [W1225-B20]. References Agresti, A. (2002). Cate goric al Data Analysis . Wiley , New Y ork. ¨ Aij¨ o, T et al. (2013). Sorad: a systems biology approach to predict and mo dulate dynamic signaling path wa y response from phosphoproteome time-course measurements. Bioinformatics , 29 (10), 1283–1291. Ashburner, M et al. (2000). Gene ontology: to ol for the unification of biology . Nat Genet , 25 (1), 25–29. 15 Baldwin-Brown, JG et al. (2014). The pow er to detect quan titativ e trait loci using resequenced, experimentally ev olv ed populations of diploid, sexual organisms. Mol Biol Evol , 31 (4), 1040–1055. Barrick, JE et al. (2009). Genome evolution and adaptation in a long-term experiment with escherichia coli. Natur e , 461 (7268), 1243–1247. Bollback, JP et al. (2008). Estimation of 2Nes from temporal allele frequency data. Genetics , 179 (1), 497–502. Burke, M et al. (2010). Genome-wide analysis of a long-term evolution exp eriment with Drosophila. Natur e , 467 , 587–590. Burke, M. K. and Long, A. (2012). What paths do adv antageous alleles take during short-term evolutionary change? Mole cular Ec olo gy , 21 , 4913–416. Cooke, EJ et al. (2011). Bay esian hierarchical clustering for microarray time series data with replicates and outlier measurements. BMC Bioinformatics , 12 , 399. Fiston-Lavier, AS et al. (2010). Drosophila melanogaster recombination rate calculator. Gene , 463 (1-2), 18–20. F riendly , M. (2014). vc dExtr a: vc d extensions and additions . R pack age version 0.6-0. Gao, P et al. (2008). Gaussian process mo delling of laten t chemical species: applications to inferring transcription factor activities. Bioinformatics , 24 (16), i70–i75. Hensman, J et al. (2013). Hierarchical Bay esian mo delling of gene expression time series across irregularly sampled replicates and clusters. BMC Bioinformatics , 14 , 252. Hill, W. G. and Rob ertson, A. (1966). The effect of link age on limits to artificial selection. Genet R es , 8 (3), 269–294. Honkela, A et al. (2010). Mo del-based metho d for transcription factor target identification with limited data. Pr o c Natl Ac ad Sci U S A , 107 (17), 7793–7798. Illingworth, CJR et al. (2012). Quantifying selection acting on a complex trait using allele frequency time series data. Mol Biol Evol , 29 (4), 1187–1197. Jones, N. S. and Moriarty , J. (2013). Evolutionary inference for function-v alued traits: Gaussian pro cess regression on phylog enies. J R So c Interface , 10 (78), 20120616. Kalaitzis, A. A. and Lawrence, N. D. (2011). A simple approach to ranking differentially expressed gene expression time courses through Gaussian pro cess regression. BMC Bioinformatics , 12 , 180. Kaw ec ki, TJ et al. (2012). Exp erimen tal evolution. T rends Ec ol Evol , 27 (10), 547–560. Kimura, M. (1962). On the probability of fixation of mutan t genes in a p opulation. Genetics , 47 , 713–719. Kirk, P . D. W. and Stumpf, M. P . H. (2009). Gaussian pro cess regression b ootstrapping: exploring the effects of uncertaint y in time course data. Bioinformatics , 25 (10), 1300–1306. Kofler, R. and Schl¨ otterer, C. (2012). Gowinda: unbiased analysis of gene set enrichmen t for genome-wide association studies. Bioinformatics , 28 , 2084–2085. Kofler, R. and Schl¨ otterer, C. (2014). A guide for the design of evolve and resequencing studies. Mol Biol Evol , 31 (2), 474–483. Kofler, R et al. (2011). PoP oolation2: identifying differentiation between p opulations using sequencing of po oled DNA samples (Pool-Seq). Bioinformatics , 27 , 3435–3436. Kuritz, SJ et al. (1988). A general overview of mantel-haenszel metho ds: applications and recent developments. Annu Rev Public He alth , 9 , 123–160. Lang, GI et al. (2013). Perv asiv e genetic hitc hhiking and clonal interference in fort y ev olving y east populations. Nature , 500 (7464), 571–574. Liu, Q et al. (2010). Estimating replicate time shifts using Gaussian process regression. Bioinformatics , 26 (6), 770–776. Liu, W. and Niranjan, M. (2012). Gaussian pro cess mo delling for bicoid mRNA regulation in spatio-temp oral Bicoid profile. Bioinformatics , 28 (3), 366–372. Manning, CD et al. (2008). Intr o duction to Information Retrieval . Cam bridge Universit y Press. Orozco-T er W engel, P et al. (2012). Adaptation of Drosophila to a novel laboratory environmen t reveals temp orally heterogeneous tra jectories of selected alleles. Mole cular Ec ology , 21 , 4931–4941. Palacios, J. A. and Minin, V. N. ( 2013). Gaussian pro cess-based Bayesian nonparametric inference of p opulation size tra jectories from gene genealogies. Biometrics , 69 (1), 8–18. Rasmussen, C. E. and Williams, C. K. I. (2006). Gaussian Pr o c esses for Machine Le arning . The MIT Press. 16 Segr` e, A et al. (2010). Common inherited v ariation in mito c hondrial genes is not enriched for associations with type 2 diab etes or related glycemic traits. PL oS Genet. , 6 , e1001058. doi:10.1371/journal.pgen.1001058. Stegle, O et al. (2010). A robust Bay esian two-sample test for detecting interv als of differential gene expression in microarray time series. J Comput Biol , 17 (3), 355–367. Titsias, MK et al. (2012). Identifying targets of m ultiple co-regulating transcription factors from expression time-series b y Ba yesian model comparison. BMC Syst Biol , 6 , 53. T obler, R et al. (2014). Massive habitat-sp ecific genomic resp onse in D. melanogaster p opulations during experimental evolution in hot and cold environmen ts. Mol Biol Evol , 31 (2), 364–375. T urner, T et al. (2011). Population-based resequencing of exp erimen tally evolved populations reveals the genetic basis of b ody size v ariation in Drosophila melanogaster. PL oS Genetics , 7 (3), e1001336. Y uan, M. (2006). Flexible temp oral expression profile mo delling using the Gaussian pro cess. Comput. Statist. Data Anal. , 51 (3), 1754–1764. Zhou, D et al. (2011). Exp erimen tal selection of hypoxia-toleran t Drosophila melanogaster. Pr o c e edings of the National A c ademy of Scienc es , 7 (108), 2349–2354. 17 A Supplemen tary Metho ds A.1 Co c hran-Man tel-Haenszel T est SNPs with consistent change in allele frequency were iden tified with Co c hran-Man tel-Haenszel test (CMH) by Orozco-T er W engel et al. (2012). The CMH test is an extension of testing equiv alence of prop ortions (implies that the o dds ratio is 1) in a 2 × 2 contingency table to replicated tables sampled from the same underlying p opulation. The estimate for the joint o dds ratio in the replicated 2 × 2 × R tables ( r = 1 , . . . , R , T ab. 1) is tested for difference from 1. W e follow the definition of the CMH b y Agresti (2002). Allele counts for the differen t repli- cates ( y (1) iB r , T ab. 1) are assumed to b e indep enden t. Under the n ull hypothesis, they follo w a h yp ergeometric distribution with mean and v ariance: E ( y (1) iB r ) = y (1) i. r n iB r n i. r V ( y (1) iB r ) = y (1) i. r y (2) i. r n iB r n iE r n 2 i. r ( n i. r − 1) . The test statistic compares P r y (1) iB r to its n ull exp ected v alue by combining information from R partial tables: C M H = P r y (1) iB r − E ( y (1) iB r ) 2 P r V ar y (1) iB r . This statistic approximately follows a c hi-square distribution with one degree of freedom χ 2 ( d f =1) . Under the n ull hypothesis, w e assume indep endence of the start (B) and end (E) time p oin ts of the experiment for eac h replicate. Th us, the o dds ratio for each replicate is appro ximately one. When the o dds ratio in each partial table is significantly different from one (dep endence) w e exp ect the nominator in the test statistic to b e large in absolute v alue. A.1.1 Generalized Cochran-Man tel-Haenszel T est (gCMH) The CMH tests for asso ciations b et ween pairwise allele counts and it is not able to handle time serial data. How ever, it can b e generalized for K × L × R contingency tables (Kuritz et al. , 1988) where the null hypothesis of no partial asso ciation b et ween the row ( i = 1 , . . . , K ) dimensions and column ( j = 1 , . . . , L ) dimensions for all replicates ( r = 1 , . . . , R ) is tested. Similarly to the CMH test, under the n ull h yp othesis the cell coun ts do not deviate from their expected v alue under random asso ciation. The alternative hypothesis can v ary dep ending on whether the row and column v ariables are measured in the nominal or ordinal scale. In the HTS allele frequency data, the row v ariable (allele A and B) is nominal, whereas the column v ariable (allele coun ts at differen t time p oin ts) is measured on the ordinal scale. W e test the alternative hypothesis that mean allele frequency across several time p oints differ b et ween alleles. Mean allele frequencies are formed b y assigning (column) scores to time p oin ts and the difference b et w een the weigh ted mean scores across rows are tested (see e.g. Kuritz et al. (1988) for details). There is no straigh tforward wa y to find a prop er weigh ting scheme of the time p oints, which accurately 18 reflects the action of natural selection. W e used the R implementation of the generalized CMH test in vcdExtra (F riendly, 2014) pac k age where mid-ranks can b e assigned to column scores ( cscores="midrank" ). Using these marginal ranks obtained form each table, the test statistic is equiv alent to an extension of Krusk al-W allis analysis of v ariance test on ranks. T o our knowledge, the gCMH test has not b een used to analyse HTS allele frequency data. W e used it on our simulated whole-genome data set to see if p erformance impro vemen t can b e ac hieved when time serial information is incorp orated to the CMH test. W e p erformed gCMH with increasing n umber of replicates using t = 3 , 6 , 9 time p oin ts (Fig. 14). With less time p oin ts ( t = 3, Fig. 14 (a)) the gCMH do es b etter but the p erformance drops with increasing the n umber of time p oin ts. Generally , w e also see a precision decline as the n um b er of replicates rises. A.2 Sim ulations W e carried out whole-genome forw ard W righ t-Fisher simulations of allele frequency (AF) tra- jectories of evolving p opulations with MimicrEE (Kofler and Sc hl¨ otterer, 2014). The founder p opulation w as generated using 8000 simulated haploid genomes from Kofler and Sc hl¨ otterer (2014). Out of the 8000 genomes, 200 were sampled to establish a diploid base popula- tion of 1000 individuals (sampled out of the 200 with replacement). The base p opulation con tains only autosomal SNPs. Lo w recom bining regions ( < 1 cM / M b ) were also excluded from the simulations (for more information see Kofler and Sc hl¨ otterer, 2014). W e randomly placed 100 selected SNPs in the base p opulation with selection co efficien t of s = 0 . 1 and semi-dominance ( h = 0 . 5). The selected SNPs hav e a starting allele frequency in the range [0 . 12 , 0 . 8]. W e applied this restriction on the staring AF to increase the probability of fixation of the selected allele. According to p opulation genetics theory , the probability of fixation is P f ix = (1 − e − 2 N e sp ) / (1 − e − 2 N e s ) (Kim ura, 1962), where N e is the effectiv e p opulation size, s is the selection co efficient and p is the starting allele frequency . T aking the base p opulation of 1000 homozygote individuals and the set of selected SNPs, w e follow ed the simulation pro- to col outlined at https://code.google.com/p/mimicree/wiki/ManualMimicrEESummary for 5 replicates independently . As described in Kofler and Sc hl¨ otterer (2014), w e aimed to repro- duce the sampling prop erties of Pool-Seq using Poisson sampling with λ = 45 (using the script p oisson-3fold-sample.p y a v ailable at http://mimicree.googlecode.com ). Briefly , w e consid- ered co verage differences b et w een samples, cov erage fluctuations due to GC-bias and sto c hastic sampling heterogeneit y . A.3 P erformance tests on sim ulated data W e measured the p erformance of the BBGP and the CMH test using whole-genome sim ulated data with v arious n umber of time points and replicates. T o ev aluate the effect of the num b er of time p oin ts used, the following sampling schemes w ere carried out. W e started with nine time p oin ts { 0 , 6 , 14 , 22 , 28 , 38 , 44 , 50 , 60 } and then remov ed the midp oin t of the shortest interv al un til the desired n um b er of time points w as achiev ed. In the case of a tie, w e k ept the time p oin t which is closest to the real se quenced time p oin ts in Orozco-T er W engel et al. (2012). F ollowing this rule, we applied BBGP on the following sets of generations: • 3 time p oin ts: 0, 38, 60, • 4 time p oin ts: 0, 14, 38, 60, 19 • 5 time p oin ts: 0, 14, 28, 38, 60, • 6 time p oin ts: 0, 14, 28, 38, 50, 60, • 7 time p oin ts: 0, 14, 22, 28, 38, 50, 60, • 8 time p oin ts: 0, 6, 14, 22, 28, 38, 50, 60, • 9 time p oin ts: 0, 6, 14, 22, 28, 38, 44, 50, 60. F or the CMH test, ho wev er, we alw ays p erformed a base-end (generation 60) comparison, b e- cause the CMH is a pairwise statistic. The genome-wide test statistic v alues are sho wn in Fig. 8 for the BBGP (6 time p oin ts) and the CMH for 5 replicates as an example. The effects of dif- feren t num b ers of replicates on the p erformance of the prop osed metho ds are shown in Fig. 10 using precision recall curv es along with av erage precisions. W e carried out 3 indep enden t runs of simulations with differen t sets of selected SNPs but k eeping the parameters unchanged (Fig. 11). Finally , we compared with a performance break do wn according to Allele F requency Change (AF C) the BBGP to CMH test in differen t AF C classes (Fig. 12 and Fig. 13). A.3.1 T ests of parameter c hoice for exp erimental design W e inv estigated differen t choices of parameters for exp erimen tal design. As whole-genome sim- ulations are computationally v ery demanding, we decided to simulate only a single chromosome arm (2L) with 25 selected SNPs using v arious parameter settings. This reduces the running times significantly , but the length of the genome segment ( ∼ 16 M b ) and the num ber of se- lected SNPs used are still realistic proxy to the p erformance on the whole-genome. W e rep ort p erformance results for different p opulation size - num b er of founder haplotypes ( H N com bi- nations (Figs. 15-17), for v arious selection co efficien ts s (Figs. 18- 21), levels of dominance h (Figs. 22, 23), increasing num b er of replicates r (Fig. 24) and the c hoice of time p oin ts at differen t intermediate generations g (Fig 25). A.4 Real Data Application W e applied the BBGP on HTS data of exp erimentally ev olved D. melano gaster p opulations (Orozco-T er W engel et al. , 2012). W e compared our prop osed metho d to the CMH results com- ing from the B-E comparison, downloaded from Dryad database ( http://datadryad.org ) un- der the accession: doi: 10.5061/dryad.60k68. W e used the synchronized pileup files (BF37.sync) whic h contains a total num b er of 1,547,837 SNPs. The CMH test was only p erformed on SNPs that met certain qualit y criteria regarding the minor allele count and the maximum cov erage (for more information on SNP calling please consult Orozco-T er W engel et al. , 2012). A.5 Gene Set Enrichmen t W e used gene set enric hment to test for significantly enriched functional categories according to the Gene Ontology (GO) database (Ashburner et al. , 2000). Orozco-T er W engel et al. (2012) used Go winda (Kofler and Sc hl¨ otterer, 2012) to test significance of ov errepresentation of candi- date SNPs in each GO category . Go winda uses p erm utation tests to eliminate p oten tial sources of bias caused by difference of gene length and genes that ov erlap (explained b elo w). W e tested the top 2000 candidate SNPs for both the CMH and the BBGP methods, resp ectiv ely . FDR 20 correction w as applied on the inferred p -v alues to account for multiple testing. Using Gowinda, w e did only find one significantly enriched category ( p < 0 . 05) for the BBGP and no significant categories for the CMH test (see T ables 2 and 3). In addition to taking an arbitrary threshold of the top 2000 SNPs, we also considered the full distributions of p -v alues for the CMH and the distribution of Bay es factors for the BBGP based tests. F or eac h GO category we compared distribution of all SNP-v alues ( p -v alues for the CMH and Bay es factors for the GP) in that GO gene set to the distribution outside that gene set using a one-tailed Mann-Whitney U test (MWU) as applied b y Segr ` e et al. (2010). Similar to Go winda, w e used p erm utations to accoun t for biases suc h as gene length and other confounding effects (see b elo w). W e also conserve the gene order during the randomization as functionally similar genes are often clustered nearby on a chromosome. Using the MWU tests, w e found significan t GO category enrichmen ts for b oth metho ds (Fig. 26). Moreo ver, the top ranked candidate categories w ere similar in b oth cases (see T abs. 4, 5). A.5.1 Gene Set Enric hment with Go winda Go winda counts the num b er of genes (set of candidate genes) that contain candidate SNPs. Assuming that SNPs are in complete link age within the same gene, it randomly samples SNPs from the p o ol of all SNPs until the num b er of corresp onding genes is equal to the cardinal- it y of the set of candidate genes. This step is rep eated several times and from the resulting random set of genes, an empirical null distribution of candidate gene abundance is calculated for eac h gene set. The significance level of enric hmen t for eac h gene set is inferred b y coun t- ing the randomly drawn cases, in which there w ere more candidate genes presen t than in the original candidate gene set. Gowinda requires the follo wing input files: annotation file con- taining the annotation of sp ecies of interest; gene set file of the asso ciated genes (e.g. Gene On tology (GO) asso ciation file); list of SNP-v alue pairs as the output of our analysis; list of candidate SNPs, which is a subset of all SNP-v alue pairs that we define as candidates accord- ing to some predetermined condition. W e used the following inputs: the annotation file of Dr osophila melano gaster v ersion 5.40 do wnloaded from Flybase ( http://flybase.org/ ); the GO association file w as obtained from R Bio conductor GO.db pac k age v ersion 2.9.0 (accessed at 05/03/2013). W e to ok the top 2000 candidate SNPs for b oth metho ds as candidate SNPs and run Gowinda with the follo wing parameters: --simulations 10000000 --gene-definition updownstream200 --mode gene . W e also took 200 base pairs up- and do wnstream regions from the gene b oundaries in to the analysis. F or more details please see Kofler and Sc hl¨ otterer (2012). Using Gowinda led to only one significantly enric hed category for the BBGP and no significant enric hment for the CMH test ( F D R < 0 . 05; top rank ed categories in T ab. 2 and T ab. 3). A.5.2 Gene Set Enric hment with Mann-Whitney U T est F or using Gowinda, w e had to fix a threshold ab o ve whic h we consider a SNP as a p ossible candidate. Defining this threshold can b e arbitrary , and changes in the threshold can result in different enriched gene sets. Therefore, w e decided to compare the distribution of all SNP- v alues in a specific gene set to the distribution outside that gene set using Mann-Whitney U test (MWU). This test allows us to decide if a particular gene set is significantly enric hed based only on the ranks of SNP-v alues in that set. W e p erformed the MWU test similarly as Segr ` e et al. (2010). W e used the previously men tioned gene set file obtained from R Bio conductor GO.db pack age; and a list of all SNPs with the 21 corresp onding v alues (output of the tests). F or mapping the SNPs to the genes we used SNPEFF 2.0.1 ( http://snpeff.sourceforge.net/ ). F or each gene set we summarized the list of SNPs presen t in that particular set and created a vector of corresp onding SNP-v alues (list of p -v alues or Bay es factors). Then we tested the alternative hypothesis that the distribution of these v alues is sk ewed to w ards the extreme v alues (low rank ed p -v alues for the CMH, high rank ed Ba yes factors for the GP) compared to the v alues among the rest of the SNPs. This gives the observ ed rank-sum p -v alue for the in vestigated gene set. Then, similarly to Gowinda, w e p erformed p ermutations to accoun t for biases b y simulating random gene sets (but keeping the c hromosomal order) with identical size as observed. F or every round of simulation, w e calculated the ranked-sum p -v alues as b efore. Finally , an exp ected rank-sum p -v alue was computed from this n ull distribution, as the fraction of randomly sampled gene sets whose rank-sum p -v alue w as less than or equal to the observed rank-sum p -v alue of the gene set. The top ranked significan t enric hments calculated with MWU test using 1000 p erm utations are functionally rather similar. Fig. 26 sho ws the ov erlap b et w een highly enriched categories for differen t empirical p -v alue cutoffs. The categories are listed in T ab. 4 and T ab. 5. B Supplemen tary T ables and Figures GO category p -V alue FDR Description GO:0004003 0.000074 0.0630949 A TP-dep enden t DNA helicase activit y GO:0008094 0.0001048 0.0630949 DNA-dep enden t A TPase activity GO:0006281 0.0002248 0.097873567 DNA repair GO:0046914 0.000305 0.1027073 transition metal ion binding T able 2: T op r anke d GO enrichment r esults with Gowinda on the CMH c andidates. Only the top 4 categories are shown. GO category p -V alue FDR Description GO:0005506 0.0000143 0.015987 iron ion binding GO:0015671 0.0004199 0.256548725 o xygen transp ort GO:0004252 0.0006096 0.256548725 serine-t yp e endop eptidase activity GO:0004989 0.0007332 0.256548725 o ctopamine receptor activity T able 3: T op r anke d GO enrichment r esults with Gowinda on the BBGP c andidates. Only the top 4 categories are shown. 22 GO category Obs. p-v al. Emp. p-v al. Description GO:0007274 2.8543e-156 0.001 neurom uscular synaptic transmission GO:0032504 3.2726e-49 0.001 m ulticellular organism repro duction GO:0006997 1.2159e-17 0.001 n ucleus organization GO:0007379 4.9304e-75 0.008 segmen t sp ecification GO:0003774 1.8303e-19 0.011 motor activit y GO:0009792 5.8937e-30 0.013 em bryo developmen t ending in birth or egg hatching GO:0001700 9.7049e-31 0.015 em bryonic developmen t via the syncytial blasto derm GO:0045451 4.5162e-20 0.015 p ole plasm osk ar mRNA localization GO:0060810 2.3554e-19 0.015 in tracell. mRNA lo c. in v. in pattern sp ecification proc. GO:0060811 1.9679e-19 0.016 in tracell. mRNA lo c. in v. in anterior/posterior axis sp ec. GO:0000975 1.5011e-32 0.017 regulatory region DNA binding GO:0008298 5.7685e-17 0.017 in tracellular mRNA lo calization GO:0016573 3.4293e-08 0.024 histone acet ylation GO:0019094 6.8648e-19 0.025 p ole plasm mRNA lo calization GO:0060438 9.6931e-101 0.026 trac hea developmen t GO:0000086 1.0455e-15 0.027 G2/M transition of mitotic cell cycle GO:0030554 9.0394e-19 0.028 aden yl nucleotide binding GO:0051049 4.8523e-52 0.029 regulation of transp ort GO:0004386 1.9648e-09 0.029 helicase activit y GO:0007093 6.4409e-08 0.029 mitotic cell cycle c heckpoint GO:0032879 3.4419e-34 0.03 regulation of lo calization GO:0060439 6.0698e-78 0.032 trac hea morphogenesis GO:0019904 3.6125e-74 0.032 protein domain sp ecific binding GO:0007350 1.1101e-25 0.033 blasto derm segmentation GO:0000976 3.9652e-14 0.035 transcr.regulatory reg. sequence-sp ec. DNA binding GO:0000977 2.8459e-28 0.037 RNA p olymerase I I reg. reg.seq.-sp ec. DNA binding GO:0007276 3.7400e-24 0.038 gamete generation GO:0007269 1.1198e-94 0.04 neurotransmitter secretion GO:0004888 2.9136e-19 0.043 transmem brane signaling receptor activity GO:0000981 1.9244e-28 0.044 seq.-sp ec DNA binding RNA p ol. I I transcr. factor activit y GO:0008306 1.2419e-35 0.046 asso ciativ e learning GO:0008355 6.2395e-32 0.047 olfactory learning GO:0001012 1.3174e-37 0.048 RNA p olymerase I I regulatory region DNA binding GO:0048149 1.6131e-23 0.048 b eha vioral resp onse to ethanol GO:0045664 7.9648e-23 0.048 regulation of neuron differen tiation GO:0010389 1.8391e-08 0.05 regulation of G2/M transition of mitotic cell cycle GO:0009055 7.5572e-05 0.05 electron carrier activit y T able 4: R esults of the GO enrichment with MWU on the CMH c andidates. Only the categories are sho wn for which the empirical p -v alue ≤ 0 . 05 calculated for 1000 p erm utations. 23 GO category Obs. p-v al. Emp. p-v al. Description GO:0006997 4.1404e-19 0 n ucleus organization GO:0007274 1.0657e-130 0.002 neurom uscular synaptic transmission GO:0007379 3.7449e-85 0.002 segmen t sp ecification GO:0032879 8.0269e-38 0.006 regulation of lo calization GO:0000075 1.9450e-19 0.007 cell cycle c heckpoint GO:0000785 9.1310e-15 0.014 c hromatin GO:0051049 6.3596e-52 0.019 regulation of transp ort GO:0009152 2.7329e-41 0.02 purine rib on ucleotide biosynthetic pro cess GO:0006164 5.9106e-46 0.022 purine n ucleotide biosynthetic pro cess GO:0004386 1.0113e-09 0.025 helicase activit y GO:0005179 1.9714e-16 0.026 hormone activit y GO:0000975 2.2740e-25 0.027 regulatory region DNA binding GO:0000977 9.8625e-36 0.028 RNA p ol. II regulatory reg. seq.-sp ec. DNA binding GO:0000976 2.6106e-18 0.029 transcr. reg. region sequence-sp ec.DNA binding GO:0001012 2.0242e-42 0.029 RNA p olymerase I I regulatory region DNA binding GO:0030554 1.9638e-14 0.03 adenyl nucleotide binding GO:0046914 5.2243e-27 0.032 transition metal ion binding GO:0055114 7.0135e-18 0.032 o xidation-reduction pro cess GO:0005829 1.0637e-17 0.033 cytosol GO:0019725 2.3293e-26 0.034 cellular homeostasis GO:0032504 8.4897e-21 0.036 m ulticellular organism repro duction GO:0009165 8.8494e-25 0.038 n ucleotide biosynthetic pro cess GO:0008285 7.1838e-19 0.041 negativ e regulation of cell proliferation GO:0007269 1.6094e-94 0.043 neurotransmitter secretion GO:0010389 3.4665e-07 0.043 regulation of G2/M transition of mitotic cell cycle GO:0031226 5.5250e-27 0.043 intrinsic to plasma mem brane GO:0032940 3.7154e-73 0.045 secretion by cell GO:0017076 5.6881e-12 0.046 purine n ucleotide binding GO:0000086 5.0627e-14 0.048 G2/M transition of mitotic cell cycle GO:0016491 1.1667e-10 0.048 oxidoreductase activity T able 5: R esults of the GO enrichment with MWU on the BBGP c andidates. Only the categories are sho wn for which the empirical p -v alue ≤ 0 . 05 calculated for 1000 p erm utations. 24 (a) Sim ulated data, genome-wide distribution of CMH -log( p -v alues). (b) Sim ulated data, genome-wide distribution of BBGP ln(Bay es factors). Figure 8: Manhattan plots of genome-wide test statistic values on simulate d data with 5 r epli- c ates. (a) -log( p -v alues) for the CMH test B-E comparison. (b) ln(Bay es factors) for the BBGP using 6 time p oin ts. Only autosomal regions w ere sim ulated and low recom bining regions ( < 1 cM / M b ) were excluded. The 100 truly selected SNPs (s=0.1) are indicated in red. As the consequence of link age structure, we observ e extended p eaks in the vicinity of selec ted SNPs. Ho wev er, there are still some truly selected SNPs that do not sho w clear pattern of frequency increase. A p ossible explanation for that can b e that the time course, i.e. 60 generations, is not long enough for them to rise significan tly in frequency . They can also interfere with each other and non-selected SNPs. 25 0 0.2 0.4 0.6 0.8 1 0 30 60 90 120 Recall Precision x 10 3 CMH, r=5; AP(x10 3 ): 7.47 CMH, r=4; AP(x10 3 ): 10.34 CMH, r=3; AP(x10 3 ): 9.67 CMH, r=2; AP(x10 3 ): 8.08 (a) CMH 0 0.2 0.4 0.6 0.8 1 0 250 500 750 1000 Recall Precision x 10 3 BBGP, r=5; AP(x10 3 ): 39.87 BBGP, r=4; AP(x10 3 ): 23.87 BBGP, r=3; AP(x10 3 ): 16.48 BBGP, r=2; AP(x10 3 ): 15.31 (b) BBGP (3 time p oin ts) 0 0.2 0.4 0.6 0.8 1 0 250 500 750 1000 Recall Precision x 10 3 BBGP, r=5; AP(x10 3 ): 43.90 BBGP, r=4; AP(x10 3 ): 25.96 BBGP, r=3; AP(x10 3 ): 17.67 BBGP, r=2; AP(x10 3 ): 16.24 (c) BBGP (6 time p oin ts) 0 0.2 0.4 0.6 0.8 1 0 250 500 750 1000 Recall Precision x 10 3 BBGP, r=5; AP(x10 3 ): 49.30 BBGP, r=4; AP(x10 3 ): 32.38 BBGP, r=3; AP(x10 3 ): 17.66 BBGP, r=2; AP(x10 3 ): 6.07 (d) BBGP (9 time p oin ts) 0 0.2 0.4 0.6 0.8 1 0 250 500 750 1000 Recall Precision x 10 3 GP, r=5; AP(x10 3 ): 40.99 GP, r=4; AP(x10 3 ): 18.93 GP, r=3; AP(x10 3 ): 5.74 GP, r=2; AP(x10 3 ): 1.38 (e) GP (6 time p oin ts) Figure 9: F ul l pr e cision-r e c al l curves for the CMH and BBGP metho ds for Fig. 5. The precision is plotted as the function of recall for every p ossible cutoff v alue in the ranked sequence of candidate SNPs. The graph in Fig. 5 shows the av erage precisions for all replicate, time-p oin t com binations. 26 0 0.2 0.4 0.6 0.8 1 0 125 250 375 500 Recall Precision x 10 3 BBGP, AP(x10 3 ): 16.24 GP, AP(x10 3 ): 1.38 CMH, AP(x10 3 ): 8.08 (a) Num b er of replicates: 2 0 0.2 0.4 0.6 0.8 1 0 250 500 750 1000 Recall Precision x 10 3 BBGP, AP(x10 3 ): 17.67 GP, AP(x10 3 ): 5.74 CMH, AP(x10 3 ): 9.67 (b) Num b er of replicates: 3 0 0.2 0.4 0.6 0.8 1 0 250 500 750 1000 Recall Precision x 10 3 BBGP, AP(x10 3 ): 25.96 GP, AP(x10 3 ): 18.93 CMH, AP(x10 3 ): 10.34 (c) Num b er of replicates: 4 0 0.2 0.4 0.6 0.8 1 0 250 500 750 1000 Recall Precision x 10 3 BBGP, AP(x10 3 ): 43.89 GP, AP(x10 3 ): 40.98 CMH, AP(x10 3 ): 7.47 (d) Num b er of replicates: 5 Figure 10: Pr e cision r e c al l curves c omp aring CMH metho d to the standar d GP and BBGP metho ds using differ ent numb er of r eplic ates and 6 time p oints on whole-genome simulation. Incorp oration of the b eta-binomial p osterior v ariances into the GP mo del provides the most b enefit when the num b er of replicates are small. The more replication is p erformed during the exp erimen ts, the b etter p erformance can b e exp ected from the GP-based metho ds. The CMH test, ho wev er, do es not b enefit from more replicates in the same w ay . 27 0 0.2 0.4 0.6 0.8 1 0 250 500 750 1000 Recall Precision x 10 3 BBGP, t=9; AP(x10 3 ): 32.38 BBGP, t=6; AP(x10 3 ): 25.96 BBGP, t=3; AP(x10 3 ): 23.87 CMH, AP(x10 3 ): 10.34 (a) Experiment: 1 0 0.2 0.4 0.6 0.8 1 0 125 250 375 500 Recall Precision x 10 3 BBGP, t=9; AP(x10 3 ): 27.19 BBGP, t=6; AP(x10 3 ): 23.81 BBGP, t=3; AP(x10 3 ): 27.18 CMH, AP(x10 3 ): 5.89 (b) Experiment: 2 0 0.2 0.4 0.6 0.8 1 0 11.25 22.5 33.75 45 Recall Precision x 10 3 BBGP, t=9; AP(x10 3 ): 2.36 BBGP, t=6; AP(x10 3 ): 3.37 BBGP, t=3; AP(x10 3 ): 2.38 CMH, AP(x10 3 ): 2.06 (c) Experiment: 3 Figure 11: Pr e cision r e c al l curves c omp aring CMH to BBGP for 3 indep endent whole-genome exp eriments. The p erformance can v ary noticeably b etw een exp eriments (e.g., factor of 10 difference in AP b et w een Exp erimen t 1 and 3). Nevertheless, the BBGP based test consistently outp erforms the CMH test. 28 0.0 0.2 0.4 0.6 0.8 1.0 0 100 300 (a) Sim. r=5, t=4 CMH BBGP 0.0 0.2 0.4 0.6 0.8 1.0 0 100 300 (b) Sim. r=5, t=6 0.0 0.2 0.4 0.6 0.8 1.0 0 100 300 (c) Sim. r=3, t=4 0.0 0.2 0.4 0.6 0.8 1.0 0 100 300 (d) Real data Rising AFC Frequency Figure 12: Distribution of the aver age al lele fr e quency change (AFC) of the rising al lele for the top 2000 c andidates in the whole-genome exp eriment. AFC was calculated for each SNPs based on the a v erage difference b et w een the base and end p opulations across replicates. (a-b) AFC of the top 2000 candidates of the sim ulated data with 5 replicates, BBGP is performed on 4 (a) and 6 (b) time p oin ts, resp ectiv ely . (c) AF C of the top 2000 candidates of the simulated data with 3 replicates, BBGP is p erformed on 4 time p oin ts. (d) AF C of the top 2000 candidates of the real data. W e observ ed a significant lo cation shift b et ween the AF C distributions among the top 2000 candidate SNPs of the CMH and the BBGP (Mann-Whitney U, p -v alue < 2.2e-16 for all panels). The lo cation shift indicates that the CMH test mostly captures radical AF C while the GP-based metho ds are also sensitive to consistent signals coming from intermediate time p oin ts. 29 0 0.2 0.4 0.6 0.8 1 0 250 500 750 1000 Recall Precision x 10 3 BBGP, r=5, t=6; AP(x10 3 ): 43.90 CMH, r=5; AP(x10 3 ): 7.47 (a) AF C: [0 − 1] 0 0.2 0.4 0.6 0.8 1 0 22.5 45 67.5 90 Recall Precision x 10 3 BBGP, r=5, t=6; AP(x10 3 ): 6.34 CMH, r=5; AP(x10 3 ): 1.43 (b) AF C: [0 − 0 . 3] 0 0.2 0.4 0.6 0.8 1 0 25 50 75 100 Recall Precision x 10 3 BBGP, r=5, t=6; AP(x10 3 ): 11.52 CMH, r=5; AP(x10 3 ): 1.96 (c) AF C: (0 . 3 − 0 . 5] 0 0.2 0.4 0.6 0.8 1 0 250 500 750 1000 Recall Precision x 10 3 BBGP, r=5, t=6; AP(x10 3 ): 119.87 CMH, r=5; AP(x10 3 ): 17.99 (d) AF C: (0 . 5 − 1] Figure 13: Pr e cision r e c al l curves for differ ent AFC classes in the whole-genome simulation. The performance in terms of precision and recall is sho wn for the CMH and the BBGP in classes of SNPs with different allele frequency c hange. The AF C is measured b etw een the base and end generations (60) and a veraged o v er 5 replicates. 6 time p oin ts w ere used for the BBGP . P anel (a) sho ws the ov erall p erformance. In panels (b)-(d), the AFC classes contain the following n umber of selected SNPs: 36 in class [0-0.3], 30 in class (0.3-0.5], 34 in class (0.5-1.0]. 2 3 4 5 0 10 20 30 40 50 r AP x 10 3 BBGP gCMH CMH (a) t=3 2 3 4 5 0 10 20 30 40 50 r AP x 10 3 BBGP gCMH CMH (b) t=6 2 3 4 5 0 10 20 30 40 50 r AP x 10 3 BBGP gCMH CMH (c) t=9 Figure 14: A ver age pr e cision of the differ ent metho ds with differ ent numb er of time p oints and r eplic ates in the whole-genome simulation. Av erage precisions for the BBGP and the CMH test are same as on Fig. 5. Precisions of the generalised CMH test (gCMH) are added in green for ev ery p ossible time-replicate com binations to the figures. 30 0 0.2 0.4 0.6 0.8 1 0 7.5 15 22.5 30 Recall Precision x 10 3 BBGP, AP(x10 3 ): 3.86 CMH, AP(x10 3 ): 0.39 (a) H/N=0.5 0 0.2 0.4 0.6 0.8 1 0 6.25 12.5 18.75 25 Recall Precision x 10 3 BBGP, AP(x10 3 ): 3.31 CMH, AP(x10 3 ): 1.86 (b) H/N=1 Figure 15: Pr e cision r e c al l curves c omp aring CMH to BBGP for differ ent H/N r atios for N=200 in the single-chr omosome-arm simulation. 0 0.2 0.4 0.6 0.8 1 0 1.25 2.5 3.75 5 Recall Precision x 10 3 BBGP, AP(x10 3 ): 1.73 CMH, AP(x10 3 ): 0.43 (a) H/N=0.1 0 0.2 0.4 0.6 0.8 1 0 11.25 22.5 33.75 45 Recall Precision x 10 3 BBGP, AP(x10 3 ): 4.15 CMH, AP(x10 3 ): 0.34 (b) H/N=0.2 0 0.2 0.4 0.6 0.8 1 0 175 350 525 700 Recall Precision x 10 3 BBGP, AP(x10 3 ): 91.93 CMH, AP(x10 3 ): 1.40 (c) H/N=0.5 0 0.2 0.4 0.6 0.8 1 0 20 40 60 80 Recall Precision x 10 3 BBGP, AP(x10 3 ): 5.50 CMH, AP(x10 3 ): 0.95 (d) H/N=1 Figure 16: Pr e cision r e c al l curves c omp aring CMH to BBGP for differ ent H/N r atios for N=1000 in the single-chr omosome-arm simulation. 31 0 0.2 0.4 0.6 0.8 1 0 0.625 1.25 1.875 2.5 Recall Precision x 10 3 BBGP, AP(x10 3 ): 0.68 CMH, AP(x10 3 ): 0.35 (a) H/N=0.02 0 0.2 0.4 0.6 0.8 1 0 0.4 0.8 1.2 1.6 Recall Precision x 10 3 BBGP, AP(x10 3 ): 0.60 CMH, AP(x10 3 ): 0.39 (b) H/N=0.04 0 0.2 0.4 0.6 0.8 1 0 4.5 9 13.5 18 Recall Precision x 10 3 BBGP, AP(x10 3 ): 2.11 CMH, AP(x10 3 ): 0.65 (c) H/N=0.1 0 0.2 0.4 0.6 0.8 1 0 87.5 175 262.5 350 Recall Precision x 10 3 BBGP, AP(x10 3 ): 33.83 CMH, AP(x10 3 ): 24.65 (d) H/N=0.2 0 0.2 0.4 0.6 0.8 1 0 250 500 750 1000 Recall Precision x 10 3 BBGP, AP(x10 3 ): 541.28 CMH, AP(x10 3 ): 467.98 (e) H/N=0.5 Figure 17: Pr e cision r e c al l curves c omp aring CMH to BBGP for differ ent H/N r atios for N=5000 in the single-chr omosome-arm simulation. 32 0 0.2 0.4 0.6 0.8 1 0 0.02 0.04 0.06 0.08 Recall Precision x 10 3 BBGP, AP(x10 3 ): 0.03 CMH, AP(x10 3 ): 0.04 (a) s=0.005 0 0.2 0.4 0.6 0.8 1 0 3 6 9 12 Recall Precision x 10 3 BBGP, AP(x10 3 ): 0.15 CMH, AP(x10 3 ): 0.67 (b) s=0.01 0 0.2 0.4 0.6 0.8 1 0 2.5 5 7.5 10 Recall Precision x 10 3 BBGP, AP(x10 3 ): 1.11 CMH, AP(x10 3 ): 0.84 (c) s=0.05 0 0.2 0.4 0.6 0.8 1 0 1.5 3 4.5 6 Recall Precision x 10 3 BBGP, AP(x10 3 ): 0.98 CMH, AP(x10 3 ): 0.41 (d) s=0.07 0 0.2 0.4 0.6 0.8 1 0 11.25 22.5 33.75 45 Recall Precision x 10 3 BBGP, AP(x10 3 ): 4.15 CMH, AP(x10 3 ): 0.34 (e) s=0.1 0 0.2 0.4 0.6 0.8 1 0 1.25 2.5 3.75 5 Recall Precision x 10 3 BBGP, AP(x10 3 ): 0.86 CMH, AP(x10 3 ): 0.31 (f ) s=0.14 0 0.2 0.4 0.6 0.8 1 0 1.5 3 4.5 6 Recall Precision x 10 3 BBGP, AP(x10 3 ): 0.87 CMH, AP(x10 3 ): 0.30 (g) s=0.2 Figure 18: Pr e cision r e c al l curves c omp aring CMH to BBGP for differ ent sele ction c o efficients (s) in the single-chr omosome-arm simulation. 33 (a) s = 0 . 1, CMH -log( p -v alues) on 2L. (b) s = 0 . 1, BBGP ln(Bay es factors) on 2L. (c) s = 0 . 2, CMH -log( p -v alues). (d) s = 0 . 2, BBGP ln(Bay es factors) on 2L. Figure 19: Manhattan plots of test statistic values for simulations with a single chr omosome arm. (a,c) -log( p -v alues) for the CMH test B-G60 comparison for 5 replicates. (b,d) ln(Bay es factors) for the BBGP using 6 time p oin ts and 5 replicates. T ruly selected SNPs (s=0.1 (a-b); s=0.2 (c-d)) are indicated in red. 60 120 0.1 0.5 2 10 50 g AP x 10 3 BBGP CMH (a) s=0.005 60 120 0.1 0.5 2 10 50 g AP x 10 3 BBGP CMH (b) s=0.01 Figure 20: Aver age pr e cision with we ak sele ction and lar ge p opulation size ( N = 5000 , H = 2500 ). Log scale was used on y axis. The p erformance of the metho ds is shown when large p opulations ev olved under weak selection. Under the basic parameter setup (Fig. 6(b)) the CMH outp erforms the BBGP for w eak selection strength of s = 0 . 005 and 0 . 01. W e observe the same b eha viour even with larger p opulation size ( N = 5000, H = 2500) when the p erformance is ev aluated using data up to generation 60. How ev er, if we let the p opulations evolv e further un til generation 120, the BBGP gain a large p erformance impro vemen t ov er the CMH test for s = 0 . 01. F or weak er selection, w e supp ose that the BBGP would need even more time to outp erform the CMH test. 34 0 0.2 0.4 0.6 0.8 1 0 0.45 0.9 1.35 1.8 Recall Precision x 10 3 BBGP, AP(x10 3 ): 0.08 CMH, AP(x10 3 ): 0.17 (a) s=0.005, g=60 0 0.2 0.4 0.6 0.8 1 0 12.5 25 37.5 50 Recall Precision x 10 3 BBGP, AP(x10 3 ): 0.18 CMH, AP(x10 3 ): 2.91 (b) s=0.005, g=120 0 0.2 0.4 0.6 0.8 1 0 1.5 3 4.5 6 Recall Precision x 10 3 BBGP, AP(x10 3 ): 0.05 CMH, AP(x10 3 ): 0.49 (c) s=0.01, g=60 0 0.2 0.4 0.6 0.8 1 0 87.5 175 262.5 350 Recall Precision x 10 3 BBGP, AP(x10 3 ): 48.99 CMH, AP(x10 3 ): 17.81 (d) s=0.01, g=120 Figure 21: Pr e cision r e c al l curves c omp aring CMH to BBGP with we ak sele ction for differ ent time dur ations in the single-chr omosome-arm simulation. 6 time p oin ts were used in the BBGP: { 0, 12, 24, 36, 48, 60 } and { 0, 24, 48, 72, 96, 120 } for 60-generation and 120-generation exp erimen ts, resp ectively . 35 0 0.25 0.5 0.75 1 0 1 2 3 4 5 h AP x 10 3 BBGP CMH Figure 22: A ver age pr e cision for differ ent levels of dominanc e (h) in the single-chr omosome-arm simulation. 0 0.2 0.4 0.6 0.8 1 0 3 6 9 12 Recall Precision x 10 3 BBGP, AP(x10 3 ): 1.99 CMH, AP(x10 3 ): 0.29 (a) h=0 0 0.2 0.4 0.6 0.8 1 0 3.5 7 10.5 14 Recall Precision x 10 3 BBGP, AP(x10 3 ): 2.54 CMH, AP(x10 3 ): 0.34 (b) h=0.25 0 0.2 0.4 0.6 0.8 1 0 11.25 22.5 33.75 45 Recall Precision x 10 3 BBGP, AP(x10 3 ): 4.15 CMH, AP(x10 3 ): 0.34 (c) h=0.5 0 0.2 0.4 0.6 0.8 1 0 1.25 2.5 3.75 5 Recall Precision x 10 3 BBGP, AP(x10 3 ): 0.85 CMH, AP(x10 3 ): 0.77 (d) h=0.75 0 0.2 0.4 0.6 0.8 1 0 1 2 3 4 Recall Precision x 10 3 BBGP, AP(x10 3 ): 0.96 CMH, AP(x10 3 ): 0.76 (e) h=1 Figure 23: Pr e cision r e c al l curves c omp aring CMH to BBGP for differ ent dominanc e levels (h) in the single-chr omosome-arm simulation. 36 0 0.2 0.4 0.6 0.8 1 0 2 4 6 8 Recall Precision x 10 3 BBGP, AP(x10 3 ): 1.01 CMH, AP(x10 3 ): 0.33 (a) r=2 0 0.2 0.4 0.6 0.8 1 0 1.5 3 4.5 6 Recall Precision x 10 3 BBGP, AP(x10 3 ): 1.13 CMH, AP(x10 3 ): 0.37 (b) r=3 0 0.2 0.4 0.6 0.8 1 0 6.25 12.5 18.75 25 Recall Precision x 10 3 BBGP, AP(x10 3 ): 2.64 CMH, AP(x10 3 ): 0.34 (c) r=4 0 0.2 0.4 0.6 0.8 1 0 11.25 22.5 33.75 45 Recall Precision x 10 3 BBGP, AP(x10 3 ): 4.15 CMH, AP(x10 3 ): 0.34 (d) r=5 0 0.2 0.4 0.6 0.8 1 0 37.5 75 112.5 150 Recall Precision x 10 3 BBGP, AP(x10 3 ): 7.81 CMH, AP(x10 3 ): 0.34 (e) r=6 0 0.2 0.4 0.6 0.8 1 0 17.5 35 52.5 70 Recall Precision x 10 3 BBGP, AP(x10 3 ): 6.26 CMH, AP(x10 3 ): 0.34 (f ) r=7 0 0.2 0.4 0.6 0.8 1 0 30 60 90 120 Recall Precision x 10 3 BBGP, AP(x10 3 ): 8.52 CMH, AP(x10 3 ): 0.34 (g) r=8 0 0.2 0.4 0.6 0.8 1 0 22.5 45 67.5 90 Recall Precision x 10 3 BBGP, AP(x10 3 ): 7.83 CMH, AP(x10 3 ): 0.35 (h) r=9 0 0.2 0.4 0.6 0.8 1 0 22.5 45 67.5 90 Recall Precision x 10 3 BBGP, AP(x10 3 ): 6.40 CMH, AP(x10 3 ): 0.35 (i) r=10 0 0.2 0.4 0.6 0.8 1 0 20 40 60 80 Recall Precision x 10 3 BBGP, AP(x10 3 ): 6.63 CMH, AP(x10 3 ): 0.34 (j) r=11 0 0.2 0.4 0.6 0.8 1 0 30 60 90 120 Recall Precision x 10 3 BBGP, AP(x10 3 ): 10.36 CMH, AP(x10 3 ): 0.34 (k) r=12 0 0.2 0.4 0.6 0.8 1 0 35 70 105 140 Recall Precision x 10 3 BBGP, AP(x10 3 ): 9.72 CMH, AP(x10 3 ): 0.33 (l) r=13 0 0.2 0.4 0.6 0.8 1 0 15 30 45 60 Recall Precision x 10 3 BBGP, AP(x10 3 ): 5.61 CMH, AP(x10 3 ): 0.34 (m) r=14 0 0.2 0.4 0.6 0.8 1 0 15 30 45 60 Recall Precision x 10 3 BBGP, AP(x10 3 ): 4.63 CMH, AP(x10 3 ): 0.34 (n) r=15 Figure 24: Pr e cision r e c al l curves c omp aring CMH to BBGP for differ ent numb er of r eplic ates (r) in the single-chr omosome-arm simulation. 37 0 0.2 0.4 0.6 0.8 1 0 0.375 0.75 1.125 1.5 Recall Precision x 10 3 BBGP − t=9, AP(x10 3 ): 0.31 BBGP − t=6, AP(x10 3 ): 0.33 BBGP − t=3, AP(x10 3 ): 0.46 CMH, AP(x10 3 ): 0.28 (a) G0-G30 0 0.2 0.4 0.6 0.8 1 0 0.7 1.4 2.1 2.8 Recall Precision x 10 3 BBGP − t=9, AP(x10 3 ): 0.56 BBGP − t=6, AP(x10 3 ): 0.62 BBGP − t=3, AP(x10 3 ): 0.80 CMH, AP(x10 3 ): 0.33 (b) G0-G60 0 0.2 0.4 0.6 0.8 1 0 2.5 5 7.5 10 Recall Precision x 10 3 BBGP − t=9, AP(x10 3 ): 1.13 BBGP − t=6, AP(x10 3 ): 1.68 BBGP − t=3, AP(x10 3 ): 1.32 CMH, AP(x10 3 ): 0.49 (c) G0-G120 Figure 25: Pr e cision r e c al l curves c omp aring CMH to BBGP using differ ent numb er of time p oints c ombine d with differ ent exp eriment lengths (single-chr omosome-arm simulation). In order to inv estigate the effects of the time spacing as well as the duration of the exp erimen t, the follo wing sampling schemes were applied on the time p oin ts: G0-G30: { 0, 18, 30 } , { 0, 6, 12, 18, 24, 30 } , { 0, 4, 6, 10, 14, 18, 22, 26, 30 } ; G0-G60: { 0, 36, 60 } , { 0, 12, 24, 36, 48, 60 } , { 0, 8, 12, 20, 28, 36, 44, 52, 60 } ; G0-G120: { 0, 72, 120 } , { 0, 24, 48, 72, 96, 120 } , { 0, 16, 24, 40, 56, 72, 88, 104, 120 } . 38 (a) Emp. p -v alue ≤ 0 . 1 (b) Emp. p -v alue ≤ 0 . 05 (c) Emp. p -v alue ≤ 0 . 01 Figure 26: V enn diagr am of signific antly enriche d GO c ate gories. Empirical p -v alues (Emp. p -v al.) for the MWU tests are calculated for each category based on sampling random SNPs (1000 times) but k eeping their c hromosomal order. Overlaps b et ween CMH and BBGP tests are sho wn for different significance levels. (a) CMH test (b) BBGP Figure 27: Manhattan plots on simulate d data using only a single sele cte d SNP ( s = 0 . 1 ) on the whole chr omosome arm. Sim ulation was p erformed as describ ed in Section 2.7 on a single c hromosome arm of 2L ( ∼ 16 M b ) using the basic parameter setup. The only difference is the n umber of SNPs assigned to b e selected. Here w e used a single selected SNP on the middle of the chromosome (highlighted in red) to see how muc h influence do es the interference b et w een selected SNPs pla y in shaping the dynamics of allele frequency tra jectories. W e see striking evidence that high n umber of false p ositiv es are due to interactions b et ween linked selected sites. 39 (a) CMH test (b) BBGP (c) CMH test (d) BBGP Figure 28: Manhattan plots w ith high r e c ombination r ate (a-b) and lar ge p opulation size (c- d). T op ro w (a-b): Sim ulation, as describ ed in Section 2.7, was carried out by setting high recom bination rate uniformly across 2L. Bottom row (c-d): Simulation with normal level of recom bination but using large p opulations size of N = 5000 , H = 2500. Selected SNPs are indicated in red. Link age is broken up when large p opulation size is used for simulations (c-d) and the dynamics of allele tra jectories b ecome more similar to the ones that are simulated with high recombination rate (a-b). F or exp erimental design, ho wev er, recom bination rates cannot b e easily mo dified but similar effect can b e attained b y propagating larger p opulations. 40 0 200 400 600 800 1000 1200 1400 0 250 500 750 1000 1250 Distance (kb) (a) BBGP 0 200 400 600 800 1000 1200 1400 0 250 500 750 1000 1250 Distance (kb) (b) GP 0 200 400 600 800 1000 1200 1400 0 250 500 750 1000 1250 Distance (kb) (c) CMH 0.01 0.1 1 10 100 1000 0 0.1 0.2 0.3 0.4 0.5 Maximum distance (kb) Average precision BBGP GP CMH (d) Av erage precisions Figure 29: Distribution of the distanc es (kb) to the ne ar est sele cte d SNPs for the top 2000 c andidate SNPs (a-c) and aver age pr e cisions when p otential hitchhikers ar e exclude d (d). The lines in panel (d) sho w the performances of the methods when the potential hitchhik ers, i.e. non- selected SNPs closer than the given distance from a selected SNP , are excluded prior to the calculation of the av erage precisions. Log-scale was used on x -axis, whic h shows the maxim um distance (kb) of the excluded p oten tial hitchhik ers to the nearest selected SNPs. The plots w ere obtained from whole-genome sim ulation data with 5 replicates and 6 time p oints. 41
Original Paper
Loading high-quality paper...
Comments & Academic Discussion
Loading comments...
Leave a Comment