Robust Logistic Regression using Shift Parameters (Long Version)
Annotation errors can significantly hurt classifier performance, yet datasets are only growing noisier with the increased use of Amazon Mechanical Turk and techniques like distant supervision that automatically generate labels. In this paper, we pres…
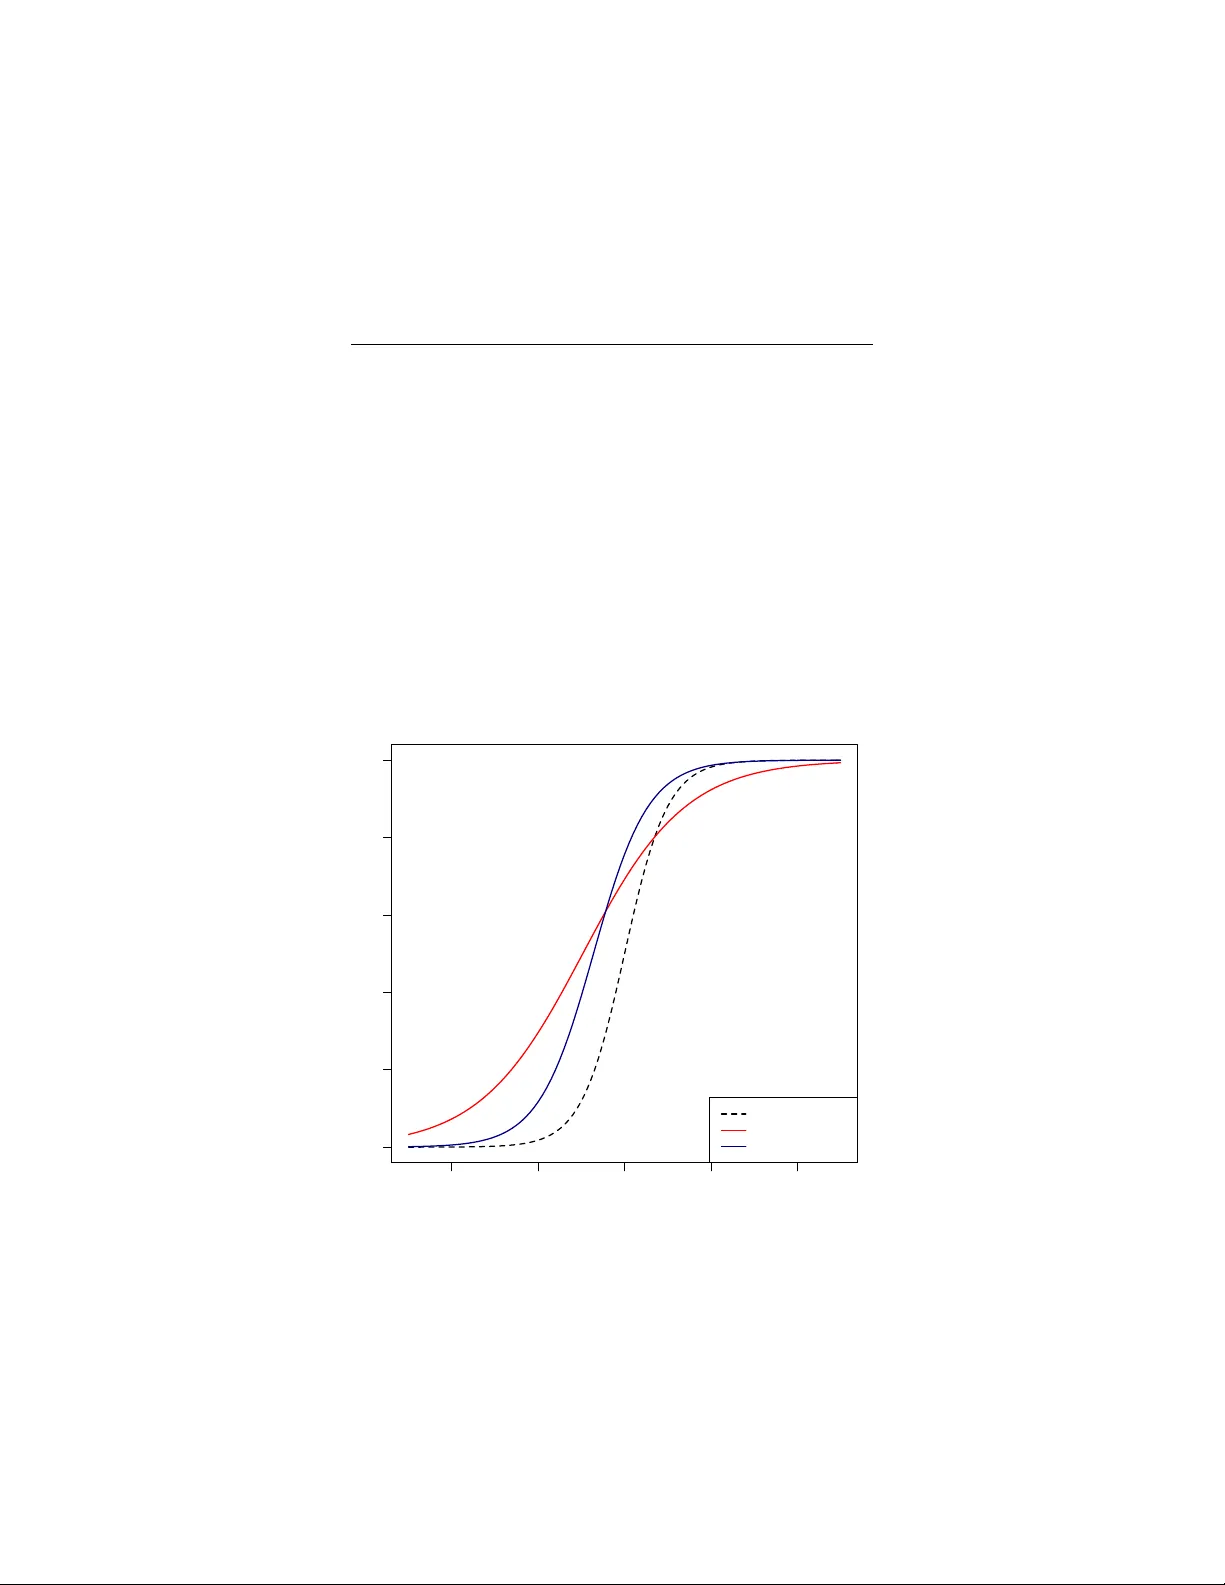
Authors: Julie Tibshirani, Christopher D. Manning
Robust Logistic Regression using Shift P arameters Julie Tibshirani Stanford Univ ersity Stanford, CA 94305, USA jtibs@cs.stanford.edu Master’s Rep ort, Stanford CS Departmen t Advisor: Christopher Manning Abstract Annotation errors can significan tly hurt classifier p erformance, yet datasets are only gro wing noisier with the increased use of Amazon Mec hanical T urk and tec hniques lik e distan t supervision that automatically generate lab els. In this pap er, we presen t a robust extension of logistic regression that incorp orates the p ossibilit y of mislab elling directly into the ob jectiv e. Our mo del can b e trained through nearly the same means as logistic regression, and retains its efficiency on high-dimensional datasets. Through named entit y recognition exp erimen ts, w e demonstrate that our approach can provide a significan t improv emen t ov er the standard mo del when annotation errors are presen t. 1 In tro duction Almost an y large dataset has annotation errors, esp ecially those complex, nuanced datasets commonly used in natural language processing. Lo w-quality annotations ha ve become even more common in recen t y ears with the rise of Amazon Mechan- ical T urk, as well as metho ds lik e distant sup ervision and co-training that inv olve automatically generating training data. Although small amoun ts of noise may not b e detrimental, in some applications the lev el can b e high: upon man ually insp ecting a relation extraction corpus com- monly used in distan t sup ervision, Riedel et al. (2010) rep ort a 31% false p ositive rate. In cases like these, annotation errors hav e frequently b een observed to hurt p erformance. Dingare et al. (2005), for e xample, conduct error analysis on a system to extract relations from biomedical text, and observ e that ov er half of the system’s errors could b e attributed to inconsistencies in ho w the data was annotated. Simi- larly , in a case study on co-training for natural language tasks, Pierce and Cardie (2001) find that the degradation in data quality from automatic lab elling preven ts these systems from p erforming comparably to their fully-supervised coun terparts. 1 Despite this prev alence, little work has been done in designing mo dels that are a ware of annotation errors. Moreov er muc h of the previous w ork focuses on heuristic tec hniques to filter the data b efore training, whic h migh t discard v aluable examples simply b ecause they do not fit closely with the model assumptions. In this w ork we argue that incorrect examples should be explicitly mo delled dur- ing training, and presen t a simple extension of logistic regression that incorporates the possibility of mislab elling directly into the ob jective. Our mo del introduces sparse ‘shift parameters’ to allo w datap oints to slide along the sigmoid, c hanging class if appropriate. It has a conv ex ob jective, can handle high-dimensional data, and we sho w it can b e efficiently trained with minimal changes to the logistic re- gression pip eline. Exp erimen ts on large, noisy NER datasets sho w that our metho d can pro vide an impro vemen t ov er standard logistic regression, b oth in man ually and automatically annotated settings. The mo del also provides a means to iden tify which examples w ere mislab eled: through exp erimen ts on biological data, w e demonstrate ho w our metho d can b e used to accurately identify annotation errors. This robust extension of logistic regression sho ws promise in handling incorrect lab els, while remaining efficien t on large, high-dimensional datasets. 2 Related W ork Muc h of the previous work on dealing with annotation errors cen ters around filtering the data before training. Bro dley and F riedl (1999) in tro duce what is p erhaps the simplest form of supervised filtering: they train v arious classifiers, then record their predictions on a different part of the train set and eliminate conten tious examples. In a similar vein, V enk ataraman et al. (2004) filter using SVMs, training on differen t subsets of the feature space to create m ultiple ‘views’ of the data. One ob vious issue with these metho ds is that the noise-detecting classifiers are themselv es trained on noisy lab els. Such metho ds ma y suffer from well-kno wn effects lik e masking , where several mislab elled examples ‘mask’ each other and go unde- tected, and swamping , in which the mislab elled p oin ts are so influen tial that they cast doubt on the correct examples (She and Ow en, 2011). Figure 1 gives an example of these phenomena in the con text of linear regression. Unsup ervised filtering tries to av oid this problem by clustering training instances based solely on their features, then using the clusters to detect lab elling anomalies (Rebbapragada et al., 2009). Recen tly , Intxaurrondo et al. (2013) applied this approac h to distan tly-sup ervised relation extraction, using heuristics suc h as the num ber of men tions per tuple to eliminate suspicious examples. Unsup ervised filtering, how ev er, relies on the p erhaps un warran ted assumption that examples with the same lab el lie close together in feature space. Moreov er filtering tec hniques in general may not b e w ell-justified: if a training example do es not fit closely with the current mo del, it is not necessarily mislabeled. Although 2 ● ● ● ● ● ● ● ● ● ● ● ● ● ● ● ● ● ● ● ● ● ● ● ● ● ● ● ● ● ● ● ● ● ● ● −6 −4 −2 0 2 4 6 −6 −4 −2 0 2 4 X Y ● ● ● ● ● ● Figure 1: Fit resulting from running linear regression on the given data, whic h includes b oth clean examples (blue), and outliers (red). The outliers ha ve suc h a large influence on the fit that they mask each other’s presence, and no longer appear that unusual. They also swamp the pro cedure, so that some clean examples now b egin to look suspicious. 3 the instance itself has a lo w-likelihoo d, it might represent an imp ortan t exception that would improv e the ov erall fit. An example may also app ear un usual simply b ecause we hav e made p o or mo delling as sumptions, and in discarding it v aluable information could be lost. P erhaps the most promising approaches are those that directly model annotation errors, handling mislab elled examples as they train. This wa y , there is an activ e trade-off betw een fitting the model and identifying susp ected errors. Bo otkra jang and Kaban (2012) presen t an extension of logistic regression that mo dels annotation errors through flipping probabilities. F or each example the authors p osit a hidden v ariable representing its true lab el, and assume this lab el has a probabilit y of b eing flipp ed b efore it is observed. While in tuitive, this approach has shortcomings of its o wn: the ob jective function is nonconv ex and the authors note that local optima are an issue, and the mo del can b e difficult to fit when there are many more features than training examples. The field of ‘robust statistics’ seeks to develop estimators that are not unduly effected by deviations from the mo del assumptions (Huber and Ronc hetti, 2009). Since mislab elled p oin ts are one type of outlier, this goal is naturally related to our in terest in dealing with noisy data, and it seems many of the existing tec hniques w ould be relev ant. A common strategy is to use a mo dified loss function that gives less influence to p oin ts far from the boundary , and several mo dels along these lines ha ve b een prop osed (Ding and Vish wanathan., 2010; Masnadi-Shirazi et al., 2010). Unfortunately these approac hes require optimizing nonstandard, often nonconv ex ob jectiv es, and fail to giv e insigh t into which datap oin ts are mislab eled. In a recent adv ance, She and Ow en (2011) demonstrate that in tro ducing a reg- ularized ‘shift parameter’ p er datap oint can help increase the robustness of linear regression. Candes et al. (2009) prop ose a similar approach for principal comp o- nen t analysis, while W righ t and Ma (2009) explore its effectiveness in sparse signal reco very . In this work we adapt the techniq ue to logistic regression. T o the b est of our kno wledge, we are the first to exp eriment with adding ‘shift parameters’ to logistic regression and demonstrate that the mo del is esp ecially well-suited to the t yp e of high-dimensional, noisy datasets commonly used in NLP . There is a gro wing b o dy of literature on learning from sev eral annotators, eac h of whom ma y b e inaccurate (Bac hrach et al., 2012; Rayk ar et al., 2009). It is imp ortan t to note that we are considering a separate, and p erhaps more general, problem: we ha ve only one source of noisy labels, and the errors need not come from the h uman annotators, but could b e in tro duced through con tamination or automatic lab elling. 4 3 Mo del Recall that in binary logistic regression, the probabilit y of an example x i b eing p ositiv e is mo deled as g ( θ T x i ) = 1 1 + e − θ T x i . F or simplicity we assume the in tercept term has b een folded in to the weigh t vector θ , so θ ∈ R m +1 where m is the n um b er of features. F ollo wing She and Owen (2011), w e prop ose the following robust extension: for eac h datap oint i = 1 , . . . , n , we introduce a real-v alued shift parameter γ i so that the sigmoid becomes g ( θ T x i + γ i ) = 1 1 + e − θ T x i − γ i Since w e b eliev e that most examples are correctly lab elled, w e L 1 -regularize the shift parameters to encourage s parsit y . Letting y i ∈ { 0 , 1 } b e the lab el for datap oint i and fixing λ ≥ 0, our ob jective is now giv en b y l ( θ , γ ) = n X i =1 y i log g ( θ T x i + γ i ) + (1 − y i ) log 1 − g ( θ T x i + γ i ) − λ n X i =1 | γ i | (1) These parameters γ i let certain datap oints shift along the sigmoid, p erhaps switc hing from one class to the other. If a datapoint i is correctly annotated, then w e would exp ect its corresp onding γ i to b e zero. If it actually b elongs to the p os- itiv e class but is lab elled negativ e, then γ i migh t b e p ositiv e, and analogously for the other direction. One w ay to in terpret the mo del is that it allo ws the log-o dds of select datap oin ts to be shifted. Compared to mo dels based on lab el-flipping, where there is a global set of flipping probabilities, our metho d has the adv antage of targeting each example individually . It is worth noting that there is no difficult y in regularizing the θ parameters as w ell. F or example, if we choose to use an L 1 p enalt y then our ob jective b ecomes l ( θ , γ ) = n X i =1 y i log g ( θ T x i + γ i )+(1 − y i ) log 1 − g ( θ T x i + γ i ) − κ m X j =1 | θ j |− λ n X i =1 | γ i | (2) Finally , it may seem concerning that we ha ve introduced a new parameter for eac h datap oint. But in many applications the num ber of features already exceeds n , so with prop er regularization, this increase is actually quite reasonable. 3.1 T raining Notice that adding these shift parameters is equiv alent to introducing n features, where the i th new feature is 1 for datapoint i and 0 otherwise. With this observ ation, 5 w e can simply modify the design matrix and parameter v ector and train the logistic mo del as usual. Sp ecifically , we let θ 0 = ( θ 0 , . . . , θ m , γ 1 , . . . , γ n ) and X 0 = [ X | I n ] so that the ob jective simplifies to l ( θ 0 ) = n X i =1 y i log g ( θ 0 T x 0 i ) + (1 − y i ) log 1 − g ( θ 0 T x 0 i ) − λ m + n X j = m +1 | θ 0 ( j ) | Up on writing the ob jective in this wa y , we immediately see that it is conv ex, just as standard L 1 -p enalized logistic regression is conv ex. One small complication is that the parameters corresp onding to γ are no w reg- ularized, while those corresp onding to θ are not (or p erhaps we wish to regularize them differently). In practice this situation do es not p ose muc h difficulty , and in App endix C w e show how to train these mo dels using standard softw are. 3.2 T esting T o obtain our final logistic mo del, w e keep only the θ parameters. Predictions are then made as usual: I { g ( ˆ θ T x ) > 0 . 5 } 3.3 Selecting Regularization P arameters The parameter λ from equation (1) would normally b e c hosen through cross-v alidation. Ho wev er our set-up is unusual in that the training set may contain errors, and even if we ha ve a designated dev elopment set it is unlikely to b e error-free. W e found in sim ulations that the errors largely do not interfere in selecting λ , so in the exp eri- men ts below we therefore cross-v alidate as normal. Notice that λ has a direct affect on the n umber of nonzero shifts γ and hence the susp ected n umber of errors in the training set. So if w e ha ve information ab out the noise level, w e can directly incorp orate it into the selection pro cedure. F or example, w e ma y b eliev e the training set has no more than 15% noise, and so would restrict the choice of λ during cross-v alidation to only those v alues where 15% or fewer of the estimated shift parameters are nonzero W e now consider situations in which the θ parameters are regularized as well. Assume, for example, that w e use L 1 -regularization as in equation (2). W e w ould then need to optimize ov er b oth κ and λ . In cases like these it is common to first construct a one-dimensional family , so we can then cross-v alidate a single parame- ter (F riedman et al., 2009; Arlot and Celisse, 2010). In addition to b eing faster to compute, this method giv es more accurate estimates of the true error rate. Concretely , we p erform the follo wing procedure: 1. F or eac h κ of interest, find the v alue of λ that, along with this c hoice of κ , maximizes the robust mo del’s accuracy on the train set. 6 2. Cross-v alidate to find the b est c hoice for κ , using the corresp onding v alues for λ found in the first step. Note that it is fine to c ho ose λ based on training accuracy , since it is not used in making predictions and so there is little risk of o v erfitting. F or large, high-dimensional datasets ev en this procedure may be to o costly , and training accuracy is not alw a ys informative. So in the natural language processing exp erimen ts below, w e adopt a simpler strategy: 1. Cross-v alidate using standard logistic regression to select κ . 2. Fix this v alue for κ , and cross-v alidate using the robust mo del to find the best c hoice of λ . Although not as w ell-motiv ated theoretically , this metho d still produces go o d re- sults. 4 Exp erimen ts W e no w present several exp eriments to assess the effectiv eness of the approach, ranging from sim ulations in which lab els are flipp ed uniformly at random, to exper- imen ts on natural language datasets where annotation errors are quite systematic. These exp erimen ts measure the robust mo del against standard logistic regression; for a comparison with other methods for handling annotation errors, please see App endix B. 4.1 Sim ulated Data In our first exp erimen t, we simulate logistic data with 10 features drawn Uniform(-5, 5), letting θ j = 2 for j = 1 , . . . , m and the intercept b e zero. W e create training, dev elopment, and test sets containing 500 examples each and introduce noise in to b oth the training and dev elopment sets b y flipping lab els uniformly at random. The regularization parameter λ is c hosen simply b y minimizing 0-1 loss on the dev elopment set. F or all simulation experiments w e use glmnet , an R pac k age that trains both lasso ( L 1 )-p enalized and elastic net mo dels through cyclical coordinate descen t (F riedman et al., 2009). The results for standard versus robust logistic regression are sho wn in T able 1, for v arious levels of noise. Using the tuning procedure describ ed in Section 3.3, w e next perform sim ulations in which the original features are L 1 -p enalized as well (see T able 1). W e generate logistic data with 20 features, only 5 of which are relev an t, and again set θ j = 2 for j = 1 , . . . , m and the in tercept to zero. The training, developmen t, and test sets are eac h of size 100, and label noise is added to all data but the test set. The regularization parameter for the baseline mo del is tuned on the developmen t set. Additional implementation details can b e found Appendix C. 7 p 0 p 1 regularized standard robust 0.0 0.0 no 96 . 56 ± 0 . 09 96 . 60 ± 0 . 10 0.1 0.0 no 93 . 48 ± 0 . 18 93 . 58 ± 0 . 18 0.2 0.0 no 87 . 49 ± 0 . 24 89 . 22 ± 0 . 23 0.3 0.0 no 80 . 40 ± 0 . 25 84 . 15 ± 0 . 28 0.3 0.1 no 84 . 16 ± 0 . 35 86 . 63 ± 0 . 33 0.3 0.0 y es 75 . 89 ± 0 . 50 76 . 98 ± 0 . 56 0.3 0.1 y es 74 . 98 ± 0 . 56 76 . 16 ± 0 . 57 T able 1: Accuracy of standard vs. robust logistic regression for v arious lev els of noise. The p 0 column giv es the probability of class 0 flipping to 1, and vice v ersa for p 1 . -4 -2 0 2 4 0.0 0.2 0.4 0.6 0.8 1.0 original sigmoid standard LR robust LR Figure 2: Fit resulting from a standard vs. robust model, where data is generated from the dashed sigmoid and negativ e labels flipp ed with probabilit y 0.2. 8 metho d susp ects identified false p ositives Alon et al. (1999) T2 T30 T33 T36 T37 N8 N12 N34 N36 F urey et al. (2000) • • • • • • Kadota et al. (2003) • • • • • T6, N2 Malossini et al. (2006) • • • • • • • T8, N2, N28, N29 Bo otkra jang et al. (2012) • • • • • • • robust LR • • • • • • • T able 2: Results of v arious error-identification methods on the colon cancer dataset. The first row lists the samples that are biologically confirmed to b e suspicious, and eac h other ro w gives the output from an automatic detection metho d. Bo otkra jang et al. rep ort confidences, so we threshold at 0.5 to obtain these results. As the results sho w, robust logistic regression pro vides a consisten t impro vemen t o ver the baseline. The p erformance difference grows larger with the amoun t of label noise, and is also evident when lab els ha ve been flipp ed in both directions. A one- dimensional example of this impro v ement is seen in Figure 2. Imp ortan tly , the model do es not p erform worse than standard logistic regression when no errors are present. Insp ecting the learned parameters from these runs, w e see that almost all γ hav e b een set to 0. 4.2 Con taminated Data W e next apply our approach to a biological dataset with susp ected lab elling errors. Called the colon cancer dataset, it con tains the expression levels of 2000 genes from 40 tumor and 22 normal tissues (Alon et al., 1999). There is evidence in the literature that certain tissue samples ma y ha ve b een cross-con taminated. In particular, 5 tumor and 4 normal samples should hav e their labels flipped. Since the dataset is so small, it is difficult to accurately measure the p erformance of our mo del against the baseline. W e instead examine its ability to identify mis- lab elled training examples. Because there are many more features than datap oints and it is lik ely that not all genes are relev an t, w e choose to place an L 1 p enalt y on θ . Using glmnet , w e again select κ and λ using the cross-v alidation pro cedure from Section 3.3. Lo oking at the resulting v alues for γ , we find that only 7 of the shift parameters are nonzero and that each one corresp onds to a suspicious datap oint. As further confirmation, the sign of the gammas correctly matc h the direction of the mislab elling. Compared to previous attempts to automatically detect errors in this dataset, our approac h identifies at least as many suspicious examples but with no false p ositiv es. A detailed comparison is given in T able 2. Although Bo otkra jang and Kaban (2012) are quite accurate, it is w orth noting that due to its noncon v exity , their mo del needed to b e trained 20 times to achiev e these results. 9 source partition # p os # neg # features p 0 p 1 CoNLL + MUSE train 8,392 80,000 190,185 0.371 0.007 Wikip edia train 24,002 200,000 393,633 0.004 0.075 CoNLL test 3,149 48,429 125,062 - - T able 3: Statistics ab out the data used in the NER exp erimen ts. F or the Wikip edia train set, the p 0 column represen ts the fraction of examples that the ma jorit y agreed w ere negativ e, but that the c hosen annotator marked p ositiv e (and analogously for p 1 ). W e still include examples for which there was no ma jority consensus, so these noise estimates are quite conserv ativ e. As for the MUSE data, the p 0 column gives the fraction of examples that are marked p ositive in the official CoNLL train set, but that the automatic system lab elled negative, and vice v ersa for p 1 . 4.3 Man ually Annotated Data In these exp eriments w e fo cus on a classic task in NLP called name d entity r e c o g- nition . In the traditional set-up, the goal is to determine whether each word is a p erson, organization, lo cation, or not a named entit y (‘other’). Since our mo del is binary , we concen trate on the task of deciding whether a word is a p erson or not. This task do es not trivially reduce to finding the capitalized words, as the mo del m ust distinguish b et ween p eople and other named en tities like organizations. F or training, w e use a large, noisy NER dataset collected by Jenn y Fink el. The data was created by taking v arious Wikip edia articles and giving them to five Ama- zon Mec hanical T urk ers to annotate. F ew to no quality controls were put in place, so that certain annotators pro duced very noisy lab els. T o construct the train set w e chose a T urker who was about av erage in ho w muc h he disagreed with the ma- jorit y vote, and used only his annotations. Negative examples are subsampled to bring the class ratio to a reasonable level (around 1 to 10). W e ev aluate on the dev elopment test set from the CoNLL shared task (Tjong Kim Sang and Meulder, 2003). This data consists of news articles from the Reuters corpus, hand-annotated b y researchers at the Universit y of An tw erp. More details ab out the dataset can b e found in T able 3. W e extract a set of features using Stanford’s NER pip eline (Finkel e t al., 2005). This set was c hosen for simplicit y and is not highly engineered – it largely consists of lexical features such as the current word, the previous and next words in the sen tence, as well as character n-grams and v arious w ord shape features. W e c ho ose to L 2 -regularize the features, so that our p enalty no w becomes 1 2 σ 2 m X j =0 | θ j | 2 + λ n X i =1 | γ i | This choice is natural as L 2 is the most common form of regularization in NLP , and w e wish to v erify that our approach w orks for p enalties b esides L 1 . 10 0.5 0.6 0.7 0.8 0.9 1.0 0.2 0.3 0.4 0.5 0.6 0.7 0.8 0.9 Recall Precision normal LR flipping model robust LR Figure 3: Precision-recall curv e obtained from training on noisy Wikip edia data and testing on CoNLL. The flipping mo del refers to the approac h from Bo otkra jang and Kaban (2012). mo del precision recall F1 standard 76.99 85.87 81.19 flipping 76.62 86.28 81.17 robust 77.04 90.47 83.22 T able 4: Performance of standard vs. robust logistic regression in the Wikip edia NER exp erimen t. The flipping mo del refers to the approach from Bo otkra jang and Kaban (2012). 11 The robust mo del is fit using Orthan t-Wise Limited-Memory Quasi Newton (O WL-QN), a tec hnique for optimizing an L 1 -p enalized ob jectiv e (Andrew and Gao, 2007). W e tune both mo dels through 5- fold cross-v alidation to obtain σ 2 = 1 . 0 and λ = 0 . 1. Note that from the wa y we cross-v alidate (first tuning σ using standard logistic regression, fixing this c hoice, then tuning λ ) our pro cedure ma y give an unfair adv an tage to the baseline. W e also compare against the algorithm proposed in Bo otkra jang and Kaban (2012), an extension of logistic regression mentioned in the section on prior work. This mo del assumes that annotation errors are pro duced from lab el-flipping: each example’s true lab el is flipp ed with a certain probabilit y b efore b eing observed. The features are linked to the latent ‘true’ lab els through a standard logistic classifier, and these lab els relate to the observ ed ones through tw o global parameters, the probabilit y of a positive lab el flipping to negativ e, and the probability of a negative lab el flipping to p ositive. The mo del is trained by first estimating the laten t ‘true’ lab els, then learning the weigh ts of the logistic classifier and the v alues for the tw o flipping probabilities. During testing, these flipping probabilities are discarded and predictions are made using only the logistic classifier. The results of these experiments are shown in T able 4 as well as Figure 3. Ro- bust logistic regression offers a noticeable improv ement o v er the baseline, and this impro vemen t holds at essentially all lev els of precision and recall. In terestingly , the flipping mo del show no substantial difference with standard logistic regression. A more in-depth discussion of this outcome is giv en in Section 5. 4.4 Automatically Annotated Data W e now turn to a setting in whic h training data has b een automatically generated. The task is the same as in the previous exp erimen t: for eac h word in a sen tence w e m ust identify whether it represen ts a p erson or not. F or ev aluation we again use the developmen t test set from the CoNLL shared task, and extract the same set of simple features as b efore. As for the training data, w e take the sentences from the official CoNLL train set and run them through a simple NER system to create noisy lab els. W e use a system called MUSE, whic h makes use of gazetteers and hand-crafted rules to recognize named entities (Maynard et al., 2001). The softw are is distributed with GA TE, a general purpose set of to ols for pro cessing text, and is not tuned for any particular corpus (Cunningham et al., 2002). W e hav e again subsampled negativ es to achiev e a ratio of roughly 1 to 10. More information ab out the data can b e found in T able 5. Somewhat exp ectedly , w e see that the system has a high false negativ e rate. W e again use 5-fold cross-v alidation to tune the regularization parameters, ul- timately picking σ 2 = 10 and λ = 0 . 01. Our first attempt at selecting λ gav e a v ery large v alue, so that nearly all of the resulting γ parameters were zero. W e therefore decided to use our knowledge of the noise level to guide the choice of reg- 12 mo del precision recall F1 standard 84.52 70.91 77.12 flipping 84.36 70.91 77.05 robust 84.64 72.44 78.06 T able 5: Performance of standard vs. robust logistic regression in the Muse NER exp erimen t. The flipping model refers to the approac h from Bo otkra jang and Kaban (2012). ularization. In particular, w e restrict our choice of λ so that the prop ortion of γ parameters whic h are nonzero roughly matc hes the fraction of training examples that are mislab elled (around 4%, after summing across b oth classes). Note that ev en in more realistic situations, where exp ert lab els are not a v ailable, w e can often gain a reasonable estimate of this num b er. T able 5 shows the exp erimental results. W e see that on this dataset robust logistic regression offers a modest impro v ement ov er the baseline. The flipping mo del again behav es nearly iden tically to standard logistic regression. 5 Discussion In the sim ulation exp eriments from Section 4.1, the robust mo del offers a notable adv an tage ov er the baseline if the features are uniformly distributed. But when we rerun the exp erimen ts with features drawn Normal(0, 1), the impro v ement in accu- racy decreases by as m uch as 1%. One explanation is as follows: in this situation, the datapoints, and therefore the annotation errors, tend to cluster around the b or- der b et ween positive and negativ e. Logistic regression, b y virtue of its probabilistic assumptions, is naturally forgiving to ward p oints near its decision b oundary . So when noise is concentrated at the b order, adding shift parameters do es not pro vide the same b enefit. In short, the robust mo del seems to p erform b est when there is a go o d num b er of mislabelled examples that are not close cases. As noted in the NER exp eriments, the robust mo del shows less of an impro ve- men t when the training data is generated automatically rather than manually . One lik ely explanation is that more than human annotators, rule-based systems tend to mak e mistakes on examples with similar features. F or example if a certain w ord was not in MUSE’s gazetteers, and so it incorrectly lab elled ev ery instance of this w ord as negativ e, we migh t ha v e a goo d num ber of erroneous examples that are close together in feature space. In this setting it can b e hard for an y robust classifier to learn what is mislab elled. W e also observe that the flipping mo del p erforms essentially the same as stan- dard logistic regression. During training, the t w o flipping probabilities consisten tly con verge to 0, whic h corresp onds to the situation in which no lab el-flipping o c- curred. Learning the w eights for the logistic classifier then gives exactly the same 13 v alues as w ould standard logistic regression. Up dates to the wa y the parameters w ere initialized, including several attempts at randomization, failed to change this outcome. A likely explanation is that giv en the large ratio of features to datap oints so com- mon in NLP applications, the classifier’s w eights already pro vide more than enough degrees of freedom, and so the mo del essentially ignores the extra flipping parame- ters. When an example is mislab elled, it is likely b etter to ‘fiddle’ one of the man y w eights instead of modifying a global probabilit y , which has ma jor repercussions across examples. Neither strengthening the L 2 -regularization nor ev en switc hing to an L 1 p enalt y help ed the probabilities conv erge to a nonzero v alue. Our mo del manages to a void this issue b y in tro ducing one shift parameter per datapoint. The γ v ariables allow for fine-grained corrections, and hav e a large enough presence to comp ete with the classifier’s weigh ts. 6 Comparison to SVMs It is in teresting to observe the similarit y betw een this model and a soft-margin SVM: min w,ξ ,b 1 2 k w k 2 + C n X i =1 ξ i s. t. ∀ i y i ( w T x i − b ) ≥ 1 − ξ i , ξ i ≥ 0 The γ parameters corresp ond to slac k v ariables ξ i , whic h allow certain datap oin ts to lie on the wrong side of the separating hyperplane. As in our mo del, these slack v ariables are L 1 -p enalized to promote sparsity . One v ery reasonable in terpretation of our approach is that w e’ve added slac k v ariables to logistic regression, and m uch as they help robustify SVMs, slac k v ariables can b enefit GLMs as well. Ho wev er, it is imp ortan t to remember that these approaches ha v e significant differences, and can ha v e widely v arying performance in practice. T ak e for example the follo wing simulation, where p ositive and negativ e examples are dra wn from tw o distinct multiv ariate normals, with µ = (0 , 0) , Σ = 1 · I 2 and µ = (1 , 1) , Σ = 1 . 5 · I 2 , respectively . On a clean dataset, the robust mo del ac hieves an accuracy of 73 . 33 ± 0 . 41%, and a soft-margin SVM p erforms v ery similarly , at 73 . 28 ± 0 . 42%. After flipping negative lab els uniformly at random with probabilit y 0.3, the robust mo del has performs at 66 . 37 ± 0 . 60%, while the SVM drops to 63 . 81 ± 0 . 85%. 7 F uture W ork A natural direction for future work is to extend the mo del to a m ulti-class setting. One option is to introduce a γ for e v ery class except the negativ e one, so that there are n ( c − 1) shift parameters in all. W e could then apply a group lasso, with eac h group consisting of the γ for a particular datap oin t (Meier et al., 2008). 14 This wa y all of a datap oint’s shift parameters drop out together, which corresp onds to the example b eing correctly labelled. A simpler approac h is to use one-vs-all classification: w e train one binary robust model for each class, and ha ve them v ote on an example’s lab el. W e hav e found preliminary success with this metho d in a relation extraction task. CRFs and other sequence mo dels could also b enefit from the addition of shift parameters. Since the extra v ariables can b e neatly folded in to the linear term, con vexit y is preserv ed and the mo del could essentially b e trained as usual. 8 Conclusion W e presented a robust extension of binary logistic regression that can outp erform the standard mo del when annotation errors are present. Our metho d introduces shift parameters to allow datap oin ts to mov e across the decision b oundary . It largely main tains the efficiency and scalability of logistic regression, but is b etter equipp ed to train with noisy data and can also help iden tify mislab elled examples. As large, noisy datasets con tinue to gain prev alence, it is imp ortan t to develop classifiers with robustness in mind. Most promising seem to be mo dels that incorpo- rate the potential for mislabelling as they train. W e presen ted one suc h mo del, and demonstrated that explicitly accounting for annotation errors can provide significan t b enefit. Ac kno wledgmen ts I am very grateful to my advisor Chris Manning for b eing so encouraging ov er the past few years, and for his many helpful insights and suggestions. Thank y ou to the whole Stanford NLP group for b eing so w elcoming during my time as an undergraduate and Masters student. I would esp ecially like to thank Mihai Surdean u for b eing a patient and encouraging men tor, and Gabor Angeli for his suggestions. Finally , I am thankful to Rob Tibshirani and Stefan W ager for their in v aluable advice and support. 15 App endix A. The Lab el-Flipping Mo del Here we give a more careful description of the mo del from (Bootkra jang and Kaban, 2012), and fill in details missing from the original presentation. This mo del assumes that annotations errors are pro duced from lab el-flipping: eac h example’s true lab el is flipp ed with a certain probability before b eing observed. Our notation in the deriv ations is largely the same as that introduced in Section 3. Mo del The authors mo dify standard logistic regression to contain latent v ariables z rep- resen ting a ‘true lab el’ for each datap oin t. Then x relates to z through a logistic mo del as usual, and z is connected to the observ ed lab el y through a collection of flipping probabilities γ . There is one γ p er pair of classes, so that γ ab represen ts the probability of an example’s lab el flipping from class a to b . Figure 3 represents this set-up as a graphical mo del. During testing, w e discard the γ parameters and predict using only θ . EM deriv ation The authors present an iterative algorithm for learning θ and γ , but we find it simpler and more informativ e to use Exp ectation Maximization, a common metho d for estimating parameters in laten t-v ariable mo dels. T o begin, the log-likelihoo d of the data is given b y l ( θ , γ ) = n X i =1 log p ( y ( i ) | x ( i ) , θ , γ ) = n X i =1 log X z p ( y ( i ) , z | x ( i ) , θ , γ ) In EM w e w ork with the exp ected log-lik eliho o d of the join t, which provides a con v ex lo wer b ound on the true lik eliho o d: Q ( θ , γ ) = n X i =1 X z p ( z | y ( i ) , x ( i ) ) log p ( y ( i ) , z | x ( i ) , θ , γ ) E-step Infer the laten t distribution p ( z | y , x ). Letting g denote the sigmoid func- tion, θ ( c ) represen t the weigh t vector for class c and γ c 1 c 2 b e the probability of flipping from class c 1 to c 2 , we hav e p ( c | y , x ) = p ( y , c | x ) p ( y | x ) = p ( y | c ) p ( c | x ) P z p ( y | z ) p ( z | x ) = γ cy g ( x T θ ( c ) ) P z γ z y g ( x T θ ( z ) ) 16 Figure 4: Plate diagram for the label-flipping mo del. M-step Maximize the exp ected log-likelihoo d to obtain γ and θ . Using the defi- nition of Q ab ov e we ha ve Q ( θ , γ ) = n X i =1 X z p ( z | y ( i ) , x ( i ) ) log p ( y ( i ) | z , γ ) p ( z | x ( i ) , θ ) = n X i =1 X z p ( z | y ( i ) , x ( i ) ) log γ z y g ( x ( i ) T θ ( z ) ) = n X i =1 X z p ( z | y ( i ) , x ( i ) ) log γ z y + n X i =1 X z p ( z | y ( i ) , x ( i ) ) log g ( x ( i ) T θ ( z ) ) (2) It is clear from this equation that γ and θ can b e maximized separately . F or the γ parameters, we ha ve the additional constraint that for fixed c , the γ cz m ust sum to 1. W e construct the Lagrangian and set deriv ativ es to zero: Q ( γ ) = n X i =1 X z p ( z | y ( i ) , x ( i ) ) log γ z y ( i ) + X z 1 β z 1 (1 − X z 2 γ z 1 z 2 ) 0 = ∂ Q ( γ ) ∂ γ c 1 c 2 = n X i =1 I { y ( i ) = c 2 } p ( c 1 | c 2 , x ( i ) ) γ c 1 c 2 + β c 1 whic h implies γ c 1 c 2 = P i I { y ( i ) = c 2 } p ( c 1 | y ( i ) , x ( i ) ) − β z 1 = P n i I { y ( i ) = c 2 } p ( c 1 | y ( i ) , x ( i ) ) P i p ( c 1 | y ( i ) , x ( i ) ) (3) 17 No w for the θ ( c ) w e first calculate ∂ ∂ θ ( c 1 ) j g ( x T θ ( c 1 ) ) = ∂ ∂ θ ( c 1 ) j e − x T θ ( c 1 ) 1 + P c e − x T θ ( c ) ! = − x j e − x T θ ( c 1 ) 1 + P c e − x T θ ( c ) − e − x T θ ( c 1 ) (1 + P c e − x T θ ( c ) ) 2 · − x j e − x T θ ( c 1 ) = g ( x T θ ( c 1 ) ) 2 − g ( x T θ ( c 1 ) ) x j Through a similar pro cess, we can deriv e ∂ ∂ θ ( c 1 ) j g ( x T θ ( c 2 ) ) = g ( x T θ ( c 1 ) ) g ( x T θ ( c 2 ) ) x j and for c 2 = 0, ∂ ∂ θ ( c 1 ) j 1 1 + P c e − x T θ ( c ) = g ( x T θ ( c 1 ) ) 1 (1 + P c e − x T θ ( c ) ) 2 ! x j W e are no w in a p osition to calculate the gradien t with resp ect to θ ( c 1 ) i : ∂ Q ( θ ) ∂ θ ( c 1 ) j = n X i =1 X z p ( z | y ( i ) , x ( i ) ) ∂ ∂ θ ( c 1 ) j log g ( x ( n ) T θ ( z ) ) = n X i =1 X z 6 = c 1 p ( z | y ( i ) , x ( i ) ) g ( x ( i ) T θ ( c 1 ) ) + p ( c 1 | y ( i ) , x ( i ) )( g ( x ( i ) T θ ( c 1 ) ) − 1) x ( i ) j = n X i =1 g ( x ( i ) T θ ( c 1 ) ) X z p ( z | y ( i ) , x ( i ) ) − p ( c 1 | y ( i ) , x ( i ) ) ! x ( i ) j = n X i =1 g ( x ( i ) T θ ( c 1 ) ) − p ( c 1 | y ( i ) , x ( i ) ) x ( i ) j (4) Equation (3) is quite intuitiv e – we obtain nearly the same gradient as in standard m ultinomial logistic regression ∂ Q ( θ ) ∂ θ ( c 1 ) j = n X i =1 g ( x ( i ) T θ ( c 1 ) ) − I { z ( i ) = c 1 } x ( i ) j except that I { z ( i ) = c 1 } has been replaced with its exp ectation, p ( c 1 | y ( i ) , x ( i ) ). 18 Connection to Instance-W eigh ting In terestingly , w e can cast the ab ov e pro cedure for selecting θ as a form of instance- w eighting. Concretely , we copy every datap oin t k times where k is the num b er of classes, so that eac h copy corresp onds to a p ossible class. Then b y w eighting copy c b y p ( c | y ( i ) , x ( i ) ), w e recov er the second term from equation (1), which is what we set out to optimize. Standard instance-weigh ting tec hniques determine the class-mem b ership proba- bilities p ( c | y ( i ) , x ( i ) ) using an example’s distance from the cen troid of each class (Reb- bapragada and Bro dley , 2007; Thiel, 2008). The lab el-flipping mo del, in contrast, iterativ ely estimates these probabilities through EM. While this mo del is in some w ays more sophisticated, previous instance-weigh ting metho ds ha ve sho wn to be effectiv e empirically and ma y still provide imp ortan t insigh t. In particular, instead of assuming that each datap oint flips from class a to b with fixed probability γ ab , w e could define γ ab b e a function (p erhaps sigmoid) of the datap oint’s distance to the class cen troids. This w a y the flipping probabilities can be more fine-grained, enco ding information specific to each datap oin t. App endix B. Comparison with Other Metho ds W e now compare the robust mo del against other metho ds designed to handle an- notation errors. In particular, we test its p erformance against the model from Bo otkra jang and Kaban (2012), whic h is a go o d representativ e of approaches based on a lab el-flipping mo del. W e also compare against a common form of prefiltering based on k-nearest neighbors that w as popularized b y Brodley and F riedl (1999). Sim ulation Exp eriments Unless noted otherwise, in all exp eriments that follow we simulate logistic data with 50 features drawn Uniform(-5, 5), with θ j = 2 for j = 1 , . . . , m and zero in tercept. W e create training, developmen t, and test sets eac h of size 500, and noise is introduced into the training and dev elopmen t sets by flipping negative lab els uniformly at random with 0 . 3 probabilit y . The filtering approac h is implemented as follows: for each example, we examine its k nearest neighbors in feature space. If the lab el of one of these neighbors dis- agrees with the example’s lab el, then it is discarded from the train set. A logistic classifier is then trained on this filtered dataset. W e select k based on the develop- men t set. Note that if k is 1, then no examples are filtered and the model falls bac k to standard logistic regression. W e implemen t the lab el-flipping mo del through the EM pro cedure deriv ed in App endix A, learning the w eights for θ using a standard pac k age for logistic regression that supports instance w eighting. The results of these sim ulations can b e found in T able 7. 19 exp erimen t baseline prefiltering flipping robust 1 79 . 55 ± 0 . 27 87 . 00 ± 0 . 37 87 . 14 ± 0 . 13 81 . 11 ± 0 . 27 2 79 . 15 ± 0 . 27 86 . 59 ± 0 . 35 85 . 00 ± 0 . 12 80 . 58 ± 0 . 27 3 87 . 11 ± 0 . 25 87 . 11 ± 0 . 25 91 . 15 ± 0 . 16 91 . 65 ± 0 . 14 4 85 . 95 ± 0 . 33 92 . 87 ± 0 . 56 90 . 28 ± 0 . 27 94 . 10 ± 0 . 52 T able 6: Accuracy of eac h mo del in the v arious simulation experiments. The b olded en tries highligh t the b est-p erforming mo del. Exp erimen t 1 In our first experiment, errors are introduced b y flipping negativ e lab els uniformly at random with 0 . 3 probability . While robust logistic regression do es pro vide an impro v ement ov er the baseline, the prefiltering and flipping mo dels p erform substantially better. The assumptions of this sim ulation exactly match those of the flipping model, so it naturally p erforms w ell. (As further evidence the flipping mo del achiev es a go o d fit, it correctly learns the en tries of the γ matrix.) Prefiltering also achiev es an impressive accuracy , as the simulation matches the mo del’s assumption that an example’s nearest neighbors should share its lab el. Exp erimen t 2 W e next sim ulate data with features dra wn Normal(0, 1). The results are similar to those in the first exp erimen t. W e see that prefiltering is still able to correctly iden tify mislab elled examples, although it no w selects smaller v alues for k since man y datapoints lie near the decision b oundary . The robust and flipping mo dels sho w somewhat less of an improv emen t ov er the baseline, p erhaps b ecause it is harder to distinguish the points that are truly mislabelled from those that hav e crossed the boundary b y c hance. Exp erimen t 3 W e now set m = 1 and return to dra wing features Uniform(-5, 5) with θ = 2 and zero intercept. In this exp erimen t, errors are in tro duced in a more systematic wa y: all negative examples with feature v alues b et ween -5 and -4 are switc hed to p ositive. This set-up represen ts a plausible scenario in whic h datap oin ts with similar feature v alues are lik ely to b e flipp ed together. As discussed in Section 5.2, suc h a situation could arise if the annotations w ere generated through a noisy automatic pro cess. W e observe during training that prefiltering alwa ys rev erts to k = 1, so that it do es not filter out an y p oin ts and p erforms identically to the baseline. This sim u- lation demonstrates the drawbac ks of training the filtering classifier on noisy data. The mislab elled examples are clustered together in feature space, so for most of these p oin ts the kNN classifier fails to recognize their lab els ha ve b een flipped. Moreo ver, for some v alues of k the classifier b egins to filter out correct p oin ts adjacen t to the flipp ed region. The label-flipping mo del still performs well, but shows muc h less of an impro ve- men t than in experiments 1 and 2. W e susp ect that the farther the distribution of 20 mo del precision recall F1 standard 76.99 85.87 81.19 prefiltering 76.46 90.85 83.04 flipping 76.71 86.28 81.21 robust 77.04 90.47 83.22 T able 7: Accuracy of eac h mo del in the v arious simulation experiments. The b olded en tries highligh t the b est-p erforming mo del. errors is from uniform, the less the model’s adv an tage will be. Exp erimen t 4 In this exp eriment w e test whether these metho ds are sensitiv e to model missp ecification b y generating data that is not quite logistic. Recall that if p ( x | y = 0) and p ( x | y = 1) are multi-v ariate Gaussians with the same cov ariance matrix, then p ( y | x ) follo ws the logistic mo del. If the t wo Gaussians hav e different co v ariance matrices, then p ( y | x ) will differ slightly from logistic. Concretely , we still sim ulate data with features drawn Uniform(-5, 5), but no w generate lab els using a N ( − 2 , 2 I ) distribution for the negativ e class and N (2 , I ) for p ositive. All three mo dels p erform b etter than baseline, whic h demonstrates they are robust to small deviations from the logistic assumption. Interestingly , the robust mo del sho ws the most impro v ement, p erhaps suggesting it is the b est c hoice for realistic data. Natural Language Exp eriments W e no w run eac h mo del on the AMT NER dataset from Section 4.3. F or all mo dels the θ parameters are L 2 -regularized, and h yp er-parameters are selected b y cross- v alidating on the training data. The results are shown in T able 8. The robust model provides a significant impro v ement, while the flipping mo del p erforms almost identically to the baseline. This result has a simple explanation: during training w e observ ed that the γ matrix consisten tly con verged to the iden tity , so that for eac h class c , γ cc = 1, but all other components were zero. This solution corresp onds to the situation in which no lab el-flipping o ccurred, and so giv es the same v alues for θ as standard logistic regression. Changing the wa y in whic h γ and θ are initialized did not seem to help. W e tried randomly subsampling the features to achiev e a smaller ratio of fea- tures to training examples. With fewer features, the model indeed learns a γ matrix differen t from the iden tity and giv es sligh tly better accuracy than a baseline, al- though b oth mo dels p erform v ery p o orly . This finding suggests that in our original exp erimen t, the θ parameters already provide enough degrees of freedom, so the mo del essentially ignores the extra γ parameters. When an example is mislab elled, it ma y b e b etter to ‘fiddle’ one of the many θ parameters, instead of mo difying 21 a γ , whic h has ma jor rep ercussions across examples. Neither strengthening the L 2 -regularization nor ev en switc hing to an L 1 p enalt y appeared to help. In terestingly , the prefiltering approach p erforms nearly as well as the robust metho d on this dataset. Lo oking at the examples it c ho oses to discard, most of them are indeed misannotated. W e suspect that prefiltering succeeds here b ecause the training data is highly redundant. F or example the mo del threw out the word ‘Wilson’, which was incorrectly mark ed as negativ e, and we sa w man y other places in the corpus where ‘Wilson’ had a p ositiv e lab el. In datasets where there is less redundancy , and esp ecially those situations in whic h errors are systematic, we exp ect the prefiltering approac h to p erform worse. While prefiltering ultimately helps p erformance, it still discards examples that app ear unusual but are lik ely v aluable. The model thro ws out b oth tok ens from the phrase ‘Cosmic Microw a ve’, for example, although they are correctly labelled as negativ e. App endix C. Implementation Details W e no w describ e ho w to train the robust model using glmnet , starting with the case where the θ parameters are not p enalized. Equation (3) from Section 3.2 sho ws our reparametrized training ob jective. It can equiv alen tly be written as l ( θ 0 ) = n X i =1 y i g ( θ 0 T x 0 i ) + (1 − y i ) 1 − g ( θ 0 T x 0 i ) − λ m + n X j =0 p j | θ 0 ( j ) | where p = (0 , . . . , 0 , 1 , . . . 1) is a v ector of p enalty factors, commonly used to allo w differen tial shrink age. The follo wing co de snipp et trains suc h a mo del for a full path of λ : robust.train.data = cbind(train.data, diag(N)) penalties = append(rep(0, times=P), rep(1, times=N)) robust.fit = glmnet(robust.train.data, as.factor(train.labels), family=‘binomial’, penalty.factor=penalties, standardize=FALSE) When θ is L 1 -regularized as w ell, we instead adopt the following trick. F actoring out κ in equation (2) giv es us l ( θ , γ ) = n X i =1 y i g ( θ T x i + γ i ) + (1 − y i ) 1 − g ( θ T x i + γ i ) − κ m X j =1 | θ j | + λ κ n X i =1 | γ i | 22 Letting X 0 = [ X | κ λ I n ] and θ 0 = ( θ 0 , . . . , θ m , λ κ γ 1 , . . . , λ κ γ n ), we can now train the mo del as usual. If desired, it is simple reco v er the correct v alues for γ . These com- mands train a regularized model for fixed κ and λ : relative.penalty = lambda / kappa robust.train.data.local = cbind(train.data, diag(N)/relative.penalty) robust.fit = glmnet(robust.train.data.local, as.factor(train.labels), lambda=kappa, family=‘binomial’, standardize=FALSE) It ma y seem that one could also use the strategy of supplying a vector of penalty factors, but glmnet in ternally rescales these factors to sum to n . Moreo ver, the pro vided tec hnique can b e used with practically any soft ware for L 1 regularization. 23 References U. Alon, N. Bark ai, D. A. Notterman, K. Gish, S. Ybarra, D. Mack, A. J. Levine. 1999. Broad patterns of gene expression rev ealed b y clustering analysis of tumor and normal colon tissues prob ed by oligonucleotide arrays. National A c ademy of Scienc es of the Unite d States of A meric a. Galen Andrew and Jianfeng Gao. 2007. Scalable T raining of L 1 -Regularized Log-Linear Mo dels. ICML. Sylv ain Arlot and Alain Celisse. 2010. A surv ey of cross-v alidation procedures for mo del selection. Statistic al Surveys. Y oram Bachrac h, Thore Graep el, T om Mink a, and John Guiver. 2012. How T o Grade a T est Without Knowing the Answers: A Bay esian Graphical Mo del for Adaptive Cro wd- sourcing and Aptitude T esting. arXiv pr eprint arXiv:1206.6386 (2012). Jakramate Bo otkra jang and Ata Kaban. 2012. Lab el-noise Robust Logistic Regression and Its Applications. ECML PKDD. Carla E. Bro dley and Mark A. F riedl. 1999. Identifying Mislab eled T raining Data. JAIR. Emman uel J. Candes, Xiaodong Li, Yi Ma, John W right. 2002. Robust Principal Compo- nen t Analysis? arXiv pr eprint arXiv:0912.3599, 2009. Hamish Cunningham, Diana Ma ynard, Kalina Bon tchev a, V alentin T ablaan. 2002. GA TE: an Arc hitecture for Developmen t of Robust HL T Applications. ACL. Nan Ding and S. V. N. Vishw anathan. 2010. t-Logistic regression. NIPS. Shipra Dingare, Malvina Nissim, Jenny Fink el, Christopher Manning, and Claire Grov er. 2005. A system for iden tifying named entities in biomedical text: How results from tw o ev aluations reflect on both the system and the ev aluations. Comp ar ative and F unctional Genomics. Jenn y Rose Finkel, T rond Grenager, Christopher Manning. 2005. Introduction to the CoNLL-2003 Shared T ask: Language-Indep enden t Named En tity Recognition. ACL. Jerome F riedman, T revor Hastie, Rob Tibshirani 2009. Regularization P aths for General- ized Linear Mo dels via Coordinate Descen t. Journal of statistic al softwar e. T errence S. F urey , Nello Cristianini, Nigel Duffy , David W. Bednarski, Michel Sch ummer, Da vid Haussler. 2000. Supp ort vector mac hine classification and v alidation of cancer tissue samples using microarra y expression data. Bioinformatics. P eter J. Hub er and Elvezio M. Ronchetti. 2000. R obust Statistics. John Wiley & Sons, Inc., Hoboken, NJ. Ander In txaurrondo, Mihai Surdean u, Oier Lopez de Lacalle, and Enek o Agirre. 2013. Remo ving Noisy Mentions for Distant Sup ervision. Congr eso de la So cie dad Esp aola p ar a el Pr o c esamiento del L enguaje Natur al. Ko ji Kadota, Daisuk e T ominaga, Y utak a Akiy ama, Katsutoshi T ak ahashi. 2003. Detecting outlying samples in microarra y data: A critical assessmen t of the effect of outliers on sample. ChemBio Informatics Journal. Andrea Malossini, Enrico Blanzieri, Raymond T. Ng. 2006. Detecting p otential lab eling errors in microarrays by data p erturbation. Bioinformatics. Hamed Masnadi-Shirazi, Vijay Mahadev an, and Nuno V asconcelos. 2010. On the design of robust classifiers for computer vision. IEEE International Confer enc e Computer Vision and Pattern R e c o gnition. Diana Maynard, V alentin T ablan, Cristian Ursu, Hamish Cunningham, Y orick Wilks. 2001. Named En tit y Recognition from Diverse T ext Types. R e c ent A dvanc es in Natur al L an- guage Pr o c essing. 24 Luk as Meier, Sara v an de Geer, Peter Buhlmann. 2008. The group lasso for logistic regres- sion. Journal of the R oyal Statistic al So ciety. T etsuji Nak aga wa and Y uji Matsumoto. 2002. Detecting Errors in Corp ora Using Support V ector Mac hines. COLING. Da vid Pierce and Claire Cardie. 2001. Limitations of co-training for natural language learning from large datasets. EMNLP. Vik as Rayk ar, Shipeng Y u, Linda H. Zhao, Anna Jerebko, Charles Florin, Gerardo Her- mosillo V aladez, Luca Bogoni, and Linda Moy . 2009. Sup ervised learning from multiple exp erts: whom to trust when every one lies a bit. ICML. Umaa Rebbapragada and Carla E. Brodley . 2007. Class Noise Mitigation Through Instance W eighting. ECML. Christian Thiel. 2008. Classification on soft lab els is robust against lab el noise. Know le dge- Base d Intel ligent Information and Engine ering Systems Umaa Rebbapragada, Luk as Mandrake, Kiri L. W agstaff, Damhnait Gleeson, Rebecca Cas- tano, Stev e Chien, Carla E. Bro dley . 2009. Improving Onboard Analysis of Hyp erion Images b y Filtering Mislab eled T raining Data Examples. IEEE A er osp ac e Confer enc e. Sebastian Riedel, Limin Y ao, Andrew McCallum. 2010. Modeling Relations and Their Men tions without Labelled T ext. ECML PKDD. Yiyuan She and Art Ow en. 2011. Outlier Detection Using Noncon v ex Penalized Regression. Journal of the A meric an Statistic al Asso ciation. Erik F. Tjong Kim Sang, Fien De Meulder. 2003. Introduction to the CoNLL-2003 Shared T ask: Language-Indep endent Named En tity Recognition. CoNLL. Sundara V enk ataraman, Dimitris Metaxas, Dmitriy F radkin, Casimir Kulik owski, Ilya Muc hnik. 2004. Distinguishing Mislab eled Data from Correctly Labeled Data in Classier Design. IEEE International Confer enc e on T o ols with Artificial Intel ligenc e. John W righ t and Yi Ma. 2009. Dense Error Correction via l 1 -Minimization IEEE T r ans- actions on Information The ory. 25
Original Paper
Loading high-quality paper...
Comments & Academic Discussion
Loading comments...
Leave a Comment