Approaching allelic probabilities and Genome-Wide Association Studies from beta distributions
In this paper we have proposed a model for the distribution of allelic probabilities for generating populations as reliably as possible. Our objective was to develop such a model which would allow simulating allelic probabilities with different obser…
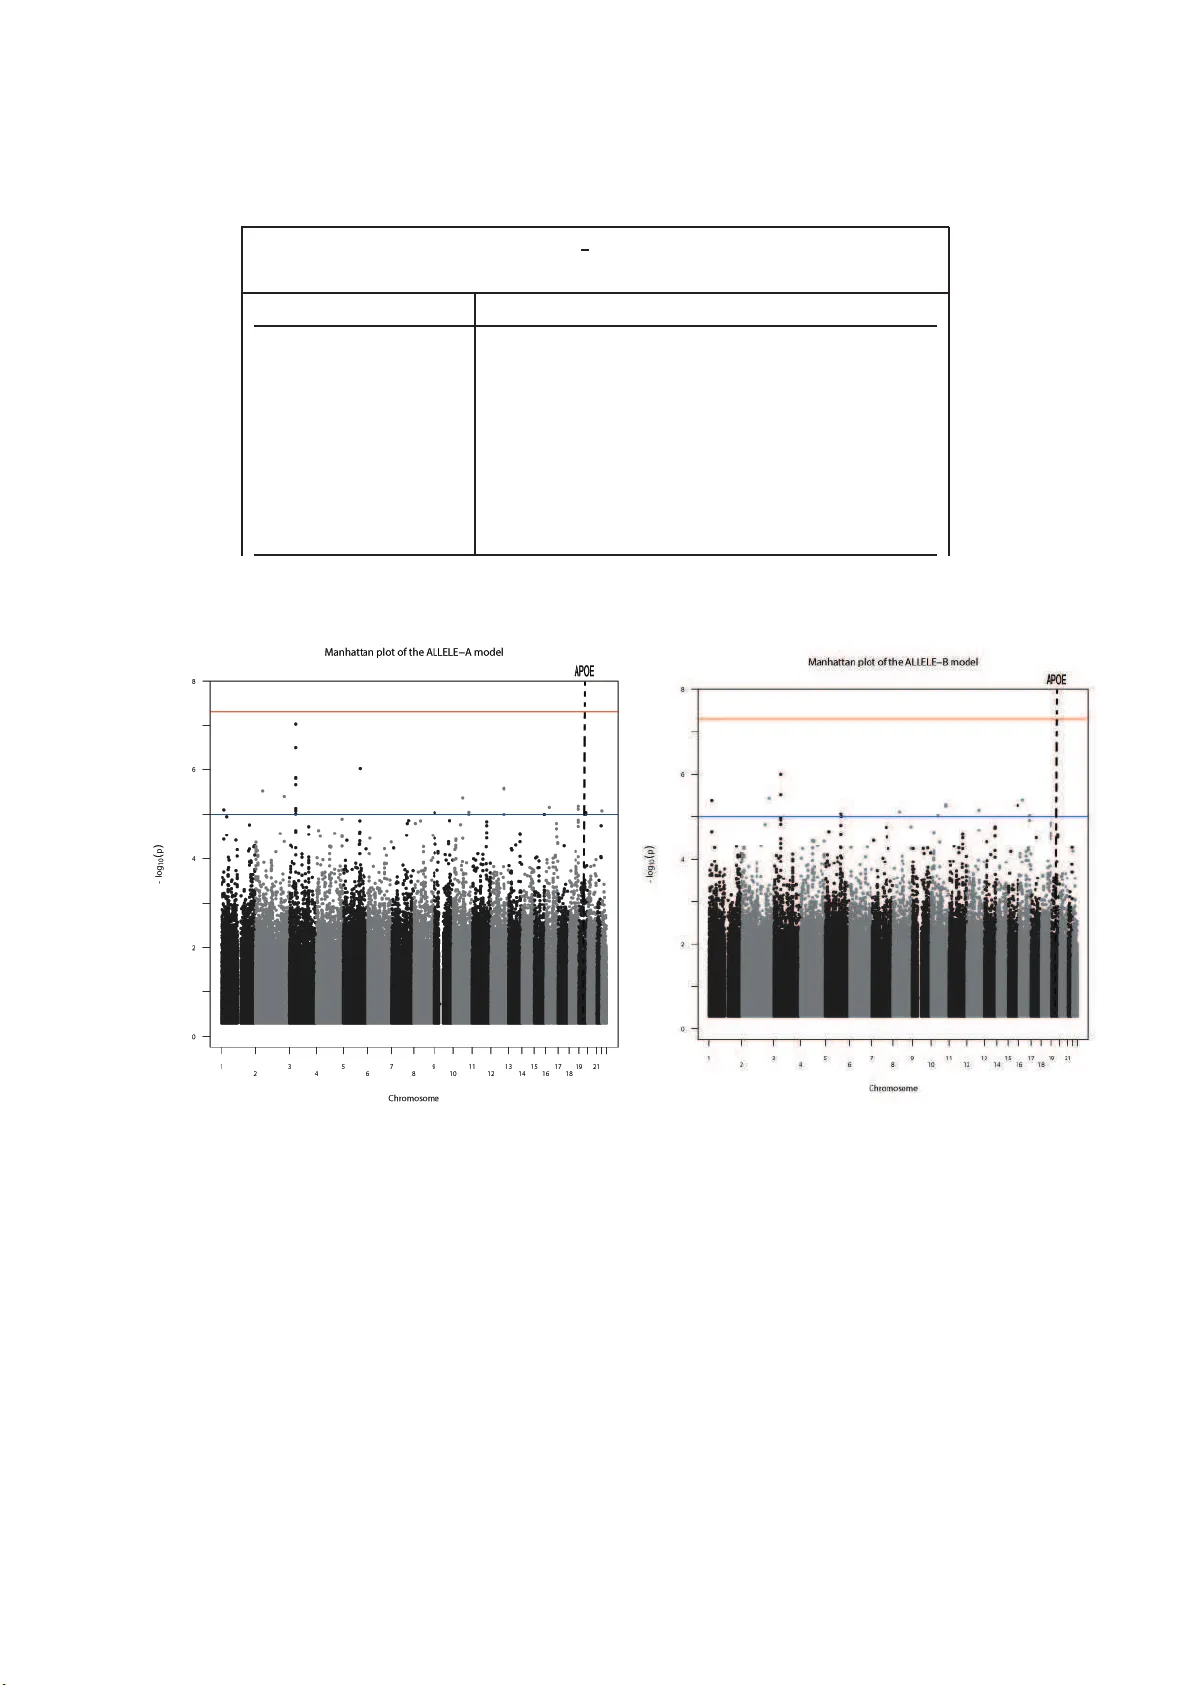
Authors: Jose Santiago Garcia-Cremades, Angel del Rio, Jose A. Garcia
Approac hing allelic probabilities and Genome-Wide Asso ciation Studies f rom b eta distributions. J. San tiago Ga r c ´ ıa-Cremades ∗ 1 , ´ Angel del R ´ ıo 1 , Jos ´ e A. Garc ´ ıa 2 , Ja vier Gay´ an 3,4 , An tonio G o nz´ alez-P´ e r ez 3,5 , Agust ´ ın Ruiz 3,6 , Oscar Sotolongo-Grau 6 , and Man uel Ruiz-Mar ´ ın 2 1 Departamento de Matem´ aticas, Universidad de Murcia. 2 Departamento de M´ eto do s Cuantitativ o s e Inform´ atico s, Universidad Polit ´ ecnica de Cartag ena. 3 Department of Estructura l Genomics, Neo co dex, Sevilla, Spain. 4 Bioinfosol, Sevilla, Spain. 5 Cent ro Andaluz de Estudios Bioinform´ aticos (CAEBi), Sevilla, Spa in. 6 Memory Clinic of F undaci´ o A CE . Ins titut Catal` a de Neuro ci` encies Aplicades. Barcelona . Spain. ∗ Correspondence to: Jos ´ e Santia go Garc ´ ıa Cremades, Departamento de Matem´ aticas, Universidad de Murcia, 30100, Espinard o, Spain. E-mail: js.garciacremades@gmail .com 1 Abstract In this pap er we ha ve prop osed a mo del fo r the distribution o f allelic probabilities for generating populations as reliably as possible. Our ob jectiv e w as to dev elop such a mo del which would allow simulating allelic pro babilities with different observed truncatio n and de- gree of noise. In additio n, we have also intro duced here a complete new appr oach to ana ly ze a genome-wide asso ciation study (GW AS) dataset, star ting from a new test o f asso ciation with a statistical distribution a nd tw o effect size s of each genotype. The new methodo logi- cal appr oach was applied to a real data set tog ether with a Monte Carlo ex pe r iment which show ed the power per formance of our new metho d. Finally , w e co mpared the new metho d based on b eta distribution with the conv entional metho d (based on Chi-Squa red distribu- tion) using the ag reement K appa index and a principal comp onent analys is (PCA). Both the analys e s show found differences existed b etw een bo th the approa ches while sele c ting the single n ucle o tide p o ly morphisms (SNPs) in asso ciatio n. Keywor ds: GW AS; case-con trol study; allelic p r obabilit y; b eta distribution 1 In tro d uction A fu ndamenta l p oint in a genome-wide association study (GW AS ) is to d efi ne a mo del for allelic probabilities. A goo d mo del m ust strongly dep end on the observ ed truncation and the d egree of noise that distort the observed (empirical) distribu tion from the exp ecte d one. By con trolling the tru n cation and the d egree of noise, allelic probabilities can b e sim ulated in a more r eliable scenario. The Human Genome Pro ject ( Lander et al. [ 2001 ]) and the successive improv emen ts on phys- ical and genetic maps of the human genome h av e b oosted the p ost-g enome era ( Altsh uler et al. [ 2010 ], F razer et al. [ 2007 ], Sac h id anandam et al. [ 2001 ]). Concomitan t tec hnological ac h iev e- men ts in the genetic fi eld hav e b een successfully app lied to u nco ve r thousands of genetic v ariant s link ed to m u ltiple p henot yp es. The deep c haracterization of lo ci inv olv ed in b oth Mendelian and complex d isorders will further help in impr o ving diagnostic resolution and, ultimately , provide clues on the design of next generation therap eutics based on etiolog y , rather than in symptoms or clinical findings. The genome-wide asso cia tion studies (GW AS) app ear to b e unstoppable. The d ev elop- men t of high density genome-wide p anels of sin gle nucleotide p olymorp hism (SNPs) and its application to bio-banked samp les, accum u lated du ring the last century , are the key elemen ts explaining GW AS emergence. Till, date on going GW AS p ro jects h a ve p ublished 1350 GW AS do cuments and more than 1800 GW AS significan t lo ci ( www.geno me.gov/g wastudies ; F reeze Dec/20 12) ( Hindorff et al. [ 2009 ]). Th e n ew lo ci ha v e b een detected using relativ ely w ell stan- dardized metho ds b ased on linear additiv e mo dels with or without cov arian ts, a case-co ntrol design, b y applying extensiv e qualit y con trol to ra w genot yp ing data, by in creasing d ensit y of mark ers based on in ference of man y non-genot yp ed marke r s using high p erformance compu- tation (HPC), impu tation tec hniques and by increasingly impro ved reference panels of single n u cleotides p olymorphisms (SNPs ) ( de Bakk er et al. [ 2008 ]). In sp ite of these successes, most GW AS fin dings, typical ly of sm all effect sizes, lea ve a large fraction of disease susceptibilit y still un exp lained; a ph enomenon commonly kno w n as “the 2 case of the missing heritabilit y” ( Meesters et al. [ 2012 ]). Seve r al p oten tial explanations for this phenomenon we re prop osed ( Manolio et al. [ 2009 ]). An excessiv e simp lification of statistical metho ds applied to GW AS datasets m igh t accoun t for this pr oblem. In this r egard, allelic and additive mo d els p erv asiv ely app lied to GW AS d ata could b e the gen uin e spherical co w ( Shelton and Cliffe [ 2007 ]) on genetic researc h. Th er efore, it is necessary to p erform a con tin u ous re-analysis and re-cycling of GW AS data b y applying no vel statistical metho d s to un co v er th ose lo ci that matc h p o orly with linear mo dels (see Ruiz-Mar ´ ın et al. [ 2010 ]). Here, w e h a ve p rop osed a mo del for the distribu tion of allelic p robabilities whic h allo w s to sim ulate allelic p robabilities with differen t observ ed truncation and degree of noise. W e hav e also in tro d uced a complete new approac h to GW AS analysis, s tarting from a new test for asso ciation and t wo effect sizes of eac h genot yp e. The new metho dological app roac h was applied to a real data set together with a Monte Carlo exp eriment which sho wed the p ow er p erformance of our new metho d an d compared th e new metho d with the con v entional metho d. 2 Materials and Metho ds 2.1 Mo deling Allelic Probabilit y Distribution Allele fr equ ency refers to the p rop ortion of a certain allele on a genetic lo cus of p opulation. These prop ortions often exh ibit extra v ariation th at cannot b e explained by a simple bin omial distribution. T he prop ortion (or bin omial p arameter p ) do es not remain constan t in the course of collecting data. Considering the situation, it w ould b e u s eful to assume that the binomial parameter p v aries b et we en obser v ations. The data could b e describ ed assu ming one of many con tinuous distributions for p , 0 < p < 1. Ho wev er, the most sensible distr ib ution for p is the b eta distribution, b ecause it is the natural conjugate prior distribu tion in the Ba yesia n sense. It is we ll kno wn th at most SNPs pr esen t a v ery lo w min or allele frequency (MAF), close to either 0 or 1 dep ending on the co dification. Ho wev er, these SNPs with v ery lo w MAF are systematically exclud ed from GW AS. After elimination, it is often assumed that the allele frequencies follo w a uniform distribution. This is consisten t with the b eta approac h, b ecause the uniform d istribution in th e in terv al [0,1] is the b eta distr ib ution with parameters α = β = 1. Ho we ver, the observed distribution of allelic frequ encies is not quite un iform. Th erefore, a fi ner analysis of th e observ ed d istr ibution is r equired. The b eta distribution w ith parameters α and β is denoted b y Beta( α, β ) and has the follo wing probabilit y density fu nction (PDF) f ( a ) = B α,β ( a ) R 1 0 B α,β ( r ) dr , if 0 < a < 1; 0 , otherwise . where B α,β ( a ) = a α − 1 (1 − a ) β − 1 and 0 < α, β ≤ 1. The mean µ and v ariance σ 2 of Beta( α, β ) are give n by µ = α α + β , σ 2 = αβ ( α + β ) 2 ( α + β + 1) . (1) Notice that the parameters α and β are determined by the m ean and v ariance ( 1 ) by the f ollo wing form u lae: α = µ ( µ − µ 2 − σ 2 ) σ 2 , β = (1 − µ )( µ − µ 2 − σ 2 ) σ 2 . (2) 3 In ord er to defi n e v ariables, w e assumed th e allelic p robabilit y as the pr obabilit y that one of th e p ossible alleles o ccurs. F or th is, we denoted the tw o most frequent alleles as A and B , resp ectiv ely . This s ym b olic asso ciation w as p erform ed at rand om with equal pr obabilit y . The allelic p robabilit y is d efined as the probabilit y of the o ccur rence of the allele denoted as A . Th is in tro d uces a rand om v ariable, referred as al lelic pr ob ability ( AP ). As explained ab o v e, sin ce the v alues of AP are pr op ortions, the random v ariable AP can b e mo deled with a b eta distrib ution Beta( α, β ). As the c h osen allele is d etermined at random the mean of AP s h ould b e 0 . 5. In terms of th e b eta distrib ution this implies that α = β . Ho we ver, the b eta distribution is not enough to prop erly mo del the allelic pr obabilit y dis- tribution in a r eal dataset. There are sev eral considerations that we m us t tak e into accoun t to explain this situation. F or example, the commercial genome-wide SNP c hip s designs or qualit y con trols (QC) applied to the genot yp ing studies, regularly exclude the SNPs w ith very s mall MAF, those with Hardy W ein b erg d isequ ilibrium, and those with a p o or qualit y , etc. F urther- more, the incorp oratio n of imp utation metho ds may also in tro d uce b ias in genome-wide allelic distribution b y imputing preferentia lly those S NPs with a higher MAF and those lo cated in regions in strong link age disequilibr ium. Thus, one cannot assu m e that AP take s all the v alues in the inte r v al [0 , 1] . Either design-based or QC-b ased pru ning of SNPs ind uce a truncation of b eta distribution. Therefore, w e ma y consider the random v ariable A P t of the truncated allelic probabilities in a GW AS with the truncation t , follo wing a b eta d istribution tru ncated in some in terv al [ t, 1 − t ], denoted as Beta( α, α, t, 1 − t ). Its p robabilit y d ensit y f unction is give n by: g ( a ) = B α,α ( a ) R 1 − t t B α,α ( r ) dr , if t < a < 1 − t ; 0 , otherwise . (3) Moreo v er, un iv ersal or general tru ncation exists in commercial c hip s that ha ve b een designed based on data deriv ed from w orld wide p opu lations as HapMap or 1000 genome pr o ject datasets. In con trast, the DNA samples for a sp ecific study are obtained from lo cal p opulations. It is w ell established that SNP fr equ encies v ary geographically du e to genetic drift and exceptionally , due to natur al selectio n in s p ecific endemic regions. Therefore, a lo w MAF in studied lo cal p opulation migh t not indicate necessarily an equiv alen t lo w MAF in w orldw ide p opu lations. As a consequence, selected SNPs in a commercial c hip migh t not b e obser ved in the local p op u lation, yielding a v ery lo w MAF that d ispla ys allelic probabilit y v alues close to 0 or 1. T o fur ther analyze this p henomenon, w e introdu ced the random v ariable a priori truncated lo cal allel ic prob ab ility , LAP t , and the difference D t = LAP t − A P t , w h ic h measures the v ariation b et w een the u n iv ersal allelic p robabilit y and the lo cal allelic probabilit y of a given S NP . 2.1.1 The lo cal allelic probabilities W e assu med that D t and AP t are indep en den t rand om v ariables. T o guarantee lo cal allelic probabilities to b e b ound in to the in terv al [0 , 1] (see App endix A ), w e assumed that D t is truncated in the int erv al [ − t, t ]. Hence we mo deled D t as a tru ncated normal distribu tion 4 N T (0 , δ, − t, t ). Its p robabilit y d ensit y fun ction is give n by: h ( x ) = n 0 ,δ ( x ) R t − t n 0 ,δ ( r ) dr , if − t < x < t ; 0 , otherwise . (4) where n 0 ,δ ( x ) = 1 √ 2 π e x 2 − 2 δ 2 is the probability d ensit y fun ction of a Normal distrib ution with mean zero and standard deviation δ . Notice that the mean of D t is equal to zero and its v ariance is denoted b y σ 2 D . As A P t and D t w ere assu med to b e ind ep endent. The probability density function of LAP t = AP t + D t (5) is th e con vo lu tion of the probab ility dens ity fu nctions of AP t and D t . As AP t is distribu ted as Beta( α, α, t, 1 − t ), it is straigh tforward that its mean should b e 0.5. The v ariance of AP t w as calculated using the in complete b eta function and th e regularized incomplete b eta function as shown in App endix B ( 19 ). On the other hand, as D t follo ws a N T (0 , δ, − t, t ) d istr ibution, its mean v alue is zero and its v ariance is giv en by ( 6 ). σ 2 D = δ 2 1 − 2 t δ φ ( t δ ) 2Φ( t δ ) − 1 , (6) where φ and Φ are th e PDF and CDF of the stand ard normal distribution N (0 , 1) resp ectiv ely . Moreo v er, w e ha ve 0 ≤ σ 2 D ≤ t 2 3 (see Lemma B.1 ). As AP t and D t are ind ep endent, the v ariance of L AP = AP t + D t is σ 2 l = σ 2 u + σ 2 D and hence σ 2 u ≤ σ 2 l ≤ σ 2 u + t 2 3 . This last expr ession includes the v ariance, taking int o the account the noisy data. Indeed, if a higher degree of noise exists, the D t v ariance can b e tak en as its maximum v alue, σ 2 D = t 2 3 . So, in this case, the expression σ 2 l ≈ σ 2 u + t 2 3 can b e used as a go o d appr o ximation for L AP v ariance. 2.1.2 A real data example In ord er to illustrate our approac h w e to ok the data from a practical case. Th e GW AS dataset is an imputed GW AS with 1,237 ,567 S NPs and 1225 in dividuals genot yp ed by the T ranslational Genomics Researc h I n stitute (TGEN) ( Reiman et al. [ 2007 ]), pr eviously pro cessed as part of a genome-wide meta-analysis lo oking for Alzheimer’s disease genetic risk factors ( An t ´ un ez et al. [ 2011, May 31 ]). Figure 1 shows the comparison b etw een the empirical allele frequencies with the PDF of the un iform (A), b eta (B) and truncated b eta (C) distributions, where the empirical allele frequencies are represente d by dots and the PDFs are represented by cont inuous lines. The parameters for the b eta and truncated b eta distribution we r e take n f or the distribu tion to hav e the same mean and v ariance as the empirical data. Figure 1 sh o ws that th e b eta distribu tion is not go o d enough to mo del the emp ir ical allelic frequencies. Th e observe d div ergence mainly 5 o ccurs in th e t wo tails of the d istribution w h ere th e theoretical b eta d istribution increases, w hile the data dramatically decreases. T he observed tru ncation is attributed to th e remo v al of low MAF alleles dur ing QC and the relativ e inability of imputation metho d s to mak e go o d inferences for lo w MAF SNPs. 0.0 0.2 0.4 0.6 0.8 1.0 p 0.0 0.5 1.0 1.5 2.0 f ❍ p ▲ A 0.0 0.2 0.4 0.6 0.8 1.0 p 0.0 0.5 1.0 1.5 2.0 f ❍ p ▲ B 0.2 0.4 0.6 0.8 1.0 p 0.5 1.0 1.5 2.0 f ❍ p ▲ C Figure 1: Empirical relativ e frequencies (dots) and uniform (A), b eta (B), and truncated b eta (C) PDFs (con tinuous lines). (A) P DF of uniform distribution in [0 , 1]. (B) PDF of Beta ( α, β ). (C) PDF of Beta ( α, β , t, 1 − t ) . The parameters α , β of the b eta distribu tions are tak en to fit the mean and v ariance of emp irical relativ e frequencies ( α = β = 0 . 928) and the trun cation is computed as the p ercentile 1 ( t = 0 . 0218). The empirical frequencies ha ve b een calculated grouping the d ata in 1000 interv als. In order to fit the data to equation ( 5 ), we to ok t as the p ercenti le 1 of the allelic p robabilities: t = 0 . 0218 . Sin ce σ 2 D b elongs to the interv al [0 , t 2 3 ] so that we can estimate σ 2 D as if it is a u niform random v ariable in such an in terv al. T h is means th at the exp ected v alue of σ 2 D is calculated as σ 2 D = t 2 6 = 7 . 9 · 10 − 5 . Then, the parameter δ can b e estimated as δ = 9 . 59 · 10 − 3 from ( 6 ). Since t is kn o wn, σ l can b e estimated from th e sample. As σ u only dep end s on the parameters α and t , the v alue of α can b e computed by solving (see App en dix B ), σ 2 u = σ 2 α,t = 1 (4 α + 2)B( α, α ) t α (1 − t ) α (4 t − 2) 1 − 2 I t ( α, α ) + α + 1 4 α + 2 − 1 4 = σ 2 l − t 2 6 , (7) where σ 2 α,t is the v ariance of the tr u ncated b eta distribu tion. Therefore, α = 0 . 7199 is obtained from this equation. The three p arameters, t , δ , and α determine the L AP t distribution fitting to the dataset. Figure 2 sh o ws the empirical relativ e fr equencies (dots) and the m o del of allelic probabilities LAP t (con tin u ous lin e) with the parameters computed ab o ve. The LAP t mo del fits muc h b etter to a real dataset than the previous an alyzed mo dels. This is esp ecially true for the tails of th e probability distribution fu nctions. Besides, the mean squared err or (MSE) estimator decreases for th e new mo del. As sho wn in T able I , the minimum MSE is reac hed for the LAP t mo del with 70 . 16% decrease in the MSE when compared with the uniform mo del. T able I: The Mean Squared E rror calculated in the four differen t dist ributions describ ed fitting the empirical allelic probability group ed in 1000 in t erv als. TGEN AP Uniform Beta Beta t LAP t M S E 0 . 0429 0 . 0517 0 . 03 15 0 . 0128 6 2.2 Case-con trol probabilities W e assumed a GW AS, where a SNP w as typed for N individu als, with N 0 con trols and N 1 cases. M s denotes the n umb er of in dividuals w hic h present a certain genotype ( s ). Next w e attempted to test f or th e follo w in g null hypothesis, H 0 : th e absence of asso ciation in genot yp e s. (8) Notice that under this null, th e probabilit y of b eing case conditioned to h a ving a give n genot yp e s , b s , is the same as the probab ility of b eing case, b . I n order to test this n ull, the follo wing b inomial distrib u tion, Bin ( M s , b s ), consisting of num b er of cases with genot yp e s can b e consider ed . Under the n u ll, b s can b e estimated as b b s = b b = N 1 / N . O n the other hand, as we mentioned b efore that the most sensible distribution for b s is the b eta distribu tion, Beta ( α M s , β M s ). This is b ased on the fact that the b eta distribution is the conjugate prior of the b inomial distribution ( MacKa y [ 2003 ]). The mean of b s can b e estimated by µ = ˆ b s = N 1 N and its v ariance σ 2 = ˆ b s (1 − ˆ b s ) M s = N 0 N 1 N 2 M s . Since the p opu lation under study is finite it is necessary to adju st the v ariance σ 2 for the p opulation size with the finite p opu lation correction factor N − M s N − 1 ( Isserlis [ 1918 ]). T his is sp ecially required when samp le size M s is not small in comparison with the p opulation size N , so that M s > 0 . 05 N . Therefore, when M s > 5% N , the v ariance σ 2 remains as σ 2 = N 0 N 1 ( N − M s ) N 2 M s ( N − 1) . Th us, un der th e n u ll hyp othesis, we can estimate α M s and β M s , α M s = N 1 N M s ( N − 1) N − M s − 1 and β M s = N 0 N M s ( N − 1) N − M s − 1 . (9) 0.2 0.4 0.6 0.8 1.0 p 0.2 0.4 0.6 0.8 1.0 1.2 1.4 f ❍ p ▲ Figure 2: Empirical relativ e frequencies (dots) of allelic p r obabilities of the TGEN sample, with 1 , 237 , 567 SNPs and PDF of tru n cated Beta( α, α, t ) + N T (0 , δ , t ) (con tinuous line) w ith 1225 individuals, where 757 are cases and 468 con trols. T he empirical relativ e frequ en cies w ere estimated grou p ing the data in 1000 in terv als b etw een [0 , 1]. 7 Figure 3 compares the empirical relativ e frequencies of b s in T GEN dataset (dots) with the PDF of Beta ( α M s , β M s ) (cont inuous line) i.e., the b eta distribution of b s under the null h yp othesis, for sev er al v alues of M s . 0.0 0.2 0.4 0.6 0.8 1.0 b 5 10 15 20 25 f ❍ b ▲ 0.0 0.2 0.4 0.6 0.8 1.0 b 5 10 15 20 25 f ❍ b ▲ 0.0 0.2 0.4 0.6 0.8 1.0 b 5 10 15 20 25 f ❍ b ▲ M s = 20 M s = 50 M s = 100 0.0 0.2 0.4 0.6 0.8 1.0 b 5 10 15 20 25 f ❍ b ▲ 0.0 0.2 0.4 0.6 0.8 1.0 b 5 10 15 20 25 f ❍ b ▲ 0.0 0.2 0.4 0.6 0.8 1.0 b 10 20 30 40 f ❍ b ▲ M s = 200 M s = 500 M s = 800 Figure 3: Empirical relativ e frequen cies of b s (dots) f or genot yp es with different num b ers of individuals (20, 50, 100, 200, 500 and 800 of individu als) and PDF of Beta( α M s , β M s ) (cont inuous line). Th us, we obtained a d ecision rule for H 0 at a desired confidence in terv al (CI) as, Accept H 0 if q ǫ/ 2 ≤ b s ≤ q 1 − ǫ/ 2 Reject H 0 otherwise (10) where ǫ is the t yp e I error, q ǫ/ 2 and q 1 − ǫ/ 2 the extreme p-v alues, and b oth are tied by the b eta distribution as, ǫ/ 2 = P r (Beta( α M s , β M s ) < q ǫ/ 2 ) = P r (Beta( α M s , β M s ) > q 1 − ǫ/ 2 ) . (11) Let p denote the pr op ortion of individu als of the general p opulation whic h p resen ts a giv en phenot yp e, and let c s denote the same prop ortion calculated in the ind ivid uals of a sample w ith a give n genot yp e s . T he ratio ϕ s = c s /p is called the effect of the genot yp e s on the phenotype in a giv en sample and represent s th e prop ortion in whic h an individu al with genot yp e s has more probability of p resen ting a phenotype than general p opu lation. Ho w ever, con trols are a represent ation of the p opulation, while cases are a samp le of in dividuals w ith the p h enot yp e. Therefore, it is p ossible to use the GW AS to find and estimation for c s , (see Ap p endix C ). Also, ϕ s and b s can b e related as ϕ s = N 0 N 1 b s 1 − b s , b s = ϕ s N 1 N 0 + ϕ s N 1 . (12) These last expr essions allo w constructing a decision rule that tak es into accoun t th e effect ( ϕ s ) of th e genot yp e s . 8 The new d ecision r u le is written in th e same w ay as ( 10 ) b ut in this case, ǫ/ 2 = P r (Beta( ξ 0 , ξ 1 ) < q ′ ǫ/ 2 ) = P r (Beta( ξ 0 , ξ 1 ) > q ′ 1 − ǫ/ 2 ) , (13) where, ξ 0 = ϕ s N 1 N 0 + ϕ s N 1 M s ( N − 1) N − M s − 1 and ξ 1 = N 0 N 0 + ϕ s N 1 M s ( N − 1) N − M s − 1 . (14) The measured effect, app lying the decision rule ( 10 ) ( ϕ s ), tak es only into accoun t th e data con tained in the sample. Ho wev er, the effect ( ϕ s ) that delimits the r ejection region for a giv en confidence lev el ǫ can b e computed from decision ru le ( 13 ). Here, we called this effect as the crit- ic al effe ct of genot yp e s , with a certain confidence lev el ǫ and it is denoted as Ψ ǫ s (App end ix C ). 2.2.1 Exploring BT in different genetic mo dels The test for GW AS explained ab o v e, hereafter, would b e referred as the Beta T est (BT) that considers eac h genot yp e c haracteristic indep enden tly . This ap p roac h pro v id es some new p ossibil- ities with resp ect to the con v entio n al asso ciation test based on continge n cy tables and hereafter, w ould b e called as Con ven tional T est (CT). In univ ariate CT , one can consider five genot yp e c haracteristics corresp ond ing to th e t wo alleles ( A and B ) and th eir thr ee p ossible combinations ( AA , AB and B B ), separately . Man y con tingency tables can b e constructed in the CT b y considering t wo or th ree genot yp e c haracteristics. Similarly , man y mo dels can b e used f or the BT, considering the differen t n on- empt y subsets of the genot yp e c haracteristic. F or example, there are eigh t p ossibilities f or b oth univ ariate CT and BT. Ho we ver, most of the mo d els are not meaningfu l for genetic pur p oses. F or example, the allelic feature against the homozygous genot yp e or the h eterozygous presence compared to the dominant mo del are t wo comparisons that do not provide useful inform ation. On th e other hand, th e o dds -r atio is not well d efined when more than t wo c haracteristics are considered. Therefore, in practice, only five mo dels are used, namely al lelic ( A v ersu s B ), dominant ( AA ∪ AB v ers u s B B ), r e c essive ( AA v ersu s AB ∪ B B ), heter ozygous ( AA ∪ B B v ersu s AB ) and genotyp e ( AA v er s us AB v ersus B B ). Next, we f o cused our attent ion in th e allelic CT m o del and the alleles A and B of BT mo dels b ecause of the fact that the allelic CT mo del is the most common mo del used in GW AS. The relationships among the mo d els can b e seen in Ap p endix D . Th e remaining mo dels are a v ailable from the auth ors up on request. 2.3 Measuring (or relating) lo c us effect in BT models Con ven tionally , o d ds-ratio is the effect measure estimated in a case-con trol GW AS. Let O R a b e the o d ds-ratio in allelic mo d el b etw een cases and con tr ols. T he m agnitude of effect of the allelic CT mo del ( O R a ) can also b e related to the effect of the BT. In other w ord s, the effect of a giv en mo del can b e expressed as a fun ction of O R a . In order to sim u late a case-con trol p opu lation, it is necessary to fix an o dd s-ratio v alue, for example, O R a , and another parameter lik e the MAF of a p opulation of con trols. Let x 0 b e the 9 MAF in a p opulation of con trols, an d x 1 the MAF in a p opulation of cases. If O R a is fi xed, x 1 can b e written as x 1 = O R a · x 0 1 − x 0 · (1 − O R a ) . (15) Next, using the Hardy-W ein b erg equilibrium (for short, HWE), it is p ossible to sim u late the case-co n trol p opulation of SNPs. The o dd s-ratio, as usually und ersto o d, sh o ws the difference b etw een the pr obabilit y dis- tribution for b eing case and the pr obabilit y d istribution for b eing con trol. The BT assumed a d ifferen t null h yp othesis: in eac h genot yp e charact eristic, the p robabilit y of b eing case is con tained in a confidence interv al centered around the pr op ortion b et ween cases and total p op- ulation N 1 / ( N 0 + N 1 ). This prop ortion can b e measured with the effect ϕ s , and it is fi xed f or eac h genot yp e c h aracteristic. F rom the HWE and us in g ( 15 ), the O R a and ϕ s (for s = A or B ) are related as follo w s: ϕ A = O R a (1 − x 0 · (1 − O R a )) and ϕ B = 1 (1 − x 0 · (1 − O R a )) . (16) Remark ably , if allelic frequencies in cases and control s are equal, there is no effect in an y mo del. In other words, x 0 = x 1 implies that O R a = 1 and ϕ s = 1. Figure 4 shows the effects ( ϕ s ) for differen t mo dels as a fu nction of the allelic o dds-ratio ( O R a ∈ [0 , 10]). Figure 4: In the 3D graph ic A, there are the effect of s = A ( ϕ A ) resp ect of the O R a b et ween zero and 10. In the 3D graphic B, there are the effect of s = B ( ϕ B ) resp ect of the O R a b et ween zero and 10, for d ifferent v alues of M AF . 3 Mon te Carlo Sim ulation A sim u lated dataset, consisting of N 1 = 1000 cases and N 0 = 1000 controls, was analyzed with b oth conv en tional c hi-square (CT) and the new asso cia tion (BT) tests in allelic mo dels. A total of 10 5 SNPs, with differen t minor allele frequencies (0 ≤ MAF ≤ 0 . 5), were simula ted und er the null hyp othesis i.e., to hav e no effect on the trait ( O R a = 1 or all the effects are equal to 1). This analysis can reflect whether the new Beta T est (BT) conforms to the theoretical b eta distrib u tion, and compares ho w the C on ven tional T est (CT) conforms to the Chi-square distribution. F or estimating the type I error for eac h test (size of the test), we coun ted the n u m b er of test-stati s tics that had v alues ab o v e the critical v alues of the exp ected d istribution. 10 T able I I: Type I Error (size) for ea c h mo del of Beta and Con ven tional tests, re- sp ectiv ely , taking the MAF as a random v alue b etw een [0 , 0 . 5] and differen t critical v alues of the exp ected distribution with corresp onding confidence lev els ( 0 . 05 , 0 . 01 and 0 . 001 ). 1 Exp ected BT Allele A Allele B DomA DomB Homoz s=AA s=AB s=BB 0.05 0.0489 0.0491 0.0493 0.0476 0.0491 0.0496 0.049 0.0494 0.01 0.0098 9 0.00989 0.0098 6 0.0092 6 0.0103 0.0099 6 0.0104 0.0098 2 0.001 0.0009 78 0.00 0957 0.0010 1 0.00073 9 0.00092 6 0.00107 0.00096 8 0.00098 9 Exp ected CT ALLELIC DOM REC HETER O Z GENO 0.05 0.0491 0.0494 0.0477 0.0492 0.0 466 0.01 0.0098 9 0.00 981 0.0092 6 0.0103 0.0093 7 0.001 0.0009 57 0.0009 78 0.000739 0.000916 0.0009 47 1 The mo dels are comp osed in BT by Allele A , Allele B , Dominant of A ( AA ∪ A B ) , Dominant of B ( AB ∪ B B ), Homozygous ( A A ∪ B B ) s = AA , s = AB and s = B B . While in CT, the models are al lelic ( A versus B ), dominant ( A A ∪ AB versus B B ), r e c essive ( AA versus AB ∪ B B ), heter ozygous ( AA ∪ B B versus AB ) and genotyp e ( AA versus AB vers u s B B ). In ord er to sim ulate the case-con trol p opulations under certain conditions, only t wo param- eters (MAF and an o dd s -ratio or ϕ s ) need to b e fixed, as explained b efore. Indeed, fi x in g MAF in con trols and the effect (o d ds-ratio or ϕ s ), the en tire p opulation is already defin ed. The p opu lations w ere sim u lated by generating at eac h SNP a random v alue for genot ypic probabilities of con trols according to MAF v alue and HWE. Once controls’ MAF v alue and effect w ere fixed, the MAF v alues for cases were straight f orw ard ly obtained, and follo wing HWE, the genot yp e p robabilities w ere compu ted, generating the cases p opulation. Using this metho d, b oth tests, C T and BT, yielded appro ximately the exp ected n u m b er of false p ositiv es (see T able I I ), suggesting th ey all conform to th e exp ected theoretical distribu - tions. T o estimate th e p ow er of b oth CT and BT, we carried out an analysis of a s im ulated dataset of 1000 cases and 1000 con trols. Sets of 10 5 SNPs were sim u lated under different alternativ e h yp othesis (see T able I I I ), with different effect sizes and minor allele frequencies (0 . 05, 0 . 2 and 0 . 4), with a fixed confidence lev el ǫ = 0 . 05. Th e effect of th e genot yp e characte r istics is related with the o d ds-ratio of corresp on d ing mo del. Note that some scenarios could n ot b e estimated due to HWE restrictions. Ou r results sh o wed that b oth tests detected SNPs in asso ciation with similar p o w er, dep ending on the new effect measuremen t and presenti n g there the allelic mo dels comparison. 11 T able I I I: P ow er of b oth tests BT and CT in sim ulat ed da ta, taking SNPs under the alternativ e of asso ciation, w ith differen t minor a lle le frequencies ( MAF ) and effect sizes at allelic mo dels ( ϕ A and ϕ B ). 1 Allele A MAF = 0.05 ϕ A ∈ [0 , 20 ] MAF = 0.2 ϕ A ∈ [0 , 5] MAF = 0.4 ϕ A ∈ [0 , 2 . 5] Fixed ϕ A MODEL POWER (in %) O R a POWER (in %) O R a POWER (in %) O R a 0.5 BT A 98.8 0.49 100 0.44 100 0.38 CT ALLELI C 98.89 100 100 0.67 BT A 74.4 0.66 99.99 0.62 100 0.55 CT ALLELI C 75.65 99.99 100 0.8 BT A 31.79 0.79 91.12 0.76 99.96 0.71 CT ALLELI C 33.27 91.12 99.96 1.25 BT A 40.26 1.27 96.7 1.33 100 1.5 CT ALLELI C 40.21 96.7 100 1.5 BT A 90.82 1.54 100 1.71 100 2.25 CT ALLELI C 90.75 100 100 2 BT A 100 2.11 100 2.67 100 6 CT ALLELI C 100 100 100 Allele B MAF = 0.05 ϕ B ∈ [0 , 1 . 0 5] MAF = 0.2 ϕ B ∈ [0 , 1 . 25] MAF = 0.4 ϕ B ∈ [0 , 1 . 67] Fixed ϕ B MODEL POWER (in %) O R a POWER (in %) O R a POWER (in %) O R a 0.8 BT B 100 6 100 2.25 100 1.63 CT ALLELI C 100 100 100 0.9 BT B 100 3.22 100 1.56 96.97 1.28 CT ALLELI C 100 100 96.97 0.95 BT B 100 2.05 86.36 1.26 48.67 1.13 CT ALLELI C 100 86.36 48.7 1.05 BT B 100 0.048 90.96 0.76 49.51 0.88 CT ALLELI C 100 90.96 49.53 1.1 BT B NA do esn’t exist 100 0.55 97.62 0.77 CT ALLELI C NA 100 97.63 1.2 BT B NA do esn’t exist 100 0.17 100 0.58 CT ALLELI C NA 100 100 1 First table is for allele A mod el and the second table for allele B mo del. F or eac h effect size ϕ and each minor allele frequency MAF t h e o dd s ratio of th e allelic mod el OR a is rep orted using ( 16 ), at a fixed confidence leve l ǫ = 0 . 05. 4 Application to Real Data In order to ap p ly the BT approac h to real data, a GW AS dataset with 1 , 237 , 567 SNPs (wh ere N 0 = 468 con trols and N 1 = 757 cases) w as u s ed (S ection 2.1.2 ). T able IV describ es the parameters of the allelic probabilit y distribu tion for cases, con trols, and total p opulation. As already sh o wn in Figure 2 , there are no allele frequen cies lo wer th an 0 . 01; ho wev er, there exists some noise close to the extreme v alues. The calculated p robabilit y of b eing case with a genot yp e c h aracteristic s is ve r y sensitiv e to parameter M s . Th is is sho wn in Figure 3 , w here b s is plotted for d ifferen t v alues of M s . This imp lies that results dep end on the frequency of havi n g the genot yp e s and the sample size. While making inference on the correlation of a phenotype and a genot yp e, one should take int o 12 T able IV: Summary of the TGEN allelic probabilities sample for cases, con trols, and cases and con t rols. TGEN impQC2: 1,237, 567 S NPs, 1225 ind ividuals, 757 cases and 468 con trols. Cases & C ontrols Cases Cont rols Empirical m ean b µ 0.5 00065 0.5000 63 0.5000 65 Empirical v ariance b v 0.09 16691 0.0917 528 0.0917 662 Minim um b v 0.01 0.01 0.01 T runcation P 1 0.018605 0.018092 0.018233 b α 0.666681 0.671064 0.669102 b δ 0.01871 0.01561 0.01623 Mean Squared Error 0.0128 0.0154 0.013 accoun t the num b er of individuals with suc h a genot yp e in the GW AS. Figure 5: M anh attan plot of th e new GW AS prop osed with b oth alleles mo del in BT. Figure 5 sho ws the Manhattan plot applied to the BT in the Allele A m o del within the sample describ ed ab o v e (TGEN). Asso ciated S NP on c hr omosome 19 is n ot displa yed in the figure b ecause of the c h osen scale. This SNP is related to the ap olipopr otein E (APOE) w ith a significan t p -v alue= 1 . 33 · 10 − 42 on BT. Note that the CT is a one-tailed test where the null hyp othesis of no asso ciation is rejected if p − v alue is lo w er th an ǫ and the direction of the effect determin es th e risk or pr otectiv e role of the SNP . Ho wev er the BT is a tw o-taile d test, w here the null hyp othesis of no asso cia tion is rejected if p -v alue is lo we r than ǫ/ 2 or bigger than 1 − ǫ/ 2. In this case, the risk or pr otectiv e role of the S NP was determined not only by the direction of th e effect but also b y the region of rejection. In other w ord s, p -v alue ≤ ǫ/ 2 implies ϕ s ≥ 1 and vic e-versa . Therefore, the p -v alue 13 information is enough to define the risk or p rotection asso ciation. 4.1 Measuring the concordance b etw een CT and BT The agreement b et w een t wo sets of resu lts could b e measured b y the Kappa in dex ( K ) of agreemen t ( Cohen [ 1960 ]). In this case, we us ed t wo categories: b eing in asso ciation or not, with different lev els of confidence. Kappa in dex is the estimator of agreemen t, compared in the paired mo dels. At p erfect agreemen t, K equals to one, while agreemen t giv en b y chance give s a v alue of K close to zero. T able V present s the allelic m o del comparison w ith their corresp onding BT mo dels (Allele A and Allele B). Notice that BT null hyp othesis rejecting region con tains app ro ximately the exp ected num b er of significan t SNPs than its corresp onding confidence lev el. Nonetheless, there are some S NPs that reac h significance in BT, bu t n ot in CT . T able V: The allelic paired mo dels compared with the Kappa index of agreemen t, calculated in column K appa , and the n umber of SNPs in concordance where b oth tests dete ct or not an asso ciation with the phenotype with a confidence lev el ǫ . 1 K1 ALLELE A cl Kappa P os Con c CT-BT+ CT+BT- Neg Conc ALLELIC ǫ = 0 , 05 0.97 61861 1944 165 1 11721 11 ǫ = 0 , 01 0.94 11792 914 576 1224285 ǫ = 0 , 001 0.777 946 314 228 1236079 K2 AL LELE B cl Kappa P os Con c CT-BT+ CT+BT- Neg Conc ALLELIC ǫ = 0 , 05 0.993 63164 456 348 1173599 ǫ = 0 , 01 0.985 12263 266 105 1224933 ǫ = 0 , 001 0.976 1163 46 11 12363 47 1 Pos Conc is the positive concordance, where b oth BT and CT reject the null hyp othesis of no asso ciation. Similarly , Ne g Conc is th e n egativ e concordance, where b oth BT and CT accept the null hypothesis. BT + C T − (resp ectively BT − CT +) represents the num b er of SNPs in discordance on b oth tests, where BT refuse (resp ectively , accept) an asso ciation and CT accept (resp ectively , reject) it. When comparin g CT w ith BT mo d el, the Kappa index sho wed some differences in the asso ciation tests. F or instance, a r emark able concordance ( K = 0 . 976, ǫ = 0 . 001) w as observe d while comparing the C T Allelic mo del with the BT Allele-B mo del (K2, T able V ). A remark able result from T able V summarized in T able VI , rev eals th at all th e SNPs, detected in asso ciation with the phenot yp e in CT test, were also detected in asso ciation w ith the BT test in any allele mo dels ( A or B ). Ho w eve r , sev eral SNPs d etected b eing asso ciated with th e BT (in Allele A or B mo del) w ere not detected by the C T (see T able VI ). F or example, for a giv en confidence leve l ǫ = 0 . 001, the 23% of p ositiv es, that are S NPs refus in g H 0 , we r e d etected by BT allelic mo dels s in ce CT allelic mo d el could not detect th em. 14 T able VI: Summary of the num b er of SNPs detected wit h a sso ciation in CT Allelic mo del and b oth BT allele mo dels ( A and B ) and t he ir differences, with a confidence lev el ǫ . 1 Either allele A or B P os Conc CT- BT+ CT+ BT- ǫ = 0 . 05 63512 2273 0 ǫ = 0 . 01 12368 1137 0 ǫ = 0 . 001 1174 3 54 0 1 Pos Conc is the positive concordance, where b oth BT and CT reject the null hyp othesis of no asso ciation. BT + CT − (respectively BT − CT + ) represents the number of SNPs in discordance on b oth tests, where BT refuse (resp ectivel y , accept) an asso ciation and CT accept (resp ectively , reject) it. The difference b et w een BT r esu lts and the corresp onding CT can b e su rprising at times. Indeed, one w ould exp ect muc h m ore concordance among CT and BT estimates. In order to understand the observ ed d ifferen ces, a comparison of p arameters space is advisable. 4.2 Comparisons with P r incipal Comp onen t Analyses Principal Comp onen ts Analysis (PCA) is a measurement that sh o ws the relationship b et w een t wo sets of p arameters. W e p erf ormed here PCA for analyzing the relationship b et w een the parameters from CT ( p -v alue of the χ 2 distribution and the o dds-ratio O R i corresp ondin g to the mo del) and from BT ( p -v al u e of the b eta distrib u tion, the effect ϕ s and the critical effect Ψ ǫ s ). PCA fin ds w hic h parameters explain the maximum v ariabilit y and also sorts the comp onen ts (transformed v ariables) b y their explained v ariance; the original v ariables ha v e corresp onding w eight s in eac h comp onen ts ( P earson [ 1901 ]). In su mmary , PCA found whic h v ariables explain th e maximum v ariabilit y in the CT and BT r esults, th e p ercenta ge of exp lained v ariance and th e intensit y . Differen t v ariabilit y explanation b etw een allelic CT mo d el and b oth alleles BT mo d els u sing three principal comp onen ts is shown in Figure 6 (a. and b.). These figur es sho w th e prop ortion explained v ariance is con tribu ted by eac h parameter in th e pr in cipal comp onents. The p -v alue and ϕ s of the BT, and the o dds-ratio O R of the CT explain the same v ariance, wh ic h means these thr ee parameters hav e the same direction as PC1. As exp ected, the p -v alue of C T (called as pC H I ) explains the v ariance along the second principal comp onent. Ho w eve r , the Critic al effe ct of th e BT Ψ ǫ s complemen ts th e third pr incipal comp onen t, wh ich means that some v ariabilit y cannot b e explained without it. As a m atter of fact, the Critical effect con tribu tes to the 87 . 72% of the third p rincipal comp onen t, whic h explains th e 15 . 17% of the total v ariance. Therefore, the principal comp onent analysis reflects that the results of b oth metho d s must differ in a region of the explaining v ariance. 15 4.3 Ranking of asso c iation T op results for BT analysis are presented in T able VI I . Briefly , we displa yed the r anking of the smallest p -v alues in BT ( < 10 − 5 ) including either A or B allele estimation and their corresp ond- ing r esults using con ven tional one d egree of freedom chi-squared tests applied to MAF (CT). W e also included the ranking order observe d for eac h mark er us in g b oth approac hes (BT and CT). As exp ected, most SNPs , but not all of them, exhibited very similar p − v alues and ranking order. Th is r esult is fully compatible with the p erformance of the global k appa index (T able V ). A w hole and comprehensiv e ranking is also included (Supp lemen tary file “RankingTGEN- p v alueBT.csv”). Of course, b oth strategies id en tified SNP mark er rs442063 8 on c h romosome 19, −1.0 −0.5 0.0 0.5 1.0 −1.5 −1.0 −0.5 0.0 0.5 1.0 1.5 ALLELIC − ALLEL A (PC1, PC2) Dim 1 (60.35%) Dim 2 (20.12%) OR pCHI pB Ef CrEf −1.0 −0.5 0.0 0.5 1.0 −1.5 −1.0 −0.5 0.0 0.5 1.0 1.5 ALLELIC − ALLEL A (PC1, PC3) Dim 1 (60.35%) Dim 3 (15.17%) OR pCHI pB Ef CrEf −1.0 −0.5 0.0 0.5 1.0 −1.5 −1.0 −0.5 0.0 0.5 1.0 1.5 ALLELIC − ALLEL A (PC2, PC3) Dim 2 (20.12%) Dim 3 (15.17%) OR pCHI pB Ef CrEf −1.0 −0.5 0.0 0.5 1.0 −1.5 −1.0 −0.5 0.0 0.5 1.0 1.5 ALLELIC − ALLEL B (PC1, PC2) Dim 1 (58.28%) Dim 2 (20.21%) OR pCHI pB Ef CrEf −1.0 −0.5 0.0 0.5 1.0 −1.5 −1.0 −0.5 0.0 0.5 1.0 1.5 ALLELIC − ALLEL B (PC1, PC3) Dim 1 (58.28%) Dim 3 (14.89%) OR pCHI pB Ef CrEf −1.0 −0.5 0.0 0.5 1.0 −1.5 −1.0 −0.5 0.0 0.5 1.0 1.5 ALLELIC − ALLEL B (PC2, PC3) Dim 2 (20.21%) Dim 3 (14.89%) OR pCHI pB Ef CrEf Figure 6: Th e w eigh ts of th e parameters in eac h Principal Comp onent (the first with the second, the first with the third and the second with the third, resp ective ly), tak en for the v ariables of th e Allelic mo del of CT is compared to the Allele A and B mo dels of BT. It describ es the eigen v alues (in %) of eac h principal comp onent. 16 T able VI I: T op smallest p − v alues computed with the BT for the Alleles A and B mo dels ( < 10 − 5 ) in the TGEN dataset, describ ed ab o v e (* sym b ol represents that sev eral markers in LD ha ve b een omited in a single signal with the lo west p − v alue). 1 CHR BP SNP MAF A1 A2 pvB T BT-Allele ϕ A ϕ B P si 0 . 05 A P si 0 . 05 B pvCT O R a M A M B 19 50114786 rs4420638 0,308 G A 1,33E-42 1 2,44 0,72 2 ,12 0,76 2,21E-34 3,39598 754 16 94 3 52481466* rs6784615 0,069 C T 9,43E-08 1 2,30 0,95 1,64 0,97 2,09E-06 2,43106 170 2 278 5 121942614 r s11953981 0,058 G A 9,60E-07 1 2,45 0,95 1,70 1,03 1,83E-05 2,56819 128 20 86 12 93847903 rs249152* 0,193 A G 2,64E-06 1 1,49 0,91 1 ,26 0,96 1,16E-05 1,63099 464 19 38 2 51804001 rs17864593* 0,016 A G 3,02E-06 1 5,40 0,98 2,24 1,00 NA 5,5108 5 39 2329 2 205265992 r s41511746 0,017 G C 3,76E-06 2 0,25 1,02 0 ,47 1,01 7,82E-06 0,241278 42 2408 16 26556972 r s12162084 0,157 A G 4,10E-06 2 0,66 1,08 0,80 1,04 9,34E-06 0,611134 385 2063 1 21773864 r s1536934 0,069 A G 4,21E-06 2 0,51 1,05 0,69 1,02 9,17E-06 0,479325 153 2057 10 68271216 rs4486514 0,04 C T 4,30E-06 1 2,71 0,97 1,69 1,01 7,54E-05 2,80962 9 3 2231 10 112534645 rs7077757* 0,211 T C 5,22E-06 2 0,71 1,10 0,83 1,05 1,21E-05 0,645986 515 1925 15 90462008 r s11074041 * 0,142 C G 5,45E-06 2 0,64 1,08 0,78 1,03 1,23E-05 0,597382 335 2019 18 71895842 rs359739* 0,192 A C 6,64E-06 1 1,46 0,92 1,22 0,95 2,58E-05 1,59007 470 1976 8 47534249 r s4313171 0,067 T C 7,68E-06 2 0,53 1,05 0,71 1,03 1,65E-05 0,502977 165 2285 22 17002691 r s12168275 0,038 G C 8,38E-06 1 2,72 0,97 1,65 1,00 0,00013 2,80573 87 2215 5 117744488 rs6595122 0,282 C A 8,61E-06 2 0,75 1,12 0,86 1,06 2,06E-05 0,667943 637 1621 19 50323656 r s17643262 * 0,082 A G 9,07E-06 1 1,88 0,95 1,37 0,97 5,69E-05 1,97991 192 2148 9 5583190 r s10815248 0,042 A T 9,23E-06 1 2,49 0,97 1,58 0,99 0,00011 2,57753 101 2309 10 53698470 r s10824310 0,065 T C 9,42E-06 2 0,52 1,05 0,71 1,03 2,02E-05 0,500702 159 2291 16 77974064 rs7192960 0,129 T C 9,57E-06 2 0,64 1,07 0,79 1,04 2,12E-05 0,59958 316 2134 1 The columns represent from left t o righ t the num b er of chromosome (Chr) , the base pair p osition of t he SNP (BP), the name of the SNP (SNP), the MAF val u e, cod e for minor allele (A1), co de for the other allele ( A2), the lo west p − val u e of BT allelic mod els (pvBT), the number of the allele mo del with lo west p − va lue of BT allelic mod els (BT-Allele), th e effect of BT allelic mo dels ( ϕ A and ϕ B ), the Critical effect of BT allelic mo dels ( P si 0 . 05 A and P si 0 . 05 B ), th e p − va lu e of th e CT (pvCT), the o dds-ratio of th is mo d el ( O R a ) and the number of individuals whic h present this alleles ( M A and M B ). lo cated 14 kilobase pairs distal to the APOE epsilon v arian t as the ma jor fin d ing. This obser- v ation was pr eviously rep orted by T GEN r esearchers ( Co on et al. [ 2007, Apr ]). APO E lo cu s is the most imp ortan t genetic risk f actor for Alzheimer’s disease r ep orted to date ( Corder et al. [ 1993, Au g ]). Notably , w e f ound APOE lo cus signifi cance more than eigh t orders of m agnitude smaller u sing BT compared to C T (T able VI I ). The rest of top mark ers also displa y smaller p -v alues usin g BT compared to CT calc u lations. This can b e explained by the fact that the CT is a one-tailed test wher e the n u ll hypothesis of no asso ciation is r ejected if p -v alue turns out to b e less than ǫ , while the BT is a t wo-ta iled test (where the risk or protectiv e role of the SNP is kn o wn by the p -v alue) and the rejection area f or BT is one h alf that for CT ( ǫ/ 2). Notice that the non-av ailable p -v alue for the C T in the Chromosome 2 is due to the lac k of data in a given cell. Anyw a y , this can b e corrected by the Fisher test, whic h is not generally recommended due its computational cost. 5 Discussion An y description of alleli c distrib utions in the genome m u st b egin by constru cting a mo del of allelic probabilities. Ho we ver, this imp ortan t p oint remains un ad d ressed in many scienti fi c literature, at least to the b est of our kno wledge. I ndeed, almost all simulations, made for testing 17 a GW AS metho d , assume that allelic frequencies follo w a un iform distr ibution. Here a mo del for allelic prob ab ility distribution is pr op osed and tested. In add ition, w e also improv ed the commonly u sed uniform distribution mo del. The p rop osed alleles p robabilit y mo d el, L AP t , offers a common scenario for eac h data set, c haracterizing noise. The truncation w hen not kno w n can b e estimated using the emp irical distribution of the allelic probabilities. Regardless of the truncation, the remaining noise (qu alit y con trol, str atification, in sufficien t p opulation, etc...) is gathered with the v ariable D t . The mo del d ep ends only on the p opu lation of cases, control s , and the num b er of o ccur rences of the feature in the s amp le. A lth ou gh th e study w as fo cused in a univ ariate analysis and s can b e take n as the genot y p e in a s in gle SNP , note that s is, in general, a vec tor an d can represent any d esired condition. F or instance, s can include, along the genot yp e, the sex, age or other information. F urther m ore, this ve ctor can also include more th an one genotype whether considering their interacti on s (epistasis) or not. Although the examples used in this work describ ed the allelic mo del, any other mo dels could also b e also analyzed without f u rther mo dification of the metho d. The n ew genome-wide asso ciation m etho d (BT) has some commonalities w ith th e conv en- tional one. Ho wev er, BT offers a r emark able ranking v ariabilit y that migh t represen t genuine signals. No vel candidate must b e corrob orated by intensiv e replication, m ultiple testing control, and meta-analysis us ing other datasets. W e are a ware that if BT can isolate nov el lo ci, whic h generally missed while using traditional approac hes, its application m a y help to u nco ve r a frac- tion of th e missing piece of heritabilit y still p ending for multiple complex traits. Consequently , next step of our researc h would b e the generatio n of we ll p ow ered meta-analysis of BT rankings. The isolation of genome-wide significant signals, and ultimately , th e replication in indep enden t series m ay h elp to measure the u tility of this no ve l GW AS app r oac h. A Allelic probabilities v ariations The d ifference b etw een truncated u niv ersal allelic probabilit y , AP t , and a priori trun cated lo- cal allelic probability , LAP t , can b e d escrib ed in a single expression, D t = AP t − LA P t the div ergence of lo cal MAF fr om commercial c hip s trun cation for small MAF. Since the exp ected v alues of A P t and L A P t should b e equal, we assumed th at the exp ected v alue of D t as zero, and its seemed a plausible assumption th at D t follo ws a normal distribution. Ho wev er, this w ould give rise to lo cal allelic pr obabilities out of the interv al [0 , 1]. T o a vo id this, we assu med that the v alues of AP t in the SNPs p r esen t in the chip b elong to the inte rv al [ t, 1 − t ], and the observ ed allelic pr obabilit y take s v alues in [0 , 1]. T herefore, the obser ved v alues of D t b elong to the inte r v al [0 , 1]. Hence, we mo deled D t as a truncated n ormal d istribution N T (0 , δ , − t, t ). Its probabilit y density fu nction is giv en by h ( x ) = 1 √ 2 π e x 2 − 2 δ 2 R t − t 1 √ 2 π e x 2 − 2 δ 2 , if − t < x < t ; 0 , otherwise , (17) 18 The mean of D t is 0 an d its v ariance is giv en b y σ 2 ( D t ) = σ 2 D = δ 2 1 − 2 t δ ( t δ ) 2Φ t δ − 1 ! where φ and Φ are the PDF and CDF of the standard normal d istribution N (0 , 1), resp ectiv ely . If we tak e x = t δ then σ 2 D = t 2 1 − 2 xφ ( x ) 2Φ( x ) − 1 x 2 = t 2 1 x 2 − 2 φ ( x ) x (2Φ( x ) − 1) . As A P t and D t w ere assu med to b e ind ep endent the densit y function of LAP t = AP t + D t is th e con vo lu tion of the probab ility dens ity fu nctions of AP t and D t : ( g ∗ h )( z ) = Z + ∞ −∞ g ( z − x ) h ( x ) dx (18) B Prop erties of trunc ated allelic distribution As AP t is distributed as Beta( α, α, t, 1 − t ), the mean of AP t should b e µ α,t = 0 . 5. T h is can b e easily d educed from its PDF g ( a ) (see ( 3 )). In order to calculat e the v ariance of AP t , it is conv enien t to use the incomplete b eta function, whic h is defin ed as B( t ; α, β ) = Z t 0 a α − 1 (1 − a ) β − 1 da. This fu nction is r elated w ith the b eta fu nction Beta( α, β ) using the regularized incomplete b eta function: I t ( α, β ) = B( t ; α, β ) B( α, β ) They satisfy th e follo wing prop erties ( Paris [ 2010 ]) B( α + 1 , β ) = α α + β B( α, β ) I t ( α, β ) = 1 − I 1 − t ( β , α ) (19) I t ( α + 1 , β ) = I t ( α, β ) − t α (1 − t ) β α B( α, β ) By ( 1 ), the v ariance σ 2 α of Beta( α, α ) is 1 4(2 α +1) . Using ( 19 ) we calculated the v ariance of the tru ncated b eta distribution: σ 2 α,t = Z 1 − t t a α +1 (1 − a ) α − 1 R 1 − t t r α − 1 (1 − r ) α − 1 dr − µ 2 α,t = B( α + 2 , α )( I 1 − t ( α + 2 , α ) − I t ( α + 2 , α )) B( α, α )( I 1 − t ( α, α ) − I t ( α, α )) − 1 4 = α + 1 4 α + 2 t α (1 − t ) α (4 t − 2) ( α +1)B( α,α ) + 1 − 2 I t ( α, α ) 1 − 2 I t ( α, α ) − 1 4 = 1 (4 α + 2)B( α, α ) t α (1 − t ) α (4 t − 2) 1 − 2 I t ( α, α ) + α + 1 4 α + 2 − 1 4 19 Therefore, the v ariance of AP t is σ 2 u = σ 2 α,t = 1 (4 α + 2)B( α, α ) t α (1 − t ) α (4 t − 2) 1 − 2 I t ( α, α ) + α + 1 4 α + 2 − 1 4 . (20) Next, we n eeded the follo w ing tec h n ical lemma. Lemma B.1. L et f ( x ) = 1 x 2 − 2 φ ( x ) x (2Φ( x ) − 1) . Then f ( x ) is de cr e asing for x > 0 , f ( x ) < 1 3 for every x > 0 and lim x → 0 f ( x ) = 1 3 . Pr o of. First, w e n eed to prov e that f ( x ) < 0, if x > 0. F or that, we consider the fun ction g ( x ) = 2Φ( x ) − 1 + 6 xφ ( x ) x 2 − 3 . Ha ving in mind th at φ ′ ( x ) = − xφ ( x ) and Φ ′ ( x ) = φ ( x ), we hav e g ′ ( x ) = 2 φ ( x ) 1 + 3 (1 − x 2 )( x 2 − 3) − 2 x 2 ( x 2 − 3) 2 = − 4 x 4 φ ( x ) ( x 2 − 3) 2 ≤ 0 . Th us, g is strictly decreasing f unction in eac h r egion where it is conti nuous, for example, the in terv al (0 , √ 3). Let 0 < x < √ 3. As g (0) = 0, w e dedu ce that g ( x ) < 0. As x 2 − 3 < 0, we ha ve 0 < ( x 2 − 3) g ( x ) = (2Φ( x ) − 1)( x 2 − 3) + 6 xφ ( x ). P leanly (2Φ( x ) − 1)( x 2 − 3) + 6 xφ ( x ) is also p ositive if x ≥ √ 3. This pr ov es that (2Φ( x ) − 1)( x 2 − 3) + 6 xφ ( x ) > 0 for every x > 0. Using th at 2Φ( x ) − 1 , x 2 > 0, w e d educe th at 3 − x 2 3 x 2 − 2 φ ( x ) x (2Φ( x ) − 1) < 0 and h ence f ( x ) = 1 x 2 − 2 φ ( x ) x (2Φ( x ) − 1) = 1 3 + 3 − x 2 3 x 2 − 2 φ ( x ) x (2Φ( x ) − 1) < 1 3 , as d esired. Using L’Hˆ opital rule, w e ha ve lim x → 0 2Φ( x ) − 1 xφ ( x ) = lim x → 0 2 1 − x 2 = 2. App lying L’Hˆ opital again, w e ha ve lim x → 0 1 x 2 − 2 φ ( x ) x (2Φ( x ) − 1) = lim x → 0 2Φ( x ) − 1 − 2 xφ ( x ) x 2 (2Φ( x ) − 1) = lim x → 0 xφ ( x ) 2Φ( x ) − 1 + xφ ( x ) = lim x → 0 1 2Φ( x ) − 1 xφ ( x ) + 1 = 1 3 T o pro ve that f ( x ) is decreasing for x > 0, we consider the follo win g functions ψ ( x ) = 2Φ( x ) − 1 α ( x ) = ( x 4 − 2 x 2 + 3) p x 4 + 2 x 2 + 9 + x 6 − x 4 + 5 x 2 − 9 . h ( x ) = 2 ψ ( x ) − xφ ( x )( x 2 + 1 + p x 4 + 2 x 2 + 9) . W e claim that α ( x ) > 0 for ev ery x > 0. F or th at w e us e the f ollo wing equality ( x 4 − 2 x 2 + 3) 2 ( x 4 + 2 x 2 + 9) − ( x 6 − x 4 + 5 x 2 − 9) 2 = 32 x 4 . (21) Therefore ( x 4 − 2 x 2 + 3) 2 ( x 4 + 2 x 2 + 9) > ( x 6 − x 4 + 5 x 2 − 9) 2 . Moreo v er, x 4 − 2 x 2 + 3 = ( x 2 − 1) 2 + 2 > 0 and, if 0 < x < 1 then x 6 − x 4 + 5 x 2 − 9 < 0. Thus, if 0 < x < 1 then ( x 4 − 2 x 2 + 3) √ x 4 + 2 x 2 + 9 > − x 6 + x 4 − 5 x 2 + 9, or equ iv alen tly α ( x ) > 0. This equalit y also holds for x > 1 b ecause b oth x 4 − 2 x 2 + 3, x 4 + 2 x 2 + 9 and x 6 − x 4 + 5 x 2 − 9 20 are increasing for x > 1. Th erefore if x > 1 th en α ( x ) ≥ α (1) = 2 √ 12 − 4 > 0. This prov es the claim. Let x > 0. As h ′ ( x ) = φ ( x ) 4 + x 2 ( x 2 + 1 + p x 4 + 2 x 2 + 9) − 3 x 2 + 1 + p x 4 + 2 x 2 + 9 + x (4 x 3 + 4 x ) 2 √ x 4 + 2 x 2 + 9 = φ ( x ) √ x 4 + 2 x 2 + 9 ( x 4 − 2 x 2 + 3) p x 4 + 2 x 2 + 9 + ( x 2 − 1)( x 4 + 2 x 2 + 9) − 2 x 2 ( x 2 + 1) = φ ( x ) √ x 4 + 2 x 2 + 9 ( x 4 − 2 x 2 + 3) p x 4 + 2 x 2 + 9 + x 6 − x 4 + 5 x 2 − 9 = φ ( x ) α ( x ) √ x 4 + 2 x 2 + 9 w e conclude that h is an increasing fun ction, therefore, h ( x ) > h (0) = 0. Eq u iv alen tly ψ ( x ) > xφ ( x )( x 2 + 1 + √ x 4 + 2 x 2 + 9 2 . (22) As th e greatest ro ot of the quad r atic p olynomial q ( T ) = T 2 − ( x 3 + x ) φ ( x ) T − 2 x 2 φ ( x ) 2 is xφ ( x )( x 2 +1+ √ x 4 +2 x 2 +9) 2 , in equ alit y ( 22 ) implies that q ( ψ ( x )) > 0. Hence f ′ ( x ) = − 2 x 3 − 2 − x 2 φ ( x ) ψ ( x ) − φ ( x ) ψ ( x ) − 2 xφ ( x ) 2 x 2 ψ ( x ) 2 = − 2 q ( ψ ( x )) x 3 ψ ( x ) 2 < 0 . Th us f is decreasing for x > 0, as desired . By Lemma B.1 we h av e 0 ≤ σ 2 D ≤ t 2 3 . As AP t and D t are ind ep endent, the v ariance of LAP t = AP t + D t is σ 2 l = σ 2 u + σ 2 D , h ence, σ 2 u ≤ σ 2 l ≤ σ 2 u + t 2 3 . Notice that th e case σ 2 l = σ 2 u + t 2 3 o ccurs for the highest degree of noise, i.e., when D t has maxim um v ariance σ 2 D = t 2 3 . C The effects of a genot yp e s: ϕ s , Ψ ǫ s W e defined the discrete r andom v ariable F , wh ic h take s only tw o v alues 0 and 1 dep end in g on whether the ind ividual is a con trol or a case, r esp ectiv ely . Let M 0 s and M 1 s b e the n u m b er of con trols and cases with the given genot yp e s , resp ectiv ely , and let M s = M 0 s + M 1 s . Let b s denote the theoretical p robabilit y of b eing a case for an in dividual w ith genot yp e s in a GW AS with N 0 con trols and N 1 cases. W e assu med that the pr esence of the genotype multiply b y a factor ϕ s as the pr ob ab ility of present in g a phenotype. W e denoted the probabilit y of ha ving the phenotype for the individuals with genot yp e s in the general p opulation as c s . Let p b e the exp ected v alue of c s , which is usually called th e prev alence of the p henot yp e in the general p opulatio n . T herefore, pϕ s = c s = P ( F = 1 | s ) = P ( F = 1 , s ) P ( s ) = P ( F = 1) P ( s |F = 1) P ( s ) = pP ( s |F = 1) P ( s ) 21 Since con tr ols are a repr esen tation of the p opulation and cases are a samp le of in d ividuals with the p henot yp e, then we can compute the follo wing estimations: b s ≈ M 1 s M s , P ( s ) ≈ M 0 s N 0 and P ( s |F = 1) ≈ M 1 s N 1 Therefore ϕ s ≈ N 0 N 1 M 1 ,s M 0 ,s = N 0 N 1 M 1 ,s / M s 1 − M 1 ,s / M s = N 0 N 1 b b s 1 − b b s and so b b s = c s N 1 pN 0 + c s N 1 = 1 pN 0 c s N 1 + 1 = ϕ s N 1 N 0 + ϕ s N 1 . Next, we pro ceeded as in the tests statistics defined in ( 10 ) f or th e n ew b s that tak es into accoun t the effect of the genot yp e s . Therefore, we may construct similar statistics in th e same w ay as ab o v e, where the decision r u le at a 100(1 − ǫ/ 2)% are Accept H ′ 0 if ω ′ ǫ/ 2 ,ϕ ≤ b b s ≤ ω ′ 1 − ǫ/ 2 ,ϕ Reject H ′ 0 otherwise (23) where P r (Beta( α ′ M s , β ′ M s ) < ω ′ ǫ/ 2 ,ϕ ) = P r (Beta( α ′ M s , β ′ M s ) > ω ′ 1 − ǫ/ 2 ,ϕ ) = ǫ/ 2, and α ′ M s = ϕN 1 N 0 + ϕN 1 M s ( N 0 + ϕN 1 − 1) N 0 + ϕN 1 − M s − 1 and β ′ M s = N 0 N 0 + ϕN 1 M s ( N 0 + ϕN 1 − 1) N 0 + ϕN 1 − M s − 1 . Here, w e defined a new parameter, called the c ritic al effe ct of the genotype s , with a certain confidence lev el ǫ as the effect v alue, ϕ s , of the exp ected distribution under the decision r ule ( 13 ) w h ere b s = q ′ 1 − ǫ/ 2 if b s > ˆ b = N 1 N or b s = q ′ ǫ/ 2 if b s ≤ ˆ b = N 1 N . That is, the critical effect size Ψ ǫ s of genotype s at a ǫ confidence lev el is the greatest real n u m b er ϕ s (resp ectiv ely lo w est), su c h that the test give n b y ( 10 ) for b s = ϕ s N 1 N 0 + ϕN 1 rejects the n u ll hyp othesis. D Relationships among the mo d els Figure 7 sho w s how the mod els of CT an d BT could b e connected. Each considered v ariable ( AA , B B or AB ) was treated as a d ifferen t m o del. Th is imp lies that there is no one-to-o n e corresp ondence b et ween CT and BT mo d els. F or instance, the allelic CT m o del is not equal to the probabilit y of b eing case with the allele A or B , as analyzed in BT mo del. O n the con trary , b oth cases ( A and B ) must b e tak en in to accoun t when compared to the allelic CT mo d el. Th us, there are eigh t mo dels in th e BT whic h seems to b e of interest: allele A ( A ), allele B ( B ), dominan t of A ( AA ∪ AB ), recessiv e of A ( AA ), dominant of B ( AB ∪ B B ), recessiv e of B ( B B ), homozygous ( AA ∪ B B ) and heterozygous ( AB ). Thus, summarizing th at there are five in teresting mo d els f or CT against eigh t meaningful m o dels for the new BT. 22 Figure 7: Paired mo dels, i.e. relationships b et w een the mo dels of Conv en tional T est (CT), comp osed by allelic, heterozygous, r ecessiv e, and dominant ; the new test prop osed, called th e Beta T est (BT), comp osed b y allele A (BT a = A ), allele B (BT a = B ), s = AA (BT s = 0), s = AB (BT s = 1), s = B B (BT s = 2), domin an t of A (BT s =DomA), dominant of B (BT s =DomB), and homozygous (BT s =Hom). References DM Altshuler, RA Gibbs, L Pe ltonen, and et al. Integrating common and rare genetic v ariation in diverse h u man p opulations. Natur e , 467(73 11):52–8, 2010. C An t ´ un ez, M Boada, A Gonz´ alez-P ´ er ez, and et al. Th e mem br ane-spanning 4-domains, sub - family a (ms4a) gene cluster con tains a common v ariant asso ciated w ith alzheimer’s disease. Genome Me dicine. , (3(5)), 2011, Ma y 31. J Cohen. A co efficien t of agreement for nominal scales. Educ ational and Psycholo gic al M e asur e- ment , 20 (1):37–4 6, 1960. KD Co on, AJ My ers, D W Craig, and et al. A high-densit y wh ole-genome asso ciation stud y rev eals that ap o e is the ma jor su sceptibilit y gene for sp oradic late-onset alzheimer’s disease. J Clin Psychiatry , 68(4): 613–8, 2007, Apr. EH Corder, AM Saunders, WJ Strittmatter, and et al. Gene dose of ap olipopr otein e t yp e 4 allele and the risk of alzheimer’s disease in late onset families. Sci enc e , 13(26 1(5123)):92 1 –3, 1993, Aug. PI de Bakk er, MA F erreira, X Jia, an d et al. Practical asp ects of impu tation-driven meta-anal y s is of genome-wide asso ciation stud ies. Hu m Mol Genet , 17(R2):R122– 8, 2008. KA F razer, DG Ballinger, DR Cox, and et al. A s econd generation human haplot yp e m ap of o v er 3.1 million sn ps. N atur e , 449(7164 ):851–61, 2007. 23 LA Hind orff, P Sethupath y , HA Junkins, and et al. Pot ential etiolog ic and functional implica- tions of genome-wide asso ciation lo ci for human diseases and traits. P r o c Natl A c ad Sci U S A , 106(23): 9362–7, 2009. L Isserlis. On the v alue of a mean as calculated from a sample. Journal of the R oyal Statistic al So ciety , 81 (1):75 –81, 1918. ES Lander , LM Linton, B Birr en , and et al. Initial sequencing and analysis of th e h u man genome. Natur e , 409(68 22):860–921, 2001. D MacKa y . I n formation th eory , inference and learning algorithms. Cambridge U niversity Pr ess; First Edition. , (ISBN 978-0521 642989), 2003. T A Manolio, FS Collins, NJ Co x, and et al. Finding the missing heritabilit y of complex diseases. Natur e , 461(726 5):747–53, 2009. C Meesters, M Leb er, C Herold, and et al. Quic k, ”imp u tation-free” meta-analysis with p r o xy- snps. BMC bioinformatics , 13:231, 2012. R. B. P aris. NIST Handb o ok of Mathematic al F unctions, Cambridge University Pr ess. Inc omplete b eta functions . Cam b ridge Un iv ersity P ress, 2010 . K Pe arson . On lines and p lanes of closest fit to systems of p oints in sp ace. Philosophic al Magazine , (2 (11)):5 59–572, 1901. EM Reiman, JA W ebster, AJ My ers, and et al. Gab2 alleles mo d ify alzheimer’s risk in ap o e epsilon4 carriers. Neur on , (54):71 3–720, 2007. M Ruiz-Mar ´ ın, M Matilla-Garc ´ ıa, J A Garc ´ ıa-C´ ordoba, and et al. An en tropy test for single-locu s genetic asso ciation analysis. BM C Genetics , (11-19), 2010. R S ac hidanand am, D W eissman, SC Sc h midt, and et al. A map of human genome sequence v ariatio n contai n ing 1.42 m illion single nucleo tide p olymorph ism s. Natur e , 409(682 2):928–33, 2001. R Shelton and JA Cliffe. Spherical co ws. 2007. URL http://i magine.g sfc.nasa. gov/docs/features/topics/snr_group/spherical_cow.html . 24
Original Paper
Loading high-quality paper...
Comments & Academic Discussion
Loading comments...
Leave a Comment