Two General Methods for Population Pharmacokinetic Modeling: Non-Parametric Adaptive Grid and Non-Parametric Bayesian
Population pharmacokinetic (PK) modeling methods can be statistically classified as either parametric or nonparametric (NP). Each classification can be divided into maximum likelihood (ML) or Bayesian (B) approaches. In this paper we discuss the nonp…
Authors: ** 정보 제공되지 않음 (논문에 명시된 저자 정보가 없으므로 “미상”으로 표기) **
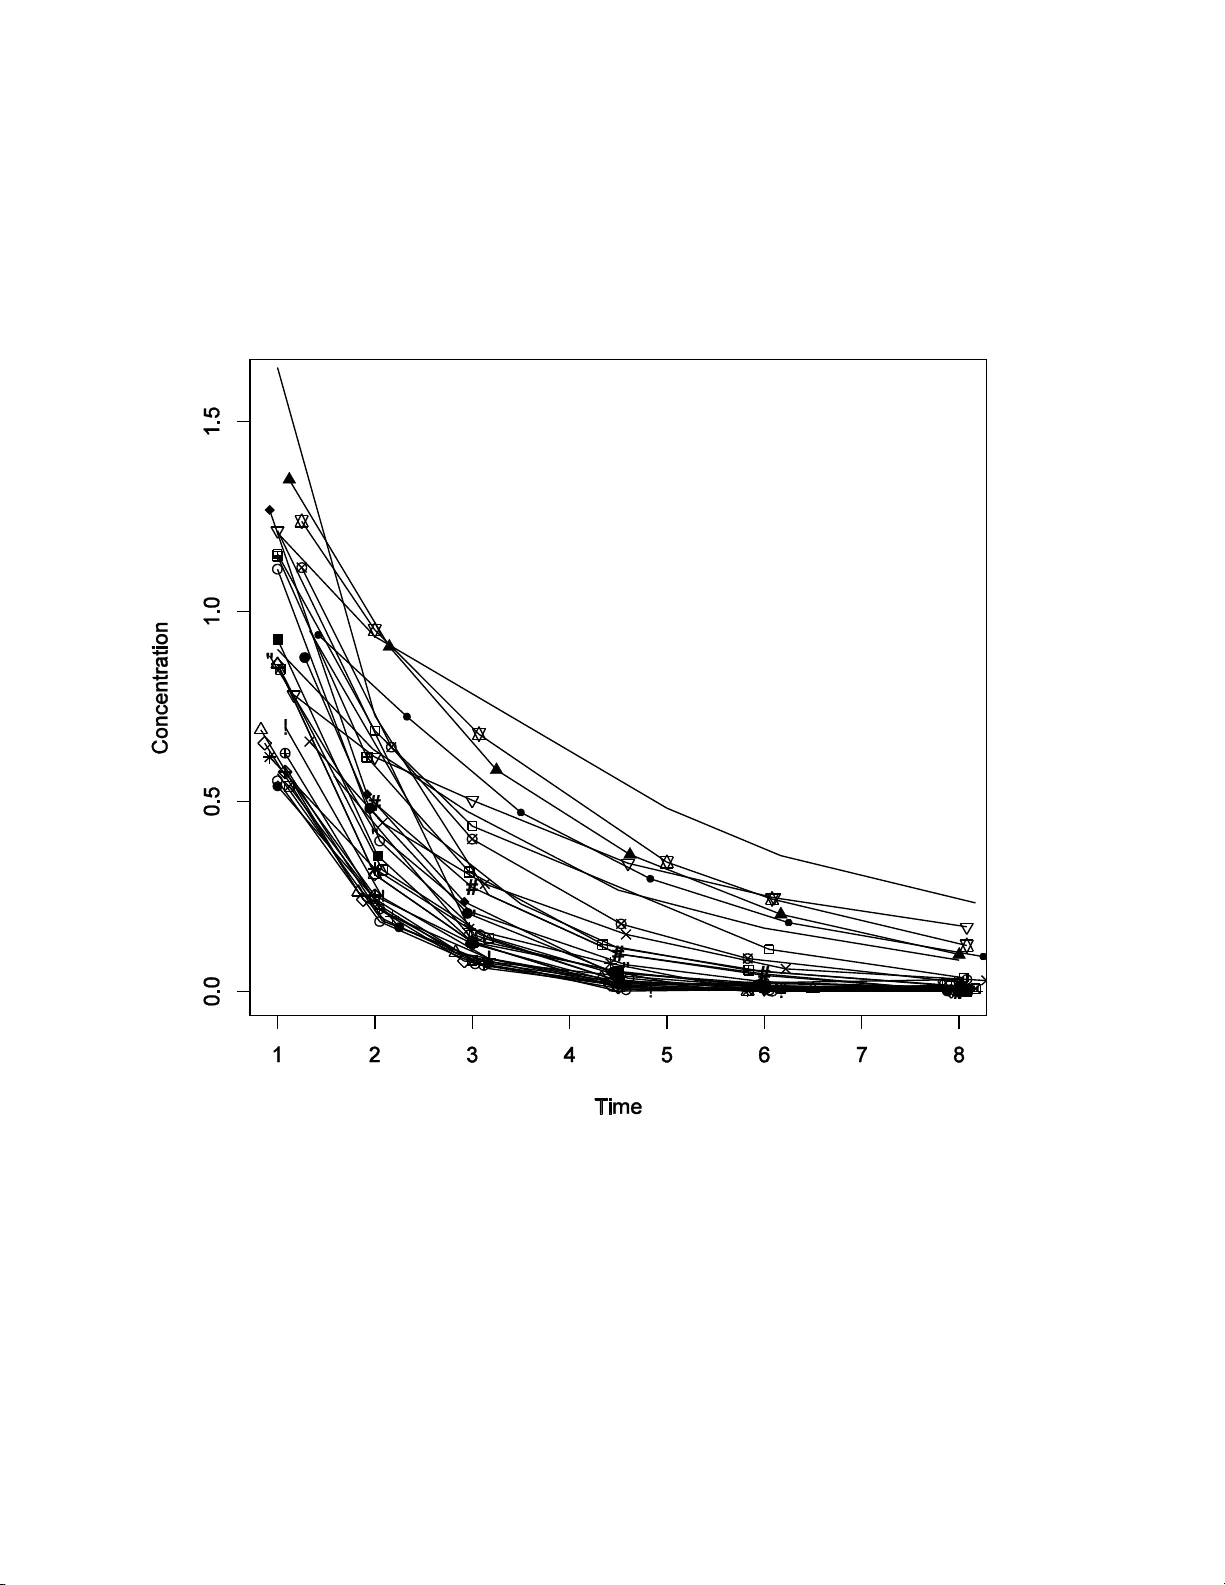
Tatarinova et al, Journal of Pharmacokinetics and Pharmacodynamics, 2013, vol. 40 no 1 DOI 10.1007/s10928-013-9302-8 1 Two General Met hods for Population Pharmaco kinetic Modeling: Non-Parametric A daptive Grid and No n-Parametric B ayesian Tatiana Tatarinova* 1 , Michael Neely* 1 , Jay Bartroff 1,2 , Michael van Guilder 1 , Walter Yamada 1,4 , David Bayard 1,3 , Roger Jelliffe 1 , Robert Leary 1,5 , Alyona Chubatiuk 2 and Alan Schumitzky 1,2 1 Laboratory of Applied Ph armacokinetics, Keck School of Medicine, Unive rsity of Southern Califo rnia, Los Angeles, CA, USA 2 Department of Mathematics, Dornsife College of Letters and S cience Universi ty of Southern California, Los Angeles, CA, U SA 3 Jet Pr opulsion Laboratory, California Institute of Technology, Mail Stop 198326 , 4800 Oak Grove Drive, Pasadena, CA, USA 4 Department of P sychology, Azu sa Pacific University , Azusa, CA, USA 5 Pharsight Corpo ration, Cary, NC, U SA * Joint first autho rs Corresponding author email: tatiana.tatarinova@lapk.org ABSTRACT : Population pharmacokinetic (PK) modeling methods can be statistically classified as either parametric or no nparametric (NP). Each classification can be divided into maximum likelihood (ML) or Bayesian (B) approaches. In this paper we discuss the nonparametric case using both maximum likelihood and Bayesian ap proaches. We present t wo nonparametric methods for estimating th e unknown joint population d istribution o f model p arameter values in a pharmacokinetic/pharmacodynamic (PK/PD) dataset. The f irst method is the NP Adaptive Grid (NPAG). The seco nd is the NP Bayesian (NPB) algorithm with a stick -breaking process to construct a Dirichlet prior. Our obj ective is t o compare the performance of the se two methods using a simulated PK/PD dataset. Our results showed excellent p erformance of N PAG and NPB in a realistically simulated PK study. This simulation allowed us to h ave benchmarks in the form of the true population parameters to compare with the estimates produced b y the t wo methods, whil e incorporating challeng es like unbalanced sample times and sample numbers a s well as the ab ility to include the covariate of patient weight. We conclude t hat both NPML and NPB can be used in realistic PK/ PD population analysis prob lems. The advantages o f one versus the other a re discussed i n the pap er. NPAG a nd NPB ar e implemented in R and freely availabl e for download within the Pmetrics package from www.lapk.org. KEYWORDS: Population pharmacokine tic mod eling, non-parametric, maximum likelihood, Bayesian, Stick-breaking, Pmetrics, RJags Tatarinova et al, Journal of Pharmacokinetics and Pharmacodynamics, 2013, vol. 40 no 1 DOI 10.1007/s10928-013-9302-8 2 INTRODUCTION Population pharmacokinetic (PK) modeling involves estimating an unknown population distribution based on data from a collect ion of nonlinear models. One important application of this method is the analysis of clinical PK dat a. A drug is given to a population of subjects. In each subject, the d rug’s behavior is stochastically described by an unknown su bject-specific parameter vector . This vector varies significantly ( often genetically) between subjects, which accounts for the variability of the d rug response in the population. The mathem atical problem is to determine the population parameter distribution F ( ) based on the clinical data. The distribution F determines the variability of the PK model over the population. From an estimate of this distribution, means and cred ibility intervals can be obtained for all moments of F an d, more generally, for an y functional of F , such as a t arget serum concentration after a given dosage regimen. The importance of this problem is u nderscored by the FDA: “Kn o wledge o f the relationship among concentration, response, and physiology is essential to the design of dosing strategies for rational therapeutics. Defining the opt imum dosing strategy f or a population, subgroup, or individual patient requires resolution o f the variability issues.” [1] Population PK modeling approaches can be classified statistically as either parametric or nonparametric. Each can be divided into maximum likelihood or Bayesian methods. While we focus on the nonparametric approaches in this paper, for completeness we d iscuss all four approaches very briefly below. The parametric maximu m likel ihood approach is the o ldest and most traditional. One assumes that th e parameters come f rom a known, specified pro bability distribution (the population distribution) with certain unknown population parameters (e.g. normal distributio n with unknown mean vector and unknown cova riance matrix ). The problem th en is to estimate these unknown population parameters from a collection of individual subject d ata (the population data). The first and most wid ely use d software for this approach has been the NONMEM program developed by Sheiner and Beal [2] , [3]. There are other parametric maximum likelihood programs currently availabl e, such as Monolix [4] and AD APT [5]. T he ADAPT software also allows for parametric mixtures of n ormal distributions, see [6] and [7] . Asymptotic confidence intervals can be obtained about t hese population parameters . Her e “asymptotic” means as the number of subjects in the population becom es large. The nonparametric maximum likelihood (NPML) approach was initially developed by Lindsay [8] and Mallet [9]. In contrast t o parametric approaches, NPML makes no assumptions Tatarinova et al, Journal of Pharmacokinetics and Pharmacodynamics, 2013, vol. 40 no 1 DOI 10.1007/s10928-013-9302-8 3 about t he shapes of the underlying parameter d istributions. It directly estimates the entire joint distribution. This permits discovery o f una nticipated, o ften ge netically determined , non - normal and multimodal su bpopulations, such as f ast and slow metabolizers. The NPML approach is statistically consistent [10]. This means th at as the number of subjects gets large , the estimate o f F given the data co nverges to the t rue F . Consequently so are it s continuous functionals such as means and covariances. Th e main drawback of the NPML approach is that it is not easy to d etermine even asymptotic confidence intervals about parameter estimates. For example, bootstrap methods have been used [11], but are extremely computationally intensive. The Bayesian approaches are much newer. In the parametric Ba yesian ap proach, one assumes that the population parameters (e.g. ( , ) in the normal case)) are themselves random variables with kno wn prior di stributions. The problem then is to estimate the conditional dist ribution of the population parameters given the population d ata and the p rior distributions. The mo st widely used approach is based on Monte Carlo Markov Chain (MCMC) methods. Population PK analysis can be performed using the software packages WINBUGS [12] , and JAGS [13]. Because this method is Bayesian, rigorous cre dibility i ntervals can be obtained for population parameters in dependent of the sample size. Of course, question s remain about convergence of the MCMC sampler and sensitivity to the prior assumptions. The nonparame tric Bayesian approach is much more flexi ble. One can assume that the population distribution F is totally unknown and random w ith a Dirichlet process prior. This approach has o nly been applied to a f ew PK problems [14] [15], [16], [17]. A general purpo se software package for population PK modeling has not been developed. This is one of the goals of the present paper. THE NONPARAMETRIC APPROACHES We have developed two general nonparametric (NP) algorithms for estimating t he u nknown population distribution of model parameter values in a p harmacokinetic/pharmacodynamic (PK/PD) dataset [1 8] , [19], [20]. The f irst method is t he NP Adaptive Grid (NPAG) algorithm, which we have used in our USC Laboratory of Applied Pharmacokinetics for many ye ars [19] . This method calculates the maximum likelihood est imate of the population distribution with respect to all distributions. Compared with most parametric population modeling methods, NPAG calculates exact, rather than approximate likelihoods, and it easily discovers unexpected sub-groups and outliers [21] , [22]. Tatarinova et al, Journal of Pharmacokinetics and Pharmacodynamics, 2013, vol. 40 no 1 DOI 10.1007/s10928-013-9302-8 4 Since NPAG is an NPML met hod, it cannot easily calculate confidence intervals around parameter esti mates. This motivated u s to develop the second N P method described here. We used an NP Bayesian (NPB) algorithm with a stick-breaking process [23], to construct a Dirichlet process p rior. More details are given b elow. The NPB algo rithm provides a Bayesian estimate of this totally unknown population distribution, including rigorous (not asymptotic) credibility intervals around all parameter estimates for any sample size . Both NPAG and NPB estimate the unknown population d istribution as a discrete distribution. These discrete representations a re perfectly s uited for multiple- model adaptive control in which required i ntegrals over the population distribution b ecome fin ite su ms [24]. By comb ining discrete d istributions that are free of a priori assump tions on shape with credibility intervals, NPB combines the best of parametric and nonparametric metho ds. The outline of the paper is as follows. First, we describe the mathematical and statistical details of the population PK /PD modeling problem. Then we describe the mathematical and statistical d etails of the NPAG and NPB algorithms. Next we give the resu lts for our simulated PK/PD study data. The paper closes with conclusions and work for the fut ure. THE POPULATION PK/PD MODEL Consider a sequence of experiments where each one consists of a dosag e regimen and a set of measurements at s everal time points o n one of N individual subjects. T he measurement model for the i th subject is: (1) where the vectors are the observed measurements, e.g. serum concentrations, PD effects, etc. The components of the vector represent the u nknown model a nd noise parameters defined on a space ; represents t he no ise-free output depending on the dosage regimen and t he measurement schedule. The n oise vectors are assumed t o be i ndependent, normal random variables with zero mean and covariance i i ( i ) which may depend on . The { } are independent and identically distributed with common (but unknown) probability distribution . The populat ion analysis problem is to estimate based on the d ata Algorithms N i e h Y i i i i ,. .. , 1 , ) ( i Y i () ii h i e i i F F ). ,..., ( 1 N N Y Y Y Tatarinova et al, Journal of Pharmacokinetics and Pharmacodynamics, 2013, vol. 40 no 1 DOI 10.1007/s10928-013-9302-8 5 The next two s ections describe the mathematical and statistical details of the NPAG a nd NPB algorithms. NPAG ALGORITHM (NONPARAMETRIC ADAPTIVE GRID) NPAG is an adaptive grid algorithm for finding the nonparametric maxim um likelihood estimate of t he population dis tribution. It was developed over a number of yea rs at the Laboratory o f Applied Pharmacokinetics, USC, by Alan Schumitzky [2 5], Robert Leary [26] , and James Burke from the University of Washington, see also [27]. NPAG is based on a primal-dual interior point met hod. In this paper we present a brief outline of this approach. Consider Eq. (1). The log likelihood is given by . The Maximum Likelihood distribution ML F maximizes over the space of all distributions d efined on . Using Caratheodory’s theorem and the results of Lindsay [8] and Mallet [9], it f ollows that ML F can be found in th e class of d iscrete distributio ns with at mo st N support points. In this case we write (2) , where are the support points of ; are the correspondi ng weights (probabilities) which sum to unity; and is the Dirac measure with mass 1. Consequently, to maximize , it is sufficient to maximize with respect to the vectors and . If the support points are known, then maximization of with respect to the weights in Eq. (3) is a convex optimization problem and can be solved very efficiently. The ap proach used in NPAG can be briefly described as follows: First solve the optimization problem f or the weight s related to Eq. (3) ove r a la rge b ut fixed grid of support poin ts. Usually is taken t o be a large n umber of so -called Faure points which opt imally cover [28] . Then reduce the grid by deleting points with very low probabili ty to get a new grid . lo g p ( Y N | F ) l og i 1 N p ( Y i | i ) dF ( i ) ( | ) N p Y F F F M L ( ) k 1 K w k k ( ) ( 1 ,..., K ) ML F lo g p ( Y N | F ) (3) log p ( Y N | w , ) j 1 N log k 1 K w k p ( Y i | k ), K N } { k w } { k { k } l o g p ( Y N | w ) { w k } G 0 G 0 G 0 G 1 Tatarinova et al, Journal of Pharmacokinetics and Pharmacodynamics, 2013, vol. 40 no 1 DOI 10.1007/s10928-013-9302-8 6 Then expand the gri d by adjoining to each point in the vertices of a hypercube with as its center. This adds points to resulting in an expanded gr id . This cyc le is repeated with replacing . The process is continued until convergence is achieved. Optimization over fixed support poin ts. The mai n part of the calculation c omes in the optimization of the weig hts over a fixed grid of support points. Start with a set of support points . Let . Assume that the row sums of the matrix are strictly positive (note that ). For any -dimensional vector we can define the function: Maximizing Eq. (3) with respect to the w eights is equivalent to t he solving the f ollowing two problems: (P) Primal Problem: Minimize subject to where is the - dimension column vector of with components all equal to one, Now , where and . The Fen chel convex dual is then given by the Dual problem: (D) Dual Problem: Minimize subject to Duality Theorem and Karush-Kuhn-Tucker Conditions Solutions to (P) an d (D) always exist, with the solut ion to (D) unique. Also solves (P) and solves (D) if and only if the Karush-Kuhn-Tucker [29] [30] conditions are satisfie d: , G 1 0 G 1 0 2 di m G 1 G 2 G 2 G 0 i , k p ( Y i | k ) N K [ i , k ] k 1 K w k p ( Y i | k ) ( w ) i K z ( z 1 , ..., z K ) T ( z ) k 1 K log z k , if z 0 , oth er w is e { w k } ) ( w e T w 1 a nd w 0 e K ] [ )] ( [ q gr ad w gr ad T T n q q q ) , . . . , ( 1 i i w q ) ( 1 ( q ) T q Ke and q 0 w q ( KK T) T q s Ke 0 z w 0 QZ e e 0 W Se 0 Tatarinova et al, Journal of Pharmacokinetics and Pharmacodynamics, 2013, vol. 40 no 1 DOI 10.1007/s10928-013-9302-8 7 where s is a non-negati ve N -dimensional vector (slack variables) a nd Q =diag(q), W=d iag(w), Z=diag(z), S=d iag(s) . The primal-dual i nterior point method finds a so lution to the above non - linear system of equations [27]. The Jacobian of the system is singu lar at the solution, so the strategy is to approach t he solu tion along the central p ath In this case, the equation is replaced by and the (KKT) conditions become: The equations are solved by Newton’s method for a sequence of values t ending to zero. Th e limit solution then solves both the primal and dual problems. The whole process converges quadratically and is very fast. Grid Adaptation: Reduction and Expansion As described earlier, the reduction of a current grid is accom plished b y deleting s upport p oints with very low probability. T he value of the likelihood function before and aft er grid reduction is essentially th e same. The expansion of a current grid adds points to the grid. The optimization process over this new expanded gri d can only increase the value of the likelih ood function. When this incr ease is essentially zero , the whole process has converged. Exact details of solving the equations and of grid adaptation will be published separately. NPB (NONPARAMETRIC BAYESIAN) There are two common ways to construct a Baye sian prior u sing a Dirichl et process: “marginal” and “f ull con ditional” methods. In the fr amework of our Nonparametric Bayesian algorithms we implemented both approaches as described b elo w. We now consider Eq. (1) f rom a Bayesian point of view. In this c ase the distribution is con sidered to be a random variab le. The simplest prior distribution f or is the so-called Dirichlet process, see [14] [17] for details. In this case we write where the dist ribution will be our p rior estimate of , and where the n umber will be the strength of that guess. As before, we assume . Now the population analysis problem is to estimate the full conditional distribution of F given the data . Most methods to solve this problem employ a marginal approach. How ever, can be “integrated out” leaving a much simpler p roblem for the . Th e result ing model for the is given by the Poly a Urn representat ion: ( w ( ) , q ( ) ) as 0. W S e 0 W S e e ( K K T ) T q s Ke 0 z w 0 Q Z e e 0 W Se 0 ( K K T ) 2 di m ( K K T ) F F F ~ D ( G 0 ) 0 G F i ~ F Y N F i i Tatarinova et al, Journal of Pharmacokinetics and Pharmacodynamics, 2013, vol. 40 no 1 DOI 10.1007/s10928-013-9302-8 8 The marginal approach leads to a Gibbs sampler algorit hm for estimating , i.e., the expected valu e of given t he data, b ut not its distribution f unctio n [31]. This approach is commonly u sed. However, it does not solve the classical population analysis p roblem as state d above, for example, to estimate the full conditional distribution of . To solve this problem we employ the F ull Conditio nal Method. In this we estimate the full conditional dis tribution of given the data , not just the expected value of . The Full Conditional Method begins with a d efinition of the Dirichlet Process called t he Stick-Breaking representation, s ee Sethuramam [32] and Is hwaran a nd James [23]. Consid er the random distribution: (5) where the random vectors are independent and identically distributed ( iid ) f rom the known distribution and the weights are defined from the so-called stick-breaking process as follows: , for , - - - - where is the Beta distribution with parameters . The name “Stick Breaking” comes from t he fact that the are random cuts on a stick of length 1 and t he are the lengths of the pieces broken off. This gives an informal proof that the su m t o 1. It is shown in Sethuraman [32] th at the random distribution if and only if can be written in the form of Eq. (5). Below we show how to u se the Stick Breaking representation to estimate , not just . The estimate of leads to an estimate of all moments and t heir corresponding credibility int ervals. Mo re generally, the fu ll conditional method can be used to estimate any functional of F , such as a target serum concentration profile to be achieved b y a given dosage regimen, with its corresponding credibility interval. TRUNCATED STICK-BREAKING n 1 | 1 , ..., n ~ n G 0 1 n j 1 n j E [ F | D a t a ] F F F Y N F F ( ) k 1 w k k ( ) {} k 0 G { w k } B et a ( 1 , ) ( 1 , ) k v k w k w F ~ D ( G 0 ) F | F D a ta [ | ] E F D a t a | F D a ta Tatarinova et al, Journal of Pharmacokinetics and Pharmacodynamics, 2013, vol. 40 no 1 DOI 10.1007/s10928-013-9302-8 9 Ishwaran and James [23] c onsider replacing the infini te sum in Eq . (5) by a truncated version: (6) , where it is n ow required that so the series of we ights sums to o ne. They show that the truncated version is virtually indistinguishable from for sufficiently large . The o nly problem now is the si ze of . Ishwaran and James [23] have sugge sted that is sufficient. In this paper we show that this number can be dramatically reduced. Note that Eq. (6) has exactly the same form as the Eq . (2) for . The difference is t hat in Eq. (2), the weights and supp ort points are deterministic, while in Eq. (6) th e same quantities are random. In o ther words, is a det erministic distribution while is a random distribution. Full Conditional Approach . Let u s assume now t hat we have a sufficient number of components in Eq. (6) to approximate the infinite sum in Eq. (5) accurately. Using Eqs. (3,5,6) we have the new model given by (7) where the random vectors are iid from the distribution and the weights are defined by Eq. (5b) with . Eq. (7) defines a mixture model with an unknown bu t finite number of comp onents. Much is known about this subjec t [33] , [3 4] , [35]. For a fixed number of components , the posterior distribution of th e weights and the support p oints can be determined by the Blocked Gibbs Sampling [23]. Consequently, for a fixed , the posterior est imates of the support p oints and the weights are straightforward to calculate. As opposed t o the Gibbs Sam pler for the M arginal M ethod, the Gibbs Sampler for the NPB a pproach d irectly involves the distribution . Sampling the posterior of , and moments of . Let be samples of from the Gibbs Sampler aft er the sampler has “converged”. Then we have: Samples from : F K ( ) k 1 K w k k ( ) v K 1 F K F K K K 5 0 F M L { w k } { k } F M L F K 1 ( ) ; ~ ; ( ) ( ) k K i i i i i K K k k Y h e F F w 0 G v K 1 K { w k } {} k K {} k { w k } F K F K E [ F K ] F K w k m , k m , k 1 , ..., K ; m 1 , ... M w k , k F K | Y N F K ( m ) ( ) k 1 K w k m k m ( ) , m 1 , ..., M Tatarinova et al, Journal of Pharmacokinetics and Pharmacodynamics, 2013, vol. 40 no 1 DOI 10.1007/s10928-013-9302-8 10 Samples from the m oments of : Let be the j th moment of . Then samples of are given by: . In particular, samples from the first moment or m ean are given by . A histogram of the values of gives the estimated d istribution of , and the Bayesian credibility intervals are derived from it. Sa mples from the expected value . For this qu antity we calculate: . To assess the performance of our algorithm, we can compare our estimate of with the estimate from the marginalization method. Choice of K. We have implemented the Gibbs sampler from Is hwaran and James [23] , Sec. 5.2, using the software p ack age JAGS [13]. An important feature of th is algorithm is that it keep s track of the number K* of distinct components in th e K component mixture. If K is chosen too small, the algorithm will alert the user by indicating th at K*= K. See [ 36], [37] for applicati ons to pharmacokinetics using truncated stick-breaking methods. A more sophisticated way o f choosing K is based on new results for Retrospective Sampling [31] and Slice Sampling [38] , [39]. In th ese methods the infinite sum in the stick -breaking representation of Eq. (5) is retained but only as many terms in the sum are u sed as are needed in the calculation. COMPARISION OF NPAG AND NPB METHODS Both NPAG and NPB estimate the entire probability distribution F of PK/PD parameters in a population modeling setting. NPAG is a deterministic method u sing the convexity of the resulting nonparametric maximum likelihood problem. The optimization algorit hm in NPAG is based on “state of t he art” primal -dual interior-point t heory. It has be en used in our laboratory for man y years and can handle PK/PD problems defined by 20 -30 differential and algebraic equations containing 20-30 unknown parameters. The algorithm is very stable and fast. It always determines an optimal solution to the problem . The only drawback with NPAG is it does not directly determine con fidence intervals of the param eters of interest. (When the number of subjects in the population is large, then the asymptotic confidence intervals can b e obtained with additional computing by bootstrap methods.) F * | Y N j j dF ( ) F K | Y N j j ( m ) k 1 K w k m ( k j ) m , m 1 ,..., M ( m ) j ( m ) dF ( m ) ( ) k 1 K w k m k m , m 1 ,..., M ( m ) dF ( ) E [ F K | Y N ] E [ F K | Y ] ( 1 / M ) m 1 M F K ( m ) ( ) E [ F K | Y N ] Tatarinova et al, Journal of Pharmacokinetics and Pharmacodynamics, 2013, vol. 40 no 1 DOI 10.1007/s10928-013-9302-8 11 NPB is a stochastic Mo nte Carlo Markov Chain (MCMC) m ethod. The unknown probability distribution F is considered to be a random variable with a D irichlet process prior. The Dirichlet process is implemented with the Sethuraman's stick -breaking representation. The algorithm used t o estimate F is a Metropolis-within-Gibbs samp ling (GS) scheme. For the example in th is paper, the program JAGS is used t o implement this scheme. This implementation of GS is composed of three parts: First a number of samples of GS are b urned to remove dependence on the in itial conditions; t hen GS is run for a large n umber of iterations until “convergence” is achieved. Then after convergence, GS is run some more to get the samples used for the actual estimation and plotting of results. The number of samples required for convergence is a d elicate issue. There a re m any candidates to test con vergence of MCMC algorithms. No one method is perfect. We use t he Gelman-Rubin method of parallel chains to determine convergence. Fin ally, being a Bayesian method, NPB can p rovide rigorous credibility intervals for a ny function of i nterest of the PK/ PD parameters. These credibility intervals are accurate in both large a nd small population sample sizes. In conclusion, for a given set of i nitial conditions, NPAG will always give the same results, whereas NPB may p ossibly give d ifferent results depending on th e sampling scheme. On t he other hand, n o confidence interva ls are available with NPAG (without asymptotic boots trap) , while rigorous Bayesian credibility intervals are defined for NPB no matter what the sample size. Consequently, it is extremely useful to be able to run both NPAG and NPB side b y side and compare the results (as shown in this paper). Finally, both NPAG and NPB estimate F with a finite discrete probability distribution (as described in the paper). Th is result is vital for our resulting maximally precise “mu ltiple model” dosage optimization and experimental design programs. EXAMPLE: A POPULATION PK STUDY We took d osing, sample times, and body weights fro m N=35 infants enrolled in an IV zidovudine PK study as a template to simulate new observations after a short intravenous (I V ) infusion of a hypothetical drug into a one compartment model wit h simulated PK parame ter values. This provided a realistic simulated dataset with unbalanced doses, nu mber of samp les numbers and sample ti mes in the p opulation, but w ith known PK para mete r values for each subject. We u sed the Monte Carlo simulator function in our R package Pmetrics [21]. In short, Pmetrics is our freely available R package for non -parametric and parametric p opulation modeling and simulation. It can model multiple inputs and outputs simultaneously, with complex dosing regimens, inclusion of covariates, lag times, and non -zero initial conditions all available t o the user. Specification of a model, based on algebraic equations or differential eq uations and incorporating any function of parameters and covariates , is done with a very simple text file. Detailed examples and model files can be found at http://www.lapk.org . Tatarinova et al, Journal of Pharmacokinetics and Pharmacodynamics, 2013, vol. 40 no 1 DOI 10.1007/s10928-013-9302-8 12 Simulation model . For the PK p arameter values, we set the elimination rate constant ( K e l ) as a mixture of two normal distributions with arbitrary means of 0.5 and 1.0 1/h and weights of 0.3 and 0.7. The p opulation average was equal to 0.85 1/h an d located in the ''valley" bet wee n the two modes. These p arameter values produced realistic t ime-concentration p rofiles. The coefficients o f varia tion (CV) for ea ch distribution were set a t 25%. We set the volume of distribution to be a single n ormal distribution, wi th a mean of 2.0 L / kg and sta ndard deviation of 0. 5 L/kg. Th e measurement noise, as a normal distribution with mean 0 and standard deviation σ e =0.01, was added to each simulated observation. Hence, we consid er a one comp artment model with T =5 or 6 serum measurements (specific f or each patient) for a population of N=35 subjects. In t his case ; where is b imodal and is unimodal. Therefore the model that was used to simulate the data is described by t he following equations: - () - ( 1 - ) , 1 ,. . . , ; 1 , . . . , i i j i j i i i i i j i i ii td d R Y e e e i N j n W t V ~ (0 , 0. 0 1 ) ij eN ) 25 . 0 , 0 . 1 ( 7 . 0 ) 125 . 0 , 5 . 0 ( 3 . 0 ~ N N i ) 5 . 0 , 0 . 2 ( ~ N V i where R i is the s ubject-specific infusion rate wit h d i infusion duration for zidovudine; Wt i is the body weight in kg for each subject; t ij is the time of the j th sample from subject i ; and e ij is the measurement noise o f the j th me asurement noise in subject i . V alues of R i , Wt i , d i were t he defined patient-specific parameters in t he original population of infants. The symbol ~ means “distributed as”. To avoid negative parameter val ues we also set: and . Estimation Model . The NPB model used to analyze the d ata came from the stick- breaking representation, with K =17, see Eq. (6). This number of s tick breaks (support points) for the NPB prior was based on the number of clusters created by the NPB a lg orithm and was determined by a manual iterative approach. If more than 17 support points were used the resulting probabili ties assigned to additional support points were negligible. The base measure ) , ( 0 V G was given by: 0 0 0 0 0 0 0 0 ~ ( ,1 / ), ~ (0 .8 , 0. 5 ), ~ G a m m a ( 1 ,1 ) ~ ( ,1 / ), ~ (2.0 , 0 .5 ), ~ G a m m a ( 1 ,1 ) VV NN V N V V N where Gamma(a,b) is the gamma distribution with parameters a,b . These are the common distributions traditionally c hosen for means an d variances. The user of the p rogram can also make other choices. ) , ( V V Tatarinova et al, Journal of Pharmacokinetics and Pharmacodynamics, 2013, vol. 40 no 1 DOI 10.1007/s10928-013-9302-8 13 Using the N PAG algorithm [ 19] f rom the Pmetri cs sof tware package [21] , we calculated the maximum likelihood distribution ML F , see Figure 2. Implementing the stick- breaking algorithm using the Rjags package [40], we calculated the estimated c onditional distributi on ML F , shown in Figure 2. For the NPB algorithm, we used one Markov Chain for the Monte Carlo simulation, drawing every 10th posterior sample from iteration 10,000 to 10, 500. As a further comparison, we also fitted the data with the NONMEM FOCE algorithm, with V and K modeled as univariate normal distributions with an additive measurement error e ij . Results Simulated observations with realistic, unbalanced sampling times and sample numbers ranged from <0.01 to 1.64 mg/L, calculated up to 8 hours after dosing, with 5 – 6 samples per subject at times that varied throughout the population, a nd which correspo nded to the times that real infants in the source population had bee n sampled. Figure 1 shows the simu lated time-series. The who le NPAG optimization, including post -processing and report generation, took 18 seconds on a M acBook Pro with 2.54 GHz Intel core 2 Duo processors and 4 GB of RAM. On the same computer, NPB took 2 minutes. Summaries of the simulated (True) valu es for KEL and VOL and of the weighted suppo rt points fitted b y the NPB , N PAG and FOCE algorithms are sho wn in the Table 1. Figures 2-5 show the output of the NPB algo rithm. In the Figures 2 and 3, the N PB est imates for Vol and Kel are plotted agains t the histogram of simulated valu es for volume of distribution. Figu res 4 and 5 show NPB erro r in true - fitted parameter values f or comparison of NPB estimated vs. the simulated values f or volume of d istribution and elimination constan t. Fig ures 6 and 7 show t he NPAG estimates for Vol and Kel compared again st the histogram of simulated values for volume of distribution. For 35 subjects NPB estimates values Vol and Kel for individual p atients, b ut the es timated parameter distribution fun ctions have too many peaks as compared to the " true" parameter distributions. When we i ncrease the number of subjects to 70 o r more (data not sh own), the estimated p arameter distribution functions has two modes for Kel and one mode for V ol , and parameter distribution s approach the true p opulation distributions. However, due to the nature of our simulation stud y ( infant HIV patients enrolled in an IV zidovudine PK study) it is not realistic to expect large cohorts in a clinical setting. Tatarinova et al, Journal of Pharmacokinetics and Pharmacodynamics, 2013, vol. 40 no 1 DOI 10.1007/s10928-013-9302-8 14 DISCUSSION Bayesian methods are rapidly gaining recognition and popularity. A comprehensive overview of the general philosophy of Bayesian methods can be found in the book " The Bayesian Choice " [41] . Computational issues of MCMC methods are well d escribed in "Monte Carlo Statistical Methods" [42]. Biostatistics applications are described in the chapter "Nonparametric Bayes Applications to Biostatistics" [43] . To the best of our knowledge, currently there are no textbooks th at primarily discuss nonparametric p harmacokinetic modeling. However, our references [14] , [15] , [16], [17] , [18] provide a good survey of this subjec t. We have described two novel methods, NPAG and N PB, to estimate the pop ulation distribution F of PK parameters , have shown th eir excellent performance i n a realistically simulated PK study. We also compared their performan ce to NONMEM, the widely-used FOCE algorithm . In this sim ple model, FOCE, a parametric method, was able to find the same th e mean parameter values and st andard deviations, but could n ot find the true non-n or mal distribution for K without resorting to post-hoc estimates. In contrast, both N PAG and NPB are able t o directly estimate t he true distribution. In future work beyond ou r proof - of -principle work on NPB here, we will show that more "challen ging" d ata with grea ter noise and non -normal parameter value distributions are even better fitted b y optimize d non -parametric methods, i.e. N PAG and NPB. In this paper, our sim ulation allowed us to have benchmarks in the form of the true popul ation parameter values t o compare with the estimated values, while in corporating challenges like unbalanced samp le times and samp le numbers as well as the a bility to inc lude th e covariate of patient weight. The statistical problem of estimating has a direct utility in the form of individualized therapy of future patients becau se the estimate of can be used quickly and accurately to isola te a new patient's characteristics (i.e., parameters) and use this knowledge to tailor patient -specific efficacious treatment. The NPB me thod is very flexible an d has been used in many ar eas of applied statistics and bioinformatics outside PK, discussed, for example , in [43]. NPAG and N PB represent two end s of the spectrum spanning frequentist (NPAG) to Bayesian (NPB) met hodologies; they est imate the entire distribution , not just parameter values. The two methods are the stat e- of -the-art in nonparametric population modeling, an d they accurately estimate t he parameter distributions without resorting to any a priori ass u mptions about the underlying form o f these distributio ns. While NPAG is significantly f aster at present, the main advantage of the NPB method is that it n aturally allows for robust credibility intervals for all parameter estimates. F F F Tatarinova et al, Journal of Pharmacokinetics and Pharmacodynamics, 2013, vol. 40 no 1 DOI 10.1007/s10928-013-9302-8 15 The simulation study presented above is performed in the setting of a real zidovudine trial which allows us to have benchmarks in the form of the true population parameters to compare with the estimates produced by the two methods, while incorporating realistic challenges lik e unbalanced samp le times and samp le numbers as well as the a bility to inc lude th e covariate of patient weight. Figures 2 -7 and Table 1 show t hat bo th method s focus on the marginal distributions of Kel (elimination rate constant) and Vol (volume of distribution) in our example and produce accurate estimates of their moments. We have previously shown that NPAG, as implemented in o ur Pmetrics R p ackage, can directly and accurately detect true non -normal parameter distributions and outliers in an idealized simulated population [21] . In addition to confirming this property of NPAG with a mor e realistic study d esign here, we exte nd this property to our NPB algorithm. Future refin ements o f the NPB algorithm include exploring converg ence criteria, implementation of t he Retrospective a nd Slice sampling methods t o determine t he correct number of stick breaks (i.e. sup port points, as opp osed to the empiric approach d escribed here), and generalization to even more complex PK models, inclu ding arbitrary models defined by ordinary differential equations. The software used to imp lement N PAG and NPB c an be obtained from http://lapk.org/software.php . Tatarinova et al, Journal of Pharmacokinetics and Pharmacodynamics, 2013, vol. 40 no 1 DOI 10.1007/s10928-013-9302-8 16 ACKNOWLEDGEMENTS Support from NIH: GM068968, EB 005803, EB001978, N IH-NICHD: HD070996 and Royal Society: TG103083 is gratefully acknowledged. References 1. FDA. FDA Guidance fo r Industry: Population Pha rmacokine tics . . 1999. 2. BEAL, S.; SHEINER, L. Estimating population kinetics. Crit Rev B iomed Eng. , v. 8, n. 3, p. 95-222, 1982. 3. BEAL, S. L.; SHEINER , L. B. NON MEM User’s Guide. In : Nonlinear Mixed Effects Mo dels for Repeated Measures . University of California: San Francisco, 1 992. 4. LAVIELLE, M.; MENT RÉ, F. Estimation of p opulation pharmac okinetic parame ters of saquinavir in H IV patients with the M ONOLIX softwar e. Journal of Phar macokinetics and Pharmacodyna mics , v. 34, n. 2, p. 229-49, 20 07. 5. D’ARGENIO, D. Z.; SCH UMITZKY, A.; WANG, X. ADAPT 5 User’s Guide:Pharmacokinet ic/Pharmacod ynamic System s Analysis So ftware. . Los Angeles. 2009. 6. WANG, A.; SCHUMITZ KY, A.; DARGEN IO, D. Nonlinear random effects mixture m odels: Maximum likelihood estima tion via th e EM algorithm. Comput. Stat. Data Ana l. , v. 51, p. 66 14-6623, 2007. 7. WANG, A.; SCHUMITZ KY, A.; DARGEN IO, D. Populati on pharmacokine tic/pharmacodyana mic mixture models via maxi mum a pos teriori estimation. Compu t. Stat. Data Ana l. , 2009. 8. LINDSAY, B. The Ge ometry of Mixture Likeliho ods: A General Th eory.. Ann Stat , v. 11, p. 8 6 – 94, 1983. 9. MALLET, A. A maximum likelih ood estimation method for rand om coefficient reg ression models. Biometrika , v. 73, p. 645 – 656, 198 6. 10. KIEFER, J.; WOLFOWI TZ, J. Consist ency of the Maxi mum Likelih ood Estimator in t he Presence of Infinitely Many Inciden tal P arameters. The Annal s of Mathe matical Statistics . , v. 27, n. 4, p. 887- 906, 1956. 11. BAVEREL, P.; SAVIC, R. ; KAR LSSON, M. Two b ootstrapping routines f or obtaining i mprecision estimates for nonp arametr ic parameter distrib utions in nonlinear mixed effects mod els. J Pharmacokinet Ph armacodyn. , v. 38, n. 1, p. 63-82, F eb 2011. Epub 201 0 Nov 13 . 12. SPIEGELHALTER, D. J.; THOMAS, A.; BEST, N. G. WinBUGS Version 1.4 User Ma nua l, MRC Biostatistics Unit. 2004. Tatarinova et al, Journal of Pharmacokinetics and Pharmacodynamics, 2013, vol. 40 no 1 DOI 10.1007/s10928-013-9302-8 17 13. PLUMMER, M. JA GS: A Program for Analy sis of Bayesi an Graphical Models Using Gib bs Sampling. Proceedings of th e 3rd International W orkshop on Distributed Statis tical Comput ing (DSC 2003). Vienna, Austria. 20 03. 14. WAKEFIELD, J.; WA LKER, S. Bayesian n onparametric population models: for mulation and c omparison with likelihood app roaches.. J Pha rmacokinet Biopha rm , v. 25, p. 23 5 – 253, 1997. 15. WAKEFIELD, J.; WA LKER, S. Populati on models with a n onparametric random coefficient distrib ution. Sankhya Series B , v. 60, p. 19 6 – 212, 1998. 16. MUELLER, P.; ROSN ER, G. A Bayesian Population Mode l With Hierarchical Mixture Priors Appli ed to Blood Count Data. J A m Stat Assoc , v. 9 2, p. 1279 – 1292, 19 97. 17. ROSNER, G.; MUEL LER, P. Bayesian p opulation ph armacokinetic and ph armacody namic analyses using mixture models. J Pharmacokine t Biopharm , v. 25, p. 209 – 233, 19 97. 18. WANG, J. Dirichl et Processes in Nonlin ear Mixed Eff ects Models. Commun ications in Stat istics: Simulation and Compu tati on , v. 39, p. 539-55 6, 2010. 19. YAMADA, Y. et al. The Nonpa rametric Adaptive Gr id Algorith m for Populatio n Pharmacokine tic Modeling. USC 201 2. 20. NEELY, M. et al. Non -Parametric Bayesian Fittin g: A Novel Approach to Population Phar macokinetic Modeling. Poster presented at: Population Anal ysis Group in Europe. Venice, Ital y, 2012. 21. NEELY, M. et al. A ccurate Detection of Outliers and Su bpopulations With Pmetrics, a Nonpara metric and Parametric Phar macometri c Modeling and Si mulation Package for R. Theraputic Drug Monitoring , v. 34, n. 4, p. 467 – 476, 2012. 22. BUSTAD, A. et al. Par ametric an d Nonparametri c Population Methods: Their Co mparative Performance in Anal ysing a Clin ical Dataset and T wo Monte Carl o Simulation St udies. Clinical Pharmacokinet ics , v. 45, n. 4, p. 365-383, 2006. 23. ISHWARAN, H.; JAM ES, L. Gib bs Sampling Methods for Stick-Breaking Priors. J Am S tat Assoc , v. 96, p. 161 – 173, 20 01. 24. JELLIFFE, R. et al. Ach ieving target g oals most precis ely using nonparam etric comp artmental models and “multiple model” desig n of dosage regim ens. Th er. Drug. Mon it. , v. 22, p. 34 6 – 353, 2000. 25. SCHUMITZKY, A. N onparametri c EM Algorithm s for Estimatin g Prior Distributi ons. Applied Math and Computation , v. 45, p. 141 – 157, 1991. 26. LEARY, R. et al. An a daptive grid no n-parametric app roach to popula tion pharmacokinetic /dynamic Tatarinova et al, Journal of Pharmacokinetics and Pharmacodynamics, 2013, vol. 40 no 1 DOI 10.1007/s10928-013-9302-8 18 (PK/PD) population models . Proceedin gs, 14th IEEE symp osium on Computer Based Medi cal Systems. 2001. p. 3 89 – 394. 27. BAEK, Y. An Interio r Point App roach to Constra ined Nonp arametric Mixture M odels . University of Washington. 200 6. 28. FOX, B. L. Algorithm 647: Imple mentation and Relative Efficien cy of Quasirand om Sequence Generators. Transa ctions on Mathematical So ftware , v. 12, n. 4, p. 362-376, 1986. 29. KARUSH, W. Mini ma of Functions of Se veral Varia bles with Inequalities as Side Con straints . University of Chicag o. Chicago, Il. 1939. 30. KUHN, H.; TUCKER, A. Nonlinea r Programming . Pr oceedings of the 2nd Berkeley Symp osium. [s.n.]. 1951. p. 481-492. 31. PAPASPILIOPOU LOS, O.; ROBERTS, G. O. Retrospec tive Markov Chain Monte Carlo meth ods for Dirichlet process hier archical m odels. Biometrika , v. 95, n. 1, p. 169-18 6, 2008. 32. SETHURAMAN, J. A constructive defin ition of Diri chlet priors. Statistica S inica , v. 4, p. 63 9 – 650, 1994. 33. TATARINOVA, T. Ba yesian Ana lysis of Linear and Non linear Mixture Mo dels . USC. Los Angeles. 2006. 34. TATARINOVA, T.; B OUCK, J.; SCHUMI TZKY, A. Kullbac k-Leibler Markov chain Monte Carl o -- a new algorithm for finite mixture analysis and its applicati on to gene expressi on data. J Bioinfor m Comput Bio l. , v. 6, n. 4, p. 7 27-46, Ag 20 08. 35. FRÜHWIRTH-SCHNATTE R, S. Finite M ixture and Marko v Switching Mo dels . 1st ed. ed. New Yor k: Springer, 2010. Springer Series in Statistics. 36. GHOSH, P.; ROSNER , G. A Semipara metric Bayesian Approach to Average Bioequivalence. Sta tistics in Medicine , v. 2 6, p. 1224-1236, 2 007. 37. OHLSSEN, D.; SHAR PLES, L.; SPIEGELHALT ER, D. ‘Flexible rand om -effects models usin g Bayesian semi- parametric mod els: applica tions to institutional c omparisons. Statistic s in Medici ne , v. 26, p. 2088 – 2112, 2007. 38. WALKER, S. Sampli ng the Dirichl et mixture model with slices. Communication s in Sta tistics: Simulation and Compu tati on , v. 36, p. 45 – 54, 2007. 39. KALLI, M.; GRIFFEN, J. ; WALKER, S. Sl ice Sampling Mi xture Models. Statistics and Computin g , v. 21, p. 93-105, 2011. Tatarinova et al, Journal of Pharmacokinetics and Pharmacodynamics, 2013, vol. 40 no 1 DOI 10.1007/s10928-013-9302-8 19 40. PLUMMER, M. rjag s: Bayesian graphical mod els using MCMC. 2011. 41. ROBERT, C. The Ba yesian C hoice . 2nd. ed. Springer, 2 007. 42. ROBERT, C.; CASEL LA, G. Monte Carlo Sta tistical Meth ods . 2nd. ed. Springer, 2004. 43. DUNSON, D. Nonpara metric Bay es Applications t o Biostatistics. In : HJORT, N., et al. Bayesian Nonparametrics . Ca mbridge University Press, 201 0. p. 223-268. Tatarinova et al, Journal of Pharmacokinetics and Pharmacodynamics, 2013, vol. 40 no 1 DOI 10.1007/s10928-013-9302-8 20 List of Tables Table 1: Summaries o f the simulat ed (True) values for elimination rate c onstant (KE L) and volume of distribution (VOL) and the corresponding values fitted by the Non-Parametric Adaptive Grid (NPAG), Non-Parametric Ba yesian (N PB) and NONMEM algori thms. Tatarinova et al, Journal of Pharmacokinetics and Pharmacodynamics, 2013, vol. 40 no 1 DOI 10.1007/s10928-013-9302-8 21 List of Figures Figure 1: Time conc entration profil es for each of the 35 simulat ed subjects. Tatarinova et al, Journal of Pharmacokinetics and Pharmacodynamics, 2013, vol. 40 no 1 DOI 10.1007/s10928-013-9302-8 22 Figure 2: NPB distribution and simulated values for volume of distribution (VOL). Marginal distributions for simulated (true) parameter values are shown in black circles and seven filled histograms. The posterio r distribution is represent ed in two ways 1) dark grey bars with binning (nbins=50) and 2) a smoothed sum of normal distributions about the m eans of the distribu tions for each of the 17 support points (solid black line) . True population distribution is shown as a dashed line. Tatarinova et al, Journal of Pharmacokinetics and Pharmacodynamics, 2013, vol. 40 no 1 DOI 10.1007/s10928-013-9302-8 23 Figure 3: NPB distributio n and simulated values for elimination rate constant (KEL). Marginal distributions for simulated (true) parameter valu es ar e shown in black circles and filled histograms. The p osterior distribution is repre sented in tw o ways 1) dark gr ey bars with binning (nbins=50) an d 2) a smoothed sum of normal distributions ab out the m eans of the distributions for each of the 17 support points (solid bla ck line). True p opulation distri bution is shown as a dash ed line. Tatarinova et al, Journal of Pharmacokinetics and Pharmacodynamics, 2013, vol. 40 no 1 DOI 10.1007/s10928-013-9302-8 24 Figure 4: NPB error in true - fitted parameter values (VOL). Linear regression o f simulated vo lume of distribution vs. predicted volume of distributi on for each of th e 35 si mulated subjects u sing N PB algorithm. Tatarinova et al, Journal of Pharmacokinetics and Pharmacodynamics, 2013, vol. 40 no 1 DOI 10.1007/s10928-013-9302-8 25 Figure 5: NPB error in true - fitted parameter values (KEL). Linear regression of simulated eliminatio n constant vs. predicted elimination constant for each of the 35 simulated subjects using NPB algorithm. Tatarinova et al, Journal of Pharmacokinetics and Pharmacodynamics, 2013, vol. 40 no 1 DOI 10.1007/s10928-013-9302-8 26 Figure 6: N PAG d istribution and si mulated values for volume of distribution ( VOL). Distrib ution of simulated (true) parameter values are shown in bla ck circles. The posterior distribution is represented by dar k grey bars. True p opulation distrib ution is shown as a d ashed li ne. Tatarinova et al, Journal of Pharmacokinetics and Pharmacodynamics, 2013, vol. 40 no 1 DOI 10.1007/s10928-013-9302-8 27 Figure 7: NPAG distribution and simulated values for elimination rate constant (KEL). Distribution of simulated (true) parameter values are shown in black circles. The posterior distribution is represented by dar k grey bars. True p opulation distrib ution is shown as a d ashed li ne. Tatarinova et al, Journal of Pharmacokinetics and Pharmacodynamics, 2013, vol. 40 no 1 DOI 10.1007/s10928-013-9302-8 28 Figure 8: NPAG error in true - fitted parameter values (VOL). Linear regression of sim ulated volume of distribution vs. predicted volume of distribution for each o f the 35 simulated subjects using NPAG algorithm. Tatarinova et al, Journal of Pharmacokinetics and Pharmacodynamics, 2013, vol. 40 no 1 DOI 10.1007/s10928-013-9302-8 29 Figure 9 : NPAG error in true - fitted parameter values (KEL). Linear regres sion o f simulat ed elimination c onstant vs. pr edicted eliminati on constant fo r each of the 35 si mulated subject s using NPAG algorithm.
Original Paper
Loading high-quality paper...
Comments & Academic Discussion
Loading comments...
Leave a Comment