Adaptive learning rates and parallelization for stochastic, sparse, non-smooth gradients
Recent work has established an empirically successful framework for adapting learning rates for stochastic gradient descent (SGD). This effectively removes all needs for tuning, while automatically reducing learning rates over time on stationary prob…
Authors: Tom Schaul, Yann LeCun
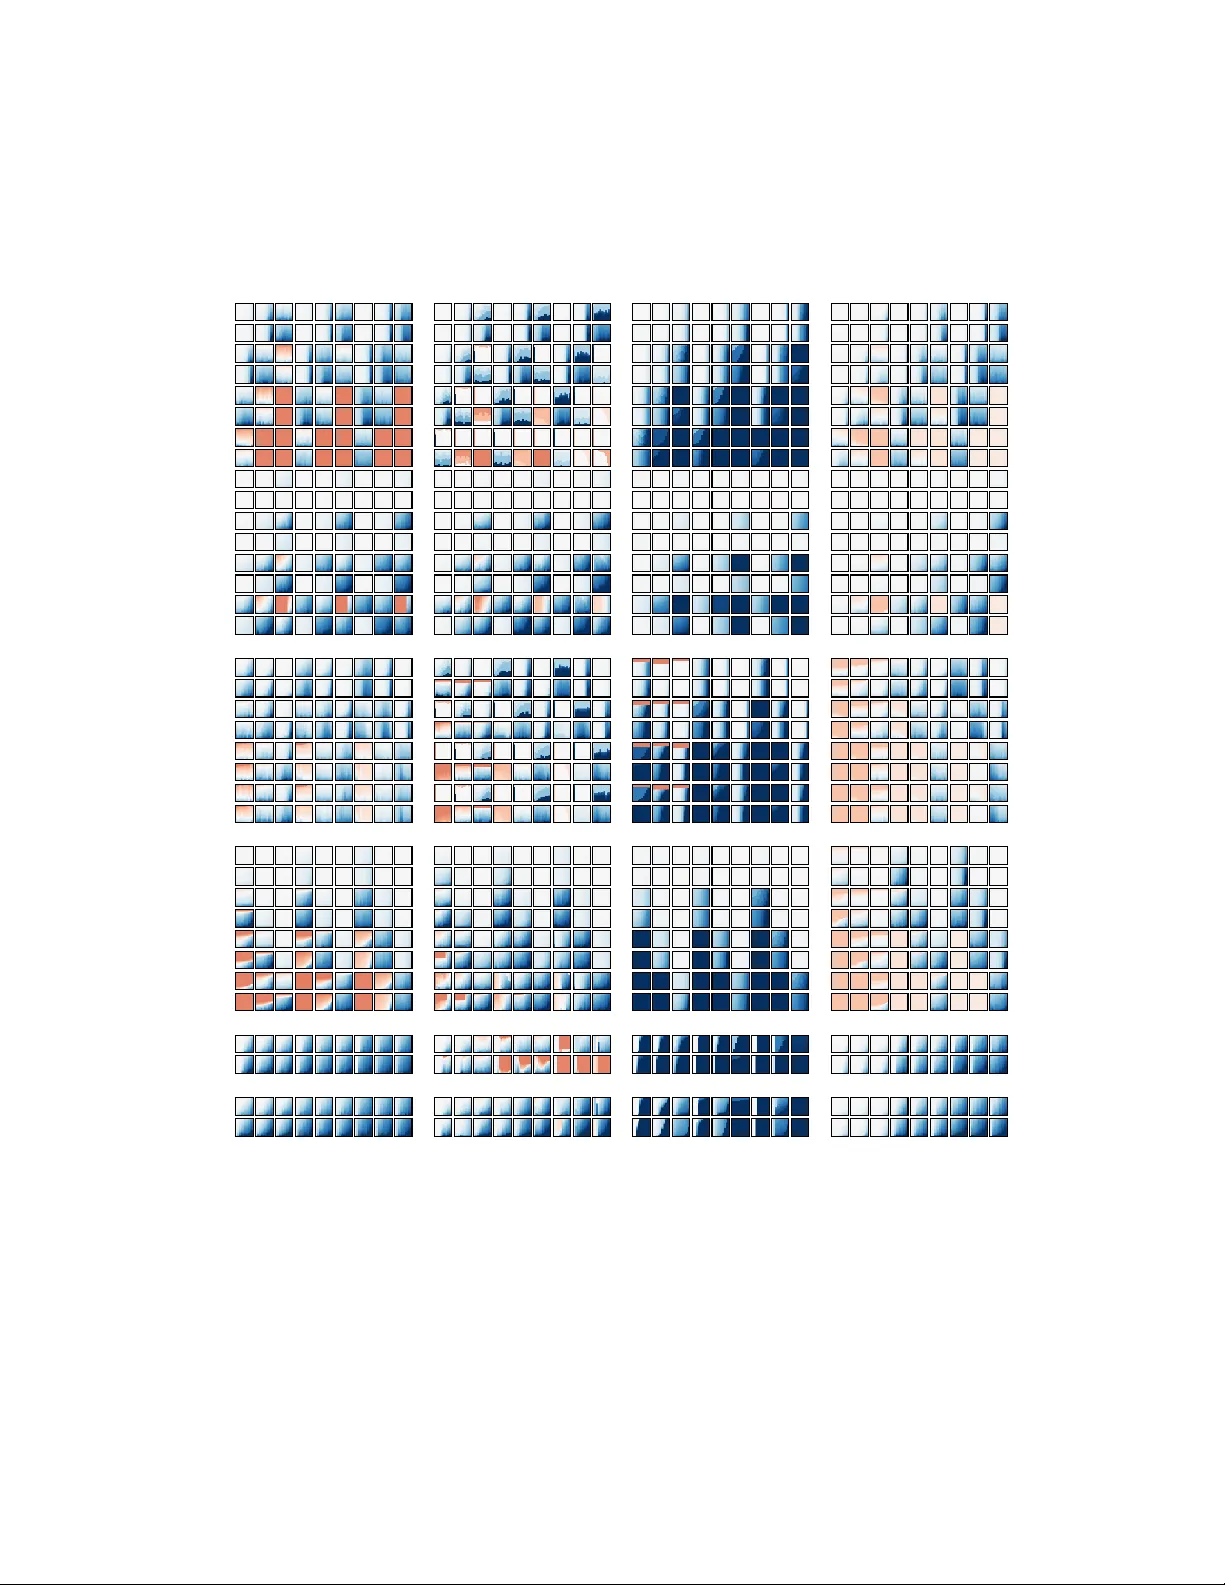
Adaptiv e lear ning rates and parallelization f or stochastic, sparse, non-smooth gradients T om Schaul Courant Institute of Mathematical Sciences New Y ork Univ ersity , 715 Broadway , 10003, New Y ork schaul@cims.nyu.edu Y ann LeCun Courant Institute of Mathematical Sciences New Y ork Univ ersity , 715 Broadway , 10003, New Y ork yann@cims.nyu.edu Abstract Recent work has established an empirically successful frame work for adapting learning rates for stochastic gradient descent (SGD). This effecti v ely removes all needs for tuning, while automatically reducing learning rates ov er time on stationary problems, and permitting learning rates to grow appropriately in non- stationary tasks. Here, we extend the idea in three directions, addressing proper minibatch parallelization, including reweighted updates for sparse or orthogonal gradients, impro ving rob ustness on non-smooth loss functions, in the process re- placing the diagonal Hessian estimation procedure that may not always be av ail- able by a rob ust finite-difference approximation. The final algorithm inte grates all these components, has linear complexity and is hyper -parameter free. 1 Introduction Many machine learning problems can be framed as minimizing a loss function over a large (maybe infinite) number of samples. In representation learning, those loss functions are generally built on top of multiple layers of non-linearities, precluding any direct or closed-form optimization, but admitting (sample) gradients to guide iterativ e optimization of the loss. Stochastic gradient descent (SGD) is among the most broadly applicable and widely-used algo- rithms for such learning tasks, because of its simplicity , robustness and scalability to arbitrarily large datasets. Doing many small but noisy updates instead of fewer large ones (as in batch meth- ods) giv es both a speed-up, and makes the learning process less likely to get stuck in sensitive local optima. In addition, SGD is eminently well-suited for learning in non-stationary en vironments, e.g., when that data stream is generated by a changing en vironment; but non-stationary adaptivity is use- ful e v en on stationary problems, as the initial search phase (before a local optimum is located) of the learning process can be likened to a non-stationary en vironment. Giv en the increasingly wide adoption of machine learning tools, there is an undoubted benefit to making learning algorithms, and SGD in particular, easy to use and hyper-parameter free. In recent work, we made SGD hyper-parameter free by introducing optimal adaptive learning rates that are based on gradient variance estimates [1]. While broadly successful, the approach was limited to smooth loss functions, and to minibatch sizes of one. In this paper , we therefore complement that work, by addressing and resolving the issues of • minibatches and parallelization, • sparse gradients, and • non-smooth loss functions all while retaining the optimal adaptive learning rates. All of these issues are of practical importance: minibatch parallelization has strong diminishing returns, but in combination with sparse gradients and adaptiv e learning rates, we show how that effect is drastically mitigated. The importance of 1 robustly dealing with non-smooth loss functions is also a very practical concern: a growing num- ber of learning architectures employ non-smooth nonlinearities, like absolute v alue normalization or rectified-linear units. Our final algorithm addresses all of these, while remaining simple to imple- ment and of linear complexity . 2 Background There are a number of adaptiv e settings for SGD learning rates, or equiv alently , diagonal precondi- tioning schemes, to be found in the literature, e.g., [2, 3, 4, 5, 6, 7]. The aim of those is generally to increase performance on stochastic optimization tasks, a concern complementary to our focus of producing an algorithm that works robustly without any hyper-parameter tuning. Often those adaptiv e schemes produce monotonically decreasing rates, howe ver , which makes them no longer applicable to non-stationary tasks. The remainder of this paper build upon the adapti ve learning rate scheme of [1], which is not mono- tonically decreasing, so we recapitulate its main results here. Using an idealized quadratic and separable loss function, it is possible to derive an optimal learning rate schedule which preserves the con ver gence guarantees of SGD. When the problem is approximately separable, the analysis is simplified as all quantities are one-dimensional. The analysis also holds as a local approximation in the non-quadratic but smooth case. In the idealized case, and for any dimension i , the optimal learning rate can be deriv ed analytically , and takes the follo wing form η ∗ i = 1 h i · ( θ i − θ ∗ i ) 2 ( θ i − θ ∗ i ) 2 + σ 2 i = 1 h i · ( E [ ∇ θ i ]) 2 E [ ∇ 2 θ i ] (1) where ( θ i − θ ∗ i ) is the distance to the optimal parameter value, and σ 2 i and h i are the local sample variance and curv ature, respectively . W e use an exponential moving average with time-constant τ (the approximate number of samples considered from recent memory) for online estimates of the quantities in equation 1: g i ← (1 − τ − 1 i ) · g i + τ − 1 i · ∇ θ i v i ← (1 − τ − 1 i ) · v i + τ − 1 i · ( ∇ θ i ) 2 h i ← (1 − τ − 1 i ) · h i + τ − 1 i · h ( bbprop ) i where the diagonal Hessian entries h ( bbprop ) i are computed using the ‘bbprop’ procedure [8], and the time-constant (memory) is adapted according to how lar ge a step was taken: τ i ( t + 1) = 1 − g i ( t ) 2 v i ( t ) · τ i ( t ) + 1 The final algorithm is called vSGD, and used the learning rates from equation 1 to update the pa- rameters (element-wise): θ ← θ − η ∗ · ∇ θ 3 Parallelization with minibatches Compared to the pure online SGD, computation time can be reduced by “minibatch”-parallelization: n sample-gradients are computed (simultaneously , e.g., on multiple cores) and then a single update on the resulting av eraged minibatch gradient is performed. ∇ θ = 1 n n X k =1 ∇ ( k ) θ (2) While n can be seen as a hyperparameter of the algorithm [9], it is often constrained to a large extent by the computational hardware, memory requirements and communication bandwidth. A deriv ation just like the one that led to equation 1 can be used to determine the optimal learning 2 1 0 0 1 0 1 1 0 2 1 0 3 1 0 4 minibatch size 1 0 - 3 1 0 - 2 1 0 - 1 1 0 0 relative log-loss gain per sample sparsity=1.0 1 0 0 1 0 1 1 0 2 1 0 3 1 0 4 minibatch size 1 0 - 2 1 0 - 1 1 0 0 sparsity=0.2 1 0 0 1 0 1 1 0 2 1 0 3 1 0 4 minibatch size 1 0 - 1 1 0 0 sparsity=0.05 low noise med noise high noise Figure 1: Diminishing returns of minibatch parallelization. Plotted is the relative log-loss gain (per number of sample gradients ev aluated) of a giv en minibatch size compared to the gain of the n = 1 case (in the noisy quadratic scenario from section 2, for different noise levels σ , and assuming optimal learning rates as in equation 4); each figure corresponds to a different sparsity level. For example, the ratio is 0.02 for n = 100 (left plot, low noise): This means that it takes 50 times more samples to obtain the same gain in loss than with pure SGD. Those are strongly diminishing returns, but they are less drastic if the noise lev el is high (only 5 times more samples in this example). If the sample gradients are somewhat sparse , howe ver , and we use that fact to increase learning rates appropriately , then the diminishing returns kick in only for much larger minibatch sizes; see the left two figures. rates automatically , for an arbitrary minibatch size n . The key difference is that the averaging in equation 2 reduces the effecti ve variance by a f actor n , leading to: η ∗ i = 1 h i · ( θ i − θ ∗ i ) 2 ( θ i − θ ∗ i ) 2 + 1 n σ 2 = 1 h i · ( E [ ∇ θ i ]) 2 1 n E [ ∇ 2 θ i ] + n − 1 n ( E [ ∇ θ i ]) 2 (3) This expresses the intuition that using minibatches reduces the sample noise, in turn permitting larger step sizes: if the noise (or sample div ersity) is small, those gains are minimal, if it is large, they are substantial (see Figure 1, left). V arying minibatch sizes tend to be impractical 1 to implement howe ver , and so common practice is to simply fix a minibatch size, and then re-tune the learning rates (by a factor between 1 and n ). W ith our adapti ve minibatch-aware scheme (equation 3) this is no longer necessary: in fact, we get an automatic transition from initially small ef fectiv e minibatches (by means of the learning rates) to large minibatches to ward the end, when the noise lev el is higher . 4 Sparse gradients Many common learning architectures (e.g., those using rectified linear units, or sparsity penalties) lead to sample gradients that are increasingly spar se , that is, the y are non-zero only in small fraction of the problem dimensions. It is possible to exploit this to speed up learning, by av eraging many sparse gradients in a minibatch, or by doing asynchronous updates [10]. Here, we in vestigate ho w to set the learning rates in the presence of sparsity , and our result is simply based on the observation that doing an update using a set of sparse gradients is equiv alent to doing the same update, but with a smaller ef fective minibatch size, while ignoring all the zero entries. W e can do this again on an element-by-element basis, where we define z i to be the number of non-zero elements in dimension i , within the current minibatch. In each dimension, we rescale the minibatch gradient accordingly by a factor n/ ( n − z i ) , and at the same time reduce the learning rate to reflect the smaller effecti ve minibatch size. Compounding those two effects giv es the optimal learning rate for sparse minibatches (we ignore the case z i = n , when there is no update): η ∗ i = n n − z i · 1 h i · ( E [ ∇ θ i ]) 2 1 n − z i E [ ∇ 2 θ i ] + n − z i − 1 n − z i ( E [ ∇ θ i ]) 2 (4) Figure 1 sho ws ho w using minibatches with such adaptive learning rates reduces the impact of diminishing returns if the sample gradients are sparse. In other words, with the right learning rates, higher sparsity can be directly translated into higher parallelizability . 1 If the implementation/computational architecture is flexible enough, the variance-term of the learning rate can also be used to adapt the minibatch size adaptiv ely to its optimal trade-off. 3 1 0 0 1 0 1 1 0 2 1 0 3 1 0 - 1 1 0 0 rel. gain (sparsity=0.1) low noise 1 0 0 1 0 1 1 0 2 1 0 3 1 0 - 1 1 0 0 med noise 1 0 0 1 0 1 1 0 2 1 0 3 minibatch size 1 0 - 1 1 0 0 rel. gain (sparsity=0.01) 1 0 0 1 0 1 1 0 2 1 0 3 minibatch size 1 0 - 1 1 0 0 mb-sparsity avg-sparsity Figure 2: Difference between global or instance-based computation of effecti ve minibatch sizes in the presence of sparse gradients. Our proposed method computes the number of non-zero entries ( n − z i ) in the current mini-batch to set the learning rate (green). This in volves some additional com- putation compared to just using the long-term a verage sparsity p ( nz ) i (red), but obtains a substantially higher relativ e gain (see figure 1), especially in the regime where the sparsity lev el produces mini- batches with just one or a fe w non-zero entries (dent in the curve near n = 1 /p ( nz ) i ). If the noise lev el is low (left two figures), the ef fect is much more pronounced than if the noise is higher . F or comparison, the performance for 40 different fixed learning-rate SGD settings (between 0.01 and 100) are plotted as yellow dots. 0.0 0.5 1.0 1.5 0.0 0.5 1.0 Figure 3: Illustrating the ef fect of reweighting minibatch gradients. Assume the samples are drawn from 2 different noisy clusters (yello w and light blue vectors), but one of the clusters has a higher probability of occurrence. The regular minibatch gradient is simply their arithmetic average (red), dominated by the more common cluster . The reweighted minibatch gradient (blue) does a full step tow ard each of the clusters, closely resembling the gradient one would obtain by performing a hard clustering (difficult in practice) on the samples, in dotted green. An alternative to computing z i for each minibatch (and each dimension) anew would be to just use the long-term average sparsity p ( nz ) i = E [ n − z i ] instead. Figure 2 sho ws that this is suboptimal, especially if the noise lev el is small, and in the regime where each minibatch is expected to contain just a few non-zero entries. This figure also sho ws that equation 4 produces a higher relative gain compared to the outer en velope of the performance of all fix ed learning rates. 4 ?4 ?2 0 2 4 0 1 2 3 ?4 ?2 0 2 4 0 1 2 3 Figure 4: Illustrating the expectation over non-smooth sample losses. In dotted blue, the loss func- tions for a few individual samples are sho wn, each a non-smooth function. Howe ver , the expectation ov er a distrib ution of such functions is smooth, as shown by the thick magenta curve. Left: absolute value, right: rectified linear function; samples are identical but offset by a value drawn from N (0 , 1) . 4.1 Orthogonal gradients One reason for the boost in parallelizability if the gradients are sparse comes from the fact that sparse gradients are mostly orthogonal, allo wing independent progress in each direction. But sparse gradients are in f act a special case of orthogonal gradients, for which we can obtain similar speedups with a reweighting of the minibatch gradients: ∇ θ = n X i =1 1 P n j =1 |∇ ( i ) > θ ∇ ( j ) θ | k∇ ( i ) θ k·k∇ ( j ) θ k ∇ ( i ) θ (5) In other w ords, each sample is weighted by one over the number of times (smoothed) that its gradient is interfering (non-orthogonal) with another sample’ s gradient. In the limit, this scheme simplifies to the sparse-gradient cases discussed abov e: if all sample gra- dients are aligned, they are av eraged (reweighted by 1 /n , corresponding to the dense case in equa- tion 2), and if all sample gradients are orthogonal, they are summed (re weighted by 1, corresponding to the maximally sparse case z i = n − 1 in equation 4). See Figure 3 for an illustration. In practice, this re weighting comes at a certain cost, increasing the computational expense of a single iteration from O ( nd ) to O ( n 2 d ) , where d is the problem dimension. In other w ords, it is only likely to be viable if the forward-backward passes of the gradient computation are non-trivial, or if the minibatch size is small. 5 Non-smooth losses Many commonly used non-linearities (rectified linear units, absolute v alue normalization, etc.) pro- duce non-smooth sample loss functions. Howe ver , when optimizing over a distribution of samples (or just a large enough dataset), the variability between samples can lead to a smooth expected loss function, e ven though each sample has a non-smooth contrib ution. Figure 4 illustrates this point for samples that hav e an absolute v alue or a rectified linear contribution to the loss. It is clear from this observation that it is not possible to reliably estimate the curvature of the true expected loss function, from the curv ature of the individual sample losses (which are all zero in the two examples abov e), if the sample losses are non-smooth. This means that our previous approach of estimating the h i term in the optimal learning rate expression by a moving av erage of sample curvatures, as estimated by the “bbprop” procedure [8] (which computes a Gauss-Newton approx- imation of the diagonal Hessian, at the cost of one additional backward pass) is limited to smooth sample loss functions, and we need a different approach for the general case 2 . 2 This also alleviates potential implementation effort, e.g., when using third-party software that does not implement bbprop. 5 Algorithm 1: vSGD-fd: minibatch-SGD with finite-difference-estimated adapti ve learning rates repeat draw n samples, compute the gradients ∇ ( j ) θ for each sample j compute the gradients on the same samples, with the parameters shifted by δ i = g i for i ∈ { 1 , . . . , d } do compute finite-difference curv atures h f d ( j ) i = ∇ ( j ) θ i −∇ ( j ) θ i + δ i δ i if |∇ θ i − g i | > 2 p v i − g i 2 or h f d i − h i f d > 2 r v i f d − h i f d 2 then increase memory size for outliers τ i ← τ i + 1 end update moving a verages g i ← (1 − τ − 1 i ) · g i + τ − 1 i · 1 n P n j =1 ∇ ( j ) θ i v i ← (1 − τ − 1 i ) · v i + τ − 1 i · 1 n P n j =1 ∇ ( j ) θ i 2 h i f d ← (1 − τ − 1 i ) · h i f d + τ − 1 i · 1 n P n j =1 h f d ( j ) i v i f d ← (1 − τ − 1 i ) · v i f d + τ − 1 i · 1 n P n j =1 h f d ( j ) i 2 estimate learning rate η ∗ i ← h i f d v i f d · n · ( g i ) 2 v i + ( n − 1) · ( g i ) 2 update memory size τ i ← 1 − ( g i ) 2 v i · τ i + 1 update parameter θ i ← θ i − η ∗ i · 1 n P n j =1 ∇ ( j ) θ i end until stopping criterion is met 5.1 Finite-difference curvatur e A good estimate of the rele vant curvature for our purposes (i.e., for determining a good learning rate) is to not to compute the true Hessian at the current point, but to take the e xpectation o ver noisy finite-difference steps, where those steps are on the same scale than the actually performed update steps, because this is the regime we care about. In practice, we obtain this finite-difference estimates by computing two gradients of the same sample loss, on points differing by the typical update distance 3 : h f d i = ∇ θ i − ∇ θ i + δ i δ i (6) where δ i = g i . This approach is related to the diagonal Hessian preconditioning in SGD-QN [11], but the step-dif ference used is dif ferent, and the moving average scheme there is decaying with time, which thus loses the suitability for non-stationary problems. 5.2 Curvature variability T o further increase robustness, we reuse the same intuition that originally motiv ated vSGD, and take into account the variance of the curv ature estimates (produced by the finite-difference method) to reduce the likelihood of becoming overconfident (underestimating curvature, i.e., overestimating learning rates) by using a variance-normalization based on the signal-to-noise ratio of the curvature estimates. 3 Of course, this estimate does not need to be computed at ev ery step, which can sav e computation time. 6 For this purpose we maintain two additional mo ving a verages: h i f d ← (1 − τ − 1 i ) · h i f d + τ − 1 i · h f d i v i f d ← (1 − τ − 1 i ) · v i f d + τ − 1 i · h f d i 2 and then compute the curvature term simply as h i = v i f d /h i f d . 5.3 Outlier detection If an outlier sample is encountered while the time constants τ i is close to one (i.e., the history is mostly discarded from the moving av erages at each update), this has the potential to disrupt the optimization process. Here, the statistics we keep for the adaptiv e learning rates have an additional, unforeseen benefit: they make it tri vial to detect outliers. The outlier’ s effect can be mitigated relativ ely simply by increasing the time-constant τ i before incorporating the sample into the statistics (to make sure old samples are not forgotten), and then due to the perceiv ed variance shooting up, the learning rate is automatically reduced. If it was not an outlier , but a genuine change in the data distribution, the algorithm will quickly adapt, increase the learning rates again. In practice, we use a detection threshold of tw o standard de viations, and increase the corresponding τ i by one (see pseudocode). 5.4 Algorithm Algorithm 1 giv es the explicit pseudocode for this finite-difference estimation, in combination with the minibatch size-adjusted rates from equation 3, termed “vSGD-fd”. Initialization is akin to the one of vSGD, in that all moving av erages are bootstrapped on a fe w samples (10) before any updates are done. It is also wise to add an tiny = 10 − 5 term where necessary to av oid di visions by zero. 6 Simulations An algorithm that has the ambition to work out-of-the-box, without an y tuning of hyper -parameters, must be able to pass a number of elementary tests: those may not be sufficient, but they are necessary . T o that purpose, we set up a collection of elementary (one-dimensional) stochastic optimization test cases, varying the shape of the loss function, its curv ature, and the noise level. The sample loss functions are f q uad = A · θ − ξ ( j ) 2 f abs = A · θ − ξ ( j ) f rectl in = A · ( θ − ξ ( j ) ) if θ − ξ ( j ) > 0 0 otherwise f g auss = A − Ae − ( θ − ξ ( j ) ) 2 2 where A is the curv ature setting and the ξ ( j ) are dra wn from N (0 , σ 2 ) . W e v ary curv ature and noise lev els by two orders of magnitude, i.e., A ∈ { 0 . 1 , 1 , 10 } and σ 2 ∈ { 0 . 1 , 1 , 10 } , giving us 9x4 test cases. T o visualize the large number of results, we summarize the each test case and algorithm combination in a concise heatmap square (see Figure 5 for the full explanation). In Figure 6, we sho w the results for all test cases on a range of algorithms and minibatch sizes n . Each square shows the gain in loss for 100 independent runs of 1024 updates each. Each group of columns corresponds to one of the four functions, with the 9 inner columns using dif ferent curv ature and noise lev el settings. Color scales are identical for all heatmaps within a column, but not across columns. Each group of rows corresponds to one algorithm, with each row using a different hyper - parameter setting, namely initial learning rates η 0 ∈ { 0 . 01 , 0 . 1 , 1 , 10 } (for SGD, A DA G R A D [6] and the natural gradient [7]) and decay rate γ ∈ { 0 , 1 } for SGD. All rows come in pairs, with the upper one using pure SGD ( n = 1 ) and the lo wer one using minibatches ( n = 10 ). 7 1 0 0 1 0 1 1 0 2 1 0 3 iterations 1 0 - 4 1 0 - 3 1 0 - 2 1 0 - 1 1 0 0 loss SGD vSGD oracle SGD vSGD oracle Figure 5: Explanation of how to read our concise heatmap performance plots (right), based on the more common representation as learning curves (left). In the learning curve representation, we plot one curve for each algorithm and each trial (3x8 total), with a unique color/line-type per algorithm, and the mean performance per algorithm with more contrast. Performance is measured ev ery po wer of 2 iterations. This gi ves a good idea of the progress, b ut becomes quickly hard to read. On the right side, we plot the identical data in heatmap format. Each square corresponds to one algorithm, the horizontal axis are still the iterations (on log 2 scale), and on the vertical axis we arrange (sort) the performance of the different trials at the giv en iteration. The color scale is as follows: white is the initial loss value, the stronger the blue, the lower the loss, and if the color is reddish, the algorithm ov erjumped to loss v alues that are bigger than the initial one. Good algorithm performance is visible when the square becomes blue on the right side, instability is marked in red, and the variability of the algorithm across trials is visible by the color range on the vertical axis. The findings are clear: in contrast to the other algorithms tested, vSGD-fd does not require any hyper-parameter tuning to give reliably good performance on the broad range of tests: the learning rates adapt automatically to different curvatures and noise le vels. And in contrast to the predecessor vSGD, it also deals with non-smooth loss functions appropriately . The learning rates are adjusted automatically according to the minibatch size, which improves con vergence speed on the noisier test cases (3 left columns), where there is a larger potential gain from minibatches. The earlier variant (vSGD) was sho wn to work very robustly on a broad range of real-world bench- marks and non-con vex, deep neural network-based loss functions. W e expect those results on smooth losses to transfer directly to vSGD-fd. This bodes well for future work that will determine its per- formance on real-world non-smooth problems. 7 Conclusion W e have presented a novel variant of SGD with adaptive learning rates that expands on previous work in three directions. The adaptiv e rates properly take into account the minibatch size, which in combination with sparse gradients drastically alleviates the diminishing returns of parallelization. Also, the curv ature estimation procedure is based on a finite-difference approach that can deal with non-smooth sample loss functions. The final algorithm integrates these components, has linear complexity and is hyper-parameter free. Unlike other adaptiv e schemes, it works on a broad range of elementary test cases, the necessary condition for an out-of-the-box method. Future work will in vestigate ho w to adjust the presented element-wise approach to highly non- separable problems (tightly correlated gradient dimensions), potentially relying on a low-rank or block-decomposed estimate of the gradient cov ariance matrix, as in TONGA [12]. 8 Acknowledgments The authors want to thank Sixin Zhang, Durk Kingma, Daan W ierstra, Camille Couprie, Cl ´ ement Farabet and Arthur Szlam for helpful discussions. W e also thank the re viewers for helpful sugges- tions, and the ‘Open Revie wing Network’ for perfectly managing the novel open and transparent revie wing process. This work was funded in part through AFR postdoc grant number 2915104, of the National Research Fund Luxembour g. References [1] Schaul, T , Zhang, S, and LeCun, Y . No More Pesky Learning Rates. T echnical report, June 2012. [2] Jacobs, R. A. Increased rates of conv ergence through learning rate adaptation. Neural Net- works , 1(4):295–307, January 1988. [3] Almeida, L and Langlois, T . Parameter adaptation in stochastic optimization. On-line learning in neural . . . , 1999. [4] George, A. P and Powell, W . B. Adaptiv e stepsizes for recursiv e estimation with applications in approximate dynamic programming. Machine Learning , 65(1):167–198, May 2006. [5] Nicolas Le Roux, A. F . A fast natural Newton method. [6] Duchi, J. C, Hazan, E, and Singer , Y . Adaptive subgradient methods for online learning and stochastic optimization. 2010. [7] Amari, S, Park, H, and Fukumizu, K. Adapti ve method of realizing natural gradient learning for multilayer perceptrons. Neural Computation , 12(6):1399–1409, 2000. [8] LeCun, Y , Bottou, L, Orr , G, and Muller , K. Efficient backprop. In Orr , G and K., M, editors, Neural Networks: T ricks of the trade . Springer , 1998. [9] Byrd, R, Chin, G, Nocedal, J, and W u, Y . Sample size selection in optimization methods for machine learning. Mathematical Pro gramming , 2012. [10] Niu, F , Recht, B, Re, C, and Wright, S. J. Hogwild!: A lock-free approach to parallelizing stochastic gradient descent. Matrix , (1):21, 2011. [11] Bordes, A, Bottou, L, and Gallinari, P . Sgd-qn: Careful quasi-ne wton stochastic gradient descent. Journal of Machine Learning Resear ch , 10:1737–1754, July 2009. [12] Le Roux, N, Manzagol, P , and Bengio, Y . T opmoumoute online natural gradient algorithm, 2008. 9 quad abs rectlin gauss SGD NaturalGrad AdaGrad vSGD vSGD-fd Figure 6: Performance comparisons for a number of algorithms (row groups) under different setting variants (ro ws) and sample loss functions (columns), the latter grouped by loss function shape. Red tones indicate a loss v alue worsening from its initial value, white corresponds to no progress, and darker blue tones indicate a reduction of loss (in log-scale). For a detailed explanation of ho w to read the heatmaps, see Figure 5. The new proposed algorithm vSGD-fd (bottom row group) performs well across all functions and noise-le vel settings, namely fixing the vSGD instability on non-smooth functions like the absolute v alue. The other algorithms need to ha ve their hyper-parameters tuned to the task to work well. 10
Original Paper
Loading high-quality paper...
Comments & Academic Discussion
Loading comments...
Leave a Comment