Sparse Penalty in Deep Belief Networks: Using the Mixed Norm Constraint
Deep Belief Networks (DBN) have been successfully applied on popular machine learning tasks. Specifically, when applied on hand-written digit recognition, DBNs have achieved approximate accuracy rates of 98.8%. In an effort to optimize the data repre…
Authors: Xanadu Halkias, Sebastien Paris, Herve Glotin
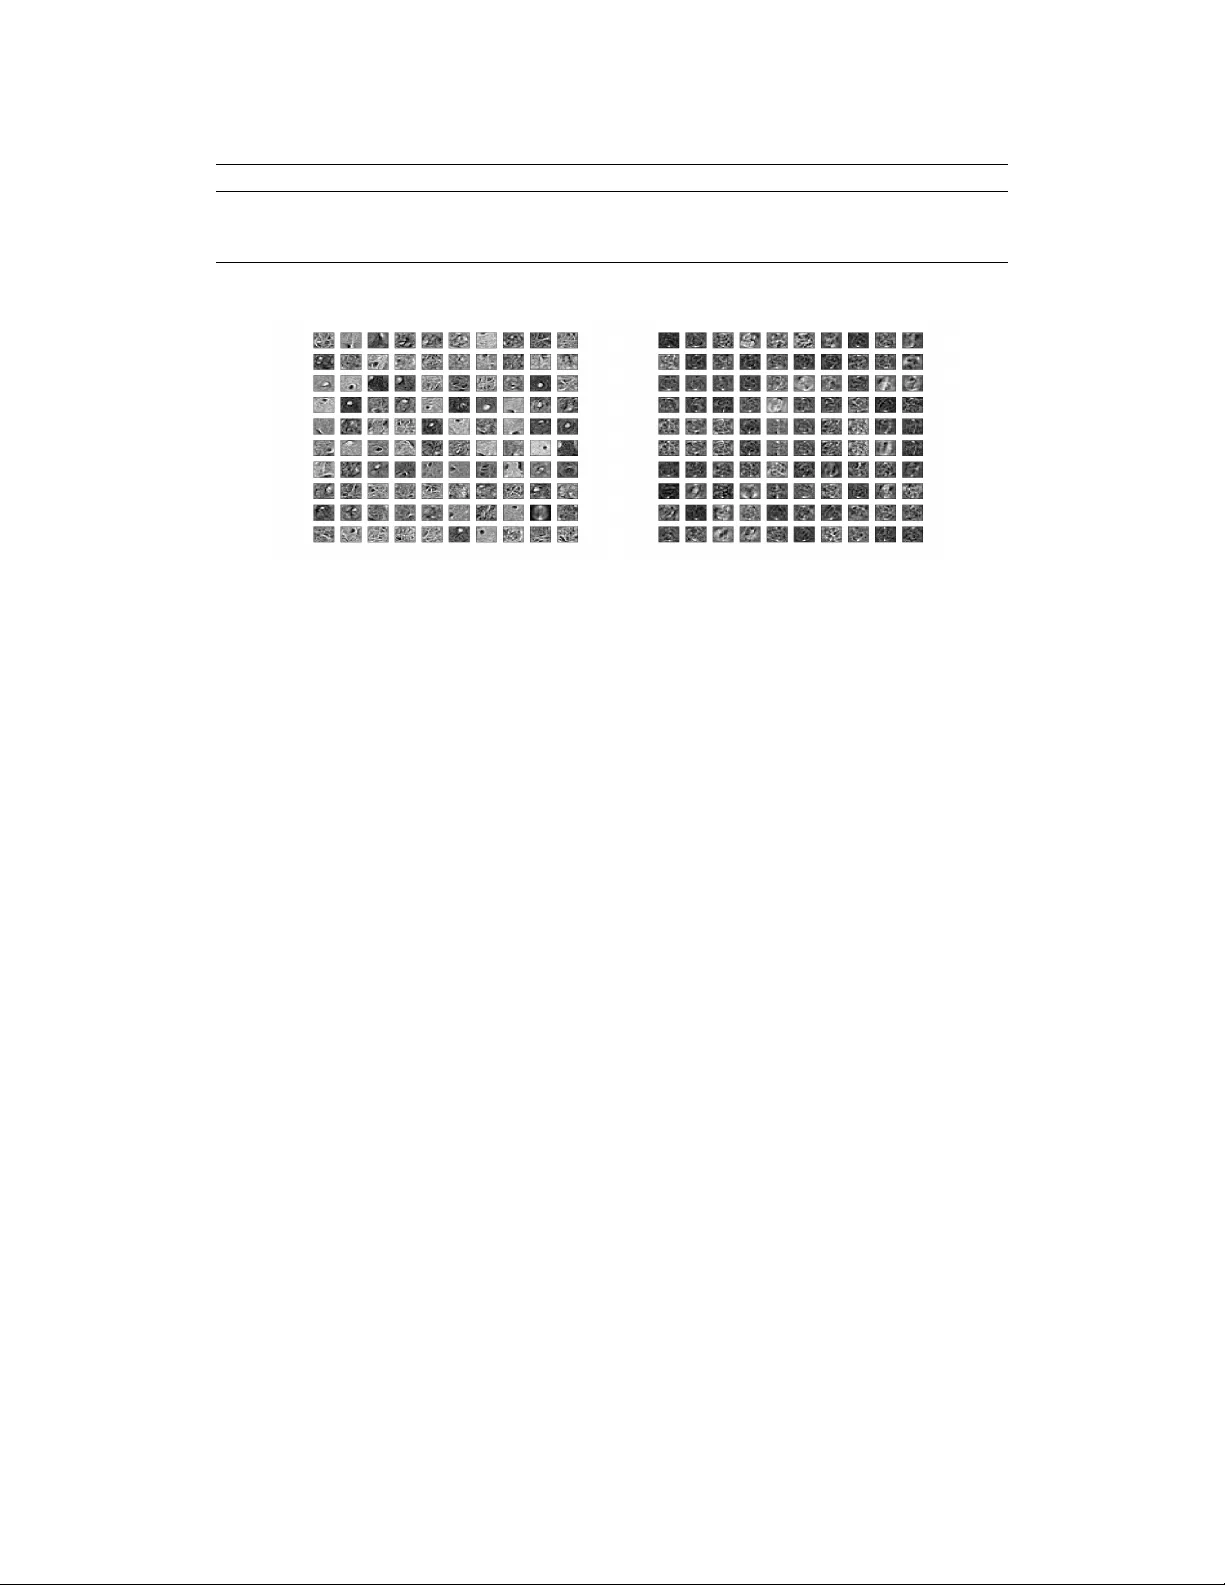
Sparse P enalty in Deep Belief Networks: Using the Mixed Norm Constraint Xanadu C. Halkias D YNI, LSIS, Uni v ersit ` e du Sud, A venue de l’Uni versit ´ e - BP20132, 83957 LA GARDE CEDEX - FRANCE xanadu.halkias@univ-tln.fr S ´ ebastien Paris D YNI, LSIS CNRS UMR 7296, Aix-Marseille University Domaine uni v ersitaire de Saint J ´ er ˆ ome A venue Escadrille Normandie Niemen,13397 MARSEILLE Cede x 20, FRANCE sebastien.paris@lsis.org Herv ´ e Glotin D YNI, LSIS CNRS UMR 7296, Universit ´ e Sud T oulon-V ar , Institut Uni versitaire de France A venue de l’Uni versit ´ e - BP20132, 83957 LA GARDE CEDEX - FRANCE glotin@univ-tln.fr Abstract Deep Belief Networks (DBN) have been successfully applied on popular ma- chine learning tasks. Specifically , when applied on hand-written digit recogni- tion, DBNs ha ve achiev ed approximate accuracy rates of 98 . 8% . In an effort to optimize the data representation achie ved by the DBN and maximize their descrip- tiv e power , recent adv ances have focused on inducing sparse constraints at each layer of the DBN. In this paper we present a theoretical approach for sparse con- straints in the DBN using the mixed norm for both non-o verlapping and o verlap- ping groups. W e explore ho w these constraints affect the classification accurac y for digit recognition in three different datasets (MNIST , USPS, RIMES) and pro- vide initial estimations of their usefulness by altering different parameters such as the group size and ov erlap percentage. 1 Introduction Restricted Boltzmann Machines (RBMs) are Ener gy Based Models (EBMs) that hav e been exten- siv ely used for a div erse set of machine learning applications mainly due to their generative and unsupervised learning frame work. These applications range from image scene recognition and gen- eration [ ? ], video-sequence recognition [ ? ] and dimensionality reduction [ ? ]. An equally important aspect of RBMs is that they serve as the building blocks of DBNs [ ? ]. Their use as such has been fav ored in the machine learning community due to the conditional independence between the hidden units in the RBM that allows for the ef ficient and computationally tractable implementation of deep architectures. In recent years, sparsity has become an important requirement in both shallow [add cite] and deep architectures. Although primarily used in statistics for optimization tasks in order to overcome the curse of dimensionality in various applications, it also serves as a way to emulate biologically plausible models of the human visual cortex, where it has been sho wn that sparsity is an integral process in the hierarchical processing of visual information [ ? ? ? ]. 1 Moreov er , an added benefit of using sparse constraints in the form of mixed norm regularizers in deep architectures is that they can alle viate their restrictiv e nature by allowing implicit interactions between the hidden units in the RBMs. Mixed norm regularizers such as l 1 , 2 hav e been extensiv ely used in statistics and machine learning [ ? ]. In this paper we provide initial results when inducing sparse constraints by using a mixed norm regularizer on the activ ation probabilities of the RBMs. The mix ed norm is applied on both non-overlapping and ov erlapping groups. W e also sho w that this regularizer can be used to train DBNs, and of fer results for the task of digit recognition using several datasets. 2 Restricted Boltzmann Machines An RBM is a type of two layer neural network comprised of a visible layer that represents the observed data x and a hidden layer that represents the hidden variables h . The addition of these hidden units allo ws the model an increased capacity in expressing the underlying distrib ution of the observed data. RBMs are ener gy based models and as such the y define a probability distribution through an energy function as seen in Eq. 1 p ( x , h ) = e − E ( x , h ) Z (1) Where Z , provided in Eq. 2, is called the partition function and is a normalizing factor ensuring that Eq. 1 is a probability . Z = X x , h e − E ( x , h ) (2) In the case of an RBM the energy function E ( x , h ) is defined in Eq. 3: E θ ( x , h ) = − I X i =1 J X j =1 x i h j w ij − I X i =1 b i x i − J X j =1 a j h j , (3) b are the visible unit biases and a are the hidden unit biases. In the common case where we are using stochastic binary units for both visible and hidden units, then the conditional probabilities of activ ation are obtained by: p ( x i = 1 | h ) = σ ( b i + P j h j w ij ) p ( h j = 1 | x ) = σ ( a j + P i x i w ij ) , (4) where σ is the sigmoid function and σ ( f ( x )) , 1 1 + e − f ( x ) . (5) Since an RBM does not allo w for connections amongst hidden units or amongst visible units we can easily obtain Eq. 6. p ( x | h ) = Q i p ( x i | h ) p ( h | x ) = Q j p ( h j | x ) (6) Intuitiv ely , the observed data, x will be modeled by those hidden units, h that are expressed with a high conditional probability p ( h j | x ) . The goal of adding sparse constraints to the network is to allow for the salient acti v ation of the hidden units based on the differences of the observed data. As a result, we can achie ve an initial clustering of the observed data that will increase the discriminativ e power of the model. 2.1 T raining an RBM RBMs are energy based, generative models that are trained to model the marginal probability p ( x ) of the observed data where: p ( x ) = X h ∈{ 0 , 1 } J p ( x , h ) . (7) 2 In general, ener gy based models can be learnt by performing gradient descent on the neg ativ e log- likelihood of the observed data. Specifically , to learn the parameters of the network we need to compute the gradient provided in Eq. 8 gi ven the observ ed (training) data x l . − ∂ l og p ( x ) ∂ θ = h ∂ E θ ( x l , h ) ∂ θ i h − h ∂ E θ ( x , h ) ∂ θ i x , h , (8) where h·i n denotes the expectation with respect to n . As evident in Eq.8, the gradient has two phases. The positi ve phase which tries to lower the energy of the training data x l and the negati ve phase which tries to increase the energy of all x in the model. Assessing the energy on all the data can be an intractable task given the size of the network and the number of possible configurations. In order to obtain an approximation Hinton (2006) successfully proposed the use of Contrastiv e Di ver gence (CD). This allows us to sample an approximation of the expectation ov er ( x , h ) using Gibbs sampling at only k steps. Empirically , it has been shown that setting k = 1 will provide an adequate approximation although it will not follow the theoretical gradient [ ? ]. Applying CD on Eq. 8 we can obtain the following update equations for the parameters of the network. ∆ w · j = 1 L L P l =1 x l p ( h j = 1 | x l ) − e x l p ( h j = 1 | e x l ) (9) ∆ b i = 1 L L P l =1 p ( x l i = 1 | h ) − p ( e x l i = 1 | h ) (10) ∆ a j = 1 L L P l =1 p ( h j = 1 | x l ) − p ( h j = 1 | e x l ) , (11) where the ( e · ) defines the generated distributions obtained by the CD. In the next section, we introduce a general version of sparse constraints in the learning phase of the RBM through the use of the mixed norm in an ef fort to control the activ ation probabilities of the hidden units. 3 Mixed Norm RBMs Sev eral attempts in inducing sparse constraints in the RBM by [ ? ? ] have been successful in increasing the discriminati ve po wer of the models. Examples of these sparse constraints range from weight decay [ ? ] to modified norm penalties [ ? ]. In this paper we focus on the generalized penalty of the mixed norm ( l 1 , 2 ), b ut will also provide a theoretical and practical implementation for the use of ov erlapping groups. W e will refer to this generalized penalty applied to the expectations of the activ ation probabilities as the Mixed Norm RBM (MNRBM). As mentioned before, learning an RBM consists of performing gradient descent on the negati v e log-likelihood. W e can thus define the cost function L to be minimized as L = − l ogp ( x ) . When applying the mixed norm re gularizer the cost function takes the general form of Eq. 12. L = − log p ( x ) + λ ( k p ( h = 1 | x ) k 1 , 2 ) (12) Where λ is a regularizer constant. The second term of Eq. 12 defines the mixed norm penalty on the expectations of the hidden unit activ ation probabilities. In order to apply the mixed norm we assume that the hidden units are di vided into groups. These groups can be non-overlapping or ov erlapping. As a result, we are able to penalize a whole group and not just indi vidual hidden units. MNRBM with non-o verlapping gr oups: Giv en an RBM with J hidden units we define a partition of the hidden units into groups P m where m = 1 , 2 , ...M . The groups are non-overlapping and of equal size to alle viate computational issues. The mix ed norm penalty for a data sample x l is defined in Eq. 14. k p ( h = 1 | x l ) k 1 , 2 = M P m =1 k p ( P m | x l ) k 2 = M P m =1 r P k ∈ P m p ( h k = 1 | x l ) 2 (13) 3 In practice, the desire behind the application of the mixed norm penalty is to set groups of the hidden units to zero when representing the observed data by forcing their activ ation probabilities to zero. As a result, gi ven an observed data sample only a small number of groups of hidden units will be activ ated, leading to its sparse representation. MNRBM with ov erlapping groups: Gi ven an RBM with J hidden units we define a partition of the hidden units into groups P m where m = 1 , 2 , ...M . The groups are overlapping and of equal size. Depending on the percentage of overlap, a we will obtain a ne w set of groups P 0 k where k = 1 , 2 , ...K . W e can then define a set of augmented hidden units J 0 = { h 0 ∈ J : ∀ P k , P k S P m = P m , J 0 ⊃ J } . Subsequently , giv en an RBM with J 0 hidden units, we can then consider that the set P 0 k , defines non-ov erlapping, equally sized groups [ ? ]. The mix ed norm penalty for a data sample x l is defined in a similar way as in Eq. 14. k p ( h 0 = 1 | x l ) k 1 , 2 = K P k =1 k p ( h 0 m | x l ) k 2 = K P k =1 r P k ∈ P 0 k p ( h 0 k = 1 | x l ) 2 (14) 3.1 T raining the Mixed Norm RBM In order to train the MNRBM with non-o verlapping groups and obtain the model parameters θ we need to minimize the cost function presented in Eq. 12. This can be achieved by performing a coordinate descent once we hav e obtained the gradients of the regularizers. The gradient of the mixed norm penalty for the weights, W is as follows: ∂ ∂ w · j ( k p ( h = 1 | x l ) k 1 , 2 ) = = 1 2 · 1 s P k ∈ P m p ( h k =1 | x l ) 2 · 2 · p ( h k = 1 | x l ) · ∂ p ( h k =1 | x l ) ∂ w · j = p ( h k =1 | x l ) k p ( h m | x l ) k 2 · ∂ p ( h k =1 | x l ) ∂ w · j = p ( h k =1 | x l ) k p ( h m | x l ) k 2 · p ( h k = 1 | x l )[1 − p ( h k = 1 | x l )] · x l = p ( h k =1 | x l ) 2 k p ( h m | x l ) k 2 · p ( h k = 0 | x l ) · x l . (15) When applied on the expectations of the activ ation probabilities the mixed norm penalty will follow their trend while forcing the groups that include members with lo w activ ation probabilities towards zero. The l 2 norm in the denominator ensures that the groups with low activ ations will be pushed further closer to zero. Giv en the gradients of the penalties the update equations for the MNRBM are presented bello w: ∆ w · j = 1 L L P l =1 [( p ( h j = 1 | x l ) + λ p ( h j =1 | x l ) p ( h j =0 | x l ) r P p ( h m =1 | x l ) 2 ) · x l − p ( h j = 1 | e x l ) e x l ] (16) ∆ a j = 1 L L P l =1 [( p ( h j = 1 | x l ) + λ p ( h j =1 | x l ) p ( h j =0 | x l ) r P p ( h m =1 | x l ) 2 − p ( h j = 1 | e x l )] (17) The detailed steps for training the MNRBM are depicted in Algorithm 1. The general penalty of Eq. 12 allows us through the manipulation of the constant regularizer , λ , the group size and percentage of o verlap to obtain different types of architectures. In this case, the sparsity is induced at the group lev el of the hidden units whereby the observed data is represented by a small number of groups of hidden units. The λ constant is empirically determined [ ? ] based on the task at hand. 4 Algorithm 1 Mixed Norm RBM learning algorithm 1 . Update the parameters θ using CD and Eq. 9- 11 2 . Update the parameters again using the gradient of the regularizations as in Eq. 16- 17 3 . Repeat steps 1 , 2 until con vergence (a) Mixed norm RBM non-overlapping groups (group size = 20) (b) Mix ed norm RBM ov erlapping groups (group size = 50, ov erlap = 20%) Figure 1: Sample learned weights W for the mixed norm RBM using the USPS data set Fig. 1 sho ws sample weights for the mixed norm RBM when using λ = 0 . 1 for both non-overlapping and overlapping groups. Fig 2 pro vides the a verage probability activ ations for the hidden units gi ven a batch of the USPS training data. As seen in the figure, the acti vation probabilities of the hidden units appear to be more towards the left-hand side of the figure which is the desired effect. Ho wev er , there appears to be a bimodality whereby a large proportion of the activ ation probabilities is set to a high v alue for the non-o verlapping groups MNRBM. This may be attributed to the choice and size of groups when applying the mix ed norm penalty . Giv en that the acti vation probabilities are pushed tow ards high v alues one can expect that such a process may hav e an adverse result for classification tasks since the hidden units will over -represent the observed data. Ho we ver , in the case of the ov erlapping groups most of the acti vations are pushed towards zero. Although, that is the goal of adding sparse constraints is to force the activ ations to zero, in this case we may be dealing with a biased system that actually under represents the data distribution. 3.2 Data W e ha ve used three dif ferent data sets in order to train and test the network. • MNIST is a popular data set in the community for hand-written digit recognition and is comprised of 70000 , 28 × 28 images ( 60000 train - 10000 test). It is publicly av ailable at yann.lecun.com/exdb/mnist . • The RIMES data set which was created by asking v olunteers to write hand written letters for different scenarios. In this paper we used the digit set of the data base. In total the set we used was comprised of 37200 images of different sizes ( 29800 train - 7400 test). Further information can be obtained at www .rimes-database.fr . • The USPS digit data set that we used is comprised of 9280 ( 7280 train - 2000 test), 16 × 16 images. The extracted images were scanned from mail in working U.S. Post Of fices [ ? ]. In order to achie ve the cross-training and testing all images were resized to hav e the same size as the MNIST dataset ( 28 × 28 ) given its extensi ve use in this task. All images were also checked to ensure that orientations/translations were uniform across the data sets. No other pre-processing w as employed. Example images from the three datasets can be seen in figure 3 5 (a) Mixed norm RBM non-overlapping groups (group size = 20) (b) Mix ed norm RBM ov erlapping groups (group size = 50, ov erlap = 20%) Figure 2: A verage of hidden unit acti vation probabilities for the mixed norm RBM using a batch of the USPS data set. Y -axis: Hidden unit activ ation probabilities for mixed norm RBM. X-axis: Hidden unit activ ations for vanilla RBM Figure 3: Examples of images from the three datasets MNIST (left), RIMES (center) and USPS (right) 3.3 Experimental Results: Pre-training DBNs with MNBMs RBMs became increasingly popular when Hinton and Salakhudinov [ ? ] [ ? ] used them as building blocks for creating and pre-training ef ficient DBNs. The proposed MNRBMs can be utilized in the same manner to initialize DBNs and obtain a sparse and computationally efficient representation of the observed data. In order to of fer a comparati v e vie w between the dif ferent architectures we used Hinton’ s model for digit recognition, b ut we substituted the v anilla RBM with the proposed MNRBM. W e pre-trained a 500 − 500 − 2000 DBN and tested it on three dif ferent data sets, MNIST , RIMES and USPS. Continuing, to obtain classification error rates we added 10 softmax layers to get the posterior prob- abilities for the different classes. The network was fine-tuned using conjugate gradient as described in [ ? ]. The constant regularizer was empirically set to λ = 0 . 1 for all different models [ ? ]. Continuing, for the mixed norm architecture with non-overlapping groups we used dif ferent group sizes for the hidden units, 5 , 10 , 20 and 100 respecti vely . In the case of o verlapping groups we used group sizes of 20 , and 50 with a = { 20% , 50% } . Results on the classification accuracy and the computational cost of the models can be seen in T able 1 and T able 2 respectively . All experiments were performed on a 24 core server (AMD Opteron processor 8435 ) with a core CPU of 2 . 6 GHz and a cache of 512 KB. 6 (a) A verage Probability density function for activ ation probabilities, p ( h = 1 | x ) (b) Classification Accuracy for the differ- ent penalties using the USPS data set Figure 4: A verage log pdf for activ ation probabilities for the v anilla RBM and mixed norm RBM using a batch of the USPS data set and classification accuracy for the USPS data set using the different architectures T able 1: Classification accuracies for the dif ferent architectures based on the general sparse penalty . A R C H I T E C T U R E M N I S T R I M E S U P S D B N 98 . 83 % 9 9 . 3 0 % 94 . 85 % M N DB N ( 5 ) 9 7 . 2 8 % 99 . 2 4 % 9 2 . 9 0 % M N DB N ( 1 0 ) 98 . 83 % 9 9 . 3 3 % 9 4 . 7 0 % M N DB N ( 2 0 ) 9 8 . 7 7 % 9 9 . 3 8 % 9 4 . 6 5 % M N DB N ( 1 0 0 ) 9 8 . 8 0 % 99 . 40 % 9 4 . 3 5 % M N W / O D B N ( 2 0 / 2 0 % ) 95 . 1 0 % 9 5 . 7 0 % 8 5 . 0 5 % M N W / O D B N ( 2 0 / 5 0 % ) 93 . 5 0 % 9 3 . 6 2 % 8 0 . 9 0 % M N W / O D B N ( 5 0 / 2 0 % ) 96 . 5 0 % 9 7 . 6 0 % 9 2 . 9 5 % M N W / O D B N ( 5 0 / 5 0 % ) 95 . 8 4 % 9 6 . 2 7 % 9 1 . 3 5 % From T able 1 we can infer that our proposed mixed norm penalty can of fer the flexibility of creating architectures that will be able to matchthe classification accuracy of the models depending on the underlying distributions. It appears that for the task of hand-written digit recognition the distribu- tion of the observed data fav ors the use of larger non-overlapping group sizes for the mixed norm architectures. In order to get a better understanding of the impact of the dif ferent sparse constraints and architec- tures, Figure 4 depicts the a verage probability density functions of the expectations of the activ ation probabilities for the MNIST training data. It is interesting to note that the proposed architectures that utilize the mixed norm penalty (MNDBN)with the overlapping groups tend to aggressively push their acti vation probabilities to zero. Howe ver , these architectures also tend to offer lower accurac y rates which can be attributed to an inability of the models to concisely capture the underlying data. A possible w ay for exploring this phenomenon further may be to constrain the penalty of the expectations as seen in [ ? ]. 3.4 Conclusions In this work we provided some first insights for the use of the mixed norm sparse constraint in DBNs. W e performed experiments using three different data sets for the task of hand written digit recognition and of fered a practical approach for the use of o verlapping groups with the mix ed norm constraint. Although, our initial e xperiments were limited in the use of equal size ov erlapping groups, one could easily extended to non-symmetric overlapping groups, using a similar methodol- ogy . Inducing sparse constraints based on specific geometries may also pro vide better results in the case of digit recognition and offer more interesting results for tasks such as scene cate gorization. 7 T able 2: CPU times for the different architectures based on the general sparse penalty . A R C H I T E C T U R E M N I S T R I M E S U P S D B N 1 6 7 . 9 0 H > 6 0 H 3 1 . 1 5 H M N DB N ( 5 ) 6 2 . 1 4 H 3 3 . 7 0 H 8 . 6 2 H M N DB N ( 1 0 ) 6 6 . 1 0 H 4 0 . 7 0 H 1 0 . 0 0 H M N DB N ( 2 0 ) 7 0 . 1 0 H 6 9 . 8 0 H 1 2 . 7 5 H M N DB N ( 1 0 0 ) 7 1 . 5 0 H 8 5 . 8 0 H 1 5 . 8 5 H M N W / O D B N ( 2 0 / 2 0 % ) > 6 0 H 3 9 . 2 7 H 1 0 . 4 0 H M N W / O D B N ( 2 0 / 5 0 % ) > 6 0 H > 4 5 H 2 2 . 9 0 H M N W / O D B N ( 5 0 / 2 0 % ) > 6 0 H 3 5 . 6 0 H 9 . 5 6 H M N W / O D B N ( 5 0 / 5 0 % ) > 7 0 H > 4 5 H 2 4 . 0 0 H 8
Original Paper
Loading high-quality paper...
Comments & Academic Discussion
Loading comments...
Leave a Comment