Bayesian Network Structure Learning with Permutation Tests
In literature there are several studies on the performance of Bayesian network structure learning algorithms. The focus of these studies is almost always the heuristics the learning algorithms are based on, i.e. the maximisation algorithms (in score-…
Authors: Marco Scutari, Adriana Brogini
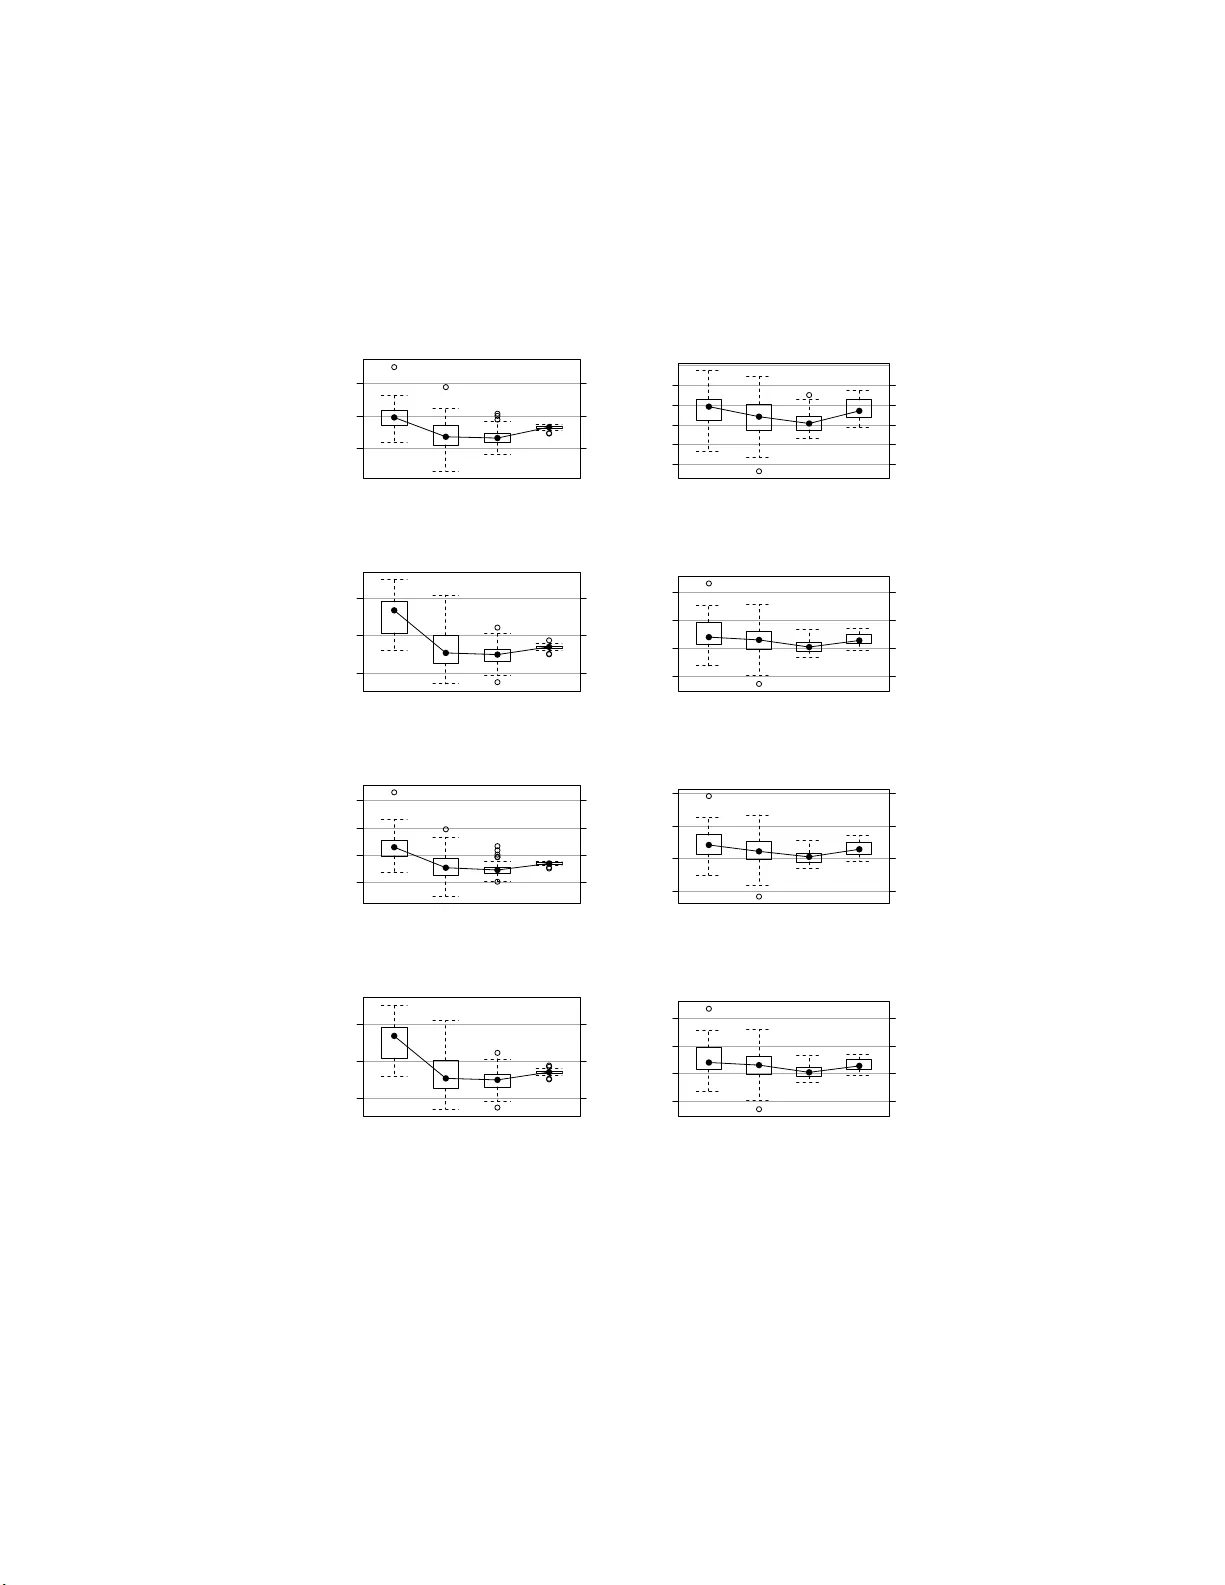
Ba y esian Net w ork Structure Learning with P erm utation T ests Marco Scutari ∗ and Adriana Brogini Departmen t of Statistical Sciences, Univ ersit y o f P ado v a, Italy ∗ Corresp onding Author: m.scutari@ucl.ac.uk Octob er 30, 2018 Abstract In literature there are s everal studies on the p erformance of Ba yesian netw ork structure learning algorithms. The focus of these studies is al- most alw ays the heuristics th e learning algorithms are based on, i. e. the maximisation alg orithms (in s core-based algorithms) or the t echniques for learning the d ep endencies of ea ch v ariable (in constrain t-b ased algo - rithms). I n this p ap er we inv estigate how the u se of p ermutation tests instead of p arametric ones affects the p erformance of Bay esian n etw ork structure learning from discrete data. Shrink age tests are also cov ered to provide a broad ov erview of the techniques develo p ed in current literature. Keywords: Ba yesian netw orks, conditional indep enden ce tests, per- mutatio n tests, shrink age tests. 1 In tro duc tion and Backg round Bay esian netw or ks are a class o f gr a phic al mo dels , whic h allow a n int uitive repre- sentation of the proba bilistic structure of multiv ariate data using gra phs ( Pearl , 1988 ; Ko ller and F riedman , 2009 ). They are comp osed by t wo parts: • a set o f r andom v aria bles X = { X 1 , X 2 , . . . , X p } describing the features of the data. The pro bability dis tr ibution of X is ca lled the glob al distribution of the data, while the ones as so ciated with ea ch X i ∈ X are ca lled lo c al distributions . • a dir e ct e d acyclic gr aph (DA G), denoted G = ( V , A ). Each node v ∈ V is ass o ciated with o ne v ariable X i , and they are often re ferred to in ter- changeably . The directed arc s a ∈ A that connect them repr esent direct This is a preprin t of an article whose final and definitive form has been publis hed in the Communications in Statistics – Theory and M ethods ( 2012 T aylor & F rancis Group, LLC); Commun ications in Statistics – Theory and Methods is av ailable online at: www.tandfonline.com/10.1080/0 3610926.2011.59328 4. 1 sto chastic dep endencies; so if ther e is no ar c connecting t wo no des, the corres p o nding v aria bles a re either marg inally indep e ndent or conditionally independent g iven a subset o f the remaining v ar iables. In other words, ea ch lo cal distribution is asso c ia ted with a single no de X i and depe nds only on its parents (i.e. the no des X j in X such that X j → X i , usually denoted b y Π X i ). This prop er ty , which is known as the Ma rkov pr op erty of Bay esian net works ( Pearl , 198 8 ), specifies the for m of the decompositio n o f the global distribution in to the lo c a l ones: P ( X ) = p Y i =1 P ( X i | Π X i ) . (1) In principle ther e are many p ossible choices for b oth the global and the lo cal distribution functions, dep ending on the na ture of the data a nd the aims o f the analysis. How ever, literature hav e fo cused mo s tly on tw o cases: the discr ete c ase ( Heck erman et al. , 1995 ), in which both the globa l and the lo cal distribu- tions a re m ultinomial r andom v ariables, a nd the c ontinuous c ase ( Geiger and Heck erman , 1 994 ), in whic h the global distribution is m ultiv ar iate normal and the lo cal distr ibutions a r e univ ariate normal rando m v a riables. In the fir st case, the pa rameters of in terest are the c onditional pr ob abilities asso ciated with each v a riable, usually represented as c onditional pr ob ability tables (CPTs); in the latter, the par ameters of interest ar e the p artial c orr elation c o efficients b etw een each v ariable and its pa rents. The task of fitting a Bay esian netw ork is called le arning , a term b orrowed from exp ert s y stems theory and artificial int elligence , and in gener al is imple- men ted in tw o steps. The first step co nsists in finding the gra ph structure that enco des the con- ditional indep endencies presen t in the data. Ideally it sho uld coincide with the depe ndence structure of the globa l distribution, o r it s hould at least identify a distr ibution as close as p o ssible to the corr ect o ne in the proba bility space. This step is c alled network structur e o r simply s t ructur e le arning ( Korb and Nic hols o n , 20 04 ; Ko ller and F riedman , 2009 ), and is similar in approa ches and terminology to mo de l selection procedur es for classical statistical models. Sev- eral algorithms hav e been presen ted in literature for this problem, tha nk s to the applicatio n of man y results from probabilit y , infor mation and optimisation theory . Despite the (sometimes confusing) v ariety of theoretical ba ckgrounds and terminolo gy they can all b e traced to only three a pproaches: c onstr aint- b ase d (which a re based on conditiona l independence tests), sc or e- b ase d (which are bas ed on g o o dness-o f-fit scores ) and hybrid (which combine the previous tw o approaches). The second step is called p ar ameter le arning and, as the name suggests, deals with the estimation o f the parameter s of the g lobal distribution. Assuming the graph structur e is known fro m the previo us step, this ca n b e done efficiently by estimating the pa rameters of the local distributions. In literature there ar e several studies o n the p erfo rmance of Bay esian net- work structure lear ning algor ithms; one of the most extensive per formed in 2 recent years is presented in Tsamardinos et al. ( 200 6 ). The fo c us of these stud- ies is almos t alwa ys the heuristics the learning algorithms are based on, i.e. the maximisa tion algorithms used in sco re-base d algor ithms or the techniques for lea rning the dep endence structur e as so ciated with ea ch node in constraint- based algo rithms. The influence o f the o ther comp onents of the ov erall lear ning strategy , such as the conditional independence tests (and the as so ciated type I error threshold) or the ne tw or k scor es (a nd the associa ted par ameters, s uch as the equiv alent sample size), is usually not in vestigated. How ever, limiting suc h studies to the p erfo r mance of heuristics pos es serio us doubts on their conclu- sions, b ecaus e the decisio ns made by the heuristics ar e based on the v alues o f the s tatistical cr iteria they use to extract information from the data . Therefore, it is imp ortant to c ho ose a conditiona l indep endence test or a netw ork score presenting a goo d b ehaviour for the data at hand a nd to tune it a ppropriately . F or this reason, in this pap er w e will in vestigate the behaviour of p er mu ta- tion conditional indep endence tes ts and tests based on s hr ink age estimator s for discrete da ta. These tw o classes of tests ar e usually not considere d in liter ature, where the asy mpto tic χ 2 tests based on P earso n’s X 2 ( Bishop et al. , 2 007 ) and m utual information ( Kullback , 1968 ) are the de facto standard. In particular, we will study the p ermutation P ear son’s X 2 test and the p er mut ation m utual information test describ ed in Edwards ( 2000 ), and the shrink ag e test ba s ed on the estimator for the m utual information presented in Hausse r a nd Strimmer ( 2009 ). 2 Conditional Indep endenc e T e sts W e will now introduce the conditiona l indep endence tests whose per formance will b e cons idered in Section 3 . Since we are limiting our selves to discr ete data, b oth the globa l and the lo cal distributions are assumed to b e multino- mial, and the latter a re repres ented as conditional pro bability tables. Condi- tional indep endence tests and net work score s for discrete data a re f unctions of these conditional proba bilit y tables through the observ ed frequencies { n ij k , i = 1 , . . . , R, j = 1 , . . . , C, k = 1 , . . . , L } for the ra ndom v ariables X and Y and all the configur ations of the lev els of the conditioning v ar iables Z . 2.1 P arametric T ests Two classic conditional independence tests used in the analy sis of co ntingency and probability tables are : • mutual information : an information-theor etic distanc e measure defined as MI( X, Y | Z ) = R X i =1 C X j =1 L X k =1 n ij k n log n ij k n ++ k n i + k n + j k . (2) It is pr op ortiona l to the log- likeliho o d ratio test G 2 (they differ by a 2 n 3 factor, where n is the sample size) and is rela ted to the deviance of the tested mo dels. • Pe arson ’s X 2 : Pearson’s X 2 test for con tingency tables, X 2 ( X, Y | Z ) = R X i =1 C X j =1 L X k =1 ( n ij k − m ij k ) 2 m ij k , where m ij k = n i + k n + j k n ++ k . (3) The asy mptotic null distribution is χ 2 with ( R − 1)( C − 1) L deg rees of freedom in b oth cases . F or a detailed analysis of their pr o p erties we refer the re ader to Agresti ( 2002 ) and Bishop et al. ( 2007 ). The main limitation of these tests is the r a te of c o nv ergence to their limiting distribution, whic h is particula r ly problematic when dealing with small sa mples and sparse contingency tables. This situation, which is often re ferred to a s “small n , lar ge p ”, is very common in many settings in whic h Bay esian netw orks are used (such as gene express io n and omics data ). 2.2 P erm utation T ests The mutual infor mation a nd Pearson’s X 2 tests can also be performed b y con- ditioning on a sufficien t statistic and using the p ermutation distribution as the nu ll distribution ( Pesarin and Salmaso , 20 10 ). The o bserved significance v al- ues are then computed with a c onditional Monte Carlo (CMC) simulation, as detailed in E dwards ( 20 0 0 ): 1. compute the v a lue of the test statis tic fo r the or iginal data set, and deno te it with T ; 2. per form the following steps for a suitable num ber R of times, usually betw een 500 and 5000 : (a) randomly p er mute the obser v a tions presenting the s a me config ura- tion of the co nditioning v ariables Z ; this is typically done by a pplying the pe r mutation algo r ithm fr om Meht a a nd Patel ( 1983 ) to the con- tingency tables asso ciated with the configurations of Z ; (b) compute the test statistic on the resulting data, and denote it with T ∗ r , r = 1 , . . . , R ; 3. compute the significance v alue of T as ˆ α R = 1 R R X r =1 1 { x > T } ( T ∗ r ) . (4) Both the p ermutation alg o rithm by Meht a a nd Patel ( 1983 ) and the conditiona l independenc e tests considered in this pap er hav e the marginal totals { n i + k } a nd { n + j k } as sufficient statistics, so they can be computed efficiently . 4 The main adv antage of p ermutations tests is that they do not require a large sample size or par ticular distributional assumptions to p erform well, be- cause they o p erate conditioning on the av ailable data ( Pesarin a nd Salmaso , 2010 ). Ther efore, they p er form b etter than the pa rametric tests usua lly found in literature, b eca use they ar e not limited b y the rate of convergence to the re- sp ective asymptotic distributions. How ever, the computer time required b y the generation of the per mutations of the data a nd by the r ep eated ev a luation of the test sta tistic hav e preven ted their wide s pread use in man y settings in which high-dimensional problems are the norm. 2.3 Shrink age T ests In high-dimensio nal, m ultiv ariate pro blems, the ma ximum likeliho o d estimator is known to b e inefficient and displays a cons ide r able instability for most r ea- sonable, finite sample sizes. This phenomenon, which is known as the “cur se o f dimensionality”, is caused by the exp onential increa se in the n umber of pa ram- eters as the num b er o f v ariables increa se. These issues can b e explained as a consequence of the inadmissibility of the maximum likeliho o d estimator for the mean of multiv ariate distributions discov ered by Stein ( 19 56 ) and investigated b y Ja mes and Stein ( 1 961 ). A solution is provided in the form of a r e gu larise d estimator , whic h includes some bias in o rder to increase the ov erall p er fo rmance of the e stimator. Since the natural para meters of the test statistics we a r e considering ar e the probabilities { p ij k } asso ciated with the obser ved frequencies { n ij k } , w e will denote s uch an estimator a s ˜ p = { ˜ p ij k } and the maximum likelihoo d estimator as ˆ p = { ˆ p ij k = n ij k /n } . The re g ularised e stimator is then defined a s a linear combination of the maximum likelihoo d estimator and a t ar get distribution with probabilities t = { t ij k } , which is usually c hosen to b e uniform (i.e. t ij k = 1 / | t | ): ˜ p ij k = λt ij k + (1 − λ ) ˆ p ij k , λ ∈ [0 , 1] . (5) Such an estimator is called a shrinkage estimator , beca use ˆ p is shrunk to wards t in the parameter space; λ is likewise called the shrinkage c o efficient . A closed-for m estimator for λ ha s been derived by Ledoit and W olf ( 2003 ) as the v alue that minimises the mean squa red error of ˜ p . Hausser and Strim- mer ( 2009 ) derived its e xpression for multinomial pr obabilities, with the aim of defining an impro ved entrop y estimator ( Kullbac k , 19 6 8 ); it has the form λ ∗ = 1 − P ˆ p 2 ij k ( n − 1) P ( t ij k − ˆ p ij k ) 2 . (6) The application of this result to the mutual information test leads to the defini- tion of the corresp onding shrinkage mutual i nformation test , w hich is ba sed on the shrink age es timator ˜ p instea d of the usual maximum likelihoo d estimator ˆ p . It has the form MI sh ( X, Y | Z ) = R X i =1 C X j =1 L X k =1 ˜ p ij k log ˜ p ij k ˜ p ++ k ˜ p i + k ˜ p + j k . (7) 5 The obse rved significance v alue can still be computed using the asymptotic χ 2 distribution used for the cla s sic mutual infor mation test, for tw o rea sons. First, Ledoit a nd W olf ( 2003 ) proved that λ ∗ conv erges to zero as the sample size diverges, which means that the shr ink a ge test MI sh and the cla ssic parametric test MI ha ve the same asymptotic behaviour. F urthermor e , the shr ink a ge m u- tual information test is still a log-likelihoo d ratio test. The only difference is in the n um b er of the par ameters, as b oth the n ull and the observed distributions gain an additional para meter, λ . Therefore, accor ding to Lehmann a nd Ro- mano ( 200 5 ) the asymptotic distribution of the shrink age test is ag ain χ 2 with ( R − 1)( C − 1 ) L degree s of freedom. 3 Effects on S tructure Learning W e will now in vestigate the behaviour of the p ermutation conditional indep en- dence tests and shrink ag e tests in tro duced in the previous section, using the parametric tests as a r e ference. Five per formance indicators will be taken into consideratio n: • the p o s terior density of the netw ork for the data it w as learned from, as a measure of go o dness of fit. It is known a s the Bayesian Dirichlet e quivalent score (BDe) from Heck erman et al. ( 199 5 ) and has a single para meter , the e quivalent sample size , which can b e thoug ht of as the size of an imag inary sample s uppo rting the prior distr ibution. The equiv alent sample siz e will be set to 10 as suggested in Koller a nd F riedman ( 200 9 ); • the BIC score ( Sch w ar z , 1978 ) o f the net work for the data it w as le arned from, a gain as a mea sure of g o o dness o f fit; • the p oster ior density of the netw ork for a new da ta set, as a mea sure of how well the netw or k generalises to new data; • the BIC scor e of the netw or k for a ne w data set, ag ain a s a measure of how well the netw or k generalises to new data; • the Structural Hamming Distance (SHD) betw een the learned and the true structure of the net work, as a measure of the qualit y of the learned depe ndence structure ( Tsamardinos et al. , 2006 ). These indica tors will b e estimated for each test, using the bnlea rn R pa ck age ( R Developmen t Cor e T eam , 201 0 ; Scutari , 201 0 ) as follows: 1. generate a sa mple from the true probability distribution of the ALARM net work fr om Beinlich et a l. ( 1989 ). ALARM contains 37 no des and 46 arcs, for a tota l of 509 pa rameters, a nd is frequently used as a b enchmark in the literature of B ayesian netw orks ( Larra ˜ naga et al. , 1997 ; Mo or e and W ong , 20 03 ; de Camp os a nd Ji , 2008 ); 6 2. learn a net w or k structure with the Max- Min Hill-Clim bing (MMH C) hy- brid algorithm ( Tsamardinos et a l. , 2006 ) using one of the conditional independenc e tests under investigation and the BDe score. This learning strategy has been sho wn to be o ne of the most effective up to date; it combines the Max-Min Paren ts and Children (MMPC) constraint-based algorithm with a score-ba sed hill c limb ing sear ch. Two thresholds are con- sidered for the type I error of the tests: 0 . 05 and 0 . 01. Since res ults are very similar, they ar e repor ted only for 0 . 05 for bre v ity; 3. learn a second netw ork structure from the sa me data with the asymptotic, parametric test based e ither on Pearso n’s X 2 or on the maximum lik eliho o d estimator for the m utual information, dep ending on which test was used in the previous step; 4. rep eat the previo us tw o steps using the BIC scor e instead of B De; 5. compute the relev ant p erfo r mance indicato rs for each pa ir of netw or k structures, a nd the differences are standardised to expr ess the relative difference over the v alues obtained with the asymptotic tests. I n particu- lar, BDe will b e only c o nsidered for netw orks learned in step 2 and BIC for netw orks lear ned in step 4. These steps will b e r ep eated 50 times for each sample size. The data se t needed to assess how well the netw ork genera lises to new data is generated again from the true probability structure of the ALARM net w or k and cont ains 20 000 ob- serv ations. The para meters of the netw ork, which a re the elements of the condi- tional pro ba bility tables asso ciated with the no des of the netw orks, are estimated using the c o rresp o nding empirical frequencies. 3.1 P erm utation T ests Nonparametric c o nditional indep endence tests, and p ermutation tests in par - ticular, pr ovide a feasible alter native to the corres po nding pa rametric tests in a wide range of situatio ns . The effects of the proper ties of the p e rmutation P earso n’s X 2 and the per- m utation mu tual information tests o n Ba yesian netw ork structure learning are shown in Figure 1 and Fig ure 2 . First, we can clearly see from the b ox-plots in Fig ure 1 that the use o f p er mut atio n tests results in net work structures with higher s cores for all the consider ed sample sizes (200, 500 , 10 00 and 5000 ). This is also true when co nsidering the new data set, meaning tha t the netw or k struc- tures learned with these tests are b etter for pr e dicting the b ehaviour o f new samples. As exp ected, improv ements in the BIC and BDe sco res ar e pa rticu- larly significant for low sample sizes; the proba bility structure of the ALARM net work has 509 para meter s, which means that the ratios b etw een the num ber of observ ations and the n umber of par ameters are 0 . 3 929, 0 . 9823 , 1 . 9646 and 9 . 8231 resp ectively . It is als o interesting to note that, even though the p erformance of par ametric tests improv es with the sample size, b oth permutation tests a pp ea r to improve 7 BIC improv ement (lear ned, MI) sample size % improv ement 0.00 0.05 0.10 200 500 1000 5000 BIC improv ement (lear ned, X 2 ) sample size % improv ement −0.04 −0.02 0.00 0.02 0.04 200 500 1000 5000 BIC improv ement (predicted, MI) sample size % improv ement 0.00 0.05 0.10 200 500 1000 5000 BIC improv ement (predicted, X 2 ) sample size % improv ement −0.05 0.00 0.05 0.10 200 500 1000 5000 BDe improv ement (lear ned, MI) sample size % improv ement 0.00 0.05 0.10 0.15 200 500 1000 5000 BDe improv ement (lear ned, X 2 ) sample size % improv ement −0.05 0.00 0.05 0.10 200 500 1000 5000 BDe improv ement (predicted, MI) sample size % improv ement 0.00 0.05 0.10 200 500 1000 5000 BDe improv ement (predicted, X 2 ) sample size % improv ement −0.05 0.00 0.05 0.10 200 500 1000 5000 Figure 1: Impr ov ements in Bayesian netw ork structure learning when using the per mutation mutual info r mation (on the left) a nd the p ermutation Pearso n’s X 2 (on the rig ht) tes ts . The black do t in each b ox-plot represents the median. 8 SHD improv ement (MI) sample size % improv ement −0.2 0.0 0.2 0.4 200 500 1000 5000 SHD improv ement (X 2 ) sample size % improv ement −0.4 −0.2 0.0 0.2 200 500 1000 5000 Figure 2: Diff ere nc e s in the Structural Hamming Distance when using the p er- m utation mutual info r mation (on the le ft) and the p ermutation Pearson’s X 2 (on the rig ht) tests. The black dot in each box-plot repr esents the media n. at a faster r ate. In fact, in all plo ts in Fig ure 1 the r elative improv ement for samples of size 50 00 is grea ter than the corresp o nding improvemen t for sa mples of size 2000, reg ardless of the s core w e are considering or the data set it is computed fro m. On the other ha nd, the netw ork structures lea rned with per mutation tests considered in this section are o ften not as close to the true netw ork structure as the ones lea rned with the corresp onding parametr ic tests. This is can b e clearly see n from the b ox-plots in Figure 2 , which show tha t in the ma jority of simulations the rela tive difference b etw een the SHD v alues is negative (i.e. the SHD ass o ciated with the pa rametric test is smaller than the SHD asso ciated with the p er mutation test). Perm utation tests o utper form parametric tests only for samples of size 5000. The compa ratively p o o r p erforma nce of permutation tests in terms of SHD can b e attributed to the c onditioning on the observed sample that characteris es them. Most of the samples consider ed in this ana ly sis are too small to provide an adequate representation of the tr ue probability structure of the ALARM net work, a s evidenc e d by the ratios betw een their sample sizes and the num ber of para meters. Therefore, the netw ork str uctures lea rned with per mut atio n tests from these samples ar e able to capture only par t of the true dep endence structure. The arcs that are most likely to be missed, howev er, a re those that represent the weakest dep endence relationships ; otherwise the netw orks would not b e a ble to fit new data s o well. In conclusion, p ermutation tests result in better net work str uctures than the co rresp o nding parametric tests, b oth in ter ms of go o dnes s of fit and in how well the net works are able to gener alise to new data. How ever, if the fo cus of the analysis is the structure o f the netw or k itse lf (such as when the Bay esian net work is considered as a causal mo del) parametric tests may b e prefer able for small samples. 9 BIC improv ement (lear ned) sample size % improv ement −0.10 −0.05 0.00 10 20 50 100 150 200 BDe improv ement (lear ned) sample size % improv ement −0.06 −0.04 −0.02 0.00 0.02 0.04 10 20 50 100 150 200 BIC improv ement (predicted) sample size % improv ement −0.10 −0.05 0.00 0.05 10 20 50 100 150 200 BDe improv ement (predicted) sample size % improv ement −0.10 −0.05 0.00 0.05 10 20 50 100 150 200 Figure 3: Impr ov ements in Bayesian netw ork structure learning when using the shrink age estima tor for the m utual infor mation. The black dot in each b ox-plot represents the median. SHD improv ement (shrinkage) sample size % improv ement −0.05 0.00 0.05 0.10 10 20 50 100 150 200 Figure 4: Differences in the Structural Hamming Distance when using the shrink age estimator for the m utual infor mation. The black dot in ea ch b ox- plot represe nts the median. 10 3.2 Shrink age T ests The shrink age mut ual information test has a completely different behaviour than the p ermutation tests covered ab ove. As ex pe cted from a tes t base d o n a reg ula rised estimator , the net works learned using shrink age tests do not fit the data as well as the net works learned with the c o rresp o nding ma ximum likeliho o d tests. This c an b e cle a rly see n from the b ox-plots in Figure 3 . The relative differences in the BIC and BDe sco res are almost never po sitive for either the data the netw orks have b een learned from or the new data , in par ticular for sa mples of size 10 and 2 0. Suc h small samples are most lik ely to result in spars e cont ingency tables, and therefore in high v alues of the s hrink age co efficient, a s s o on as a few conditioning v ariables are included in the tests. Larger samples are less a ffected by the r egularis a tion of the shr ink a ge estimator, b ecause the shrink age co efficient conv erge s to zero as the num b er of obser v a tions diverges ( Ledoit and W olf , 200 3 ). This means that for lar ger samples (i.e. 100, 150 and 20 0) the b ehaviour of the shr ink a ge m utual information test approa ches th e one of the classic mutual information test, as can b e seen from the increas ingly small difference b etw een the t wo in terms of BIC and BDe scores. An imp or tant side effect o f the regular isation p erfor med by the shrink a ge estimator is the reduction of the structural distance fro m the true netw ork structure for small samples. W e can see from Figure 4 that the shrink a ge test outp e rforms the test based on the maxim um lik eliho o d es tima to r; there is a systematic improvemen t for sample sizes 1 0 , 20 a nd 50 (i.e. SHD is smaller for the shrink age test). As the sample size incr eases, the b ehaviour of the shrink age test appro aches again the one o f the co rresp onding maximum likelihoo d test. These simulations confirm the results pro duced with shrink age tests for many “small n , large p ” problems , s uch as those studied in Sch¨ afer and Str immer ( 2005 ) and Kr¨ amer et al. ( 20 0 9 ), w hich have led to a widespre a d use of shrink age tests in bio lo gy and g enetics. 4 Conclusions In this pap er we inv estig a ted how the use of p ermutation tests instead of par a - metric ones affects the p erforma nce o f Bay esian netw ork structur e lea rning from discrete data, while also cov ering shrink age tests . Perm utation tes ts result in better netw ork str uctures than the cor resp onding par ametric tests, b oth in terms of goo dness of fit and in ho w well the net works a re able to genera lis e to new data. Shrink age tests, on the other hand, o utp er form bo th parametr ic and p ermutation tes ts in the quality o f the netw ork s tructure itself, which is closer to the true dependence structure of the data. References Agresti, A. (2002). Cate goric al Data A nalysis . Wiley , 2nd edition. 11 Beinlich, I., Suer mondt, H. J., Cha vez, R. M., a nd Coo p e r , G. F. (1989). The ALARM Monito r ing Sy s tem: A Ca se Study with Two Pro babilistic Inference T ec hniques for Belief Net works. In Pr o c e e dings of the 2nd Eur op e an Confer- enc e on Artificial Intel ligenc e in Me dicine , pa ges 24 7–25 6. Bishop, Y. M. M., Fien be r g, S. E., and Holland, P . W. (2007). Discr ete Multi- variate A nalysis: The ory and Pr actic e . Springer. de Camp os , C. P . a nd Ji, Q. (2008 ). Improving Bayesian Net w ork Parameter Learning Using Co nstraints. In Pr o c e e dings of the 19th Int ernational Confer- enc e on Pattern R e c o gnition (ICPR ’0 8) , pages 1–4 . Edwards, D. I. (2000). Intr o duction t o Gr aphi c al Mo del ling . Springer, 2nd edition. Geiger, D. and Heck erman, D. (1 9 94). Lea rning Gaussian Netw or ks. T echnical rep ort, Micros o ft Resear ch, Redmond, W ashing ton. Av aila ble as T echnical Repo rt MSR-TR-94 -10. Hausser, J . and Strimmer, K. (200 9). E nt ro py Inference and the James- Stein Es - timator, with Application to Nonlinear Gene Asso ciation Net w ork s. J ournal of Ma chine L e arning R esese ar ch , 10 :1469 –148 4. Heck erman, D., Geig er, D., a nd Chick ering, D. M. (1995). Learning Bayesian Net works: The Combin atio n of Knowledge and Statistical Data. Mach ine L e arning , 20(3):197–2 43. Av a ilable a s T echnical Repor t MSR-TR-94- 0 9. James, W. and Stein, C. (19 61). Estimation with Quadr atic Loss . In Neyman, J., editor, Pr o c e e dings of the 4th Berkeley Symp osium on Mathematic al St atistics and Pr ob ability , pa ges 361– 379. Koller, D. a nd F riedman, N. (20 09). Pr ob abilistic Gr aphic al Mo dels: Principles and T e chniques . MIT Press. Korb, K. and Nic holson, A. (200 4). Bayesian Artificial Intel ligenc e . Chapma n and Hall. Kr¨ amer, N., Sch¨ afer, J., and Bo ulesteix, A. (2009). Regular ized Estimation of Large- Sc a le Gene Associatio n Netw orks Using Graphical Gaussian Mo dels. BMC Bioi nformatics , 10(1):384 . Kullback, S. (1968). Information The ory and Statistics . Dover Publica tio ns. Larra ˜ naga, P ., Sierr a, B., Gallego, M. J., Michelena, M. J ., and P icaza, J . M. (1997). Lear ning Bay esian Net works b y Genetic Alg o rithms: A Case Study in the Prediction of Surviv al in Malignant Skin Melanoma . In Pr o c e e dings of the 6th Confer enc e on Artificial Intel ligenc e in Me dicine in Eu r op e (AIME ’97) , page s 2 6 1–27 2. 12 Ledoit, O. and W olf, M. (2003 ). Improv ed Es timation o f the Cov ar iance Ma- trix of Stock Returns with an Application to P or tfolio Selec tion. J ournal of Empiric al Financ e , 1 0:603 –621 . Lehmann, E . and Romano, J . P . (2005 ). T esting Statistic al Hyp otheses . Springer , 3rd edition. Meht a, C. and Patel, N. (1 983). A Netw ork Alg orithm for P erfor ming Fisher’s Exact T est in r × c Co ntingency T ables . Journal of the A meric an Statistic al Asso ciation , 78:4 27 – 434. Mo ore, A. and W ong, W. (20 03). Optimal Re ins ertion: A New Search O p erator for Accelerated a nd Mo re Accurate Bay esia n Netw ork Structure Lear ning. In Pr o c e e dings of the 20th Int ernational Confer enc e on Machine L e arning (ICML ’03) , page s 5 5 2–55 9. Pearl, J. (1988). Pr ob abilistic R e asoning in In tel ligent Systems: N etworks of Plausible Infer enc e . Morgan Kaufmann. Pesarin, F. and Salma so, L. (201 0). Permutation T est s for Complex Data: The ory, Applic ations and Softwar e . Wiley . R Development Core T eam (20 10). R: A L anguage and Envir onment for Statis- tic al Computing . R F oundation for Sta tistical Computing, Vienna, Austria. Sch¨ afer, J . and Strimmer, K. (2005). A Shrink ag e Approach to Large- Scale Co - v a riance Matrix E stimation and Implications for F unctional Genomics. Sta- tistic al App lic ations in Genetics and M ole cular Biolo gy , 4:32. Sch w ar z , G. E. (1978). Es timating the Dimension of a Mo del. Annals of Statis- tics , 6(2):4 61 – 464 . Scutari, M. (2010). Lear ning Bay esian Net works with the bnlearn R Pack age. Journal of S tatistic al Softwar e , 35 (3):1–22 . Stein, C. (195 6). Ina dmissibility of the Usual Estimator for the Mean of a Mul- tiv a r iate Distributio n. In Neyman, J., editor, Pr o c e e dings of the 3r d Berkeley Symp osium on Mathematic al Statistics and Pr ob ability , pag es 197 –206 . Tsamardinos , I., Brown, L. E., and Aliferis, C. F. (200 6). The Max-Min Hill- Clim bing Bayesian Net work Structure Learning Algorithm. Machine L e arn- ing , 65(1 ):31–78 . 13
Original Paper
Loading high-quality paper...
Comments & Academic Discussion
Loading comments...
Leave a Comment