Critical Data Compression
A new approach to data compression is developed and applied to multimedia content. This method separates messages into components suitable for both lossless coding and 'lossy' or statistical coding techniques, compressing complex objects by separatel…
Authors: John Scoville
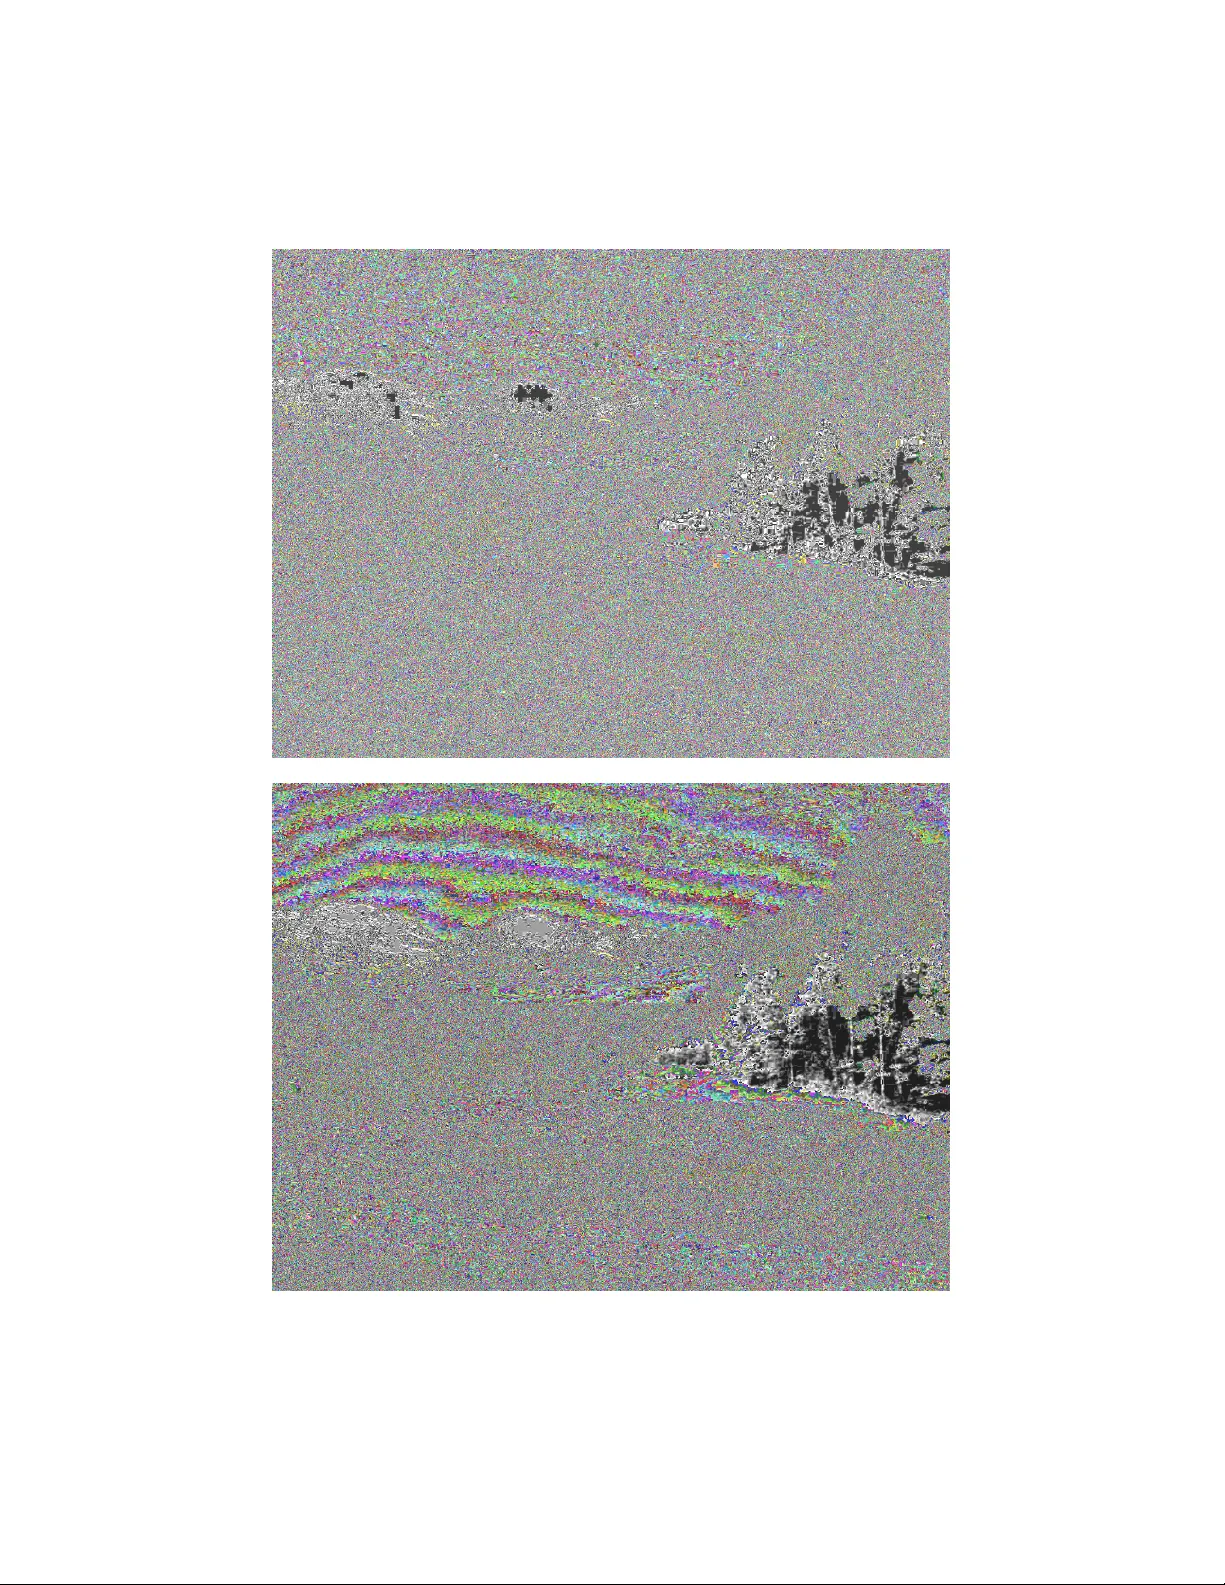
Critical Data Compression John Sco ville No v em b er 18, 2021 Abstract A new approach to data compression is developed and applied to mul- timedia con tent. This metho d separates messages in to comp onen ts suit- able for both lossless coding and ’lossy’ or statistical co ding techniques, compressing complex ob jects by separately enco ding signals and noise. This is demonstrated by compressing the most significant bits of data exactly , since they are typically redundant and compressible, and either fitting a maximally lik ely noise function to the residual bits or compress- ing them using lossy methods. Up on decompression, the significan t bits are deco ded and added to a noise function, whether sampled from a noise mo del or decompressed from a lossy co de. This results in compressed data similar to the original. Signals may b e separated from noisy bits b y considering deriv ativ es of complexit y in a manner akin to Kolmogoro v’s approac h or by empirical testing. The critical p oint separating the t w o represen ts the level b eyond which compression using exact methods be- comes impractical. Since redundant signals are compressed and stored efficien tly using lossless codes, while noise is incompressible and practi- cally indistinguishable from similar noise, such a sc heme can enable high lev els of compression for a wide v ariet y of data while retaining the statis- tical prop erties of the original. F or many test images, a tw o-part image co de using JPEG2000 for lossy compression and P A Q8l for lossless coding pro duces less mean-squared error than an equal length of JPEG2000. F or highly regular images, the adv an tage of such a scheme can b e tremen- dous. Computer-generated images typically compress b etter using this metho d than through direct lossy co ding, as do many blac k and white photographs and most color photographs at sufficien tly high quality lev els. Examples applying the metho d to audio and video coding are also demon- strated. Since tw o-part co des are efficien t for b oth perio dic and c haotic data, concatenations of roughly similar ob jects ma y be enco ded efficien tly , whic h leads to improv ed inference. Suc h codes enable complexit y-based inference in data for which lossless co ding p erforms p oorly , enabling a simple but p o werful minimal-description based approach audio, visual, and abstract pattern recognition. Applications to artificial in telligence are demonstrated, showing that signals using an economical lossless co de ha ve a critical lev el of redundancy whic h leads to better description-based inference than signals whic h enco de either insufficien t data or too m uc h detail. 1 1 Complexit y and Entrop y In contrast to information-losing or ’lossy’ data compression, the lossless com- pression of data, the cen tral problem of information theory , was essen tially op ened and closed by Claude Shannon in a 1948 pap er[13]. Shannon show ed that the entrop y form ula (in tro duced earlier by Gibbs in the context of statistical mec hanics) establishes a lo w er b ound on the compression of d ata communicated across some channel - no algorithm can produce a co de whose av erage codeword length is less than the Shannon information entrop y . If the probability of code- w ord sym b ol i is P i : S = − k X P i log P i (1) This quan tit y is the amoun t of information needed to in v ok e the axiom of c hoice and sample an elemen t from a distribution or set with measure; any linear measure of choice m ust ha v e its analytic form of exp ected log-probability[13]. This relies on the kno wledge of a probability distribution o v er the p ossible co dew ords. Without a detailed kno wledge of the pro cess pro ducing the data, or enough data to build a histogram, the entrop y may not b e easy to esti- mate. In many practical cases, en tropy is most readily measured by using a general-purp ose data compression algorithm whose output length tends to- w ard the entrop y , suc h as Lempel-Ziv. When the distribution is uniform, the Shannon/Gibbs en trop y reduces to the Boltzmann entrop y function of classical thermo dynamics; this is simply the logarithm of the n um b er of states. The entrop y limit for data compression established by Shannon applies to the exact (’lossless’) compression of an y t ype of data. As suc h, Shannon en trop y corresp onds more directly to written language, where eac h sym b ol is presumably equally imp ortan t, than to raw n umerical data, where leading digits typically ha ve more w eigh t than trailing digits. In general, an infinite num ber of trail- ing decimal p oints must b e truncated from a real num b er in order to obtain a finite, rational measurement. Since some bits hav e m uc h higher v alue than others, n umerical data is naturally amenable to information-losing (’lossy’) data compression techniques, and such algorithms ha ve become routine in the digital comm unication of multimedia data. F or the case of a finite-precision n umerical datum, rather than the Shannon e n trop y , a more applicable complexity mea- sure might b e Chaitin’s algorithmic prefix complexit y[2] which measures the irreducible complexity of the leading digits from an infinite series of bits. The algorithmic prefix complexit y is an example of a Kolmogorov complexity[9], the measure of minimal descriptive complexit y playing a central role in Kol- mogoro v’s formalization of probabilit y theory . Prior to the tw en tieth century , this basic notion of a probability distribution function (p df ) had not c hanged significan tly since the time of Gauss. After analysis of the Brownian motion b y Einstein and others, building on the ear- lier work of Mark o v, the stochastic pro cess became a p opular idea. Stochastic pro cesses represent the fundamen tal, often microscopic, actions which lead to frequencies tending, in the limit, to a probability densit y . Sto chastic partial dif- feren tial equations (for example, the F okker-Planc k equation) generate a pdf as 2 their solution, as do the ’master equations’ from whence they are derived; suc h p dfs may describ e, for instance, the ev olution of probabilities o v er time. They w ere used notably by Langevin to separate dynamical systems into a deter- ministic classical part and a random stochastic comp onent or statistical mo del. Giv en empirical data from such a system, the Langevin approach ma y be com- bined with the maximum lik elihoo d metho d[4] or Bay esian inference (maximum p osterior method) to identify the most lik ely parameters for an unknown noise function. In practice, Langevin’s approac h either p osits the form of a noise function or fits it to data; it do es not address whether or not data is stochastic in the first place. Kolmogoro v addressed this issue, refining the notion of sto c has- tic pro cesses and probabilit y in general. Some ob jects, a solid black image, for example, are almost en tirely regular. Other data seem totally random; for instance, geiger coun ters recording radioactive decays. Sto c hastic ob jects lay be- t ween these tw o extremes; as such, they exhibit b oth deterministic and random b eha vior. Kolmogoro v in tro duced a technique for separating a message into ran- dom and nonrandom comp onents. First, how ev er, he defined the Kolmogoro v complexit y , C ( X ). C ( X ) is the minimum amoun t of information needed to completely reconstruct some ob ject, represented as a binary string of symbols, X[3, 9]. C f ( X ) = min f ( p )= X | p | (2) The recursive function f ma y b e regarded as a particular computer and p is a program running on that computer. The Kolmogoro v Complexity is the length of the shortest computer program that terminates with X as output on computer f. In this w ay , it symbolizes p erfect data compression. F or v arious reasons (suc h as the non-halting of certain programs), it is usually imp ossible to pro ve that non-trivial representations are minimal. On the other hand, a halting program alwa ys exists, the original string, so a minimal halting program also exists, ev en if its identit y can’t b e verified. In practice, the Kolmogorov com- plexit y asymptotically approaches the Shannon en tropy[9], and the complexit y of t ypical ob jects may be readily approximated using the length of an en tropic co de. Often, a v arian t of Kolmogoro v complexity is used - Chaitin’s algorithmic prefix complexity K ( X )[2] which considers only self-delimiting programs that do not use stop symbols. Since a program may be self-delimiting b y iterativ ely prefixing code lengths, K ( X ) = C ( X ) + C ( C ( X )) + O ( C ( C ( C ( X ))))[9] Returning to the separation of signal and noise, we now define sto c hasticity as it relates to the Kolmogorov structure function. F or natural n umbers k and δ , we say that a string x is ( k , δ )-sto chastic if and only if there exists a finite set A suc h that: x ∈ A, C ( A ) ≤ k , C ( x | A ) ≥ l og | A | − δ (3) The deviation from randomness, δ , indicates whether x is a typical or at ypical mem b er of A. This is minimized through the Kolmogoro v Structure F unction, C k ( x | n ): C k ( x | n ) = min { log | A | : x ∈ A, C ( A | n ) ≤ k } (4) 3 The minimal set A 0 minimizes the deviation from randomness, δ , and is referred to as the Kolmogoro v Minimal Sufficient Statistic for x given n. The Kolmogoro v Structure F unction sp ecifies the bits of additional en tropy (Shannon en tropy reduces to the logarithm function for a uniform distribution) necessary to select the elemen t x from a set described with k or fewer bits. F or a regular ob ject, the structure function has a slop e less than -1. Sp ecifying another bit of k reduces the entrop y requiremen t by more than a bit, resulting in compression. Bey ond a critical threshold, corresp onding to the minimal sufficient statistic, sto c hastic ob jects become random. Beyond this p oint, sp ecifying another bit of k increases the entrop y by exactly one bit, so the slop e of the structure func- tion reaches its maximum v alue of -1. F or this reason, Kolmogorov identified the p oint at whic h the slop e reac hes -1 as the minimal sufficien t statistic. The Kolmogoro v minimal sufficient statistic represents the amoun t of information needed to capture all the regular patterns in the string x without literally spec- ifying the v alue of random noise. While conceptually appealing, there are practical obstacles to calculating the Kolmogoro v minimal sufficient statistic. First, since the Kolmogoro v complexity is not directly calculable, neither is this statistic. Approximations ma y be made, ho wev er, and when using certain common data compression algorithms, the p oin t having slope 1 is actually a reasonable estimate of the onset of noise. When certain data are compressed more fully , ho wev er, this point ma y not exist. F or example, consider a color photograph of blac k and white static on an analog TV set. The pattern of visible pixels emerges from nearly incompressible en tropy; c haos resulting from the machine’s attempt to choose v alues from a nonexisten t signal. Since a color photograph has three channels, and the static is essentially mono c hromatic; the channels are correlated to one another and hence c on tain compressible mutual information. As such, the noise in the color photograph, though emergent from essentially pure en tropy , is intrinsically compressible - hence, the compression ratio never reac hes 1:1 and the Kolmogorov minimal sufficien t statistic does not exist. Instead of the parameter v alue where the compression ratio reaches 1:1, whic h may not exist, one often seeks the parameter v alue which provides the most information about the ob ject under consideration. The problem of deter- mining the most informative parameters in a model w as famously addressed by the statistician R.A. Fisher[4]. The Fisher Information quantifies the amount of information exp ected to b e inferred in a lo cal neighborho o d of a contin uously parameterizable probability distribution. The Fisher Information quantifies information at sp ecific v alues of the parameters - it quantifies the informativ e-ness of a lo cal observ ation. If the probability densit y of X is parameterized along some path b y t, f(X;t), then the Fisher Information Metric at some v alue of t is the expectation of the v ariance of the Hartley information[6], also kno wn as the score: I ( t ) = − E [( ∂ t ln f ( X ; t )) 2 | t ] (5) The Fisher Information quantifies the conv exit y (the curv ature) of an en trop y 4 function at a sp ecific point in parameter space, pro vided sufficient regularit y and differen tiability . In the case of m ultiple parameters, the Fisher Information b ecomes the Fisher Information Metric (or Fisher Information Matrix, FIM), the exp ected co v ariance of the score: I ( t ) ij = E [ ∂ t i ln f ( X ; t ) ∂ t j ln f ( X ; t )] (6) The Fisher-Rao metric is simply the a v erage of the metric implied by Hartley information ov er a parameterized path. The space describ ed b y this metric has distances that represent differences in information or entrop y . The differential geometry of this metric is sometimes called information ge ometry . W e seek the parameter v alues maximizing the Fisher-Rao metric, for v ariations in these v alues lead to the largest possible motions in the metric space of information. If we tak e f ( X ; t ) to b e the univ ersal probability of obtaining a string X from a randomly generated program on a universal computer, this probability is typically dominated by the shortest p ossible program, implying that f ( X ; t ) ≈ 2 − K ( X ) , where we ha v e used K ( X ) instead of C ( X ) so the sum ov er all X will con vergence to unit probility[9]. If we make the string X a function of some parameter t, X = X ( t ), then f ( X ; t ) ≈ 2 − K ( X ( t )) , the Hartley information is ln 2 times − K ( X ( t )), and its associated Fisher-Rao metric is: I ( t ) ij ≈ (ln 2) 2 E [ ∂ t i K ( X ( t )) ∂ t j K ( X ( t ))] (7) Since the spaces we consider are generally discrete, we will consider paths from one parameter v alue to the next and ev aluate partial differences in place of the partial deriv atives. The one-dimensional Fisher information of a path from n to n + 1 is, replacing the contin uous differentials with finite differences, and ignoring the exp ectation op erator, which b ecomes the identit y op erator since the expectation cov ers only one p oint: I ( t ) = 2 ln 2( K ( X ( t + 1) − K ( X ( t ))) 2 , 0 < n < d (8) Maximizing this quan tit y is equiv alen t to maximizing K ( X ( t + 1) − K ( X ( t )), whic h is also the denominator in the slop e of the Kolmogorov structure func- tion. F or incompressible data, the n umerator log | A t | − log | A t − 1 | (whic h is the n umber of additional bits erased b y the uncompressed X ( t ) beyond those erased b y the more descriptiv e X ( t + 1)) also tak es on this v alue. Since the parameter in the Kolmogorov structure function corresponds to bits of description length, the literal description corresp onding to each subsequent parameter v alue dif- fers in length b y a constan t, minimizing the slop e of the Kolmogoro v structure function is equiv alent to maximizing K ( X ( t + 1) − K ( X ( t )) and the Fisher in- formation. The minimal parameter that maximizes the Fisher information is the Kolmogoro v minimal sufficien t statistic. Sometimes, rather than considering the p oin t at whic h a phase transition is complete, w e wish to consider the critical p oint at which it pro ceeds most 5 rapidly . F or this, we use the exp ectation of the Hessian of the Hartley informa- tion: J ( t ) ij = E [ ∂ 2 t i ln f ( X ; t ) ∂ 2 t j ln f ( X ; t )] (9) This is in contrast to the exp ectation of the Hartley information, the en tropy , or the exp ected curv ature of the Hartley information, the Fisher information. When this function is maximized, the Fisher information (or slop e of the Kol- mogoro v structure function) is changing as rapidly as p ossible. This means that the phase transition of interest is at its critical p oint and proceeding at its maxim um rate. Beyond this p oint, the marginal utility of each additional bit decreases as the phase transition pro ceeds past criticality to completion at the minimal sufficien t statistic. The deriv atives in the Fisher information were approximated using back- w ards differences in complexity; how ev er, a forward second difference may ap- plied subsequently to complete the Hessian, the net result of this is a central difference appro ximation to the second deriv ative of complexity: ∂ 2 t i K ( A t i ) ≈ K ( A t +1 ) − 2 K ( A t ) + K ( A t − 1 ). The maxim um resulting from this appro ximation is betw een the maxim um and minimum v alues of the parameter, exclusiv ely . In practice, since w e can’t calculate K ( X ) exactly , it is helpful to treat an y v alue of the Fisher information (or the slop e of the Kolmogorov structure function) within some tolerance of the maximum K ( X n ) − K ( X n − 1 ) as b eing a member of a nearly-maximum set, and select the element of this set having the fewest bits. Usually , the representation having the low est complexity is the one with the low est bit depth or resolution, but not alwa ys - when lossless compression is applied to highly regular ob jects, the lossless representation ma y b e simpler than any 2-part or purely lossy co de. This statistic the represents all the bits of signal that can b e describ ed b efore additional bits require a nearly maximal description - it quan tifies the minim um complexit y needed to complete a phase transition from a lo w-complexity p erio dic signal to a high-complexity c haotic one. This also applies to the maxim um of the second deriv ativ e, as considered ab ov e. Any v alue of the Hessian that is within some tolerance of the maximal K ( A t +1 ) − 2 K ( A t ) + K ( A t − 1 ) is considered part of a nearly-maximal set, and the simplest element of this set is selected as the critical point. The sufficiency of a statistic was also defined b y Fisher in 1921[4]. If a statistic is sufficient, then no other statistic provides any additional informa- tion ab out the underlying distribution. Fisher also demonstrated the relation- ship b etw een maximum likelihoo d and sufficient statistics. The Fisher-Neyman factorization theorem sa ys that for a sufficient statistic T(x), the probabilit y densit y f θ ( x ) factors in to terms dep enden t and indep enden t of the parameter: f θ ( x ) = h ( x ) g θ ( T ( x )). The maxim um lik eliho o d function for the parameter θ dep ends only the sufficient statistic T ( x ). As a result, a sufficient statistic is ideal for determining the parameters of a distribution using the popular metho d of maxim um lik elihoo d estimation (MLE). The most efficien t possible articula- tion of a sufficient statistic is a minimal sufficient statistic. A sufficien t statistic S ( x ) is minimal if and only if, for all sufficient statistics T ( x ), there exists a function f suc h that S = f ( T ( x )). 6 P artitioning the information conten t of a string into the complexity of its signal and the entrop y of its noise is a nuanced idea that takes on several im- p ortan t forms, another is the algorithmic entrop y[15, 9] H ( Z ) of a string. This is defined in its most basic form as: H ( Z ) = K ( Z ) + S (10) In this con text, Z = X 1: m is a description of a macroscopic observ ation constructed by truncating a microscopic state X to a bit string of length m. K(Z) is the algorithmic prefix complexit y[2, 9] of this represen tation, and S = log 2 n is the Boltzmann entrop y divided b y its usual mulplicativ e constant, k, the Boltzmann constan t, and ln 2, since w e are using bits. n is the logarithm of the m ultiplicity or volume of truncated states, having univ ersal recursive measure 2 − m , so S = − m and the algorithmic en tropy is H ( Z ) = K ( Z ) − m . This function is also known as the Martin L¨ of universal randomness test and pla ys a cen tral role in the theory of random num bers. The partitioning of a string into signal and noise also allo ws the determina- tion of the limit to its lossy compression[12], relative to a particular observer. If P(X) is the set of strings whic h some macroscopic observ er P cannot distinguish from string X, then the simplest string from this set is the minimal description equiv alent to X: S f ( X/P ) ≡ min f ( p ) ∈ P ( X ) | p | (11) W e refer to this complexit y as the macrostate complexit y[12] or macrocom- plexit y since its criterion of indistinguishability corresp onds to the definition of a macrostate in classical thermo dynamics; a macrostate is a set of indistin- guishable microstates. Likewise, its entrop y function has the form (logarithm of cardinalit y) of the Boltzmann entrop y; it may b e shown that if the probabilit y p ( X ) of the class P is dominated b y the shortest program in the class such that p ( X ) ≈ 2 − K ( X ) , the macrocomplexity S ( X/P ) is appro ximately: K ( X ) ≈ S ( X/P ) + log | X/P | (12) This first-order approximation to macro complexity is close to the effective complexit y of Gell-Mann and Llo yd[5]. The effectiv e complexity , Y, is summed with the Shannon entrop y , I, or an even more general entrop y measure, such as R´ enyi en tropy , to define an information measure, the total information Σ = Y + I , that is t ypically within a few bits of K(X)[5]. 2 Critical Data Compression 2.1 Qualitativ e Discussion Critical data compression co des the most significant bits of an array of data losslessly , since they are t ypically redundant, and either fits a statistical mo del to the remaining bits or compresses them using lossy data compression techniques. 7 Up on decompression, the significant bits are deco ded and added to a noise function whic h ma y be either sampled from a noise mo del or decompressed from a lossy code. This results in a representation of data similar to the original. This t yp e of sc heme is w ell-suited for the representation of noisy or sto c hastic data. A ttempting to find short representations of the sp ecific states of a system whic h has high entrop y or randomness is generally futile, as c haotic data is in- compressible. As a result, an y op eration significan tly reducing the size of c haotic data must discard information, and this is why such a pro cess is collo quially re- ferred to as ’lossy’ data compression. T o day , lossy compression is conv en tionally accomplished by optionally pre- pro cessing and/or partitioning data and then decomposing data blo cks onto basis functions. This pro cedure, canonicalized by the F ourier transform, is gen- erally accomplished by an inner pro duct transformation pro jecting the signal v ector onto a set of basis vectors. How ev er, this is not an appropriate math- ematical op eration for sto chastic data. Sto c hastic v ariables are not generally square-in tegrable, meaning that their inner pro ducts do not technically exist. Though a discrete F ourier transform ma y b e applied to a sto c hastic time series sampled at some frequency , the resulting sp ectrum of the sample will not gen- erally b e the sp ectrum of the pro cess, as Parsev al’s theorem need not apply in the absence of square-in tegrabilit y . W orse, F ourier transforms suc h as the discrete cosine transform do not prop- erly describ e the b ehavior of light emitted from complex geometries. A photo- graph is literally a graph of a cross-section of a solution to Maxwell’s equations. The first photographs were created b y the absorption of photons on silv er chlo- ride surface, for instance. While it is true that the solution to Maxwell’s equa- tions in a v acuum take the form of sinusoidal w a ves propagating in free space, a photograph of a v acuum would not generally b e very interesting and, fur- thermore, the resolution of macroscopic photographic devices is nowhere close to the sampling frequency needed to resolve individual wa v es of visible light, whic h typically hav e wa v elengths of a few hundred nanometers. In a limited n umber of circumstances, this is appropriate - for example, a discrete cosine transformation would b e ideal to enco de photons emerging from a diffraction grating with well-defined spatial frequencies. In general, how ev er, most pho- tographs are sampled well b elo w the Nyquist rate necessary to reconstruct the underlying signal, meaning that microscopic detail is being lost to the resolution of the optical device used. If a photographic scene contains multiple electrons or other charged parti- cles, the resulting wa v efron t will no longer b e sinusoidal, instead b eing a func- tion of the geometry of charges. Though the sine and cosine functions are orthogonal, they are complete in the sense that they may b e used as a basis to express any other function. How ev er, since sinusoids do not generally solve Maxw ell’s equations in the presence of b oundary conditions, the coefficients of such an expansion do not corresp ond to the true mo des that carry energy through the electromagnetic field. The correct set of normal mo des - which solv e Maxw ell’s equations and enco de the resulting light - will b e eigenfunc- tions or Green’s functions of the geometry and acceleration of charges[7]. F or 8 example, when designing w av eguides (for example, fib er optics) the choice of a circular or rectangular cross-section is crucially imp ortan t as this geometry determines whether the electric or the magnetic field is allow ed to propagate along its transv erse dimension. Calculating the F ourier cosine transform of these fields pro duces a noisy sp ectrum; how ev er, expanding ov er transverse electric and magnetic mo des could pro duce an idealized sp ectrum that has all of its in- tensit y fo cused into a single mo de and no amplitude o v er the other modes. The prop er, clean sp ectrum is appropriate for information-losing approximations - since the (infinite) sp ectrum contains no energy b eyond the modes under consid- eration, it can b e truncated without compromising accuracy . F or the complex electronic geometries and motions that comprise interesting real-world photo- graph, these mo des may be difficult to calculate, but they still exist as solutions of Maxwell’s equations. Attempting to describ e them using sinusoids that don’t solv e Maxwell’s equations leads to incompressible noise and sp ectra that can’t b e appro ximated accurately . F or audio, how ev er, we note that the situation is somewhat different. Au- dio signals hav e muc h low er frequency than visible light, so they are sampled ab o v e the Nyquist rate. 44,100Hz is a typical sampling rate which faithfully reconstructs sinusoids ha ving frequency comp onen ts less than 22,050Hz, which includes the v ast ma jority of audible frequencies. Auditory neurons will phase- lo c k directly to sin usoidal stimuli, making audio p erception amenable to F ourier- domain signal pro cessing. If compressed in the time domain, the leading bits (whic h exhibit large, rapid oscillations) often app ear more random to resource- limited data compressors than the leading bits of a F ourier sp ectrum. At the same time, the less-imp ortant trailing bits are often redundant, giv en these lead- ing bits, o wing to vibrational mo des which v ary slo wly compared to the sampling rate. This reverses the trend observed in most images - their most significant bits are usually smoother and more redundant than trailing bits. In the strictly p ositiv e domain of F ourier-transformed audio, how ev er, the leading bits b e- come smo other, due the use of an appropriate sampling rate. F or macroscopic photographic con tent, how ev er, individual wa v es cannot b e resolved, making F ourier-domain optical pro cessing less effectiv e. Nonetheless, scientists and engineers in all disciplines all ov er the world successfully calculate F ourier transforms of all sorts of noisy data, and a large fraction (if not the v ast ma jority) of all communication bandwidth is dev oted to their transmission. JPEG images use discrete cosine transforms, a form of discrete F ourier transform, as do es MP3 audio and most video co decs. Other general-purp ose transformations, suc h as wa v elets, are closely related to the F ourier transform and still suffer from the basic problem of pro jecting sto c hastic data onto a basis - the inner products don’t technically exist, resulting in a noisy spectrum. F urthermore, since the basis used doesn’t solv e generally solv e Maxw ell’s equations, finite-order approximations that truncate the sp ectrum will not translate into results that are accurate to the desired order. As such, w e seek an alternativ e to expanding functions ov er a generic basis set. 9 2.2 Compressing Data with Tw o-P art Co des The limit of lossy data compression is the Kolmogoro v complexity of the macrostate p erceiv ed by the observer[12]. Explicitly describing the macrostates p erceptu- ally co ded by a human observer is prohibitively difficult, which mak es optimal compression for a human observer intractable, even if the complexity were ex- actly calculable. How ev er, the truncation of data whic h app ears in the definition of prefix complexity provides a very natural means of separating 2-part co des, the prefix complexity app ears in the definition of the algorithmic entrop y[15], whic h is a sp ecial case of macrostate complexit y . T runcation of amplitude data pro vides a simple but universal model of data observ ation - an observ er should regard the most significant bits of a datum as b eing more imp ortan t than its least significan t bits. The co des describ ed in this pap er are the sum of a truncated macrostate, Z = X 1: m , which we call the signal, as well as a lossy approximation of the bits that w ere truncated from this signal, whic h we will refer to as that signal’s residual noise function. This is in con trast to the algorithmic entrop y , which com bines a truncated macrostate with all the information needed to reco ver its microstate. If n samples are truncated from d bits to m , the Boltzmann entrop y is prop ortional to S ∼ log 2 n ( d − m ) = n ( d − m ) and the algorithmic entrop y is H ( Z ) = K ( Z ) + S = K ( Z ) + n ( d − m ), ho wev er, since w e only store K ( Z ) bits using lossless compression, the sa vings resulting from a t w o-part co de (compared to a lossless en tropic code) could approac h the B oltzmann en trop y n ( d − m ) in the case of a highly compressed lossy represen tation. First, the bits of datum Y are reordered in the string X , from most signif- ican t to least significant. This simplifies truncation and its corresp ondence to the conditional prefix complexity . The resulting string is truncated to v arious depths, and the compressibility of the resulting string is ev aluated. The p oint b ey ond whic h the ob ject has attains maximum incompressibilit y also maximizes the Fisher information associated with the distribution P ( X ) = 2 − K ( X ) . As dis- cussed in the previous section, this phase transition pro ceeds at its maximum rate when the expected Hessian of the Hartley information, J ( t ), is maximal. Since the phase transition betw een perio dicity and c haos is generally some- what gradual, several p ossible signal depths could b e used, to v arying effect. F ollowing Ehrenfest’s categorization of critical p oints by the deriv ativ e which is discon tin uous, w e will also refer to critical p oints b y the order of deriv atives. Due to the discrete nature of our analysis, our difference appro ximations never b ecome infinite, instead, we seek the maxima of v arious deriv atives of the infor- mation function. In the first-order approximation to the universal probability , the Hartley in- formation is simply the complexity log P ( X ) = − K ( X ), therefore, multiplying the problem by -1, we classify critical p oints by the deriv atives of complexity whic h hav e minima there. The first of these, I ( t ) = ∂ t i K ( X ) ∂ t j K ( X ), corre- sp onds to the Fisher-Rao metric, and its maxima corresp ond to sufficien t statis- tics. If the ob ject is c haotic b eyond some lev el of description, then this level is also the Kolmologoro v minimal sufficient statistic. The second order matrix, 10 J ( t ) = ∂ 2 t i K ( X ) ∂ 2 t j K ( X ), is the p oint at whic h the Fisher Information increases most rapidly and hence the point beyond whic h descriptional complexit y results in diminishing returns. Higher-order critical p oints may be considered as well, but b ecome progressiv ely more difficult to determine reliably in the presence of imp erfect complexit y estimates, so we will analyze only the first t wo orders. The choice of a first order critical point (max I ( t )) or a second order critical p oin t (max J ( t )) as a cutoff for data compression will reflect a preference for fidelit y or economy , resp ectively . Other considerations may lead to alternative signal depths - the mean squared errors of images having v arious cutoffs are considered in the examples section, for instance. Regardless of the critical p oint c hosen, the redundant, compressible signal comp onent defined by the selected cutoff point is isolated and compressed using a lossless code. Ideally , an accurate statistical model of the underlying phenomenon, p ossibly incorp orating psychological or other factors, would b e fit to the noise comp onent using maximum lik eliho o d estimation to determine the most likely v alues of the parameters of its distribution. Instead of literally storing incompressible noise, the parameters of the statistical mo del are stored. When the co de is decompressed, the lossless signal is decompressed, while the noise is simulated b y sampling from the distribution of the statistical mo del. The signal and sim ulated noise are summed, resulting in an image whose underlying signal and statistical properties agree with the original image. Since statistical mo deling of general multimedia data may b e impractical, ’lossy’ data compression metho ds may be applied to the noise function. A successful lossy representation may b e regarded as an alternate microstate of the perceived noise macrostate; it is effectiv ely another sample dra wn from the set of data macroscopically equiv alen t to the observed datum[12]. As such, in the absence of an appropriate mo del, the noise function is compressed using lossy methods, normalized suc h that the resulting in tensities do not exceed the maxim um p ossible amplitude. This representation will b e decompressed and added to the decompressed signal to reconstruct the original datum. This has several adv an tages. First, the signal is relatively free of spurious artifacts, such as ringing, which in terfere with the extraction of useful inferences from this signal. Artifacts from lossy compression cannot exceed the amplitude of the noise floor, and higher levels of lossy compression may b e used as a result of this fact. F urthermore, lossy compression algorithms tend to compress high frequencies at a higher level than low er frequencies. The eyes and ears tend to sense trends that exhibit c hange o v er broader regions of space or time, as opp osed to high-frequency oscillations. The compressibility of signal and noise leads to an information-theoretic reason for this phenomenon - the former naturally requires less of the nervous system’s comm unication bandwidth than the latter. The compression ratios afforded b y such a scheme can b e dramatic for noisy data. As a trivial example, consider a string con taining only random noise, suc h as the result of n indep endently distributed Bernoulli trials having probability p = 0 . 5, such as a coin flip. Lossless entropic compression cannot effectively compress such a string. Decomp osing suc h a string into basis functions, such 11 as the F ourier amplitudes or wa v elets used in the JPEG algorithms, inevitably results in a mess of spurious artifacts with little resemblance to the original string. The critical compression scheme describ ed, how ev er, easily succeeds in repro ducing noise that is statistically indistinguishable from (though not iden- tical to) the original string. F urthermore, all that needs to be stored to sample from this distribution is the probability p = 0 . 5 of the Bernoulli trial, which has complexit y O(1). The observ er for whic h this sc heme is optimal mak es statisti- cal inferences of amplitude in a manner similar to a physical measurement. The observ er records the statistics of the data, e.g. mean, v ariance, etc., rather than enco ding particular data, which could in troduce bias. If the data is a wa v eform sampled at a frequency exceeding its effective Nyquist rate, suc h as an audio recording sampled at more than t wice the fre- quency of a listener’s ear, then its sp ectrum may b e analyzed rather than its time series. This will make the data smo other and non-negative, resulting in b etter compression for the leading bits. In practical terms, this means that w e ma y compress audio by compressing an one-dimensional image which is a graph of its sp ectrum, or the sp ectrum of some p ortion of the time series. Hence, w e will develop the metho d using images as a canonical example, with the un- derstanding that audio may b e compressed, for example, using 1-d images of F ourier transforms, and that video ma y b e compressed using an array having the third dimension of time, or by embedding information into low er-dimensional arra ys. 2.3 Rotating the Color or Sample Space F or man y photographic and video applications, it is conv en tional to rotate a pixel’s R GB color space to a color space, Y C b C r , whic h more naturally reflects the eye’s increased sensitivit y to brightness as compared to v ariations in color. This is normally done in suc h a wa y that takes in to accoun t the p erceived v ariations in brightness betw een differen t phosphors, inks, or other media used to represen t color data. The Y or luma channel is a blac k-and-white version of the original image whic h contains most of the useful information ab out the image, b oth in terms of human p erception and measurements of numerical error. The luma c hannel could b e said to b e the principal comp onen t (or factor) of an image with re- sp ect to p erceptual mo dels. The blue and red chroma channels ( C b and C r , resp ectiv ely) effectively blue-shift and/or red-shift white light of a particular brigh tness; they are signed v alues enco ding what are typically slight color v ari- ations from the luma channel. It is conv en tional for the luma channel to receive a greater share of bandwidth than the less imp ortant chroma channels, whic h are often do wnsampled or compressed at a low er bitrate. As an alternative to consistently using a p erceptual mo del optimized for the output of, for example, particular t ypes of monitors or prin ters, one could use a similar approach to determine the principal components of color data as enco ded rather than p erceiv ed. Principal comp onents analysis, also called factor analysis, determines linear com binations of inputs whic h ha v e the most influence o v er the 12 output. In principal components analysis, n samples of m -channel sample data are placed in the columns of an m -by- n matrix A and the matrix product AA T is constructed to obtain an m -by- m matrix. The eigenv ectors of AA T ha ving the largest eigenv alues are the most influen tial linear com binations of data, the magnitude of these eigen v alues (sometimes called factor weigh ts) reflects the imp ortance of a particular combination. The result of applying principal comp onen ts analysis to photographic con- ten t leads to a customized color space whose principal comp onent is a luma c hannel whose c hannel weigh ts corresp ond to the eigenv ector having the largest eigen v alue. This c hannel is b est communicated at a higher bitrate than the secondary and tertiary comp onents, which are effectively chroma channels. In the app endix, we will compare the results of critically compressing photographs in RGB format against compression using a critical luma c hannel with lossy c hroma channels. F or most of these photographs, a critically compressed luma c hannel leads to more efficient representations than using only lossy w a v elet transformations. In general, p erceiv ed output may b e optimized by analyzing the principal comp onen ts of p erceiv ed rather than raw data. In contrast, directly applying principal comp onent analysis (or factor analysis) to the raw data leads to a univ ersal co ordinate system for sample space whic h has impro v ed compressibil- it y , albeit optimized for a particular instance of data rather than the perceived output of a particular medium. In addition to improv ed compression, another adv antage of this approach is that it applies to a wide v ariety of numerical data and this facilitates a general approach to lossy data compression. 3 Critical Bit Depth The critical bit depth determines the level of compressible conten t of a signal. W e now determine expressions for the first and second order critical depths. This will allow us to separate signal from noise for audio, image, and video data b y determining a bit depth that effectiv ely separates signal from noise. If higher compression ratios are desired, a sup ercritical signal may be used, meaning that more bits ma y b e truncated, at the cost of destroying compressible information and potentially imp eding inference. On the other hand, a signal retaining nearly all of its bits would necessarily be similar to the original. F or a string whic h encodes the outcome of a series of indep enden t Bernoulli trials (coin flips, for instance) as zeros and ones, each bit constitutes the same amoun t of information - one bit is one sample. F or a string comprised of a series of n umeric samples at a bit depth greater than one, this is not usually the case. In the traditional represen tation of numerals, leading bits are gener- ally more informativ e than trailing bits, so an effective lossy data compression sc heme should enco de leading bits at a higher rate. F rom the viewp oint of com- pressibilit y , on the other hand, the smo oth, redundan t leading bits of a t ypical sto c hastic pro cesses are more compressible than its trailing bits. Since the lead- ing bits of multi-bit samples are often more compressible and more significant 13 than the trailing bits, they are candidates for exact preserv ation using lossless data compression. Since the trailing bits are generally less imp ortant and also less compressible, lossy compression can greatly reduce their descriptive com- plexit y without perceptible loss. 3.1 Bit Depth of a 2-D channel Since images will b e easy to illustrate in this medium, and provide a middle ground as compared to one or three dimensions for audio or video, resp ectively , w e will treat the tw o-dimensional case first. W e will then generalize to data ha ving an y n um ber of dimensions. W e will refer to the matrices (rank-2 tensors) as images, since this is a canonical and in tuitive case, but these expressions apply generally to all t w o-dimensional arra ys of binary num bers. Let X d i,j represen t a tensor of rank three (a tensor of rank n is an n- dimensional array) represen ting one channel of a bitmap image. Subscript in- dices i and j represent x and y co ordinates in the image, and the sup erscript d indexes the bits enco ding the amplitude of pixel (i,j) in the channel, ordered from most significan t to least significant. Let the set A n con tain all the images whose n leading bits agree with those of X d i,j : A n ≡ { Y m ij : Y m ij = X m ij , m ≤ n ≤ d } (13) This set can b e represented as the original image channel with bit depth truncated from d to n . The implied observ er sees n significan t bits of (learnable) signal and d − n insignificant bits of (non-learnable) noise. F or reference, the algorithmic en trop y of the truncated string is: H ( Z ) = K ( A n ) + log | A n | = K ( A n ) + ij d − ij n (14) The literal length of the reduced image is ij d − ij n , and most of this will b e sa v ed in a critical compression sc heme, as noise can be co ded at a high loss rate. If B n is the lossy representation, the complexit y of the critically compressed represen tation is: K = K ( A n ) + K ( B n ) ≤ K ( A n ) + ij d − ij n (15) W e may now consider the Fisher information (and hence the minimal suf- ficien t statistic) of A n . The Fisher information of a path from n to n + 1 is, replacing the contin uous differentials with finite differences, and ignoring the exp ectation operator (which b ecomes equiv alen t to the identit y operator): I ( n ) = 2 ln 2 ( K ( A n +1 ) − K ( A n )) 2 , 0 < n < d (16) The first order bit depth n 0 parameterizing the minimal sufficient statistic A n 0 is the argument n that maximizes the c hange in complexity , K ( A n +1 ) − K ( A n ): n 0 = arg max I ( n ) , 0 < n < d (17) 14 The first order bit depth of the image channel represented by X d i,j is n 0 . That is, the first n 0 most significan t bits in each amplitude enco de the signal; the remaining bits are noise. The noise flo or of the image is n 0 . The second order depth, on the other hand, determines the p oint of di- minishing returns b eyond which further description has diminished utility . It is the maxim um of the exp ected Hessian of Hartley information, J ( t ) ij = E [ ∂ 2 t i ln f ( X ; t ) ∂ 2 t j ln f ( X ; t )], so it becomes: n c = arg max J ( n ) , 0 < n < d (18) This minimizes K ( A n +1 ) − 2 K ( A n ) + K ( A n − 1 ). The signal having n c bits p er sample has the high-v alue bits and the residual noise function contains the bits determined to ha v e diminishing utility . 3.2 Critical Depths of Multi-Channel Data When considering m ultiple c hannels at once, which allows data compression to utilize correlations b etw een these channels, we simply consider a sup erset of A n that is the union of the A n for eac h channel X k , 0 ≤ k < k max . If all the c hannels ha v e the same bit depth, for instance, this sup erset becomes: A n ≡ { [ Y m ij : Y m ij = ( X k ) m ij , m ≤ n ≤ d, 0 ≤ k < k max } (19) Its corresp onding representation is the union of the truncated channels, tra- ditionally , an image w ould hav e three of these. Given this new definition, the calculation of first-order depth pro ceeds as b efore. Its Fisher information is still I ( n ) = 2 ln 2( K ( A n +1 ) − K ( A n )) 2 , whic h takes its maximum at the minimal sufficien t statistic, the first order depth maximizing K ( A n +1 ) − K ( A n ). The second order depth, as b efore, maximizes K ( A n +1 ) − 2 K ( A n ) + K ( A n − 1 ). It is also p ossible to take the union of channels ha ving differen t bit depths. The first-order critical parameters (bit depths) are best determined by the max- im um (or a near-maximum) of the Fisher-Rao metric. The second-order critical parameters are determined by the maxim um (or a near-maximum) of the Hes- sian of Hartley information. 3.3 Represen tations using Multiple Critical Depths If stochastic data is not ergodic, that is, if differen t regions of data hav e different statistical properties, these regions ma y ha v e differen t critical bit depths. Such data can be compressed b y separating regions ha ving differen t bit depths. This phenomenon o ccurs frequen tly in photographs since brighter regions tend to be enco ded using more significant bits, requiring fewer leading bits. Brigh ter regions th us tend to hav e lo w er critical depth than darker regions whose signal is enco ded using less significant bits. Dark er regions require a greater n um b er of leading bits, but their leading zeros are highly compressible. The simplest w ay to accomplish this separation, p erhaps, is to divide the original data into rectangular blocks (see the example) and ev aluate eac h blo ck’s 15 critical depth separately . This is suboptimal for a couple of reasons - one, regions of complex data having different bit depths are rarely p erfect rectangles; tw o, normalization or other phenomena can lead to p erceptible b oundary effects at the junctions of blocks. F or this reason, w e dev elop a means of masking less intense signals for sub- sequen t enco ding at a higher bit depth. In this w a y , the notion of bit depth will b e refined - by ignoring leading zeros, the critical bit depth of the data b ecomes the measure of an optimal num ber of significant figures (of the binary fraction 2 − x = 0 .x ) for sampled amplitudes. Ideally , we w ould like to enco de the low-amplitude signals at a higher bit depth (given their higher compressibility) while we make a lossy appro ximation of the F ourier transform of the perio dic noise. If a statistical model is a v ailable for this appro ximation, w e use this mo del for the lossy co ding, otherwise, a lossy data compression algorithm is employ ed. Giv en the original data, it is easy to distinguish lo w-amplitude signals from truncated noise - if the original amplitude is greater than the noise flo or, a pixel falls into the latter category , otherwise, the former. This allows us to create a binary mask function M d asso ciated with bit depth d, it is 0 if the amplitude of the original data sample exceeds the noise floor, and 1 otherwise: M n ij = 0 if A n ij ≥ 2 d ; M n ij = 1 if A n ij < 2 d . (20) This mask acts lik e a diagonal matrix that left-multiplies a column vector represen tation of the image A d ij . The resulting signal M d ij A d ij preserv es regions of non-truncated lo w-in tensit y signal while zeroing all all other amplitudes. Its complemen t, NOT M d ij = ¯ M d ij acts on the noise function to preserve regions of p eriodic truncated noise while zeroing the low-in tensit y signal. It is also helpful to consider the literal description length of the samples contained in this region, its bit depth times the n um ber of ones app earing in M n : ( d − n ) tr ace ( M n ), as w ell as the complexit y of the en tire signal, K ( M d ij A d ij ), which includes the shape of the region, since this is additional information that needs to b e represented. W e may now describ e an algorithm that calculates critical depths while sep- arating regions of low-in tensit y signal. This pro cedure truncates some n umber (the bit depth) of trailing digits from the original signal, separates truncated regions ha ving only leading zeros, and calculates the complexity of the reduced and mask ed signal plus the complexit y (calculated via recursion) of the excised lo w-intensit y signal at its critical depth. Once this is done, it pro ceeds to the next bit depth, pro vided that the maximum depth has not yet b een reached. Starting with shallo w representations ha ving only the most significant bits (n=0 or 1, t ypically), w e truncate the data to depth n, resulting in the truncated represen tation of the signal A n , as w ell as its truncated residual (previously ’noise’) function, whic h w e will call B n . At this p oint, the initial truncated signal A n is compressed using lossless metho ds, while the mask and its complement are applied to B n . This results in a residual signal, S n = M n B n = M n A d ij (for these pixels, B n agrees with the original data A d ) as well as a complementary residual p erio dic noise function N n = ¯ M n B n . Since it con tains only residual 16 noise, taken mo dulo some p ow er of tw o, the noise N n is compressed using lossy metho ds that are typically based on F ourier analysis. The residual signal S n b ecomes input for the next iteration. The pro cedure iterates using a new A n +1 that is a truncation of the mask ed signal S n , as opp osed to the original image. Let the notation T n represen t an op erator that truncates amplitudes to bit depth n. In this notation, A n +1 = T n +1 S n , and its residual function is B n +1 = A n − A n +1 . A new mask M n +1 is determined from A n +1 . Using the new mask, we pro duce a new residual signal, S n +1 = M n +1 B n +1 , and a new residual noise, N n +1 = ¯ M n +1 B n +1 . A n +1 is compressed and stored using lossless metho ds, while N n +1 is compressed and stored using lossy metho ds, and the pro cedure iterates to the next v alue of n, using S n +1 as the new signal pro vided that additional bits exist. If the maxim um bit depth has b een reached, there can b e no further iteration, so B n is stored using lossy methods. Though the separation of signal and noise is now iterative, the criterion for critical depth has not changed, only the A n that app ears in their defi- nition. If K ( A n ) − K ( A n +1 ) is nearly maximal - its largest p ossible v alue is the literal length, tr ace ( M n ) - the first-order depth has b een reached; if K ( A n − 1 ) − 2 K ( A n ) + K ( A n +1 ) is nearly maximal, the second-order critical depth has b een reached. Once the desired depth is reached, the iteration may break, discarding S n +1 and N n +1 and storing B n using lossy methods. If higher compression ratios are desired, more bits can b e truncated and mo deled statistically or with lossy methods. How ev er, the signal in troduced to the noise function in such a manner might not fit simple statistical mo dels, and the loss of compressible signal tends to in terfere with inference. 4 Critical Scale Since it relates an image’s most significant bits to imp ortant theoretical notions suc h as Kolmogoro v minimal sufficien t statistic and algorithmic en trop y , critical bit depth is the canonical example of critical data represen tation. One could reorder the image data to define a truncated critical scale, simply sampling ev ery n th p oin t, how ev er, this discards significan t bits, which tends to in troduce aliasing artifacts dep endent on the sampling frequency and the frequency of the underlying signal. These considerations are the topic of the celebrated Nyquist- Shannon sampling theorem - essen tially , the sampling frequency m ust b e at least t wice the highest frequency in the signal. This is kno wn as the Nyquist rate, as it w as stated b y Nyquist in 1928[11] before finally b eing prov ed b y Shannon in 1949[14]. As a result of the Nyquist-Shannon theorem, a downsampling operation should incorp orate a low-pass filter to remov e elements of the signal that would exceed the new Nyquist rate. This should o ccur prior to the sampling op eration in order to satisfy the sampling theorem. T o complicate matters further, ideal- ized filters can’t be attained in practice, and a real filter will lose some amoun t of energy due to the leak age of high frequencies. A low-pass filter based on a 17 discrete F ourier transform will exhibit more high-frequency leak age than one based on, for example, polyphase filters. Since sampling is not the topic of this pap er, we will simply refer to an idealized sampling op erator B that applies the appropriate lo w-pass filters to resample data in one or more dimensions. The abilit y to perform complexity-based inference on a common scale is imp ortan t since it allows the identification of similar ob jects, for instance, at differen t levels of magnification. Critical scale is useful as it provides another degree of freedom along which critical p oints may b e optimized, analogous to phase transitions in matter that depend on both temp erature and pressure. Occasionally , the tw o ob jectiv es may b e optimized simultaneously at a ’triple p oin t’ that is critical for b oth bit depth and scale. W e now define the critical scale, which w e define in terms of op erators whic h resample the image instead of truncating it. F or some data, a minimal sufficient statistic for scale cannot b e reliably selected or interpreted, and hence a critical scale can’t be determined. Consider the critical scale of an image at a particular bit depth d , whic h ma y or ma y not be the original bit depth of the image. Let the linear operator B r,s represen t a resampling ope ration, as describ ed ab ov e, applied to an image with a spatial p erio d of r in the x dimension and a p erio d of s in the y dimension. It’s action on X d i,j is a i/r by j /s matrix of resampled amplitudes. This op erator giv es us tw o p ossible approaches to scaling. On one hand, giv en divisibility of the appropriate dimensions, w e may v ary r and s to re- sample the image linearly . On the other hand, we ma y also apply the op erator rep eatedly to resample the image geometrically , giv en divisibilit y of the dimen- sions by p ow ers or r and s. The former may iden tify the scale of v ertical and horizon tal comp onents separately , and the latter identifies the ov erall scale of the image. W e will consider first o v erall scale, using the iterated op erator, and then the horizon tal and vertical components. B n r,s , then, is the result of applying this op erator n times. Let the set used b y the structure function, A n , contain all the images whose m leading bits agree with those of B n r,s X d i,j : A n ≡ { Y m ij : Y m ij = B n r,s X m ij , m ≤ d } (21) Note that in this case, unlik e the critical bit depth, A n is an a v eraging whic h is not necessarily a prefix of the original image. The original image has ij d bits. The reduced image has dij ( rs ) n bits. W e ma y now write the first-order critical scale n 0 parameterizing the minimal sufficient statistic A n 0 , an expression unchanged from the previous case: n 1 = arg max I ( n ) = arg max 2 ln 2( K ( A n +1 ) − K ( A n )) 2 , 0 < n < d (22) If higher compression ratios are needed, additional signal ma y b e discarded, as described previously . The expression for the second-order critical scale is also unc hanged: n 2 = arg max J ( n ) = arg max K ( A n +1 ) − 2 K ( A n ) + K ( A n − 1 ) , 0 < n < d (23) 18 As men tioned previously , the repeated application of a veraging op erators is not alwa ys appropriate or possible. W e will consider linear scaling parameterized along the horizontal axis, with the understanding that the same op erations may b e applied to the vertical axis, or to an y other index. As such, we equate the parameter n with the horizon tal factor r . The set A n then con tain all the images whose m leading bits agree with those of B n,s X d i,j : A n ≡ { Y m ij : Y m ij = B n,s X m ij , m ≤ d } (24) Note that this set may not b e defined for all n. Given this set, the expres- sions for the maximum Fisher information (the minimal sufficient statistic) and the maximum of the Hessian of Hartley information (the critical p oin t) do not c hange. If a signal is to compressed at some scale other than its original scale, then it will need to b e resampled to its original scale b efore b eing added to its de- compressed (lossy) noise function. Note than in this case, the resampled signal is not generally lossless. This smo othing of data may b e acceptable, how ev er, since it enables analysis at a common scale. 5 Multidimensional, Multi-c hannel Data W e no w consider critical bit depths and scales of m ultidimensional data. Instead of a t wo dimensional arra y con taining the amplitudes of an image, w e consider an arra y with an arbitrary n um b er of dimensions. As noted earlier, monophonic audio ma y be represen ted as a one dimensional arra y of scalar amplitudes, and video data ma y b e represented as a three dimensional arra y w hic h also has three c hannels. This generalizes the results of the previous tw o sections, which used the case of a tw o-dimensional image for illustrative purposes. Let X d 0 ...d v a 0 ...a m − 1 represen t a tensor of rank m + v . Its subscripts index coordi- nates in an m -index arra y whose v alues are v -dimensional v ectors. Each vector comp onen t is a d i -bit n umber. The sup erscripts index the bits in these num- b ers, ordered from most significant to least significant. W e will first determine its critical bit depths and then its critical scales. Let the set A n 0 ...n v con tain all p ossible tensors Y d a 0 ...a m − 1 whose whose n i leading bits agree with those of channel i in the original tensor X d 0 ...d v a 0 ...a m − 1 : A n 0 ...n v ≡ { Y b 0 ...b m − 1 a 0 ...a m − 1 : Y b 0 ...b m − 1 a 0 ...a m − 1 = X b 0 ...b m − 1 a 0 ...a m − 1 , b i ≤ n i ≤ d i } (25) Since there are multiple parameters inv olv ed in determining the first-order bit depth, a general tensor requires the use of the full Fisher-Rao metric, rather than a Fisher information: I ( n 0 ..n v ) ij ∼ ( K ( A n 0 ..n i +1 ..n v ) − K ( A n 0 ..n i ..n v ))( K ( A n 0 ..n j +1 ..n v ) − K ( A n 0 ..n j ..n v )) (26) Where the expectation v alue in the definition of I(t) becomes the identit y , as b efore. F or any particular parameter n k , I ( t ) takes on a maximum with resp ect 19 to some v alue that parameter. This v alue is the critical depth of c hannel k . Ho wev er, this does not necessarily indicate that the set of critical depths globally maximizes I(t). The global maximum o ccurs at some v ector of parameter v alues ~ n = ( n 0 , ..., n v ): ~ n 1 = arg max I ( n 0 ...n v ) ij , 0 < n i < d (27) If c hannels ha ving different depths are inconv enien t, a single depth ma y b e selected as b efore, using the one-parameter Fisher information of P ( X ) = 2 − K ( X ) : n 1 = arg max I ( n ) ij = arg max 2 ln 2( K ( A n +1 ) − K ( A n )) 2 , 0 < n < d (28) The second-order critical depth pro ceeds in a similar manner. The expected Hessian of Hartley information J ( ~ n ) ij b ecomes 2 ln 2 times ( K ( A ...n i +1 ... ) − 2 K ( A ...n i ... )+ K ( A ...n i − 1 ... ))( K ( A ...n j +1 ... ) − 2 K ( A ...n j ... )+ K ( A ...n j − 1 ... )) (29) Again, the maximum o ccurs at a vector of parameter v alues ~ n c = ( n 0 , ..., n v ): ~ n 2 = arg max J ( n 0 ...n v ) ij , 0 < n i < d (30) W e will now consider the critical scale of X d a 0 ...a m − 1 . Let the linear operator B i 0 ...i m − 1 represen t an idealized resampling of the tensor by a factor of i k along eac h dimension k . This op erator applies a lo w-pass filter to eliminate frequency comp onen ts that w ould exceed twice the new sampling frequency (the Nyquist rate 2 i k ) prior to sampling with frequency 1 i k . Let the set used b y the structure function, A n 0 ...n v , contain all the tensors whic h are preimages of B i 0 ...i m − 1 X d i,j , the rescaled tensor: A n 0 ..n v ≡ { Y b 0 ...b m − 1 a 0 ...a m − 1 : Y b 0 ...b m − 1 a 0 ...a m − 1 = B n i 0 ...i m − 1 X b 0 ...b m − 1 a 0 ...a m − 1 , m ≤ n ≤ d } (31) Giv en this new definition of A, the definition of first and second order critical depth do not change. The first-order critical scales maximize (or approximately maximize) the Fisher information: ~ n = arg max I ( n 0 ...n v ) ij (32) Lik ewise, the second-order critical scales maximize the exp ected Hessian of Hartley information: ~ n = arg max J ( n 0 ...n v ) ij (33) Alternately , a single scale parameter could be c hosen in eac h case: n 1 = arg max I ( n...n ) ij = arg max K ( A n +1 ) − K ( A n ) , 0 < n < d (34) n 2 = arg max J ( n...n ) ij = arg max K ( A n +1 ) − 2 K ( A n ) + K ( A n +1 ) , 0 < n < d (35) Hence, w e see that the definition of first and second order critical scale of a general tensor is iden tical to their definition for rank t w o images. 20 The ab o ve relations are idealized, assuming that K can b e ev aluated using p erfect data compression. Since this is not generally the case in practice, as discussed previously , the maxima of I and J may be discoun ted by some tolerance factor to pro duce the threshold of a set of effectively maximal parameter v alues. The maximum or minimum v alues within this set ma y b e chosen as critical parameters. In addition to multimedia data such as audio (m=1), images (m=2), and video (m=3), these relations enable critical compression and decompression, pattern recognition, and forecasting for many t ypes of data. 6 Mo deling and Sampling Noise W e now ha v e an approach to separate significan t signals from noise. Enco ding the resulting signal follows traditional information theory and lossless compres- sion algorithms. Enco ding the noise is a separate problem of statistical inference that could assume several v arian ts dep ending on the type of data inv olv ed as w ell as its observer. Regardless of the details of the implementation, the pro- gram is as follows: a statistical mo del is fit to the noise, its parameters are compressed and stored, and up on decompression, a sample is taken from the mo del. A lossless data compression scheme must enco de b oth a signal and its as- so ciated noise. How ev er, noise is presumed ergo dic and hence no more likely or representativ e than any other noise sampled from the same probability dis- tribution. Hence, a ’lossy’ p erceptual co de is free to enco de a statistical mo del (presuming that one exists) for the noisy bits, as their particular v alues don’t matter. This dramatically reduces the complexity of storing incompressible noise; its effectiv e compression ratio ma y approach 100% by enco ding relatively simple statistical mo dels. The most significant bits of the signal are compressed using a lossless en tropic co de; when the image is decompressed, samples are tak en from the mo del distribution to pro duce an equiv alen t instance of noise; this sampled noise is then added to the signal to produce an equiv alent image. As noted in the introduction, maximum lik eliho o d estimates corresp ond to sufficien t statistics[4]. Maximum likelihoo d estimation (MLE) has b een one of the most celebrated approaches to statistical inference in recent years. There are a wide v ariet y of probabilit y distribution functions and stochastic pro cesses to fit to data, and many sp ecialized algorithms ha ve been developed to optimize the lik eliho od. A full discussion of MLE is b eyond the scop e of this pap er, but the basic idea is quite simple. Ha ving computed a minimal sufficien t statistic, w e wish to fit a statistical mo del having some finite n um ber of parameters (such as momen ts of the distribution) to the noisy data. The parameter v alues leading to the most probable data are selected to pro duce the most likely noise model. Our data compression scheme stores these parameter v alues, compressed losslessly if their length is significan t, in order to sample from the statistical mo del when decompression occurs. Since different regions of data may ha v e different statistical properties, rather 21 than fitting a complex mo del to the entire noisy string, it may b e adv an tageous to fit simpler mo dels to lo calized regions of data. The description length of optimal parameters tends to b e prop ortional to the n umber of parameters stored. If a mo del contains to o many parameters, the size of their representation can approac h the size of the literal noise function, reducing the adv an tage of critical compression. When the image is decompressed, a sample is drawn from the statistical mo del stored earlier. The problem of sampling has also receiv ed considerable atten tion in recent years, due to its importance to so-called Mon te Carlo meth- o ds. The original Mon te Carlo problem, first solved b y Metrop olis and Hastings, dealt with the estimation of n umerical integrals via sampling. Since then, Mon te Carlo has become somewhat of a collo quial term, frequently referring to any al- gorithm that samples from a distribution. Due to the imp ortance of obtaining a random sample in such algorithms, Monte Carlo sampling has b ecome a rel- ativ ely developed field. Box-Muller is a simple option for sampling from the uniform distibution[8], which may b e transformed into any other distribution with a known cumulativ e distribution function. The Ziggurat algorithm[10] is a p opular sampling algorithm for arbitrary distributions. This algorithm pro vides reasonably high-p erformance sampling since the sequence of samples pro duced is kno wn to repeat only after a v ery large num b er of iterations. Psyc hological mo deling should b e incorp orated into the statistical mo dels of the noise comp onent rather than the signal, since this is where the ’loss’ o ccurs in the compression algorithm. Since noise can’t b e learned efficiently , differen t instances of noise from the same ergo dic source will typically app ear indistinguishable to a macrosc opic observer who makes statistical inferences. F urthermore, certain distinct ergo dic sources will app ear indistinguishable. A go od psychological model will con tain parameters relev an t to the p erception of the observer and allow irrelev ant quantities to v ary freely . It ma y b e adv an ta- geous to transform the noisy data to an orthogonal basis, for example, F ourier amplitudes, and fit parameters to a mo del using this basis. The particular model used will dep end on the type of data b eing observed and, ultimately , the nature of the observer. F or example, a psyc hoacoustic mo del might describ e only noise ha ving certain frequency c haracteristics. The lossy nature of the noise function also pro vides a medium for other applications, such as watermarking. Maxim um lik elihoo d estimation applies only when an analytic model of noise is a v ailable. In the absence of a mo del, the noise function may b e compressed using lossy metho ds, as describ ed previously , and added to the decompressed signal to reconstruct the original datum. The most ob vious obstacle to this pro cedure is the fact that lossy data com- pression algorithms do not necessarily resp ect the intensit y levels presen t in an image. F or example, high lev els of JPEG compression pro duces blo cking artifacts resembling the basis functions of its underlying discrete cosine trans- formation. Fitting these functions to data may result in spurious minima and maxima, often at the edges or corners of blo cks, which frequen tly exceeds the maxim um in tensit y of the original noise function b y nearly a factor of t w o. With the wa v elet transforms used in JPEG2000[1], the spurious artifacts are greatly 22 diminished compared to the discrete cosine transforms of the original JPEG standard, but still present, so a direct summation will p oten tially exceed the ceiling v alue allow ed b y the image’s bit depth. In order to use the lossy representation, the spurious extrema m ust b e a voided. It is not appropriate to simply truncate the lossy representation at the noise flo or, as this leads to ’clipping’ effects - false regularities in the noise function that take the form of artificial plateaus. Directly normalizing the noise function do es not p erform well, either, as globally scaling intensities below the noise flo or leads to an ov erall dimming of the noise function relative to the reconstructed signal. A b etter solution is to upsample the noise function, nor- malizing it to the maximum amplitude, and storing the maxim um and minim um in tensities of the uncompressed noise. Up on decompression, the noise function image is ’de-normalized’ (downsampled) to its original maxim um and minimum in tensities b efore b eing summ ed with the signal. This pro cess preserv es the relativ e in tensities betw een the signal and noise comp onents. Therefore, when constructing codes with b oth lossless and lossy comp onents, a normalized (upsampled) noise function is compressed with lossy methods, en- co ded along with its original bit depth. Up on decompression, the noise function is decompressed and re-normalized (do wnsampled) bac k to its original bit depth b efore being added to the decompressed signal. 7 Artificial In telligence Last, but not least, it is w orth noting that separating a signal from noise gener- ally impro v es mac hine learning and pattern recognition. This is especially true in compression-based inference. Complexity theory provides a unified frame- w ork for inference problems in artificial intelligence[9], that is, data compression and machine learning are essentially the same problem[3] of knowledge repre- sen tation. These sorts of considerations hav e b een fundamental to information theory since its inception. In recent years, compression-based inference exp erienced a reviv al follo wing Rissanen’s 1986 formalization[9] of minimal description length (MDL) inference. Though true Kolmogorov complexities (or algorithmic pre- fix complexities) can’t b e calculated in any prov able manner, the length of a string after entropic compression has b een demonstrated as a proxy sufficien t for statistical inference. T o da y , data compression is the central comp onent of man y working data mining systems. Though it has historically b een used to increase effective net work bandwidth, data compression hardware has improv ed in recent years to meet the high-throughput needs of data mining. Hardw are solutions capable of 1 gbps or more of Lemp el-Ziv compression throughput can b e implemented using to day’s FPGA arc hitectures. In spite of its utility in text analysis, compression-based inference remains largely restricted to highly com- pressible data suc h as text. The noise in trinsic to stochastic real-w orld sources is, b y definition, incompressible, and this tends to confound compression-based inference. 23 Essen tially , incompressible data is non-learnable data[9]; remo ving this data can improv e inference b ey ond the information-theoretic limits asso ciated with the original string. By isolating the compressible signal from its asso ciated noise, w e ha ve remov ed the obstacle to inference using the complexity of sto chastic data. Giv en impro v ed compressibility , the standard methods of complexity- based inference and minimum description length may b e applied to greater effect. By comparing the compressibility of signal components to the compressibilit y of their concatenations, w e may iden tify commonalities betw een signals. A full treatmen t of complexity-based inference is beyond the scope of this pap er (the reader is referred to the literature, particularly the b o ok by Li and Vit´ an yi[9]) but we repro duce for completeness some useful definitions. Given signal com- p onen ts A and B, and their concatenation AB, we may define the conditional prefix complexity K ( A | B ) = K ( AB ) − K ( B ). This quantit y is analogous to the Kullbac k-Leibler divergence or relative entrop y , and this allows us to measure a (non-symmetric) distance betw een t w o strings. Closely related to the problem of inference is the problem of induction or forecasting addressed by Solomonoff[9]. Briefly , if the complexity is K(x), then the universal prior probability M ( x ) is typically dominated by the shortest pro- gram, implying M ( x ) ≈ 2 − K ( x ) . If x is, for example, a time series, then the relativ e frequency of tw o subsequent v alues may b e expressed as a ratio of their univ ersal probabilities. F or example, the relative probabilit y that the next bit is a 1 rather than 0 is P = M ( x 1) M ( x 0) ≈ 2 K ( x 0) − K ( x 1) . Clearly , the ev aluation of univ ersal probabilities is crucially dep endent on compressibilit y . As suc h, sepa- rating signal from noise in the manner describ ed also improv es the forecasting of stochastic time series. Sometimes, one wishes to consider not only the complexit y of transforming A to B, but also the difficult y of transforming B to A. In the example presen ted, an image searc h algorithm, this is not the case - the asymmetric distances pro- duce b etter and more intuitiv e results. How ev er, if one wishes to consider the symmetrized distances, the most obvious might b e symmetrized sum of con- ditional complexities K ( A | B ) and K ( B | A ), D ( A, B ) = K ( AB ) + K ( B A ) − K ( A ) − K ( B ). This a veraging loses useful information, though, and many authors[9] suggest using the ’max-distance’ or ’picture distance’ D ( A, B ) = max { K ( A | B ) , K ( B | A ) } = max { K ( AB ) − K ( B ) , K ( B A ) − K ( A ) } . When im- plemen ting information measures, the desire for the mathematical conv enience of symmetric distance functions should b e carefully c hec k ed against the na- ture of the application. F or example, scrambling an egg requires significan tly few er interactions than unscrambling and subsequentl y reassembling that egg, and a reasonable complexity measure should reflect this. F or these considera- tions, as well as its man y con venien t mathematical prop erties[9] the conditional prefix complexit y is often the best measure of the similarit y or difference of com- pressible signals. Empirical evidence suggests that conditional prefix complexity outp erforms either the symmetrized mutual information or the max-distance for mac hine vision. The rev erse transformation should not usually b e considered 24 since this tends to ov erw eigh t lo w-complexity signals. W e will demonstrate an example sliding-windo w algorithm whic h calculates conditional prefix complexities K ( A | B ) b etw een a search texture, A, and ele- men ts B from a searc h space. The measure K ( A | B ) = K ( AB ) − K ( B ) is closely related to the universal log-probability that A will o ccur in a sequence giv en that B has already b een observed. Its minim um is the most similar search elemen t. It is in v ariant with resp ect to the size of elements in the search space and do es not need to b e normalized. Estimating the complexities of signal comp onents from the search space and the complexities of their concatenations with signal comp onen ts from the texture, we arrive at an estimate of K ( A | B ) which may b e effectiv ely utilized in a wide v ariet y of artificial intelligence applications. The first-order critical point represen ts the lev el at whic h all the useful infor- mation is present in a signal. At this p oin t, the transition from order to chaos is essen tially complete. F or the purp oses of artificial in telligence, w e wan t enough redundancy to facilitate compression-based inference, but alto to retain enough sp ecific detail to differen tiate b etw een ob jects. The second-order critical p oint targets the middle of the phase transition b et ween order and chaos, where the transition is pro ceeding most rapidly and b oth of these ob jectives can b e met. In the examples section, we will see that visual inference at the second-order critical depth outp erforms inference at other depths. F or this reason, second- order critically compressed representations p erform well in artificial intelligence applications. 8 Examples Ha ving describ ed the method, w e no w apply it to some illustrativ e examples. W e will start with trivial mo dels and household data compression algorithms, pro- ceeding to more sophisticated implementations that demonstrate the method’s p o w er and utility . These examples should b e regarded as illustrations of a few of the man y p ossible wa ys to implement and utilize t w o-part co des, rather than sp ecific limitations of this metho d. One cav eat to the application of complexity estimates is the fact that real- w orld data compression produces finite sizes for strings whic h contain no data, as a result of file headers, etc. W e will treat these headers as part of the complexit y of compressed represen tations when the ob jective of the compression is data compression, as they are needed to reconstruct the data. When calculating deriv atives of complexit y to determine critical points, this complexit y constan t do es not affect the result, as the deriv ativ e of a constan t is zero. It do es not affect the conditional prefix complexity , either, canceled by taking a difference of complexities. F or certain applications in artificial in telligence, ho w ev er, small fluctuations in complexity estimates can lead to large difference in estimates of probabili- ties. When the quality of complexit y estimates are imp ortant, as is the case for inference problems, w e will first compress empty data to determine the additiv e constan t asso ciated with the compression ov erhead, and this complexity con- 25 stan t is subtracted from eac h estimate of K(X). F ormally , the data compression algorithm is regarded as a computer and its ov erhead is absorb ed into this com- puter’s T uring equiv alence constant. This results in more useful estimates of complexit y which impro v es our ability to resolve lo w-complexit y ob jects under certain complexit y measures. First-order critical data compression represents a level of detail at which a signal is essentially indistinguishable from an original when viewed at a macro- scopic scale. W e will show that second-order critical data compression pro duces represen tations which are typically slightly more lossy but significan tly more compact. As mentioned earlier, any depth could p otentially b e used, splitting a t w o-part code sub ject to the constrain ts of the in tended application. 8.1 Examples of Image Compression Since images ma y be displa y ed in a pap er more readily than video or audio, w e first consider the second-order critical depth of a simple geometric image with sup erimposed noise. This is a 256x256 pixel gra yscale image whose pixels hav e a bit depth of 8. The signal consists of a 128x128 pixel square having intensit y 15 whic h is centered on a bac kground of intensit y 239. T o this signal we add, pixel b y pixel, a noise function whose in tensit y is one of 32 v alues uniformly sampled b et w een -15 and +16. Starting from this image, we take the n most significant bits of each pixel’s amplitude to pro duce the images A n , where n runs from 0 to the bit depth, 8. These images are visible in figure 1, and the noise functions that ha v e been truncated from these images are sho w cased in figure 2. T o estimate K ( A n ), which is needed to ev aluate critical depth, we will com- press the signal A n using the fast and p opular gzip compression algorithm and compress its residual noise function in to the ubiquitous JPEG format. W e will then progress to more accurate estimates using slo w er but more pow erful com- pression algorithms, namely , P AQ8 and JPEG2000. The results are tabulated b elo w, with n on the left and the size of gzip’s representation, the estimate of K ( A n ), in the righ t column. 0 0 1 1584 2 2176 3 13760 4 129200 5 282368 6 441888 7 659296 8 735520 The most significant bits enjo y higher compression ratios than the noisy bits. In addition to the relative smo othness of many interesting data, there are fundamental reasons (such as Benford’s la w and the law of large num bers) wh y leading digits should b e more compressible. T o estimate the Kolmogorov sufficien t statistic, w e w ould to compress the original image in the order of 26 the bits’ significance un til compressing an additional bit of depth increases the size of the representation just as muc h as storing that additional bit of depth without compression. If the data compression algorithm do esn’t see the image as b eing random (which is not the case here) w e would store bits until adding an additional bit increases the represen tation by a maximal or nearly maximal amoun t. A single image c hannel is second-order critical at depth n when K ( A n +1 ) − 2 K ( A n ) + K ( A n +1 ) is within some tolerance factor of its maximal v alue. W e select a 25 p ercen t tolerance factor, chosen somewhat arbitrarily based on the t ypical magnitude of complexity fluctuations. The depth n among this maximal set whic h has the minimum complexit y K ( A n ) is selected as the critical p oint. F or the given data, w e see that no other second difference is within 25% of the maxim um, n = 3. The first-order critical p oint, on the other hand, do esn’t o ccur un til the phase transition is estimated to be complete at n = 7. Figure 1: Nine images of a dark gray b ox on a ligh t gray background repre- sen ting the signal at bit depths of 0 through 8. The image at the upp er left has 27 all 8 bits, and the solid blac k image at the low er right represents the absence of an y signal. Note that depth 3, at middle right, is undergoing a phase transi- tion betw een the previous five noisy images and the next three smooth images. This is the second-order critical depth, the point of diminishing representational utilit y . Ha ving compressed the critical signal data, w e may no w fit a statistical mo del to the residual noise function, which may b e seen in figure 2. W e will assume noise whose intensit y function is discrete and uniformly distributed, as should b e the case. W e use maximum likelihoo d estimation to determine the parameters, whic h are simply its minimum and maximum v alues. Figure 2: Nine images representing the noise extracted from the signals illustrated in figure 1. The first-order critical depth is depth 3, so the full noise function may b e view ed at middle right. It is clear that b eyond this second- order critical depth, the signal of the image creeps bac k in to the noise function in the lo w er ro w. 28 If the maximum and minimum v alues of the uniform discrete distribution are a and b , the lik elihoo d of in tensity i in an y particular pixel is 1 b − a if a ≤ i ≤ b and zero otherwise. W e assume pixels are indep endent, so the likelihoo d of any particular noise pattern is simply the pro duct of the likelihoo ds of each pixel’s noise. T o use maxim um likelihoo d estimation, we v ary a and b in order to determine whic h of their v alues leads to the maxim um lik eliho o d. In practice, this can lead to v ery small n umbers that suffer from floating-p oin t errors, so it is customary to maximize the logarithm of likelihoo d, which is equiv alen t since the logarithm function is con vex. The log-lik eliho o d is simply a − b if a ≤ i ≤ b and infinity otherwise. This is summed o ver all 65536 pixels in the noise function and maximized. The first-order critical depth is 3, so the bit depth of the noise function is 5, meaning that the noise can p otentially take on one of 2 5 = 32 v alues. F or brevit y of presentation, we optimize by brute force, calculating noise function likelihoo ds for all p ossible a and b such that − 16 ≤ b < a ≤ 16. Executing this pro cedure, we see it recov ers the correct set of parameters: a = 0, b = 31. Note that this distribution has the same v ariance but a differen t mean from the noise generated for the test image. A more appropriate optimization algorithm should ha v e faster performance but the same result. W e hav e succeeded in applying second-order critical compression to the im- age. W e store 13760 bits of compressed signal, corresponding to the second-order critical depth of 3, and 8 bits for each of the parameters a and b calculated ab o v e. The compressed represen tation has 13776 bits, whereas the original im- age has 524288 bits and can’t b e losslessly compressed to such level without effectiv ely crac king the pseudorandom n um b er generator that w as used to pro- duce it. Second-order critical compression attains a compression ratio of 38 : 1 or 97 . 4%, and, as the reader ma y v erify , the result is v ery difficult for the h uman ey e to distinguish from the original image (try looking at the corner pixels) with- out a magnifying device. F or this reason, these images are referred to as b eing macroscopically equiv alen t; they are both microstates of the same macrostate. 29 Figure 3: The second-order critically compressed image (13776 bits), at top left, adjacent to the uncompressed original image (524288 bits), at top righ t, for comparison. The tw o images are practically indistinguishable to the nak ed eye. Below, a JPEG compressed image (104704 bits) is display ed for comparison purp oses. In addition to b eing almost eigh t times the size of the critically compressed image, correlations in the form of blurring are visible in the JPEG-compressed noise, resulting in a less crisp textural app earance and biased statistical properties. The previous example, a simple geometric signal in the presence of noise, w as constructed to show case the adv an tage of critical data compression. W e no w p erform a similar analysis using a color photograph. W e partition each of the image’s red, green, and blue channels into their most and least significant bits. The resulting channels ma y b e viewed below, three p er image. This time w e omit the no-signal (n=0 signal) image for brevit y , as the absence of a signal simply appears black. 30 Depths 8 and 7. 31 Depths 6 and 5. 32 Depths 4 and 3. 33 Depths 2 and 1. Figures 4-11: Signals derived from three indep endent channels of a color 34 photograph and truncated at depth n=8 through n=1, from upp er left to lo w er righ t, accordingly . In this case, the first-order critical depth of the green channel is 4, in the third ro w at left, how ev er, the first-order depth of the red and blue c hannels are 3, in the third row at right. Again, note that the critical depth separates complex, noisy patterns from simple, carto on-like ones. Depths 8 (solid white) and 7. 35 Depths 6 and 5. 36 Depths 4 and 3. 37 Depths 2 and 1. Figures 12-19: The noise truncated from the same signals, n=8 through n=1, 38 normalized to 100% in tensit y for easier viewing. Beyond the first-order critical depth of 4, signal features such as the outlines of trees and clouds creep back in to the image, starting with shado ws and other darkened regions, suggesting that the bit depth of these regions differs from that of the image as a whole. The brigh t blue sky is also at a differen t bit depth from the o v erall image, and it is also worth noting that even relatively insignifican t bits (n=4 and n=5) retain certain signals. Due to this sort of inhomogeneity , some cases and applications ma y b enefit from dividing data into blo cks (or more generalized regions) and ev aluating their critical depth/scale separately . W e are now ready to calculate the critical depth of the color image. F or sim- plicit y , we treat the red, green, and blue channels as b eing indep endent tensors. The image is 1280x960, so each bit of color depth corresp onds to 1228800 bits of data. It had b een previously compressed with the JPEG algorithm but this do esn’t matter for purp oses of illustration - when a more developed approach is ev aluated against the mean-squared error of JPEG2000, we will use uncom- pressed test images. The A n are again compressed using gzip un til compressing an additional bit of sample depth would increase storage requirements by more than 1228800 bits. W e will start with the red channel, shown below with n on the left and K ( A n ) on the righ t, in bits: 0 0 1 188592 2 494256 3 1102656 4 1735776 5 3343584 6 4835008 7 7774896 8 8085728 Allo wing a 25 p ercen t tolerance, the first-order critical depth occurs at n=7 and the second-order critical depth o ccurs at n=6. No w we consider the green c hannel: 0 0 1 121616 2 427232 3 1038880 4 1643968 5 3161216 6 4606128 7 7374720 8 7764240 Again, the first-order critical depth o ccurs at n=7 and the second-order critical depth occurs at n=6. Finally , consider the blue c hannel: 39 0 0 1 51904 2 328880 3 839072 4 1655376 5 2961680 6 4423184 7 7124752 8 7902688 The result is the same, the first-order critical depth o ccurs at n=7 and the second-order critical depth o ccurs at n=6. W e store a critically compressed rep- resen tation at the second-order critical depth of 6. Alternately , the complexity of all three c hannels can be considered sim ultaneously b y compressing the entire image. Ha ving determined the critical p oints and stored the asso ciated signal, we are ready to compress its residual noise function. The critical noise function is compressed using a JPEG algorithm to 134,732 bytes. The critical signal, compressed via gzip with all three channels in one file, o ccupies 1,495,987 bytes, whic h sav es 237,053 b ytes ov er compressing the channels separately . Combined, the critical signal and its residual noise o ccupy 1,630,719 bytes. The original image o ccupies 3,686,400 b ytes. As such, this simplistic implementation of critical compression leads to a compression ratio of just 2.26:1, how ev er, it is essentially indistinguishable (its mean-squared error is just 3.09) from the original image, as ma y be v erified below. 40 Figures 20 and 21: The critically compressed and decompressed image, ab o v e, and the original image, b elow. 41 The gzip algorithm used to estimate complexities to this p oint is t ypical of most lossless data compression in use to day , b eing optimized for sp eed rather than the highest p ossible compression ratios. Naturally , slow er but more effec- tiv e lossless compression will pro duce estimates closer to the true complexities, leading to better compression and impro v ed inference. In order to obtain highly compressed lossless codes, w e now switc h to another algorithm, P AQ8l, whic h trains and arithmetically codes a neural net whic h mak es linear combinations of nearby pixels or samples. In this case we enco de all three channels of the signal at each bit depth n into a file and apply P AQ using its maximum compression. In this case, since there are 3 channels at 1280x960, each bit of c hannel depth constitutes 1,228,800 bits of raw data. The corresp onding estimates of K ( A n ), in bits, are in the right column b elow: 0 14552 1 168912 2 328880 3 1279152 4 2397944 5 4015184 6 6332896 7 9211368 8 11844400 T o illustrate wh y Kolmogorov’s criterion of randomness do es not pro duce a minimal sufficient statistic in this case, we present the deriv ativ e (slop e) of complexit y with resp ect to literal description length. In this case, the slop e (whic h is simply ∂ t K ( A ) normalized b y leng th ( A ) to [0 , 1]) nev er reac hes 1 since even the least significant bits compress by a third or more. This indicates correlation betw een the three c hannels. The slop es are, ascending in n: n/a 0.0434 0.0893 0.2578 0.3035 0.4387 0.6287 0.7808 0.7143 This exhibits b ehavior typical of phase transitions, a sigmoidal form that rises from about 0.04 to o ver 0.7 as n rises from 0 to 8. Even so, the complexit y estimates are not p erfect. T o determine the first-order critical depth, we treat measuremen ts within a 25% tolerance of the maxim um v alue of 0.78084 - mea- suremen ts greater than 0.58563 - as elemen ts of the maximal set. This criterion is satisfied at depths 6, 7, and 8, so we select the minimum complexit y from this set. Hence, the first-order critical depth is 6. 42 By considering the second partial deriv ativ e of complexity , the slop e of the slop e function, using a central difference approximation, we may determine the critical p oin t at which the phase transition pro ceeds most rapidly . Since the phase transition is relativ ely broad, one migh t expect sev eral points to b e close to the maxim um rate. This is the case, as may be seen b elo w: n/a 0.0458 0.1686 0.0471 0.1352 0.1900 0.1521 -0.0666 n/a The maxim um (0.1900) o ccurs at depth n=5. If w e use 25% tolerance, as b efore, then the cutoff for the maximum set b ecomes 0.1425075, so its members o ccur at n=3, n=5, and n=6. The least complex element in this maximal set determines the second-order critical depth, whic h in this case is n=3. This differs significan tly from the result obtained using the lo w er compression levels of gzip, demonstrating the imp ortance of high-quality lossy co des in a critical compression sc heme. W e enco de the residual noise asso ciated with depth 3 using the JPEG2000 algorithm, whic h is generally regarded as b eing slo w er but higher in quality than JPEG. F or the purp oses of constructing critical co des, JPEG2000 has sup erior prop erties of con v ergence to the original image, as compared to JPEG. Using the Jasp er library to compress the noise function at 50:1, the length of our improv ed depth 3 second-order critical represen tation is shown b elow improv es to 258,061, while its mean-squared error is ab out 100, which is typical of broadcast images. The image is sho wn below, with the original for comparison. 43 Figures 22 and 23: Impro ved data compression leads to a b etter estimate of the second-order critical depth and a more economical representation. The 44 second order critically compressed and decompressed image (at depth 3) is ab o ve and the original image is b elow. This simple example shows that critical co des are comp etitive with the pre- v ailing algorithms for image compression. In the app endix, we will mak e a more rigorous determination of the mean squared errors of a v ariety of standard, uncompressed test images, showing that tw o part co des actually outperform JPEG2000 for man y types of images under this metric. F or images which are not traditional color photographs, the adv an tage of a critical representation is often significant, demonstrating that tw o-part co des could be utilized to impro ve the performance of a wide v ariety of applications. 8.2 Example of Video Compression W e will briefly demonstrate the compression of digital video using 30 uncom- pressed frames from the movie ’Elephant Dream’, whose masters are freely av ail- able. This movie w as rendered using computer-generated 3-D graphics, and as a result it has low algorithmic complexity as compared to typical real-world photographic sources. The frames were rendered using the Blender program at 1920x1080 resolution in 24-bit color. Since video compression pro ceeds in the same manner as image compression, the only difference being the extra dimension, we ma y simply interlace the 30 frames into one large (1920x32400) image and p erform tw o-part co ding as describ ed previously . Scanline m of image n is mapp ed to scanline 30 m + n of the in terlaced image. In theory , this do es negativ ely impact the compression p erformance, since each pixel has fewer neighbors, but we will see that the result nonetheless seems to outp erform existing video standards, execution speed not withstanding. One sligh t cav eat is the size of the interlaced image. The lossless data com- pressor (P AQ) ev en tually compresses the interlaced image, but lossy co ding (Jasp er JPEG2000) failed for the full noise function due to the image size. The noise functions were split in to t wo vertical partitions, compressed separately using JPEG2000 co ding, decompressed, and stitched back together b efore b e- ing recom bined with the lossless signal. A video of arbitrary duration can b e enco ded b y partitioning its conten t in to blocks in this manner. Naturally , the division of a video into blo cks should proceed suc h that more compressible con ten t is grouped together. Lossless compression (esp ecially at a reduced bit depth) is ideal for representing the redundancy that naturally arises from lack of motion in a video sequence. In an adaptive blo cking scheme, the duration of a blo c k takes adv an tage of this fact, extending farther in time for more redundant scenes, whic h often hav e less motion, and shortening the blo ck when relativ ely incompressible con tent is reached. Often, sharp decreases in compressibilit y along the time axis corresp ond to rapid c hange in con tent suc h as motion or a scene transition. W e plot the results of critically compressing the interlaced image b elow. Eac h line represents v arious levels of lossy co ding corresp onding to some partic- 45 ular signal depth. The first five depths are shown. Usually , low er depths hav e lo wer complexity and more error than higher depths, but this is not alw a ys the case. Since the video is computer-generated and has relativ ely little motion, its leading bits are highly compressible. Depths 1-4 hav e lossy compression at levels of 400:1, 200:1, and 100:1. Higher depths hav e less significant noise functions, so depth 5, the low est line, has undergone lossy co ding at rates of 1000:1 and 500:1. Since the depth five co des ha v e the desired quality lev el, subsequen t bit depths w ere not analyzed. 10 100 1000 100000 1e+006 1e+007 Mean Squared Error Compressed Size Compression P erformance, ’Elephan t Dream’, F rames 1000-1029 Since the clip tested has only 30 frames, results will not be compared in detail to existing algorithms at this time. It is worth noting, ho w ev er, that 1080p video generally needs more than the 1 megabyte p er second rate at which this tw o part co de achiev es high fidelity . The b est tw o-part co de (depth 5 with 1000:1 lossy co ding) is 1,179,977 b ytes long, whic h constitutes a 158:1 compression ratio, yet its mean squared error is only 13.77, making it indistinguishable to the naked eye. Benc hmarking b oth animated and photographic video conten t will b e the topic of a future study , ho wev er, the p erformance of this simplistic implemen tation suggests that animation would often b e b etter represented by using a t w o part co de (which could in some cases revert to pure lossless coding) than with con v en tional transformation-based lossy video co decs. Extending the metho d to rank 3 tensors using (for instance) motion JPEG2000 co ding would tend to increase the redundancy of lo cal information and hence compression p erformance. The underlying lossless co de could also b e extended to take explicit adv an tage of rank-3 tensors even though an idealized en tropic co de w ould automatically tak e adv an tage of this redundancy . 46 8.3 Example of Audio Compression As men tioned previously , con temp orary digital audio recordings are usually sam- pled ab ov e the Nyquist rate asso ciated with human hearing, 44100Hz b eing common in consumer applications. This is in contrast to images, where the Nyquist rate would b e half of the nanometer-scale wa v elength of visible light, b ey ond the resolution of most traditional optics. As suc h, audio signals can b e reliably resolv ed in the frequency domain, whereas most photographs cannot. As such, to compress audio, we divide the signal into some num ber of blo cks and calculate the spectrum of each blo ck by ev aluating its discrete F ourier trans- form, optionally using the fast F ourier transform if the blo c k size is a p o wer of t wo. W e then enco de a graph of each of these sp ectra in to an image ha ving heigh t one and width equal to the blo ck size and pro ceed using the techniques previously describ ed for t wo-part image co ding. Since wa v elets are a general- purp ose represen tation technique, they are also effective in represen ting the noise associated with sp ectral data. T o decompress audio, the lossless spectral signals are decompressed and summed with the decompressed lossy sp ectral noise functions. A discrete in- v erse F ourier transform is applied to each resulting sp ectrum to pro duce ap- pro ximations to the original time series of each blo ck. The blo cks are then concatenated in their original ordering. This results in an approximation to the original audio. As a simple example of the sup eriority of a sp ectral representation for au- dio co ding, we consider a trivial audio signal whic h is simply the interference b et w een tw o sinusoids, 441Hz and 450Hz, each having amplitude 0.5. The in- terference pattern rep eats with a frequency of 450 − 441 = 9 Hz, or ab out 3.26 time s ov er a duration of approximately 0.307 seconds. These divide the sampling frequency b y 100 and 98, respectively , and the F ourier sp ectrum is corresp ondingly simple. The graph of the sp ectrum has height one and width 13554, which is the n umber of samples in the clip. It is solid black except for t wo pixels (100,1) and (98,1) whic h are at 50% gray . First, w e will consider the time-domain represen tation. The complexities at depths 0-15 are: 47 66 2072 3754 4682 4177 3828 3627 3553 3506 3520 3529 3532 3532 3542 3544 3544 Note that in this case, higher bit depths are more redundant and low er bit depths are more complex, whic h inv erts the behavior exhibited b y pictures. Also note that the total redundancy (7.64:1) is only a little ov er twice what would b e expected from roughly 3.26 repetitions of any random signal. Let’s consider no w the sp ectral case, which we hav e represen ted as the 13544x1 image describ ed earlier, the spectrum downsampled to 8 bits. Its com- pression performance for depths 0-8 is giv en below: 122 132 132 132 132 132 132 132 132 In this case, compression performance is radically improv ed b y transforming in to frequency space. F or this purely sinusoidal construction, its 8-bit sp ectrum (whic h in this trivial case conv erts exactly to the 16-bit sp ectrum) compresses losslessly o v er 205:1, a v ast impro v ement ov er compression in the time domain. Because sine wa v es are eigenfunctions of the wa v e equation, tw o-part co ding of an audio sp ectrum often outp erforms the tw o-part co ding of audio wa v eforms or time series. Other phenomena sampled abov e their Nyquist frequency migh t b enefit from a similar transformation. 8.4 Example of Image P attern Recognition Critical signals are useful for inference for several reasons. On one hand, a critical signal has not exp erienced information loss - particularly , edges are 48 preserv ed b etter since b oth the ’ringing’ artifacts of non-ideal filters (the Gibbs phenomenon) and the influence of blo cking effects are b ounded by the noise flo or. On the other hand, greater representational economy , compared to other bit depths, translates in to sup erior inference. W e will no w ev aluate the sim ultaneous compressibility of signals in order to pro duce a measure of their similarity or dissimilarity . This will b e accom- plished using a sliding window whic h calculates the conditional prefix complexit y K ( A | B ) = K ( AB ) − K ( B ), as described in the earlier section regarding artificial in telligence. In order to b egin, w e must first decide how to com bine signals A and B into the sim ultaneous signal AB. When processing textual data, the classic solution w ould b e to concatenate the string representations of A and B. With image data, other solutions are conceiv ably viable. F or instance, the images could b e a veraged or in terlaced rather than simply concatenated. How ev er, numerical exp erimen ts reveal that simple concatenation results in sup erior compression p erformance. This translates naturally in to sup erior inference. W e will now calculate distance functions and conv ert them into pattern- sp ecific filters for purp oses of visualization. The dimensions (x by y) of the texture B and the matrix represen tation of its distance function D mn ( A, B ) are used as input to construct a filter f mn selecting regions of image A that matc h pattern B. In order to match the searc h space, the co ordinates of the distance function asso ciated with the sliding window is translated to the cen ter of the windo w. Each pixel in the filter assumes the v alue of one min us D mn ( A, B ), where m + d x 2 e , n + d y 2 e is the center of the windo w closest to that pixel. Since the distance function is not defined on the b oundaries of the image, the closest a v ailable distance function may not be a go o d estimate, and distance estimates on the b oundary should b e regarded as being appro ximate, or omitted en tirely . They are sho wn in the examples for demonstrative purp oses. Multiplying pixels in the image A by the filter ( f mn ( A, B ) A mn ) has the effect of repro ducing pixels that match the pattern while zeroing pixels that do not matc h. Applying the filter multiple times (or exponentiating it) will retain the most similar regions and deemphasize less similar regions. Alternately , one could apply a threshold to this function to pro duce a binary-v alued filter denoting a pixel’s mem b ership or non-mem bership in the pattern set. Using this visualization, we will see that the second order critical depth leads to b etter inference than the other bit depths. If to o muc h bit depth is used, there ma y b e enough data to iden tify perio dicit y where it exits, o v eremphasizing matc hes similar to particular instances in the texture. If bit depth is insuffi- cien t, man y samples b ecome equiv alen t to one another, leading to false p osi- tiv e matches. This notion is similar to the considerations inv olv ed in ’binning’ sparse data into histograms - if bins are to o large, corresp onding to insufficien t bit depth, the histogram is to o smo oth and useful information is lost. If the bins are to o small, corresponding to excess bit depth, then there aren’t enough statistics, leading to sample noise and significant error in the resulting statistics. Ideally , we wish to ha ve all the bit depth relev ant to inference without including the sup erfluous data that tend to confound the inference pro cess, and we will 49 demonstrate that this o ccurs near the second-order critical depth, as one might exp ect, giv en its represen tational econom y . W e will perform inference using the famous ’Lena’ test image, which is ’lena3’ among the W aterlo o test images. The image is 512x512 and has three channels of 8-bit color. As a simple example of image recognition, we will will crop a sample texture from the low er 12 rows of the image, leaving a 512x500 image to generate our searc h space. The searc h texture is tak en from a rectangle extending betw een co ordinates (85,500) and (159,511) in the original test image, using 0-based indexes, giving it dimensions of 75x12. W e wish to compare this texture (it samples the tassel attac hed to Lena’s hat) against our searc h space, the set of rectangles in the cropp ed image, by estimating the conditional prefix complexit y of the texture giv en the conten ts of eac h sliding window. F or reasons of computational exp ense, it may not b e p ossible to ev aluate complexit y at every p oin t in the search space. F or some applications, only the extrem um is of in terest, and nonlinear optimization techniques may be applied to search for this extremum. In the case at hand, ho w ever, we wish to visualize the distance function o v er the entire search space, so w e simply sample the distance function at regular interv als. In this example, w e will ev aluate the distance function at points having ev en coordinates. Though this exercise illustrates distance functions at each bit depth, which should mak e superior inference sub jectively apparent, w e also wish to estimate the second-order critical depth. This will demonstrate that the signal whic h we exp ect a priori to b e the most economical also leads to sup erior inference. W e will start by estimating the complexit y of the original 512x512 Lena image. F or bit depths n = 0 − 8, K ( A n ) is: 0 452 1 23515 2 43465 3 74632 4 118824 5 188461 6 284150 7 384018 8 482483 If w e allow a 25% tolerance factor within the maximum set, as b efore, we see that the first-order critical p oin t is at depth 6 and the second order critical p oin t is at depth 4. W e will see that inference at depth 4 outp erforms inference at lo w er or higher bit depths, as predicted. A sliding windo w is applied to the image to pro duce string B, and the condi- tional prefix complexity K ( A | B ) = K ( AB ) − K ( B ) is calculated. This is done for signals ha ving bit depths of 1 through 8. F or visibilit y , the resulting filter is applied to the image four times and the resulting image is normalized to 100% in tensity . The result follo ws. 50 Depths 1 and 2. 51 Depths 3 and 4. 52 Depths 5 and 6. 53 Depths 7 and 8. Figures 24-31: P attern search, depths 1-8. Depth 4 has fewer false p ositives than other depths as its greater economy translates in to superior inference. At lo wer depths, more false matches o ccur, since more of the image lo oks similar 54 at this depth. The full image at depth 8 has strong false matches and inferior p erformance ev en though it con tains all av ailable information, giving to o m uch w eight to bits whic h do not con tain useful information ab out the signal. This tends to ov erw eigh t, for instance, short and p ossibly irrelev an t literal matches. Signals at depths 5-8 also exhibit this phenomenon to a lesser extent. 9 Commen ts A critical depth (or other parameter, such as scale) represents ’critical’ data in tw o senses of the w ord: on one hand, it measures the critical p oint of a phase transition betw een noise and smoothness, on the other, it also quantifies the essential information conten t of noisy data. Suc h a p oin t separates loss- less signals from residual noise, which is compressed using lossy metho ds. The basic theory of using such critical p oin ts to compress numeric data has now b een developed. This theory applies to arrays of any dimension, so it applies to audio, video, and images, as w ell as many other t yp es of data. F urthermore, w e ha ve demonstrated that this hybridization of lossless and lossy co ding pro- duces comp etitive compression p erformance for all types of image data tested. Whereas lossy transformation standards such as JPEG2000 sometimes include options for separate lossless co ding mo des, a t wo-part code adapts to the data and smoothly transitions betw een the t w o t ypes of codes. In this w a y t w o-part co des are somewhat unique in b eing efficient for compressing b oth low-en trop y and high-en trop y sources. The optional in tegration of Maxim um Lik eliho od mo dels and Monte-Carlo- t yp e sampling is a significan t departure from deterministic algorithms for data compression and decompression. If sampling is employ ed, the decompression algorithm b ecomes stochastic and non-deterministic, potentially pro ducing a differen t result eac h time decompression o ccurs. The integration of statistical mo deling into such an algorithm enables tw o-part co des which are engineered for sp ecific applications. This can lead to muc h higher levels of application- sp ecific compression than can b e achiev ed using general-purp ose compression, as has been illustrated using a simple image corrupted by noise. The test images presen ted use a bit depth of 8 bits p er channel, as is standard in most of today’s consumer displa y technology . How ev er, having more bits p er sample (as in the proposed HDR image standard, for instance) means that the most significant bits represen t a smaller fraction of the total data. As such, the utilit y of a tw o-part co de is increased at the higher bit depth, since more of the less-significant bits can b e highly compressed using a lossy co de, while the significan t bits still use lossless compression. Lik ewise, high-con trast applications will benefit from the edge-preserving nature of a t wo-part co de. F requency-based metho ds suffer from the Gibbs’ phenomenon, or ’ringing,’ which tends to blur high-contrast edges. In the ap- proac h describ ed, this phenomenon is mitigated b y limited use of suc h metho ds. A t w o-part code should perform w ell in applications in which the fidelit y of high- con trast regions is important. 55 As suggested previously , a tw o-part co de can significantly outperform lossy transforms by man y orders of magnitude for computer-generated art work, car- to ons, and most t yp es of animation. The lo w algorithmic complexity intrinsic to suc h sources leads to efficiently coded signals. In most test cases, critical compression also outp erforms JPEG2000 by or- ders of magnitude for black-and-white images. Without the adv antage of sepa- rating color data into c hroma subspaces, the JPEG algorithms seem muc h less efficien t. F or this reason, tw o-part co des seem to outp erform JPEG co ding in man y mono c hrome applications. JPEG2000 do es p erform w ell for its intended purpose - generating a highly compressed represen tation of color photographs. F or most of the color test photographs, a tw o-part co de ov ertak es JPEG2000 at high quality lev els. The p oin t at which this o ccurs (if it do es) v aries by photograph. A t relatively low bitrates, JPEG2000 usually outp erforms a tw o-part co de, but usually b y less than an order of magnitude. All examples presented to this point were directly co ded in the RGB color space. Since the theory of tw o-part co des applies to an y array of n-bit integers, we could hav e just as easily p erformed analysis in the Y C b C r color space, lik e the JPEG algorithms, whic h often impro ves the redundancy apparen t in color data. In the second part of the appendix, R GB - space critical compression will be compared to Y C b C r -space critical compression for color photographs. One unique asp ect of tw o-part data compression is its ability to co de effi- cien tly ov er a wide v ariet y of data. It can efficiently code b oth algorithmically generated regular signals and stochastic signals from empirical data. The former tends to be p erio dic, and the random asp ects of the latter tend to exhibit v ary- ing degrees of quasip erio dicit y or chaos. How ev er, the creation of p erio dicit y or redundancy is essential to the comparison op eration - the prefix complexity in volv es concatenation, whic h b ecomes similar to repetition if the concatenated ob jects are similar. Concatenation can create p erio dicity from similarities, even if the ob jects b eing concatenated hav e no significant p erio dicity within them- selv es, as may be the case with data altered by noise. The inferential pow er of critical compression deriv es from its abilit y to compress p eriodicity whic h w ould otherwise be obscured by noise. In spite of its ultimately incalculable theoretical underpinnings, the human ey e intuitiv ely recognizes a critical bit depth from a set of truncated images. The mind’s ey e in tuitiv ely recognizes the difference b et ween noisy , photographic, ”real world” signals and smo oth, carto on-lik e, artificial ones. Human visual in telligence can also identify the effective depth from the noisy bits - it is the depth b eyond which features of the original image can be discerned in the noise function. Con versely , given a computer to calculate the critical p oint of an image, w e can determine its critical information conten t. Since noise can’t b e co ded efficien tly due to its en trop y , an effectiv e learner, h uman or otherwise, will tend to preferentially enco de the critical conten t. This le ads directly to more robust artificial intelligence systems which enco de complex signals in a manner more appropriate for learning. 56 10 Ac kno wledgemen ts This w ork w as funded en tirely b y the author, who would lik e to ac kno wledge his sister, Elizabeth Sco ville, and his parents, John and La w ana Sco ville. A paten t related to this w ork is p ending. References [1] T. Achary a and P . Tsai, Jp e g2000 standar d for image c ompr ession , Wiley , Hob ok en, NJ, 2005. [2] G.J. Chaitin, Algorithmic information the ory , Cambridge Univ ersit y Press, 1987. [3] T.M. Cov er, Elements of information the ory , Wiley , 1991. [4] R.A. Fisher, On the mathematic al foundations of the or etic al statistics , Phil. T rans. of the Ro yal So ciety of London Series A 222 (1921), 309–368. [5] M. Gell-Mann and S. Lloyd, Information me asur es, effe ctive c omplexity, and total information , Complexity 2/1 (1996), 44–52. [6] R. V. L. Hartley , T r ansmission of information , Bell System T echnical Jour- nal (July 1928), 535–? [7] J. Jackson, Classic al ele ctr o dynamics , third ed., John Wiley and Sons, New Y ork, 1999. [8] D. Knuth, The art of c omputer pr o gr amming, vol 2. , Addison-W esley , Read- ing, MA, 1998. [9] M. Li and P . Vit´ anyi, A n intr o duction to kolmolgor ov c omplexity and its applic ations , second ed., Springer-V erlag, New Y ork, 1997. [10] G. Marsaglia and W.W. Tsang, The ziggur at metho d for gener ating r andom variables , Journal of statistical softw are 5 (2000). [11] H. Nyquist, Certain topics in tele gr aph tr ansmission the ory , T rans. AIEE 47 (1928), 617–644. [12] J. Sco ville, On macr osc opic c omplexity and p er c eptual c o ding , [13] C.E. Shannon, The mathematic al the ory of c ommunic ation. , Bell Labs T ech. J. 27 (1948), 379–423,623–656. [14] , Communic ation in the pr esenc e of noise , Pro c. Institute of Radio Engineers 37 (1949), 10–21. [15] W.H. Zurek, Algorithmic r andomness and physic al entr opy. , Physical Re- view, Ser. A 40(8) (1989), 4731–4751. 57 11 App endix: Image Compression P erformance In the following plots, each solid line represents tw o-part co des having v arious lossy bitrates at a particular signal depth. The dotted lines show the error level at v arious bitrates of JPEG2000 co ding, these are also tw o-part co des at signal depth zero. 11.1 Univ ersit y of W aterloo T est Images The image rep ository maintained by the Universit y of W aterlo o’s fractal co d- ing and analysis group contains 32 test images. The collection includes a wide v ariety of conten t, with photographic and computer generated conten t in b oth color and blac k and white. Two part coding dominates direct lossy image cod- ing for the ma jority of these images, demonstrating the p ow er and versatilit y of critical data compression using tw o-part co des. The images which p erform b etter with direct lossy co ding are generally color photographs, with JPEG2000 ha ving its greatest adv an tage at low quality levels. Two-part codes seem to hav e an adv an tage for the other images, sometimes b y multiple orders of magnitude. 58 0.1 1 10 100 1000 10000 10000 100000 1e+006 Mean Squared Error Compressed Size Compression P erformance, W aterlo o Image ’Barb’ 0.1 1 10 100 1000 1000 10000 100000 Mean Squared Error Compressed Size Compression P erformance, W aterlo o Image ’bird’ 59 0.1 1 10 100 1000 10000 1000 10000 100000 1e+006 Mean Squared Error Compressed Size Compression P erformance, W aterlo o Image ’bridge’ 0.1 1 10 100 1000 10000 100000 1e+006 Mean Squared Error Compressed Size Compression P erformance, W aterlo o Image ’boat’ 60 0.1 1 10 100 1000 10000 1000 10000 100000 1e+006 Mean Squared Error Compressed Size Compression P erformance, W aterlo o Image ’camera’ 0.001 0.01 0.1 1 10 100 1000 1000 10000 100000 Mean Squared Error Compressed Size Compression P erformance, W aterlo o Image ’circles’ 61 0.001 0.01 0.1 1 10 100 1000 10000 1000 10000 100000 Mean Squared Error Compressed Size Compression P erformance, W aterlo o Image ’crosses’ 1e-005 0.0001 0.001 0.01 0.1 1 10 100 1000 10000 10000 100000 1e+006 Mean Squared Error Compressed Size Compression P erformance, W aterlo o Image ’france’ 62 0.1 1 10 100 1000 10000 10000 100000 1e+006 1e+007 Mean Squared Error Compressed Size Compression P erformance, W aterlo o Image ’clegg’ 0.1 1 10 100 1000 10000 10000 100000 1e+006 Mean Squared Error Compressed Size Compression P erformance, W aterlo o Image ’frog’ 63 0.1 1 10 100 1000 10000 1000 10000 100000 1e+006 Mean Squared Error Compressed Size Compression P erformance, W aterlo o Image ’goldhill1’ 0.1 1 10 100 1000 10000 10000 100000 1e+006 Mean Squared Error Compressed Size Compression P erformance, W aterlo o Image ’goldhill2’ 64 0.001 0.01 0.1 1 10 100 100 1000 10000 Mean Squared Error Compressed Size Compression P erformance, W aterlo o Image ’horiz’ 0.1 1 10 100 1000 10000 1000 10000 100000 1e+006 Mean Squared Error Compressed Size Compression P erformance, W aterlo o Image ’lena1’ 65 0.1 1 10 100 1000 10000 10000 100000 1e+006 Mean Squared Error Compressed Size Compression P erformance, W aterlo o Image ’lena2’ 0.1 1 10 100 1000 10000 100000 1e+006 Mean Squared Error Compressed Size Compression P erformance, W aterlo o Image ’lena3’ 66 0.001 0.01 0.1 1 10 100 1000 10000 10000 100000 1e+006 1e+007 Mean Squared Error Compressed Size Compression P erformance, W aterlo o Image ’frymire’ 0.1 1 10 100 1000 10000 1000 10000 100000 1e+006 Mean Squared Error Compressed Size Compression P erformance, W aterlo o Image ’library’ 67 0.1 1 10 100 1000 10000 10000 100000 1e+006 Mean Squared Error Compressed Size Compression P erformance, W aterlo o Image ’mandrill’ 0.1 1 10 100 1000 1000 10000 100000 Mean Squared Error Compressed Size Compression P erformance, W aterlo o Image ’mon tage’ 68 0.1 1 10 100 1000 10000 10000 100000 1e+006 Mean Squared Error Compressed Size Compression P erformance, W aterlo o Image ’moun tain’ 0.1 1 10 100 1000 10000 100000 1e+006 Mean Squared Error Compressed Size Compression P erformance, W aterlo o Image ’pepp ers2’ 69 0.1 1 10 100 1000 10000 100000 1e+006 Mean Squared Error Compressed Size Compression P erformance, W aterlo o Image ’pepp ers3’ 0.1 1 10 100 1000 10000 100000 1e+006 Mean Squared Error Compressed Size Compression P erformance, W aterlo o Image ’monarc h’ 70 0.1 1 10 100 1000 10000 10000 100000 1e+006 Mean Squared Error Compressed Size Compression P erformance, W aterlo o Image ’sail’ 0.001 0.01 0.1 1 10 100 1000 10000 Mean Squared Error Compressed Size Compression P erformance, W aterlo o Image ’squares’ 71 0.1 1 10 100 1000 10000 1000 10000 100000 Mean Squared Error Compressed Size Compression P erformance, W aterlo o Image ’text’ 0.01 0.1 1 10 100 1000 10000 10000 100000 1e+006 Mean Squared Error Compressed Size Compression P erformance, W aterlo o Image ’serrano’ 72 0.001 0.01 0.1 1 10 100 1000 1000 10000 100000 Mean Squared Error Compressed Size Compression P erformance, W aterlo o Image ’slope’ 0.1 1 10 100 1000 10000 10000 100000 1e+006 Mean Squared Error Compressed Size Compression P erformance, W aterlo o Image ’w ashsat’ 73 0.1 1 10 100 1000 10000 100000 1e+006 Mean Squared Error Compressed Size Compression P erformance, W aterlo o Image ’tulips’ 0.1 1 10 100 1000 10000 100000 1e+006 Mean Squared Error Compressed Size Compression P erformance, W aterlo o Image ’zelda’ 74 11.2 Ko dak Photo CD T est Images The metho d described w as applied to 24 uncompressed 24-bit photographic images from a sample Ko dak Photo CD. W e compare critical compression at v arious bitdepths in the RGB color space using P AQ8l and JPEG2000, as b efore, against a YCbCr-space enco ding whic h critically compresses a luma ( Y ) c hannel at v arious bitdepths using P AQ8l and the chroma channels ( C b and C r ) using JPEG2000. F or this transformation, the chroma parameters k b and k r are b oth equal to 1 3 , making the Y c hannel a simple av erage of the corresp onding red, green, and blue color v alues. The results (with R GB ab ov e and Y C r C b b elo w) sho w that while JPEG2000 retains the adv an tage at low to mo derate quality lev els, the critical luma/lossy c hroma Y C r C b sc heme is usually more efficient at mo derate to high qualit y levels than direct JPEG2000 coding or critical compression in RGB . 75 0.1 1 10 100 1000 10000 100000 1e+006 Mean Squared Error Compressed Size Critical R GB Compression P erformance, Kodak T est Image 1 1 10 100 1000 10000 10000 100000 1e+006 Mean Squared Error Compressed Size Critical Luma Compression P erformance, Kodak T est Image 1 76 0.1 1 10 100 1000 10000 100000 1e+006 Mean Squared Error Compressed Size Critical R GB Compression P erformance, Kodak T est Image 2 1 10 100 1000 10000 100000 1000 10000 100000 1e+006 Mean Squared Error Compressed Size Critical Luma Compression P erformance, Kodak T est Image 2 77 0.1 1 10 100 1000 10000 100000 1e+006 Mean Squared Error Compressed Size Critical R GB Compression P erformance, Kodak T est Image 3 1 10 100 1000 10000 10000 100000 1e+006 Mean Squared Error Compressed Size Critical Luma Compression P erformance, Kodak T est Image 3 78 0.1 1 10 100 1000 10000 100000 1e+006 Mean Squared Error Compressed Size Critical R GB Compression P erformance, Kodak T est Image 4 1 10 100 1000 10000 10000 100000 1e+006 Mean Squared Error Compressed Size Critical Luma Compression P erformance, Kodak T est Image 4 79 0.1 1 10 100 1000 10000 10000 100000 1e+006 Mean Squared Error Compressed Size Critical R GB Compression P erformance, Kodak T est Image 5 1 10 100 1000 10000 10000 100000 1e+006 Mean Squared Error Compressed Size Critical Luma Compression P erformance, Kodak T est Image 5 80 0.1 1 10 100 1000 10000 10000 100000 1e+006 Mean Squared Error Compressed Size Critical R GB Compression P erformance, Kodak T est Image 6 1 10 100 1000 10000 10000 100000 1e+006 Mean Squared Error Compressed Size Critical Luma Compression P erformance, Kodak T est Image 6 81 0.1 1 10 100 1000 10000 10000 100000 1e+006 Mean Squared Error Compressed Size Critical R GB Compression P erformance, Kodak T est Image 7 1 10 100 1000 10000 10000 100000 1e+006 Mean Squared Error Compressed Size Critical Luma Compression P erformance, Kodak T est Image 7 82 0.1 1 10 100 1000 10000 10000 100000 1e+006 Mean Squared Error Compressed Size Critical R GB Compression P erformance, Kodak T est Image 8 1 10 100 1000 10000 10000 100000 1e+006 Mean Squared Error Compressed Size Critical Luma Compression P erformance, Kodak T est Image 8 83 0.1 1 10 100 1000 10000 10000 100000 1e+006 Mean Squared Error Compressed Size Critical R GB Compression P erformance, Kodak T est Image 9 1 10 100 1000 10000 10000 100000 1e+006 Mean Squared Error Compressed Size Critical Luma Compression P erformance, Kodak T est Image 9 84 0.1 1 10 100 1000 10000 10000 100000 1e+006 Mean Squared Error Compressed Size Critical R GB Compression P erformance, Kodak T est Image 10 1 10 100 1000 10000 10000 100000 1e+006 Mean Squared Error Compressed Size Critical Luma Compression P erformance, Kodak T est Image 10 85 0.1 1 10 100 1000 10000 10000 100000 1e+006 Mean Squared Error Compressed Size Critical R GB Compression P erformance, Kodak T est Image 11 1 10 100 1000 10000 10000 100000 1e+006 Mean Squared Error Compressed Size Critical Luma Compression P erformance, Kodak T est Image 11 86 0.1 1 10 100 1000 10000 100000 1e+006 Mean Squared Error Compressed Size Critical R GB Compression P erformance, Kodak T est Image 12 1 10 100 1000 10000 10000 100000 1e+006 Mean Squared Error Compressed Size Critical Luma Compression P erformance, Kodak T est Image 12 87 0.1 1 10 100 1000 10000 10000 100000 1e+006 Mean Squared Error Compressed Size Critical R GB Compression P erformance, Kodak T est Image 13 1 10 100 1000 10000 10000 100000 1e+006 Mean Squared Error Compressed Size Critical Luma Compression P erformance, Kodak T est Image 13 88 0.1 1 10 100 1000 10000 10000 100000 1e+006 Mean Squared Error Compressed Size Critical R GB Compression P erformance, Kodak T est Image 14 1 10 100 1000 10000 10000 100000 1e+006 Mean Squared Error Compressed Size Critical Luma Compression P erformance, Kodak T est Image 14 89 0.1 1 10 100 1000 10000 100000 1e+006 Mean Squared Error Compressed Size Critical R GB Compression P erformance, Kodak T est Image 15 1 10 100 1000 10000 10000 100000 1e+006 Mean Squared Error Compressed Size Critical Luma Compression P erformance, Kodak T est Image 15 90 0.1 1 10 100 1000 10000 100000 1e+006 Mean Squared Error Compressed Size Critical R GB Compression P erformance, Kodak T est Image 16 1 10 100 1000 10000 10000 100000 1e+006 Mean Squared Error Compressed Size Critical Luma Compression P erformance, Kodak T est Image 16 91 0.1 1 10 100 1000 10000 100000 1e+006 Mean Squared Error Compressed Size Critical R GB Compression P erformance, Kodak T est Image 17 1 10 100 1000 10000 10000 100000 1e+006 Mean Squared Error Compressed Size Critical Luma Compression P erformance, Kodak T est Image 17 92 0.1 1 10 100 1000 10000 100000 1e+006 Mean Squared Error Compressed Size Critical R GB Compression P erformance, Kodak T est Image 18 1 10 100 1000 10000 10000 100000 1e+006 Mean Squared Error Compressed Size Critical Luma Compression P erformance, Kodak T est Image 18 93 0.1 1 10 100 1000 10000 10000 100000 1e+006 Mean Squared Error Compressed Size Critical R GB Compression P erformance, Kodak T est Image 19 1 10 100 1000 10000 10000 100000 1e+006 Mean Squared Error Compressed Size Critical Luma Compression P erformance, Kodak T est Image 19 94 0.1 1 10 100 1000 10000 100000 1e+006 Mean Squared Error Compressed Size Critical R GB Compression P erformance, Kodak T est Image 20 1 10 100 1000 10000 10000 100000 1e+006 Mean Squared Error Compressed Size Critical Luma Compression P erformance, Kodak T est Image 20 95 0.1 1 10 100 1000 10000 10000 100000 1e+006 Mean Squared Error Compressed Size Critical R GB Compression P erformance, Kodak T est Image 21 1 10 100 1000 10000 10000 100000 1e+006 Mean Squared Error Compressed Size Critical Luma Compression P erformance, Kodak T est Image 21 96 0.1 1 10 100 1000 10000 100000 1e+006 Mean Squared Error Compressed Size Critical R GB Compression P erformance, Kodak T est Image 22 1 10 100 1000 10000 10000 100000 1e+006 Mean Squared Error Compressed Size Critical Luma Compression P erformance, Kodak T est Image 22 97 0.1 1 10 100 1000 10000 100000 1e+006 Mean Squared Error Compressed Size Critical R GB Compression P erformance, Kodak T est Image 23 1 10 100 1000 10000 10000 100000 1e+006 Mean Squared Error Compressed Size Critical Luma Compression P erformance, Kodak T est Image 23 98 0.1 1 10 100 1000 10000 10000 100000 1e+006 Mean Squared Error Compressed Size Critical R GB Compression P erformance, Kodak T est Image 24 1 10 100 1000 10000 10000 100000 1e+006 Mean Squared Error Compressed Size Critical Luma Compression P erformance, Kodak T est Image 24 99
Original Paper
Loading high-quality paper...
Comments & Academic Discussion
Loading comments...
Leave a Comment