A Characterization of the Combined Effects of Overlap and Imbalance on the SVM Classifier
In this paper we demonstrate that two common problems in Machine Learning---imbalanced and overlapping data distributions---do not have independent effects on the performance of SVM classifiers. This result is notable since it shows that a model of e…
Authors: Misha Denil, Thomas Trappenberg
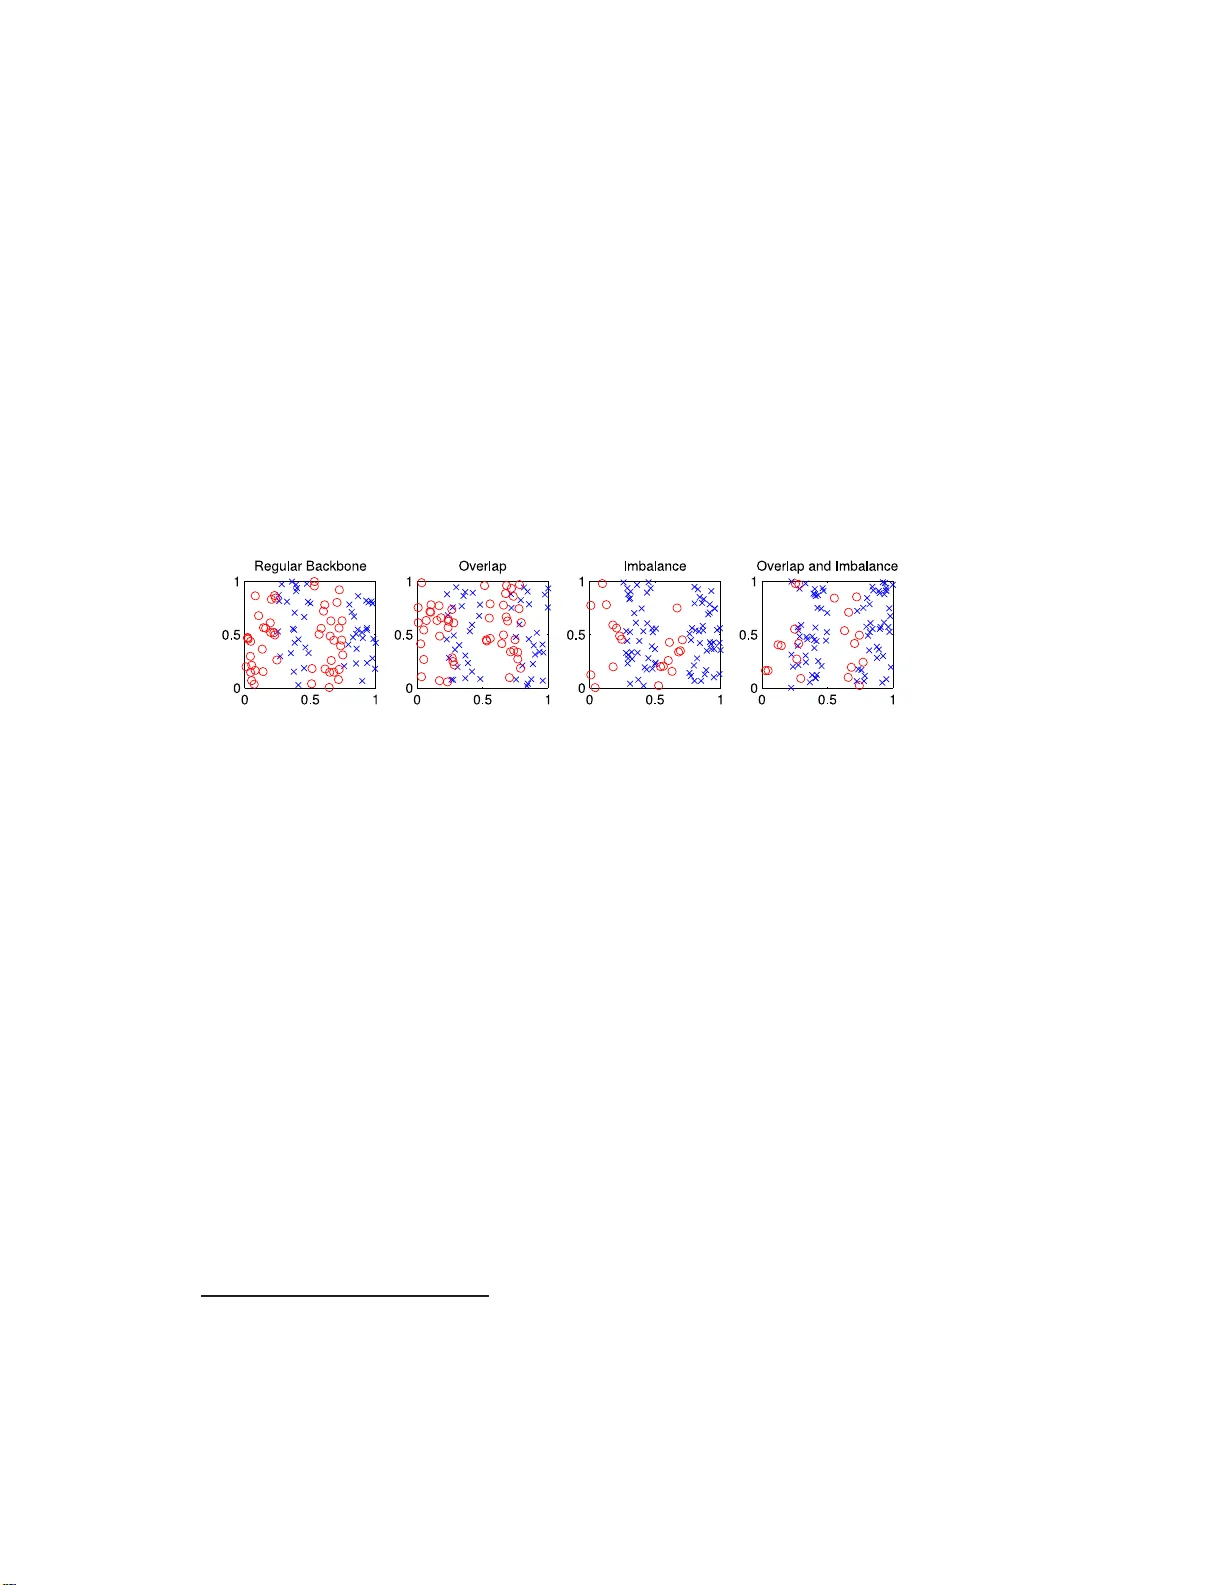
A Characterization of the Com bined Effects of Ov erlap and Im balance on the SVM Classi fier Misha Denil and Thomas T rapp en b erg Dalhousie Universit y 1 denil@cs .dal.ca 2 tt@cs.da l.ca Abstract In this pap er we demonstr ate tha t t wo common problems in Ma- chine Learning—imbalanced a nd ov erlapping data distr ibutions—do not have indep e ndent effects on the p erforma nc e of SVM classifier s. This re s ult is notable since it shows that a mo del of either of these factors must account for the presenc e of the o ther. Our study o f the relationship betw een these problems has lead to the discovery of a pr e- viously unrep or ted form of “cov e r t” ov erfitting which is resilient to commonly used empir ic al r egulariza tion tec hniques. W e demonstrate the existance of this cov ert phenomenon through several metho ds based around the parametric reg ularization of trained SVMs. Our findings in this area suggest a p ossible a pproach to qua nt ifying overlap in rea l world data s e ts. 1 In tro duction A data s et is imbala nced when its elemen ts are n ot ev enly d ivided b etw een the classes. In practical app lications it is not u ncommon to see v ery high im b alance, w h ere upw ards of 90% of the a v ailable training d ata b elong to only one class. Ov erlap is another common pr oblem, wh ic h o ccurs when there are regions of th e data space wher e the p osterior class distribu tions are near equal, eve n when the p riors are known with certain ty . In these cases it is difficult to mak e a p r incipled decision on ho w to divide the v olume of these regions b et wee n the classes. 1 Although the ov erlap and imbalance p roblems ha v e b een stud ied pr evi- ously , (see Bosc h et al. [6]; Jap ko wicz and Stephen [10]; Akbani et al. [1]; Batista et al. [3]; Y aoh ua and Jingh uai [17] f or some r epresen tativ e works in this area), work on eac h p roblem has happ en ed largely in isolation. Some authors (e.g. Aud a and Kamel [2]; Visa and Ralescu [16]; Pr ati et al. [14]; and Batista et al. [4]) ha v e p er f ormed exp eriments in the presence of b oth factors; ho w ev er, the n ature of their in teraction is s till not we ll under s to o d. Our fin ding that their effects are not in dep end en t is an imp ortant step to- w ard s a characte rization of how these factors affect classifier p erformance. W e prop ose that the b eha viour observ ed in the com bined case can b e explained by phen omenon we call “co v ert” o verfitting. Cov ert o v er fi tting is similar in principle to regular o verfitting, but the ambiguities w hic h lead to o verfitting are pr esent in the generativ e distribu tions of the classes, rather than just in the tr aining set. This complication ensu res that standard em- pirical regularization tec h niques, such as cross v alidati on, or us ing a separate v alidation set for testing, are not able to d etect this phenomenon. W e explore this problem in detail, and offer seve ral d emonstrations of its o ccurrence, in the later s ections of this pap er. In the firs t p art of this pap er we explore h o w the Supp ort V ector Ma- c hin e (SVM) classifier p er f orms when faced with o verlapping and im balanced data s ets. In cont rast to pr evious work in this area, w e d ir ectly add ress the question of h o w th e relationship b etw een these factors affects classifier p er- formance. A k ey r esu lt of th is w ork is that the effects from these factors are not indep endent . W e sho w th at, although neither factor acting alone has an unexp ectedly strong effect, the pr esence of ov erlap and im b alance together causes p erf ormance degradation wh ic h is more s evere than we are lead to exp ect by considering them indep end ently . This is an extension of our previous work on the o verla p and imbal ance pr oblems in Denil and T rap- p enber g [7], but go es b eyond it by offering an explanation and app lication of the com bined effects. W e also demons tr ate ho w different signatures of these effects migh t b e u sed as to ols to measure o v erlap in real world data. 2 Data and Exp erimen tal Setup W e b uild our analysis around a series of synthetic data s ets in the f r om of t wo dimen s ional “bac kb one” mo dels. T o generate a data set w e sample p oint s form the region [0 , 1] × [0 , 1]. The range along one dimension is divided in to four regions with alternating class mem b ersh ip, (t wo regions for eac h class), while the tw o cla sses are indistinguishable in the other dimens ion 2 (see Figure 1). T hese domains mak e a go o d candidate for study since they are r elativ ely simple, b oth to visualize and to und erstand, yet the optimal decision b oundary is sufficien tly non-linear to cause inte resting effects to emerge. The main problems we discuss in this p ap er often do n ot app ear in v ery simple d omains; we h a ve c h osen our mo dels to b e su fficien tly complex to demonstrate th e issues at hand. Throughout this p ap er it will b e necessary for us to h a ve a parame- terizatio n of th e o verlap and im b alance levels present in a particular data set. This will allo w us to study classifier p erformance with resp ect to these parameters and to form u late a mo d el of how they affect p erformance. Figure 1: Samp le b ac kb one mo d els in t w o d imensions. W e parameterize the o ve rlap lev el with µ ∈ [0 , 1] suc h th at wh en µ = 0 the t wo classes are completely separable and wh en µ = 1 b oth classes are distributed uniformly across the entire d omain. In termediate v alues of µ indicate o verlap along the region b oundaries. The im balance level, w hic h w e d enote α ∈ [0 . 5 , 1], is measur ed as the prop ortion of the data set b elonging to th e ma jorit y class. 1 When there is im b alance, we alwa ys tak e the second class as the ma jorit y class; h ow ev er, since the class distributions are symm etric, in these mo dels the distinction b et w een “first” and “second” is somewhat arbitrary , h ence our decision to consider only the degree of im balance and ignore which p articular class is present in the ma jorit y . Using this sc h eme, we generate a series of data sets for eac h collec tion of exp erimen ts by v arying one, or b oth, of th e a v ailable parameters. Unless otherwise indicated, all our exp erimen ts are rep eated u sing training sets of sev eral different sizes v arying (logarithmically) b et w een 25 and 6400 exam- ples (although in the in terest of saving space w e rep ort only a subs et of these results). T esting is done using newly generated data sets of the appropriate im b alance lev el, ov erlap lev el and s ize. 1 W e only consider α ≤ 0 . 95 in our exp eriments since, by this parameterization, α = 1 corresponds to a data set with only one class p resen t. 3 W e assess classifier p erformance u sing the F 1 -score of the classifier trained on eac h data set, wh ere the minority class is tak en to b e p ositiv e. The F 1 - score is the harmonic mean of the precision and recall of a classifier and is a commonly used scalar measurement of p erform ance. Our choic e of p ositiv e class reflects th e state of affairs present in man y real world problems where it is difficult to obtain samples from the class of in terest. The F 1 -score is one of the family of F β -scores and treats precision and recall as equally imp ortant. Our exp eriments here fo cus on the SVM classifier with an RBF k ernel. In all cases parameter selection for the SVM was carried out using the sim ulated annealing pro cedure describ ed in Boardman and T rapp en b erg [ 5] to select optimal v alues for C and γ . 3 Ov erlap and Im b alance in Isolation In this sectio n w e look at h o w o v erlap and im balance in isolation affect clas- sifier p erformance. The pur p ose of this section is to provide some baseline results which will inform our analysis of the com b ined effects in Section 4. 3.1 Im balance This section shows a series of exp eriments usin g v arying lev els of im balance. W e confirm p revious r esu lts f rom Japk o wicz and Stephen [ 10], which indicate that im balance in isolatio n is not sufficien t to degrade p erformance. This suggests that p o or p erf orm ance on imbalanced data sets is caused by other factors such as small d isjuncts. (F or a discussion of why th e im b alance problem is b est viewe d as an instance of the small disjunct problem see Japk o wicz and S tephen [10], Japko wicz [9], and J o an d Japko wicz [11]). P erf ormance results from our exp erimen ts are sho w n in Figure 2(a). When the training set size is large we observ e that the im balance leve l has v ery little effect on the classifier p erformance. P erformance is only affected when either the im balance lev el is v ery high (and then only sligh tly), or when there are v ery few trainin g data. This is exactly what we exp ect from the existence of small d isjuncts in these domains. Th e influence that the training set size has on p erformance can b e seen explicitly in Figure 2(c). In add ition to th e F 1 -scores, we also recorded the num b er of supp ort v ectors from eac h ru n as a measure of the complexit y of the trained mo d els. Figure 2(b) sh o ws the prop ortion of th e training set retained as sup p ort v ectors and that th e imbalance level has n o visible adv erse effec t on the complexit y of th e SVM solution. In fact, there is a slight d rop in complexity when the imbalance lev el is v ery h igh; ho wev er, at high lev els of imbalance 4 0.5 0.725 0.95 0 0.5 1 Performance vs. Imbalance Level Imbalance Level F−score N = 100 N = 800 N = 6400 (a) 0.5 0.725 0.95 0 0.5 1 Complexity vs. Imbalance Level Imbalance Level SV Proportion N = 100 N = 800 N = 6400 (b) 25 400 6400 0 0.5 1 Imbalanced Performance vs. Training Set Size Training Set Size F−score α = 0.50 α = 0.72 α = 0.95 (c) Figure 2: Imbalance in isolation. (a) Sho ws the SVM p erformance ov er a range of im balance lev els. (b) Sho ws the solution complexit y ov er the same range. (c) Shows ho w p erformance v aries with training set size at v arious lev els of im balance. In eac h case N is the n umber of training data used. Error bars show one standard deviation ab out th e mean ov er 10 trials. N is the num b er data in the training and test sets. there are v ery few training data av ailable to supp ort the minority sid e of the b oundary . This interpretatio n is sup p orted by the fact that as the training set size increases the ov erall p r op ortion that is r etained drops , and the complexit y redu ction at high im b alance lev els b ecomes less app aren t. The ma j or conclusion th at w e can dra w h ere is that imbalance in isolat ion has no adv erse affect on the SVM classifier, pro vided th at the training set is su ffi cien tly large. The redu ced p erform ance we see when the training set is small can b e attribu ted to the fact th at there are not suffi cien tly man y minorit y examples to infer the class d istr ibution. This is confi rmed by th e fact th at with a large training set th e p erformance is excellen t, ev en on highly im balanced domains. 3.2 Ov erlap In con trast to the im balance problem, the effects of ov erlap are not well c haracterized in the literature (although previous work on the problem can b e fou n d in Visa and Ralescu [16]; P r ati et al. [14]; and Y aohua and Jingh uai [17]). W e use th is section to demonstrate that ov erlapping classes cause th e SVM to learn decision b oundaries whic h lac k p arsimon y . Figure 3(a) sho ws p er f ormance results with resp ect to o verlap lev el f or a selection of training set s izes, with the explicit relationship b et ween training set s ize and p erformance app earing in Figure 3(c). The exp eriment s whic h pro du ced th ese data follo w the same pr o cedure as those fr om Section 3.1, 5 but here we v ary the o v erlap lev el in s tead of the imbalance. As in the case of imbalance, w e s ee that v ery small training sets tend to cause degraded p erformance; ho wev er, in this case the effect is muc h weak er and b ecomes less p r onounced as the o v er lap lev el is increased (see Figure 3(c)). This indicates th at, un lik e the case of imbala nce, when the ov erlap lev el is high, it is unlikel y that collecting more tr aining data will pro d uce a more accurate classifier. 0 0.5 1 0 0.5 1 Performance vs. Overlap Level Overlap Level F−score N = 100 N = 800 N = 6400 (a) 0 0.5 1 0 0.5 1 Complexity vs. Overlap Level Overlap Level SV Proportion N = 100 N = 800 N = 6400 (b) 25 400 6400 0 0.5 1 Overlap Performance vs. Training Set Size Training Set Size F−score µ = 0.00 µ = 0.49 µ = 1.00 (c) Figure 3: Ov erlap in isolation. (a) Sho w s the S VM p erf ormance o ver a range of ov erlap lev els. (b) Sho ws the solution complexit y o ver the same range. (c) Sh o ws ho w p erform ance v aries with training set size at v arious lev els of o verla p. In eac h case N is the num b er of training data used. Error bars sho w one standard d eviation ab out the mean o v er 10 trials. N is the num b er of data in the training and test sets. In Figure 3(a) we s ee that p erformance of the SVM classifier in the presence of o v erlap sho ws a lin ear dr op as the o v erlap lev el is increased, with the linearit y b ecoming more pronoun ced with larger tr aining sets. An imp ortant observ ation here is that this is precisely what we exp ect fr om an optimal classifier on these domains. Wh en w e int ro du ce o v erlap in to these (balanced) data sets w e create ambiguous r egions in th e data space w here the generativ e distributions for b oth classes are n ear equal. This means that ev en a classifier with p erfect kn owledge of the generative distribu tions will infer near-equal p osterior probabilities in these regions, meaning that we cannot pred ict the class lab el b etter than c hance. It is more in teresting here to examine the complexit y of th e SVM so- lutions, whic h we again measure u sing the p rop ortion of the training set retained as supp ort v ectors (sho wn in Figure 3(b)). Th e resp onse h ere again app ears linear, b ut in th is case a linear r esp onse is s omewh at alarming. The prop ortion of the training set retained as sup p ort vect ors r ises linearly as a function of the o ve rlap level , and this effect is v isib le across a wide r an ge 6 of trainin g set sizes. This in dicates that increasing the size of the training set, whic h w as a b o on in the case of imbala nce, actually causes the SVM solution to in crease in complexit y . When o ve rlap is presen t in isolation, the SVM classifier is able to ac hieve appro ximately optimal p erformance across a wide range of differen t training set sizes; ho w ever, despite the near optimal p erformance, as the o v erlap lev el is increased the complexit y of the mo del rises sharply , b oth as a function of the o verla p lev el and also as a fu nction of the training set size. This is coun ter-intuitiv e, as w e generally exp ect that increasing the amount of train- ing data sh ould lead to “b etter” m o dels. Due to h o w we introdu ce ov erlap in to our d istributions the complexit y of th e optimal s olution is in d ep endent of the ov erlap lev el. 4 Com bined O ve rlap and Im balance W e n o w tu rn ou r atten tion to the b ehavior of the SVM in the pr esence of b oth o verlap and im b alance sim ultaneously . W e are inte rested in determin- ing if it is p ossible to separate the con tribu tions from eac h factor. If this is p ossible then we can assign blame for d ifferen t p ortions of the p erform ance degradation to eac h factor; how ev er, if the effects of the tw o factors interac t, this assignment of blame b ecomes muc h more complicated and less usefu l. If the effects are indep endent (i.e. they do not int eract) then the o v er lap and imbalance problems can reasonably b e stud ied in isolation; h o wev er, if they are not ind ep endent it is imp ortan t to u nderstand the relationship b et w een th em, which can only come from studying them together. W e will sho w that th is is in fact the case, and our stu d y of the combined effects giv es rise to th e d isco v ery of a pr eviously un rep orted p henomenon whic h w e call co ve rt o verfitting. 4.1 T est for Indep endence W e first ou tline a metho d to test the hyp othesis that ov erlap and im b alance ha ve indep en d en t effects on classifier p erformance. Let u s con tinue to us e µ as a measure of o verlap and α as a measur e of imbalance. The hypothesis can b e expressed mathematical ly as the assump tion that the p er f ormance surface with resp ect to µ and α ob eys the r elation d P ( µ, α ) = f ′ ( µ ) d µ + g ′ ( α ) d α , where f ′ and g ′ are unknown fun ctions. That is, we exp ect th e total deriv a- tiv e of p erformance to b e separable into the comp onen ts con tributed by eac h 7 of µ and α . Th is hyp othesis of ind ep endence leads us to exp ect that we can consider the partial deriv ativ es as functions of a single v ariable, i.e. ∂ ∂ µ P = f ′ ( µ ) , ∂ ∂ α P = g ′ ( α ) . The functions f ′ and g ′ ma y not ha v e simp le or ob vious fu nctional forms, meaning that w e cannot compute their v alues analytically; how ev er, if f ′ and g ′ are known w e can fi nd a pred icted v alue f or P ( α, µ ), up to an ad d itiv e constan t, by ev aluating P ( µ, α ) = Z f ′ ( µ ) d µ + Z g ′ ( α ) d α + C . (1) Sp ecific v alues f or P ( µ, α ) can b e computed numerically by training a classifier on a d ata set with the appropriate lev el of o ve rlap and imbalance. Since w e exp ect the partial deriv ativ es of P ( µ, α ) to b e in d ep endent, w e can compute v alues for f ′ b y ev aluating P ( µ, α ) for sev eral v alues of µ while holding α constan t and taking a numerica l d eriv ativ e. V alues for g ′ can b e computed in a similar mann er b y holding µ constan t and v arying α . These v alues can then b e com bined into predicted v alues for P ( µ, α ) us in g (1). Comparing the pred icted v alues for P ( µ, α ) to the observ ed v alues will allo w us to determine if our hyp othesis of indep en d ence is sound. Figure 4: Diagram of the p rop osed indep endence test. The p r o cedure for applying this mo del is illus trated in Figur e 4, whic h sho w s a p erformance su rface p arameterized b y the o v er lap and im balance lev els of the training set. First, we tak e measurements of this surf ace along the indicated axis-aligned sections. This corresp onds to measur ing the ef- fects of eac h factor in isolation, the results of whic h wh ere sho wn in previous 8 sections. Th ese data, combined w ith the mo d el of indep endence we h a ve d e- scrib ed here, allo w us to make predictions for the com b ined case (the dashed line in Figure 4). C omparing these predicted v alues to the p erformance of actual classifiers trained on data sets w ith the corresp onding lev els of o ver- lap and imbala nce enables us to assess the correctness of the mo d el. What w e are lo oking for is a discrepancy b et wee n the mo del’s p redictions and our observ ations (sh own in the fi gure as the difference b etw een th e solid and dashed lines). If the p redictions do not matc h wel l with our observ ations w e can reject the mod el and conclude that there must b e an in teraction b et w een the effects of ov erlap and imbalance on SVM p erf orm ance. 4.2 Results Comparisons b etw een our mo del p redictions and the observe d p erformance on domains with com bined ov erlap and imbala nce are shown in Figure 5. These results clearly show that when th e training set size is large, the p erfor- mance predicted b y assuming that o v erlap and imbalance are indep endent is v ery different than what is observed. On the other hand, wh en the training set is small the predictions are quite accurate, sho wing only a small (but still significant ) deviation from the observe d results. 0 0.5 1 0 0.5 1 F−score Observed Predicted 0.5 0.725 0.95 Model Predictions vs. Ovservations (N=100) (a) 0 0.5 1 0 0.5 1 F−score Observed Predicted 0.5 0.725 0.95 Model Predictions vs. Ovservations (N=800) (b) 0 0.5 1 0 0.5 1 F−score Observed Predicted 0.5 0.725 0.95 Model Predictions vs. Ovservations (N=6400) (c) Figure 5: Comparing mo del predictions to observ ations in the com bined case. In these figur es the low er x-axis s h o ws the degree of o ve rlap and the upp er x-axis sh o ws the degree of im balance. N is the n umber of d ata in the training and test sets. In addition to showing p erforman ce w h ic h falls short of our mo del’s predictions, we see a s udden breaking p oint in p erformance b eyo nd a certain lev el of com b in ed ov erlap and imbalance. Th is effect is most p ronounced when the training set is large, b ecoming less n oticeable with fewer tr aining data and disapp earing en tirely when th e training set size is v ery small. This 9 drop o ccurs consisten tly at app ro ximately µ = 0 . 6 and α = 0 . 78 with very little v ariation across differen t training set sizes. In Denil and T rapp enb erg [7] w e sho wed that the differences are statistically s ignifican t and that th e drop is correlated with th e p eak complexit y of these mo dels. Figure 6 sho ws the p erformance and complexit y w e observed in the com- bined case across several training set sizes. The data are p r esen ted h ere in the same format as Figures 2 and 3 for ease of comparison. These figur es emphasize the breaking p oint in p erf ormance w e see with com bin ed o verlap and imbala nce. C rucially , we see that the p erformance b ey ond this breaking p oint is un changed across the range of training set sizes we tested; ho w ever, more data can significan tly impr o ve th e pre-breaking-p oin t p erformance. 0 0.5 1 0 0.5 1 F−score N = 100 N = 800 N = 6400 0.5 0.725 0.95 Performance vs. Combined Overlap and Imbalance (a) 0 0.5 1 0 0.5 1 SV Proportion N = 100 N = 800 N = 6400 0.5 0.725 0.95 Complexity vs. Combined Overlap and Imblanace (b) 25 400 6400 0 0.5 1 Combined Performance vs. Training Set Size Training Set Size F−score α = 0.50; µ = 0.00 α = 0.72; µ = 0.49 α = 0.95; µ = 1.00 (c) Figure 6: Com bin ed o v er lap and im balance. In these figures the low er x- axis sho w s the degree of o v erlap and the u pp er x-axis sho ws the degree of im b alance. N is the num b er of d ata in the tr ainin g and test sets. The mo del from Section 4.1 relies only on the indep endence of the im- balance and ov erlap p roblems in ord er to make p redictions for p erformance in the com bin ed case. Sin ce we hav e sh o wn that th e m o del predictions are v ery p o or, it is reasonable to conclude that th e und er lyin g assu m ption is incorrect; sp ecifically , w e claim that our results demonstrate that there is an int erdep end ence b etw een the effects of ov erlap and imbalance. The later sections of p ap er are d evote d to charac terizing this inte rdep endence. 5 Co v ert Ov erfitting In this section we p rop ose an explanation for the p erformance and complex- it y b eha viours we observe in the presence of ov erlap and im balance. S o far w e ha v e seen th at: • Imbala nce, in isolation, is not a significan t p roblem f or SVMs. Wh en 10 there are sufficientl y many training d ata a v ailable the SVM f orms sim- ple mo d els (as exp ected, giv en the simplicit y of our domains) w h ic h sho w excellen t p erformance, ev en when the degree of imbala nce is ve ry high. • O v erlap, in isolation, causes SVMs to build v ery complex mo dels whic h exhibit p erformance comparable to an optimal classifier. Although p erformance dr ops as the o v erlap level is in creased, it is still optimal since the pr esence of o verlap creates ambiguous r egions wh er e eve n an optimal classifier cannot predict the class lab el b etter than c hance. Ho wev er, the complexit y of these mo dels is extremely high, esp ecially considering that th e complexit y requ ired to ac h iev e this p erformance is no d ifferen t from the s eparable case. • Wh en b oth factors are present in tandem not only do es the S VM build o verly complex mo dels, as in the case of ov erlap in-isolation, but the p erformance on these domains is also significantly r educed. Since the und erlying reasons for the b eha viour in the case of imbalance in isolation is fairly w ell un dersto o d (see the b eginning of S ection 3.1 for references) we w ill fo cus on the remaining t wo cases here. W e hyp othesize that the observ ed b eha v iour is a result of a ph enomenon w e call c overt overfitting . Cov ert o ve rfitting is similar to ordinary ov erfit- ting, in that it is a result of mistaking ab errations in the training data for c haracteristics of the generativ e class distribu tions. The k ey difference is that co vert o v erfi tting o ccurs in the am b iguous r egions caused by ov erlap. Since it is difficult to m ake a principled c hoice of where to place th e b ound ary in an am biguous region, the task of iden tifyin g cov ert ov erfitting is more difficult than its ordinary counterpart. T ec hniques lik e cross v alida- tion, which estimate the generalizatio n p erformance by testing the classifier on d ata wh ic h w as not used during training, are ab le to d etect ov erfitting in un am biguous regions s ince an o v erfi t mo d el will n ot generalize to go o d p er- formance on the test d ata. C on trastingly , in am biguous regions, man y differ- en t b oun daries will ac hiev e comparable generalization p erform an ce, since the p osterior class probabilities in th ese regions are nearly equal. This means that we cannot distinguish b et w een parsimonious and o ve rfit solutions in am biguous regions based on generalizatio n p erformance alone. W e d emonstrate that cov ert o v erfi tting o ccurs us ing t wo different meth- o ds. Both of these metho d s rely on ou r ability to apply differen t d egrees of s m o othing to the b ound ary pro du ced b y a trained SVM. W e p resen t a regularization tec hn ique here adapted from Liang [12] (with pr evious w ork 11 Figure 7: A carto on example of co v ert o ve rfitting, wh er e the dotted lines delimit an am b iguous region of the feature space. On the left w e see the “optimal” solution and on the righ t we see a solution w here the classifier has ov erfit. Unlik e the case of ordinary ov erfitting w e exp ect b oth class b ound aries to b eha ve s imilarly in generalizat ion, since in the am biguous region only the vol ume of th e feature sp ace assigned to eac h class will affect p erformance. app earing in Do wn s et al. [8] and Liang et al. [13] ). The k ey insigh t allo w - ing th is method to function is a result of Liang’s w ork; h o wev er, w e h a ve enhanced th e algorithm to allo w SVM approxi mations u sing an arb itrary n um b er of sup p ort vec tors to b e constructed in a single step. While the algorithm in Liang [12] remov es one sup p ort v ector p er iteration, we are able to id en tify a subset of arb itrary size to remo ve while still main taining the imp ortan t p rop erties of the algorithm. 5.1 Sp ectral Reduction Giv en an SVM, we can expr ess the hyp erplane normal v ector w , as a function of the supp ort vect ors [15, c hap. 7.3]. Let the sup p ort v ectors b e ind exed b y a set N and su pp ose w e can partition N into t wo disjoint subsets, I and D , suc h that I = { x i : i ∈ I } is a linearly indep enden t set and the elemen ts of D = { x j : j ∈ D } are linearly dep endent on th e elemen ts of I . Also, defin e the function Pro j I ( x ) as the p ro jection of x into the span of I . F ollo w in g 2 2 A very similar deriv ation for th e remov al of a single supp ort vecto r app ears in Liang [12]. The deriv ation here has b een reph rased in terms of the hyperplane normal vector, and slightly generalized to account for th e remo v al of several supp ort vectors at once. 12 Liang, we can wr ite: w = X i ∈ N α i y i x i = X i ∈ I α i y i x i + X j ∈ D α j y j x j = X i ∈ I α i y i x i + X j ∈ D α j y j Pro j I ( x j ) = X i ∈ I α i y i x i + X j ∈ D α j y j X i ∈ I β j i x i = X i ∈ I α i y i x i + X i ∈ I X j ∈ D α j y j β j i x i = X i ∈ I α i y i + X j ∈ D α j y j β j i x i , X i ∈ I ( α i y i ) ′ x i , where the last equalit y defin es ( α i y i ) ′ . Here β j i represent s the i th co or- dinate of x j with resp ect to I . This deriv ation sho ws that an y linearly dep end en t supp ort vect ors can b e eliminated fr om the SVM by making an appropriate c h ange to the Lagrange multi pliers f or the remaining indep en- den t supp ort vect ors. If w e restrict |I | in the ab ov e deriv ation to b e less than the dimensionalit y of the span of the supp ort v ectors then the th ird equalit y b ecomes an approxi mation (since D will no longer b e linearly dep end en t on I ) and we fin d, f ollo wing Liang, that provi ded we select I so as to minimize P j ∈ D || Pr o j I ( x j ) − x j || , th e resulting SVM is th e b est appr o ximation of the original, usin g |I | su pp ort ve ctors. It is imp ortan t to note at this p oint that the x i in the ab ov e deriv a- tion m u st b e expressed in the implicit sp ace in duced b y the k ernel. This complicates matters since this space may b e ve ry high, or ev en infinite, d i- mensional. Thus, we need a metho d wh ic h d o es not require us to compute explicit representa tions for the sup p ort v ectors in the implicit space. The solution to this problem is offered by the kernel matrix. Th e k ern el matrix for an SVM with n supp ort v ectors is an n × n symmetric matrix Q , suc h that Q ij = K ( x i , x j ) , where the x i are the su pp ort v ectors and K ( · , · ) is the k ernel fun ction. Th e k ern el matrix is the Gram matrix of the supp ort ve ctors, after applying 13 the implicit mapping implied by the k ernel function, and encod es imp ortan t information ab out the S VM. F or instance, since the k ern el matrix is a Gram matrix, rank( Q ) is equal to the num b er of linearly indep en d en t su p p ort v ectors. F urthermore, if w e find a linearly indep endent spannin g subset of the ro w s of Q , we can tak e the corresp ond ing supp ort vec tors as a minim al set of su pp ort v ectors required to re-express w as in the ab o ve deriv ation. In this w a y the original pr oblem is reduced to find ing a subset of the rows of Q whic h form a basis for its row space. This basis can b e found efficien tly b y computing the LUP decomp osition of Q . This gives a lo we r triangular m atrix L , an u p p er triangular matrix U , and a p ermutation matrix P , such that PQ = LU . The matrices L and U are n ot useful to us; ho wev er, the m atrix PQ h as the useful prop ert y th at its fi rst r an k( Q ) ro w s are linearly indep en d en t. Since P is a p ermutatio n matrix, we see immediately that we can us e it to identify the ro ws of Q we require. The preceding paragraph shows that we can use a linearly ind ep endent subset of the ro ws of Q to select a minimal set of sup p ort ve ctors wh ic h can b e u sed to pro d u ce an exact r econstruction of the original SVM. W e no w address the p roblem of id en tifyin g which su pp ort ve ctors we can remo v e to pro du ce an optimal rank-reduced app ro ximation of the original. Th e goal is to b e able to select an arbitrary num b er of supp ort v ectors and to ha ve a metho d which we can use to construct the b est p ossible approximat ion to our original S VM usin g the sp ecified n umber of supp ort v ectors, selected from among th e supp ort vec tors of the original. The k ey here is to notice that, since Q is a symmetric matrix, we can tak e its eigenv alue decomp osition Q = V ΛV T , where V = [ v 1 · · · v n ] is an orthogonal matrix of eige n v ectors and Λ = diag( λ 1 , · · · , λ n ) is a diagonal matrix of eigen v alues. F o r conv enience we can require the eigen v alues are ord ered su c h that λ i ≥ λ i +1 . If we let r = rank( Q ) then we can rewrite this d ecomp osition as Q = n X i =1 λ i v i v T i = r X i =1 λ i v i v T i , (2) where th e second equalit y h olds sin ce λ r +1 = · · · = λ n = 0. W e can use (2) to form approximat ions of Q by trun cating the s um after some r ′ < r terms, 14 giving Q ′ = r ′ X i =1 λ i v i v T i , whic h is the b est rank- r ′ appro ximation of Q . Since Q ′ is an n × n matrix with r ank r ′ < n we can s elect r ′ linearly indep end en t r o ws of Q ′ whic h giv e a basis for its ro w space. Since Q ′ is the b est rank- r ′ appro ximation of Q , it follo ws that the r − r ′ dimensions of Q ’s row space n ot represen ted in Q ′ are the dimensions w hic h pro vide the least con tribu tion to Q . Since there is a 1-1 corr esp ondence b et w een the dimensionalit y of the k ernel row s p ace and the num b er of supp ort vec tors required to r epresen t the SVM hyp erplane, selecting linearly indep en den t ro ws of Q ′ corresp onds to selecting supp ort v ectors whose presence has a large effect on th e hyp erplane. W e n o w hav e sufficient information to constru ct rank-reduced app ro xi- mations of a giv en S VM. T raining an SVM in the usual wa y giv es us a set of s u pp ort v ectors and their corresp onding Lagrange m u ltipliers. T o con- struct an appr o ximation of this SVM usin g r ′ supp ort v ectors we construct the k ern el matrix, Q and its b est rank- r ′ appro ximation, Q ′ . Identifying a subset of the rows of Q ′ whic h form a basis f or its ro w space tells us which of th e sup p ort v ectors to k eep in the reduced mo del (there will b e exactly r ′ = rank( Q ′ ) of them). W e then up date the Lagrange m u ltipliers using the rule, ( α i y i ) ′ : = α i y i + X j ∈ D α j y j β j i . (3) The new SVM, with supp ort ve ctors selecte d us in g the LUP d ecomp osition of Q ′ and Lagrange m u ltipliers giv en b y (3), is the b est appr o ximation of the original S VM using r ′ supp ort vec tors. The pro cedur e describ ed in this section can b e used to pro du ce arbitrary rank-reduced appr o ximations of a trained S VM. T his giv es us access to an en tire s p ectrum of increasingly more r egularized v ersions of the S VM mo d el. In the f ollo wing sections w e exp loit this abilit y to grad u ally regularize our mo del in ord er to demonstr ate the existence of co vert o verfitting. 5.2 Hyp erplane Angles The SVM is, at its core, a linear classifier. The abilit y to handle non-linear problems comes fr om the ke rnel, wh ic h p erforms an implicit mapping in to 15 a high dimensional feature sp ace. In this implicit space, the SVM decision b ound ary is represente d as the zero lev el-set of a linear function. S ince the fun ction is linear, it can b e describ ed by its normal vect or and so the similarit y of t wo SVM mo d els can b e measured b y the angle b et ween the normal vect ors of their corresp onding hyp er p lanes. W e must a void computing the normal v ectors directly , since the d imen- sionalit y of the imp licit space ma y b e ve ry high or ev en infinite. Nonetheless, it is still p ossible to compute the angle b et wee n t w o S VM hyp erplanes in the implicit space without computin g their repr esen tations explicitly . In general, ignoring the constan t term for simp licit y , an SVM hyperp lane is giv en by f ( x ) = r X i =1 α i y i h x i , x i = α Xx T = w x T , where α i = α i y i , X is a matrix with the s upp ort v ectors (represente d in the implicit space) as its ro ws, and w is the hyp erplane normal v ector. Crucially , the final equalit y sho w s that w = α X , which we d o not w ant to compute directly (sin ce X is a matrix of v ectors in the implicit space), but we can use to compute the in n er p ro du ct of hyp erplane normals. Supp ose now that w e ha ve tw o SVMs, with h yp erplane normals give n b y w 1 = α 1 X 1 and w 2 = α 2 X 2 the angle b et ween them is cos( θ ) = w 1 w T 2 w 1 w T 1 w 2 w T 2 = α 1 X 1 X T 2 α T 2 α 1 X 1 X T 1 α T 1 α 2 X 2 X T 2 α T 2 . This expression is in terms of the in n er pro d ucts of the ro ws of X 1 and X 2 (i.e. inner pr o ducts of su pp ort v ectors in the implicit space) whic h can b e computed efficien tly using the kernel function. The X 1 X T 2 term requires that b oth SVMs use th e same k ernel in order for this metho d to work. Since differen t k ernels imply implicit mappings into different spaces, so the notion of an “angle” b et wee n the hyperp lanes loses meaning when different kernels are used. The metho d d escrib ed here can b e used to measure the angle b et w een an SVM and a rank-redu ced appr o ximation of the same mo del. W e exp ect that higher rank appr o ximations w ill pro du ce hyp erplanes which conv erge to the original (this follo ws directly from our regularization metho d); ho w ever, what w e are interested in is the rate of conv ergence and more imp ortan tly , ho w the angle compares to p erformance. I f co ve rt o verfitting is p resen t w e exp ect the p erformance of th e r an k -r educed mo dels to con verge to the p erfor- mance of the original muc h faster than the angle b et w een their h yp erp lanes con verge s to 0. 16 5.3 Class Assignmen t V ariation If an SVM has placed its b oundary in an am biguous region, it sh ould b e p ossible to mo ve the b oun dary within th is region without affecting the p er- formance of the classifier. This suggests a metho d for identi fying co v ert o verfitting by w atc hing for a plateau in p erf orm ance as the k ernel rank is reduced. S ince our smo othing metho d guaran tees that we mov e the b ound- ary as little as p ossible at eac h iteration, we exp ect that the fir st supp ort v ectors to b e remo ved are those whic h enco de information in the most com- plex regions of the b oundary (which we exp ect to corresp ond to those re- gions w here cov ert ov erfitting has o ccurred). If these details repr esent true features of the problem (i.e. the true class b oun dary is in fact complex in this region) then smo othing the SVM solution will cause a drop in p erfor- mance; ho wev er, if details remov ed by the smo othing pro cess are a r esult of co ve rt ov erfitting then we exp ect th e p erformance to remain appro ximately constan t as they are remo ved. If there are data p oint s near th e b oundary , it is quite like ly that small c hanges in the b ound ary p osition will cause their pr edicted lab el to c h ange. This w ill h app en r egardless of whether or not th e b oundary correctly enco des the optimal separating line b et ween the classes. Thus, w e can look for the com bined o ccurrence of t wo effects as an ind ication of co vert o v erfi tting: 1. T h e SVM rank must b e sub stan tially r educed b efore w e see a signifi- can t dr op in p erformance, and 2. T h ere are man y test data wh ich ha ve their pred icted lab el c hange frequent ly as the rank d rops. Neither of these effects in isolation are sufficien t to detect cov ert o verfitting. If the classes are highly separated then it may b e p ossible to reduce the rank substanti ally without affecting p er f ormance, as the b oun dary is free to mov e within th e large m argin; h o wev er, in this case we would not see v ariation in lab el assignment. Con v ersely , if w e see v aryin g lab el assignmen ts but p erformance dr ops, then w e are likel y losing imp ortan t information ab out the tr u e class b oundary , rather than details fr om cov ert o v erfi tting. If the effects are presen t together then th e constan t p erformance indicates that the o v erall predictiv e p o w er of the mo del is main tained, while at the same time th e lab el assignment c h an ges ind icate that the b oundary is moving in a region w ith a small margin. 17 5.4 Results In order to demonstrate the existance of co vert o v erfi tting we b uilt a syn- thetic d ata set with an o v erlap lev el of 0.4 and an imbalance lev el of 0.6, fol- lo wing the same p ro cedure as for the p r evious exp erimen ts. W e then trained an S VM classifier on this data set, using th e simulate d annealing pr o cedure from Boardman and T r app enb erg [5], with cross v alidation to selec t pa- rameter v alues. After an initial pr e-pr o cessing step to remo ve red u ndant supp ort v ectors, w e construct a series of rank-reduced app r o ximations using the metho d d escrib ed in S ection 5.1. W e u se eac h of these rank-redu ced SVMs to classify a test s et dr awn from the same generati v e d istribution that was u sed for training. F or eac h rank-reduced SVM we measure the an- gle b etw een its h yp erplane and that of the original S VM, and record wh ic h elemen ts of the test set ha ve their class assignmen t c h ange as eac h supp ort v ector is remo ved. T o decide w h en the original SVM is su fficien tly w ell appro ximated by a rank-redu ced appro ximation, w e compare the rank-redu ced p erformance to the original p erformance. W e consider the ran k -r educed SVMs to b e accurate reconstructions of the original if their test p erform ance is greater than or equal to p − δ , w here p is the p erformance of the original classifier and δ is some small thr esh old. W e call the lo we st-rank for wh ic h this o ccurs the sufficiency p oint and for our tests we c hose δ = 0 . 001. W e are most in terested in th e b eha viour of the reconstructions with rank greater th an th e sufficiency p oin t, as these are the ones wh ic h w e exp ect to show v ariation within the am b iguous region. Figure 8(a) shows an o v erlaid plot of the p erformance of the rank-reduced reconstructions an d the angle b etw een th e original and appro ximated h yp er- planes. The vertica l line in the figures sh o ws the suffi ciency p oin t. What should b e immed iately striking here is that not only can m ore than half the su pp ort v ectors b e remov ed without significan tly alte ring the p er f or- mance, but the angle b et ween the original hyp erplane and the rank-red u ced h yp erplane at the sufficiency p oint is quite large. As the ke rnel r an k increases, the con verge nce (in angle) of the recon- structed hyp erplanes to wards the original is mostly smo oth and monotonic, whic h is exactly what we exp ect from the r eduction metho d. Ho wev er, sin ce the p erformance b ey ond the sufficiency p oint is fairly constan t, and the an- gle b et ween the reconstructed h yp erp lane an d the original at the s ufficiency p oint is large, it follo ws that there is a significant amoun t of information r ep- resen ted b y the original SVM which is not necessary to ac hieve comparable p erformance. 18 0 0.5 1 0 pi/4.2 pi/2 Proportion of SVs Removed Hyperplane Angle 0 0.5 1 0 0.5 1 (a) 0 0.5 1 0 0.5 1 Proportion of SVs Removed Fscore Label Assignment Changes (b) Figure 8: Co v ert Ov erfitting Results. (a) Compares p erf ormance (solid line) to the angle b et w een the original SVM and it’s rank reduced app ro ximations (dashed line). (b) Compares p erf ormance to lab el assignmen t c hanges o v er the same d omain (see the text for a complete descrip tion of this figur e). The v ertical line in b oth fi gu r es ind icates the su fficiency p oin t. This effect—the represent ation of additional information b eyond wh at is required to achiev e go o d p erformance—is an example of wh at we exp ect from ordinary o ve rfitting. T he difference here is that the test p erformance is n ot reduced b y th is b eha viour , as the “extra” information in the training set whic h caused the o verfitting is present in the test s et as w ell. Because the tr ainin g and test sets exhib it the same systematic pr oblem, w e cannot detect this p henomenon through v alidation of the p erformance alone. Figure 8(b) sho ws the p erformance of the rank-reduced SVM appro xi- mations ov erlaid on a visualization of the class assignmen t v ariation as th e rank of the reconstruction is c hanged. T o create this visualization, w e di- vide the area of the figu r e into a grid of cells, wh ere the ro ws corresp ond to elemen ts of the test set and the columns corresp ond to the different k ern el ranks. Eac h cell is shaded blac k if reducing the SVM rank by one causes the lab el assigned to the corresp onding elemen t of the training set to c hange. Note that this do es not indicate if the lab el is correctly assigned, b ut in- stead trac ks when removing a sup p ort v ector causes the SVM to “c h ange its mind” ab out whic h lab el sh ould b e assigned to eac h test in stance. F or ease of in terp retation the data h a ve b een sorted along the v ertical axis, ordered b y the largest rank wh ic h causes their lab el to change. Again, we are inter- ested in the b eha viour of class assignmen ts when the rank is greater than the sufficiency p oint . 19 In this case w e can again see the effects of co ve rt o verfitting. In fact, w e see that the ma jorit y of the v ariation in lab el assignment tak es place after the suffi ciency p oin t, wh ere p erformance is relativ ely constan t. W e rep eated this exp erimen t on a v ariet y of differen t bac kb one m o dels, with v arying level s of o verlap and im balance, and we foun d that this b ehavi our is consisten t. The n u m b er of test data whose lab el is c hanged b efore the sufficiency p oint is h igh wh en there is strong o ve rlap, and the frequency of lab el assignment c hanges is typical ly densest in th is region as w ell. What remains unclear at this p oin t is to w hat degree the v ariation is lo calized to the am biguous r egions. W e hav e d emonstrated th at there is mo vemen t in the SVM h yp erplane b eyo nd the sufficiency p oin t, and that this h yp erplane mov emen t causes significan t changes in ho w the SVM assigns lab els to test data, d espite the p erf ormance remainin g constant . Ho we v er, it is p ossible th at the lab el changes w e are s eeing are sp r ead u n iformly across the entire d omain. T o sho w that the lab el changes are in fact lo calized in the am biguous regions, we select the test data whose lab el is c hanged at least once after the su fficiency p oin t has b een reac h ed and c hec k if they are lo calized to the ambiguous region. Figur e 9(a) shows the distribu tion of these data along the d imension in wh ich they are distinguishable (recall from Section 2 that our 2D backbone m o dels are indistinguish able in only one dimension). The distribution is clearly lo calized in the am b iguous r egions with some additional v ariation n ear the b oundaries (e.g. n ote the b ehaviour around the crisp b ound ary at 0.5). Figure 9(b) demonstrates that the degree of lo calization of lab el v ari- ations to the am biguous regions across several degrees of smo othing. The trend line in this fi gure sho ws, for eac h leve l of smo othing, the p r op ortion of test data whic h hav e had their lab el assignment c hange at least once and lie in an am biguous region. When the ran k is extremely low the pr op ortion is appr o ximately 0.42, w hic h is equal to the p rop ortion of the entire test set whic h lies in an am biguous region; ho wev er, w e see that w hen we con- sider high rank approximat ions th e lab el c h anges are highly lo calized to the am biguous regions. 6 Conclusion In this pap er we fir st lo oke d at ho w the o v erlap and imbalance p roblems in isolation affect p erf ormance of the S VM classifier. I n the case of im b alance w e sa w that when there are su ffi cien tly man y tr ainin g data, imbal ance do es 20 0 0.2 0.3 0.5 0.7 0.8 1 0 5 10 15 20 25 30 35 40 Separable Dimension Number of Data Label Changes Post Sufficiency Point 0 0.5 1 0 0.5 1 Proportion of SVs Removed Proportion in Ambiguous Regions Proportion of Label Changes in Ambiguous Regions Figure 9: A demons tration that co vert o verfitting is lo calized to th e am b igu- ous regions of th e data space. (a) Sh o ws the d istribution of test data with at least one lab el c hange with rank higher than the suffi ciency p oin t. The b o xes in the diagram d elimit ambiguous r egions. (b) Shows the p rop ortion of lab el change s localized to the am biguous regions at v arious degrees of smo othing. not d egrade the SVM p erformance. W e also sa w, in the case of o ve rlap in isolation, that ev en when there are ambiguous regions in the data space, the SVM is still able to ac h iev e appro ximately optimal p erf orm ance. Naturally , in this case the o verall p erformance is signifi can tly lo wer than the imbal- anced case, but this is a result of inher ent am b iguit y in th e data themselv es. Our exp eriments sho w that despite this am biguity , the SVM is capable of learning mo d els with p erformance comparable to an optimal classifier for these domains. Although the p erform an ce on o v erlapping domains is quite go o d (com- pared to an optimal classifier), the complexit y of the learned mo dels is v ery high. In creasing either the size of the training set, or the degree of o ve r- lap, in these cases causes th e SVM to learn more complex mo dels. The increased complexit y in d icates a systematic w eakness of the S VM classi- fier in the presence of o ve rlapping data, since the optimal solution on our o verla pp ed domains has the same complexit y as the s ep arable cases. W e used our p erformance measuremen ts in the cases of im b alance and o verla p in isolation to predict p erformance for the com bin ed case, under the assumption that the factors act indep en den tly . W e established, follo wing our previous work in Denil and T rapp en b erg [7], th at there is an interdep endency b et w een the effects from these t wo factors. The later sections of this w ork offer a causal explanation for the b e- ha viour in p erformance and complexit y that w e seen in the case of o ver- 21 lapp ed, as well as o ve rlapp ed and im balanced data. Our explanation p ostu- lates that the b eha viour w e see in these cases is caused by co vert o v erfitting. In order to test this explanatio n w e dev elop ed an SVM pr uning metho d whic h allo ws u s to build arbitrary rank approxi mations of a giv en S VM. W e describ ed tw o metho ds for exploiting this tec hnique to iden tify the o ccur - rence of co vert o v erfi tting; first b y examining the hyp erplane angle b et w een an SVM and its lo w r ank approximat ions and second b y lo oking at the fre- quency and lo calization of lab el assignment c h anges with resp ect to the r ank of the appr oximati on. In b oth cases our fi ndings are consistent with the o c- currence of co ve rt o verfitting and pr o vide evidence that it is a r eal p roblem for training high qualit y S VMs. W e established that wh en o verlapping classes are pr esent in the data a significan t amoun t of the sup p ort vec tors in a trained S VM mo del go to w ard s enco ding asp ects of the b oundary whic h do not in crease the generalization p erformance. W e also sa w that the remo v al of these s u pp ort v ectors pro- duces v ariation in class lab el assignment which is lo calized around the am- biguous regions of the data sp ace. T he d egree of this lo calizatio n is h ighest when the app ro ximations are near to the original SVM. One of th e original goals of this wo rk was to form u late a measure of o verla p in real w orld data. T o that end w e ha ve identified several charact er- istics, notably the relationship b et ween o verlap and imbalance , whic h such a measure m ust account for. W e ha ve also identified a sp ecific b eha viour, namely co ve rt o verfitting, which we ha ve sho wn to b e indicativ e of o v er lap- ping classes. W e h a ve demonstrated how this b eha viour can b e detected through t wo signature effects: redu ndancy in the supp ort v ectors of the trained mo del, and the v ariation of class assignments un der regularization. F u rther w ork will in v estigate if these charact eristics can b e turned into an o verla p measure wh ic h is applicable to real world data. References [1] Rehan Akb an i, Stephen Kwe k, and Nathalie Japko wicz. Applying Supp ort V ector Mac h ines to Imbalanced Datasets. M achine L e arning: ECML 2004 , pages 39–50 , 2004. [2] Gasser Auda and Mohamed Kamel. CMNN: Co op erativ e mo dular neu- ral net works for pattern recognition. Pattern R e c o gnition L etters , 18 (11-13 ):1391 –1398, 1997. [3] Gustav o Batista, Ronaldo C Prati, and Maria Carolina Monard . A 22 Study of the Beha vior of Sev eral Method s for Balancing Mac hin e Learn- ing T raining Data. SIGKDD Explor ations , 6(1):2 0–29, 2004. [4] Gusta vo Batista , Ronaldo C P rati, and M.C. Monard. Balancing strate- gies and class o verlapping. L e ctur e notes in c omputer scienc e , 3646:24, 2005. [5] Matthew Boardman and Thomas T rapp enb erg. A H euristic for F r e e Par ameter Optimization with Supp ort V e ctor Machines . IEEE, 2006. ISBN 0-7803- 9490-9 . doi: 10.1109 /IJCNN.2006.1 716150. [6] An tal V an Den Bosc h, T on W eijters, H. Jaap V an Den Herik, and W alter Daelemans. When small disju ncts ab ound, try lazy learnin g: A case stud y. Pr o c e e dings seventh BE N ELEARN c onfer enc e , p ages 109– 118, 1997. [7] Misha Denil and Th omas T rapp enb erg. Overla p ve rsus Imbalance. In A tefeh F arzindar and Vlado Keselj, editors, A dvanc es In Artificial In- tel ligenc e , v olume 6085, p ages 220–23 1, Ottaw a, 2010. Spr inger. [8] T om Do wns, K evin E. Gates, and Annette Masters. Exact simplification of supp ort vect or s olutions. The Journal of Machine L e arning R ese ar ch , 2:297, 2002. [9] Nathalie Japko wicz. Class im balances: are we fo cusing on the r igh t issue. Workshop on L e arning fr om Imb alanc e d Data Se ts II , pages 17– 23, 2003. [10] Nathalie Japko wicz and Sha ju Stephen . Th e class imbalance p roblem: A systematic stud y. Intel ligent Data Analysis , 6:429– 449, 2002. [11] T aeho Jo and Nathalie Japko wicz. Class im b alances v ersus small dis- juncts. ACM SIGKDD Explor ations Newsletter , 6(1):40–4 9, 2004. [12] Xun Liang. An effectiv e metho d of pru ning supp ort v ector mac hine classifiers. IEEE T r ansactions on Neur al N e tworks , 21(1): 26–38, 2010. [13] Xun Liang, R.C. Chen, and Xin yu Guo. Pr uning Supp ort V ector Ma- c hin es Without Altering Performances. IEEE T r ansactions on Neur al Networks , 19(10):1 792–1 803, 2008. [14] Ronaldo C Prati, Gusta vo Batista, and Maria C Monard. C lass I m - balances v ers us Class Overlapping: An Analysis of Learnin g System Beha vior. MICAI 2004: A dvanc es in Artificial Intel ligenc e , pages 312– 321, 2004. 23 [15] Bernhard Sc holkopf and Alexander J . Smola. L e arning With Kernels . Massac husett s Institute of T ec h nology , 2002 . [16] Sofia Visa and Anca Ralescu. Lea rning im balanced and o v erlapp ing classes using fuzzy sets. In ICM L-2003 Workshop on L e arning fr om Imb alanc e d Data Sets II , v olume 3, 2003. [17] T ang Y aohua and Gao Jinghuai. Impro ved Classification for Problem In v olving Overlapping Patt erns. IEICE T r ansactions on Information and Systems , 90(11):178 7–1795, 2007. 24
Original Paper
Loading high-quality paper...
Comments & Academic Discussion
Loading comments...
Leave a Comment