Gene Expression Data Knowledge Discovery using Global and Local Clustering
To understand complex biological systems, the research community has produced huge corpus of gene expression data. A large number of clustering approaches have been proposed for the analysis of gene expression data. However, extracting important biol…
Authors: ** Swathi H. **
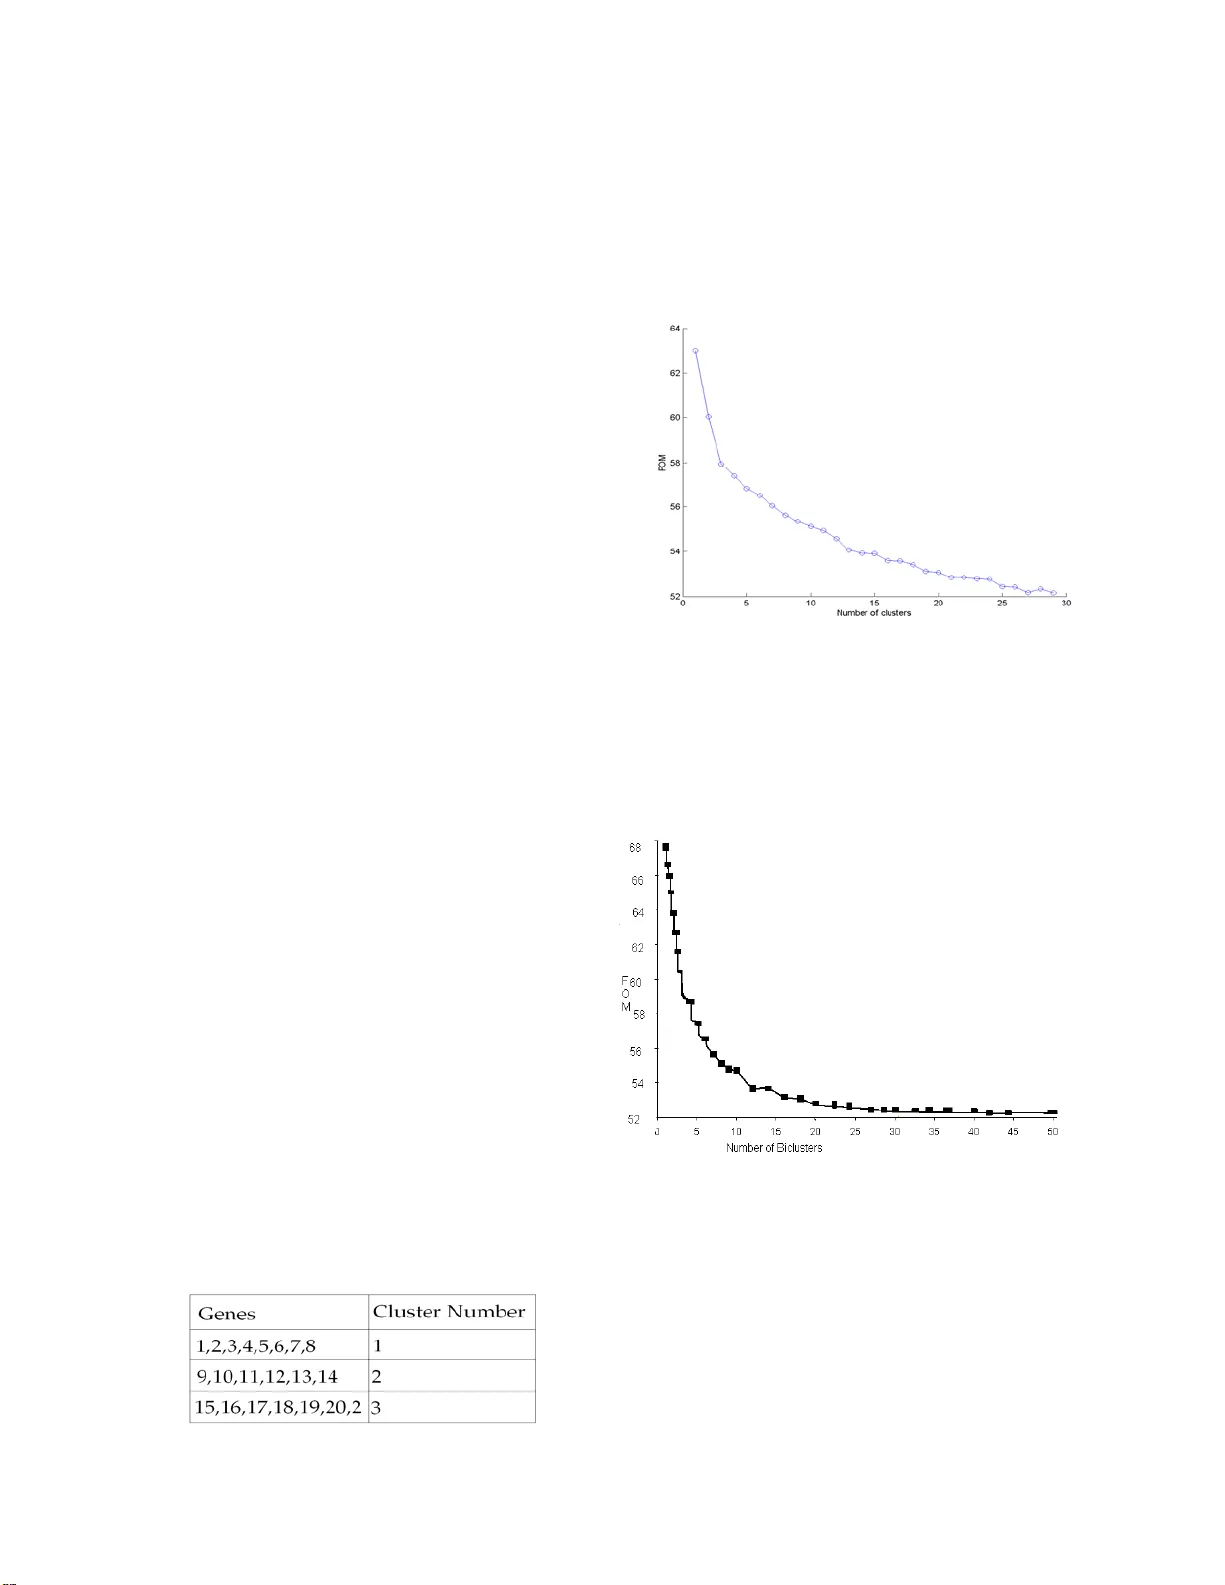
JOURNAL OF COMPUTING, VOLUME 2, ISSUE 3, MARCH 2010, ISSN 2151-9617 HTTPS://SITES.GOOGLE.COM/SITE/JOURNALOFCOMPUTING/ 116 Gene Expression Dat a Knowledge Discovery using Global and Local Clustering Swathi. H Abst ract —T o understand complex biological systems, the research community has produced huge corpus of gene expression data. A large number of clustering approaches ha ve been proposed for the analysis of gene expression data. However , extracting important biological know ledge is still harder . T o addres s this task, cluste ring techni ques are used. In this paper , hybrid Hierarchical k-Means algorithm is used for clustering and bi clustering gene expression data is used. T o discover both local and global clustering structure bicl ustering and clustering algorithms are utiliz ed. A validation technique, Figure of Me rit is used to determine the quality of clustering results. Appropriate knowledge is mined from the clusters by embedding a BLAST similarity search program into the clus tering and biclustering process. T o discove r both local and global clustering structure biclustering and clustering algorit hms are utilized. T o determine the quality of cl ustering results, a validation technique, Fi gure of Merit is used. Appropriate knowledge is mined from the cluste rs by embedding a BLAST similarity search program into the clustering and biclustering process. Index T erms —Clustering, Gene expression data, validati on technique, similarity search program —————————— —————————— 1 I NTRODUCTION HE clustering is the process of grouping data into classes or groups so that objects within a cluster have high similarity in comparison to one another, but are very dissimilar to objects in other classes [11]. Clustering can also facilitate taxonomy formation,that is,the organi- zation of observations into a hierarchy of classes tha t group similar events together.There exist a large number of clustering algorith ms in the literature.The clustering algorithms are commonly applied in molecula r biology for gene expression data analysis [5, 6]. These algorithms are used to partition genes into groups based on the simi- larity among their expression profiles. These clustering algorithms can be broadly classified into partitional an d hierarchical algorithms [11]. The partitional clustering algorithms generate a single partition, with a specified or estimated number of nonoverlapping clusters, of the data in an attempt to re- cover natural groups present in the data [11]. Hierarchical clustering (HC) algorithms construct a hierarchy of parti- tions, represented as a dendogram in which each parti- tion is nested within the partition at the next level in the hierarchy [11]. The most commonly used partitional clus- tering algorithms are K-Means (KM) and k-mediods [11]. The KM algorithm takes the input parameter k, and parti- tions a set of n objects into k clusters so that the resulting clusters have high intracluster similarity and low inter cluster similarity. Cluster similarity is measur ed as the mean value of the objects in a cluster, which can be viewed as the cluster’s centre of gravity [11]. However both KM and HC clustering algo rithm have certain disadvantages like difficulties in specifying the number of clusters in advance and in selection of merge or split points [11]. HC cannot represent distinct clusters with similar expression patterns. As clusters grow in size, the actual expression patter ns become less relevant [11]. KM clustering requires a specified number of clusters in advance and chooses initial centroids randomly; in addi- tion, it is sensitive to outliers [11]. A novel hybrid ap- proach that combines the m erits of these two methods and discards their innate disadvantages [1]. HC is carried out first to decide the location and number of clusters in the first round and run the KM clustering in next round. This approach provides a mech anism to handle outliers [1], [2], [3], [12]. When clustering data the similar observations should be grouped together. Thus needs to be able to com pute the distance between two data objects, but it can be de- fined in many forms [12].Distance measurements influ- ence the shape of the clusters, as some elements m ay be close to one another according to one distance and farther away according to another[16]. In this paper the Pear- son’s Correlation Coefficient measurement is used to cal- culate the distance.In this work the gene expression data is clustered by global and local clustering. Gene expression is the process by which inheritable information from a gene, su ch as the DNA sequence,is made into a functional gene product,such as protein or RNA[15].The expression of many genes is regulated after transcription(i.e., by microRNAs or ubi quitin ligases) and an increase in mRNA concentration need not always in- crease expression.The advances in microarray technolo- gy,high-throughput and low- throughput methods such as “tag based” technologies like Serial Analysis of Gene T ——————————————— — H.Swathi is with the Department of Information Technology, Vivekanand- ha College of Engineering for Women, Tiruchengode, India. JOURNAL OF COMPUTING, VOLUME 2, ISSUE 3, MARCH 2010, ISSN 2151-9617 HTTPS://SITES.GOOGLE.COM/SITE/JOURNALOFCOMPUTING/ 117 Expression(SAGE) or the more advanced version Super- SAGE,which can provide a relative measure of the cellu- lar concentration of different messenger RNAs[14].The expression levels of large numbers of genes in a tissue at different time points and also the relative amounts of mRNA produced at these time points provide a gene e x- pression time series for each gene. The time series gene expression data consists of a matrix containing intensity data for a group of genes for certain time points [17]. The process of evaluating the results of a clustering algorithm is called cluster validity assessment.Two mea- surement criteria have been proposed for evaluating and selecting an optimal clustering scheme [4]: Compactness: The member of each cluster should be as close to each other as possible.A common mea sure of compactness is the variance. Separation: The clusters themselves should be widely separated. The cluster validation procedures divided into two main categories: External criterion analysis Internal criterion analysis External criterion analysis validates a clustering result by comparing it to a given “gold standard”which is another partition of the obje cts[18].The gold standard must be obtained by an independent process based on information other than the given data set.There are many statistical measures that assess the agreement between an external criterion and a clustering result. For validation of cluste ring results,external crite- rion analysis has the strong benefit of providing an inde- pendent , hopefully unbiased assessment of cluster qua li- ty.On the other hand,external criterion analysis has the strong disadvantage that an external gold standard is rarely available.Internal criterion analysis avoids the need for such a standard,but has the alternative problem that custers are derived[19]. Different clustering algorithms optimize different objective functions or crite- ria.Assessing the goodness of fit between the input data set and the resulting clusters is equivalent to evaluating the clusters under a different objective function. 2 B ICLUSTERING G ENE E XPRESSION D AT A 2.1 Pearson’ s Correlation Coefficient The Pearson’s correlation coefficient, which measures the similarity between the shapes of two expression patterns (profiles) [12]. Given two da ta objects and Pearson’s cor- relation coefficient is defined as P d p d 1 2 oj - jd D 1 d 2 oi - id 1 oj - jd oi - id j i, o o o o o o Pearson , (1) where µ oi and µ oj are the means for i o and j o respective- ly. Pearson’s correlation coefficient views each object as a random variable with observations and measures the si- milarity between two objects by calculating the linear relationship between the distributions of the two corres- ponding random variables [12]. Pearson’s correlation coefficient is widely used and has proven effective a s a similarity measure for gene expression data. It is not ro- bust with respect to outliers, thus potentially yieldi ng false positives which assign a high similarity score to a pair of dissimilar patterns [12]. 2.2 Figure of Merit The Figure of Merit (FOM) methodology is used for as- sessing the quality of clustering results. FOM is a scalar quantity, which is an estimate of the predic tive power of a clustering algorithm [4]. A typical gene expression data set contains measurements of expression levels of n genes under B conditions. Assume that a clustering algorithm is applied to the data from condition 1, 2, 3... ( e -1), ( e +1)… B. The condition e is used to estim ate the predictive power of the algorithm [4]. The F OM under the condition e is defined k n 1 ix 2 c c e e x, R 1 k e, FOM i , (2) where R (g, e) is the expression level of ge ne g under con- dition e, µ ci (e) is the average expression level in condition e of genes in cluster C i . 2.3 Biclustering The clustering has proved to be a powerful tool for data analysis and continues to be an active area of research [5]. However when applied to microarray data, cluster ing techniques have certain difficulties. The problem derives from the fact that when analyzing a microarray data ma- trix, conventional clustering techniques allow one to clus- ter genes (rows) and thus comp are expression profiles, or to cluster conditions (columns) and thus compare expe- rimental samples but are not intended to allow one to accomplish both simultaneously [5]. This biclustering approach is capable of discovering local patterns in mi- croarray data. Each gene in a bicluster is selected using only a subset of the conditions and each condition in a bicluster is selected using only a subset of the genes [5]. There are many biclustering algorithms aimed at disco- vering biclusters. 2.4 Bioinformatics T o ols Using bioinformatics tools, the differential gene expres- sion can be studied, which could lead to the identification of important gene/proteins (which were not reported previously) and invasion mechanism. For obtaining the sequence information about th e genes the seque nce simi- larity search tools are used. Therefore, the bioinformatics tool BL AST is utilized to identify sequences similar to the query sequences. 2.5 Basic Local Alignment Search T ool (BL AST) Basic Local Alignment Search Tool, or BLAST, is a pro- gram for comparing primary biological sequence infor- JOURNAL OF COMPUTING, VOLUME 2, ISSUE 3, MARCH 2010, ISSN 2151-9617 HTTPS://SITES.GOOGLE.COM/SITE/JOURNALOFCOMPUTING/ 118 mation, such as the amino-acid sequences of different proteins or the nucleotides of DNA sequences [9]. A BLAST search enables a researcher to compare a query sequence with a library or database of sequences, and identify library sequences that resemble the query se- quence above a certain threshold. It is about 50 times fast- er than dynamic programming [9]. Dynamic programming is a method of solving complex problems by breaking them down into simpler steps. It is applicable to pr oblems that exhib it the proper- ties of overlapping subproblems and optimal substruc- ture. BLAST seeks out local alignment (the alignment of some portion of two sequence s) as opposed to global alignment (the alignment of two sequences over their en- tire length). By searching for local alignments, BLAST is able to identify regions of similarity with two sequences. 3 R EL A T ED W ORK 3.1 St atistical-Algorithmic Method for Bicluste r Analysis (SAMBA) Tanay et al., [6] introduced Statistical-Algorithmic Me- thod for Bicluster Analysis (SAMBA). It is a graph- theoretic approach, in combination with a statistical data modeling. In SAMBA framework, expression matrix is modeled as a bipartite graph. A bicluster is defined as a subgraph, and a likelihood score is used in order to assess the significance of observed subgraphs [8]. This algorithm is applied to yeast and human clinical data. The clusters obtained are superior to th e Cheng and Church bicluster- ing approach. Moreover, the results differentiating fine tissue types from DLBCL (inf ected) tissues. 3.2 Biclustering by Iterative Genetic Algorithm (BIGA) The Biclustering by Iterative Genetic Algorithm (BIGA) [7] approach is proposed to identify transcriptional mod- ule (TM) in gene expression data, avoiding the intrinsic limitations of the heuristic biclustering algorithms. Every T M i s c o m p o s e d o f t h e g e n e s u b s e t a n d t h e c o n d i t i o n subset from the original gene expression data and also possesses α significant level of correlativit y requested by a user. Besides, a novel fitness function for a statistically significant and condition-specific cluster, i.e., the α -TM, is defined [9]. 3.3 Flexible Overlapped Biclustering (FLOC) Flexible Overlapped Biclustering (FLOC) introduced by Yang et al., [8]. It starts from a set of seeds (initial biclus- ters) and carries out an iterative process to improve the overall quality of the biclustering. After each iteration, each row and column is moved among biclusters to p ro- duce a better bi-clusterin g in terms of lower mean squared residues. The best biclu stering sub matrix o b- tained will serve as the initial biclustering for the next iteration. The algorithm term inates when the current ite- ration fails to improve the over all biclustering quality [8]. 3.4 Robust Biclusteri ng Algo rithm (ROBA) A Robust Biclustering Algorithm (R OBA) [10] is a simpler one because; it uses basic linear algebra and arithmetic tools. ROBA is made up of three parts. The first part c on- sists of performing the data conditioning, to get rid of the noise and to solve the prob lem of missing values. The second part consists of decomposing the data matrix A into its elementary matrices, and the last part is used to extract user defined biclusters [10]. 3.5 xMOTIFs (biclusters) Murali and Kasif [13] assumed that data may contain sev- eral xMOTIFs(biclusters) and aimed at finding the largest xMOTIF: the bicluster that contains the maximum num- ber of conserved rows.The merit functio n used to eva- luate the quality of a given b icluster is thus the size of the subset of rows that belong to it.Together with this conser- vation condition,an xMOTIF must also satisfy size and maximal propert ies: the number of colu mns must be in at least a α -fraction of all the c olumns in the data matrix,and for every row not belonging to the xMOTIF the row must be conserved only in a β -fraction of the columns in it. Ben-Dor et al. considered that row (genes) has only two states (up-regulated and down -regulated) and looked for a group of rows whose states induce some linear order across a subset of the columns (conditions). This means that the expression level of the genes in the bicluster in- creased or decreased from cond ition to condition. Murali and Kasif [13] consider that rows (genes) can have a given number of states and look for a group of columns (c ondi- tions) within which a subset of the rows is in the same state. 3.5 Order-Preserving Sub-Matrix (OPSM) Ben-Dor et al.defined a biclus ter as an order-preserving sub-matrix (OPS M)[13].According to their definit ion,a bicluster is a group of rows whose values induce a linear Order across a subset of the columns.This work focused on the relative order of the c olumns in the bicluster rather than on the uniformity of th e actual values in the data matrix.More specifically, they want to identify large OPSMs.A sub-matrix is order preserving if there is a permutation of its columns un der which the sequence of values in every row is strictly increasing. Although the straightforward approach to the OPSM problem would be to find a maximum support complete model, that is, a set of columns with a linear order support ed by a maximum num ber of rows, Ben- Dor et al. aimed at finding a complete model with highest statistically significant support.The statistical significance of a given OPSM is thus computed using an upper-bound on the probability that a random data matrix of size n-by- m will contain a complete model of size s with k or more rows supporting it.In the case of gene expression data such a sub-matrix is determined by a subset of genes and a subset of conditions, such that, within the set of condi- tions, have the same linear ordering. JOURNAL OF COMPUTING, VOLUME 2, ISSUE 3, MARCH 2010, ISSN 2151-9617 HTTPS://SITES.GOOGLE.COM/SITE/JOURNALOFCOMPUTING/ 119 4 R ESEARCH M ETHODOLOGY The hybrid clustering comb ines both HC and KM. In this method, an agglomerative HC is carried out firs t. In this bottom-up strategy to start with each objects in its own cluster and then merges these atomic clusters into larger clusters, until all the objects in the single cluster. The shortest pairwise distance between elements of the two clusters is used in pairwise single-linkage clustering. At the end of pairwise single-linkage cluster a tree will be formed. Afterward, the within-cluster d istance between any points in the cluster is computed in Pearson’s correla- tion coefficient. Based on the distance, cluster formation is done by Hashing function. The bucket table is referred as clus- ters and it indexed as 0, 1…N-1. In the hash function the buckets will be roughly equal in size, so the list for each bucket will be short. If there are M genes in the set, then the average bucket will have N/M genes. N will esti- mated and choose M to be roughly as large, then the av- erage bucket will have only one or two genes. It will de- cide the K-value for the KM. The initial run of the KM is also taken from the HC. This hybrid algor ithm automati- cally finds good initial centroids for KM clustering. Hie- rarchical K-Means (HKM) clustering is validated by using FOM methodology for assessing the quality of clusters. As this clustering allows clustering the genes correspond to their expression levels and no details about the condi- tions or samples which may also the factors affecting the expression level of genes. For simultaneous clustering of genes and condi- tions the biclustering is performed for same gene expres- sion data. Again biclustering is performed using Hierar- chical-K-Means (HKM). Here the sub-matrices of genes and columns are found.The data matrix, A, with set of rows X and set of columns Y,where the elements a ij cor- responds to a value representing the relation between row i and column j.The matrix A, with n rows and m col- umns,is defined by its set of rows,X={x 1… x n } Y={y 1,… y m } using (X,Y) to denote the matr ix A.If X I and Y J are subsets of columns,respectively,A IJ =(I,J) de- notes the submatrix A IJ of A that contains only the ele- ments a ij belonging to the sub-matrix with set of rows I and set of columns J. The data matrix A a cluster of rows is a subset of rows that exhibit similar beh avior across the set of all co l- umns.This means that a row cluster I= {i 1 …i k } is a subset of rows ( X I and k n ).A cluster of rows (I, Y) can thus be defined as a k by m sub -matrix of the data matrix A.Similarly, a cluster of col u mns is a subset of columns that exhibit similar behavior across the set of all rows.A cluster A XJ =(X, J) is a subset of columns defined over the set of all rows X, where J= {j1 ,… j s } is a subset of columns ( Y J and m s ).A cluster of columns (X,J)can be de- fined as an n by s sub-matr ix of the data m atrix A. A HKM bicluster is a subset of rows t hat exhibit similar behavior acros s a subset of columns, and vice- versa.The HKM bicluste r A IJ = (I, J) is a subset of ro ws and a subset of columns where I= {i 1 …i k } is a subset of rows ( X I and k n ), and J={ j 1,… j s } is a subset of columns ( Y J and m s ).A HKM bicluster (I,J) can then be defined as a k by s sub-matrix of the data matrix A.A set of HKM biclusters B k =( I k , J k ) is identified such that each HKM bicluster B k satisfies some specific characteristics of homogeneity For discovering the knowledge the BLAST tool is utilized. The subsequences in the database, which are similar to the query, are found. The main idea of BLAST is that there are often high-scoring segment pairs (HSP) contained in a statistically significant alignment. It searches for high scoring sequences alignments between the query sequences using a heuristic approach. The BLAST program uses a heuristic approach that is less ac- curate. The algorithm is as follows: 1. Remove low-complexity region or sequence repeats in the query sequence. 2. In the query sequence make the list of possible matching genes. 3. Organize the remaining high-scoring genes in- to an efficient search tree. 4. Repeat steps for each gene in the query se- quence. 5. Scan the database sequences for exact match with the remaining high-scoring genes. 6. Extend the exact ma tches to high- scoring segment pair (HSP). 7. List all the HSP’s in the database whose score is high enough to be considered. 8. Evaluate the significance of the HSP score. 9 . M a k e t w o o r m o r e H S P r e g i o n s i n t o a l o n g e r alignment. 10. Show the gapped local alignments of the query and each of the matched database sequ ences. 11. Report the matches whose expect score is lower than a threshold parameter E. Thus, the complete knowledge about genes from input gene expression data is obtained by performing biclustering and cluste ring. 5 A LGORITHMS In proposed work algorithm, the HKM clustering algo- rithm is performed and also bi clustering is performed for HKM clustering algorithm.The obtained clusters are vali- dated and the knowledge discovery is done.The algo- rithm for proposed work foll ows: HKM Biclustering Algorithm Input: Gene Expression data; Output: Informative (knowledge) clusters; Begin Similarity matrix calculatio n using Pearson correlatio n coefficient; HC (); { /* Hierarchical clustering */Start by assigning each item to a cluster, if N items are there in the input data set, then N clusters will be produced; JOURNAL OF COMPUTING, VOLUME 2, ISSUE 3, MARCH 2010, ISSN 2151-9617 HTTPS://SITES.GOOGLE.COM/SITE/JOURNALOFCOMPUTING/ 120 Each contains just one item. Let the distances (similarities) between the clusters the same as the distances (similar i- ties) between the items they contain. 1. Find the closest (most similar) pair of clusters and merge them into a single cluster (using single linkage clustering). 2. Compute distances (similarities) between the new cluster and each of the old clusters. 3. Repeat steps 2 and 3 until all items are clustered into a single cluster of size N and a tree is produced. 4. Tree nodes are mapped to hash table; } KM (); { /* K-Means clustering for the hash table data (partial clusters) */ 1. Initialize K value from hash table entries. Also, the headers of the hash table refer to the centroids. 2. Assign each object to the group that has the closest centroid. 3. When all objects have been assigned, recalculate the positions of the K centroids. 4. Repeat Steps 2 and 3 until the centroids no longer move. This produces a separation of the objects int o groups from which the metric to be mini mized can be calculated. } Knowledge discovery ( ); { Sequence similarity search for the obtained clusters; Display knowledge; } End. 6 R ESUL TS AND D ISCUSSION The HKM algorithm performs cluste ring and biclustering of gene expression data. This algorithm is applied to the Yeast cell cycle dataset shows the fluctuation of expres- sion levels of approximately 317 genes over two cell cycles(17 times points) ranges from 10 min to 24 hours. At first the HKM clustering is perform ed. The Pearson’s Correlatio n Coefficient distance measurement is chosen to measure the distance between DNA genes and complete runs of the datasets are formed. The clusters formed at the end of HKM clustering are shown in the table 1. Table 1 HKM clustering The above HKM clusters formed by HKM clus- tering algorithm on this dataset are validated by FO M methodology. The validation re sult shows a steep decline of FOM’s for the clusters in graph as shown below. This HKM algorithm achieved the lo west FOM’s on this data. The steep decline is indicated in the Fig. 1. Hence it is proved that this algorith m with lower FOM produces high quality clusters. Fig. 1. FMO’s of HKM clustering algorithm on yeast cell cycle dataset Then the biclustering is perfor med for HKM algorith m. As HKM clusters are validated, the HKM biclustering results are also validated. This algorithm also shows a steep decline of FOM’s for the clusters in graph as shown below in the Fig. 2. Fig. 2. FMO’s of HKM biclustering algorithm on yeast cell cycle dataset After the HKM and HKM biclu stering performance, the similarity searching for protein sequence and amino a cid sequence for the genes are obtained by using BLAST. The limitation of the proposed a pproach is that validation metric used here gives the re lated information in the con- ditions used to produce clusters. In some situations it is not applicable because, if al l experimental conditions con- tain independent information then the predictive ap- proach is not possible. JOURNAL OF COMPUTING, VOLUME 2, ISSUE 3, MARCH 2010, ISSN 2151-9617 HTTPS://SITES.GOOGLE.COM/SITE/JOURNALOFCOMPUTING/ 121 7 CONCLUSION In this work, a quality data driven framework for cluster- ing gene expression data is developed. The clustering and biclustering algorith m are validated by FOM meth odolo- gy. The quality of clusters is evaluated and the result shows relatively high quality clusters. The global model and local model of genes can be obtained by performing both clustering and biclustering. Moreove r, the bicluster- ing is outperforming in detecting clusters with higher biological significances than the HKM clustering. It dis- covers the complete knowledge about the genes from the input gene expression data. The empirical results sh ow- that clustering and biclustering for the same data set yield the complete functional organization of ge nes and their biological significance. In future this work can be extended to real gene expression datasets for exploring new biological processes. Further, soft co mputing techniques, parallel genetic algorithm and classification techniques can be combined to obtain robust clustering and accurate clus- tering result. R EFERENCES [1] Bernard Chen, R. Harrison, Phang C. Tai and Yi Pan, “Novel Hybrid Cluste ring Method (H-K Means)”, Computational Systems Bioinformatics Conference, Workshops and Poster Abstracts. IEEE, pp 105-108, 2005. [2] Dhayanithi. J, Sathiyabhama.B, Jayanthi.J, “Mining Gene Expression Data Using Hybrid Clustering”, Threads’08, 2008. [3] Fahim A.M, Ramadan M.A, Salem A. M, and Torkey F.A, “An efficient enhanced K-means clustering algo- rithm”, Journal of Zhejiang University SCIENCE A ISSN 1009-3095, PP.1626-1633, 2006. [4] Yeung K.Y.Haynor, D.R., Ruzzo, W.L., “Validating Clustering for Gene Expression Data”, Bioinformat- ics, volume 17, no.4, pp.309-318, 2001. [5] Cheng, Y., and Church, G.M, “Biclustering of expres- sion Data”, Proc Int Conf Intell Syst Mol Biol8, pp.93- 103, 2000. [6] Amos Tanay, Roded Sharan and Ron Shamir, “Dis- covering Statistically Significant Biclusters in Gene Expression Data”, Volume 18, pp.S136-S144, 2002. [7] Huau-sheng Chiu, Tao-Wei Huang and Cheng-Yen Kao, “Biclustering Gene Expression Data by Using Iterative Genetic Algorithm”, 2005. [8] Mohamed A. Mahfouz, and M.A. Ismail, “BIDENS: Iterative Density Based Biclustering Algorithm with Application to Gene Expression Analysis”, Proceed- ings of world Academy of Science, Volume 37, 2009. [9] Lorenza Bordoli, “Smilarity searches on Sequence Databases: BLAST, FASTA”, 2003. [10] A. B Tchagang, A. H Tewfik “Robust Biclustering Algorithm: ROBA ”, Technical Report, University of Minnesota, 2005. [11] Jiawei Han, Micheline Kamber, “Data Mining Con- cepts and Techniques”, Margan Kaufmann, SanFran- cisco, 2001 [12] Jiang D., Tang C., and Zhang A., “Cluster Analysis for Gene Expression Data: A Survey” , IEEE/ACM transactions on computational biology and bioinfor- matics 16, pp. 1370-1386, 2004. [13] Sara C. Madeira and Arlindo L. Oliveria (2004), “Bic- lustering algorithms for biological data analysis: a survey”, IEEE/ACM Transa ctions on Computational Biology and Bioinformatics, vol.1, no.1, pp.24-45. [14] Paul Trayhurn (1996), “Northern blotting”, Proceed- ings of the Nutrition Society 55, pp.583-589. [15] IS Kohane, AT Kho, AJ Butte (2003), “Micro arrays for an Integrative Genomics”, IT Press. [16] Doulaye Dembele and Philippe Kas tner (2003), “Fuzzy C-means method for clustering microarray data”, Oxford University Press, Bioinformatics Vol.19no.8, Pages973-980. [17] Heyer, L.J., et al. (1999) “Exploring Expression Data: Identification and analysis of Co expressed Genes”. Genome Research, 9:1106-1115. [18] Anindya Bhattacharya and Rajat K.De (2008), “Divi- sive Correlation Clustering Algorithm (DCCA) for grouping of genes: detecting varying patterns in ex- pression profiles”, Published by Oxford University Press, Bioinformatics 2008 24(11):1359-1366. [19] Yi Lu, Shiyong Lu, Farshad Fotiuhi, Youping Den g and Susan J Brown (2004), “Incremental genetic K- means algorithm and its application in gene expres- sion data analysis”, BMC Bioinformatics, 5:172. H.Swathi received the B.E degree in Electrical and Electron- ics Engineering from Anna Univ ersity, Chennai in the year of 2007. She received the M.E degree i n Software Engineering from Anna University, Coimbatore i n the year of 2009. She is currently working as Le cturer in the Departmen t of Information Technology, Vivekanandha College of Enginee ring for Wom- en, Tiruchengode. Her curren t research interests include various aspects of theoretical , methodological and ap plied research in Data mi ning, Bioinformatics and Sotware Engineering.
Original Paper
Loading high-quality paper...
Comments & Academic Discussion
Loading comments...
Leave a Comment