Kernel Granger causality and the analysis of dynamical networks
We propose a method of analysis of dynamical networks based on a recent measure of Granger causality between time series, based on kernel methods. The generalization of kernel Granger causality to the multivariate case, here presented, shares the fol…
Authors: Daniele Marinazzo, Mario Pellicoro, Sebastiano Stramaglia
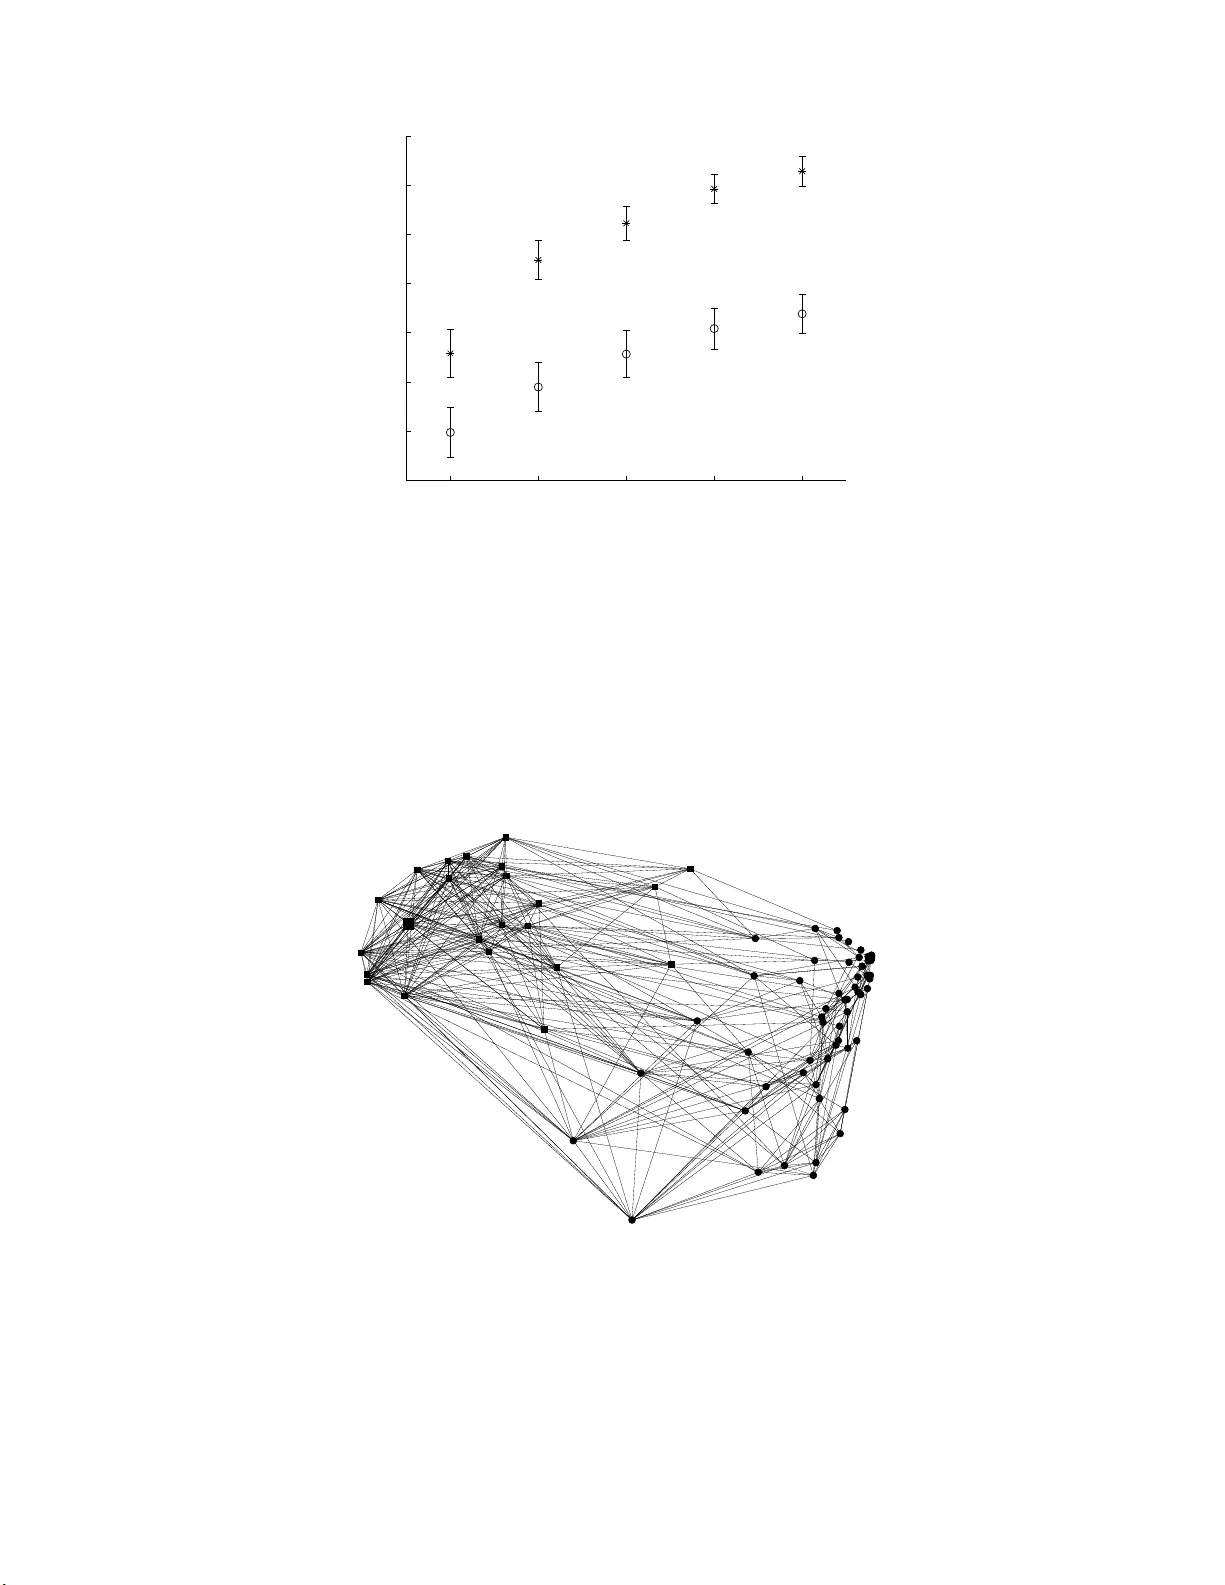
Kernel Granger causalit y and the analysis of dynamical netw orks D. Marinazzo, ∗ M. P ellicor o, † and S. Stramaglia ‡ Dip artimento Inter ate ne o d i Fisic a, Universit` a di Bari, I-70126 Bari, Italy, TIRES-Center of Innovative T e c hnolo gies for Si gnal Dete ct ion and Pr o c essing, Univers it` a di Bari, Italy, and I.N.F.N. , Sezione di Bari, I-70126 Bari, Ita ly (Dated: N o vem b er 26, 2024) W e propose a metho d of analysis of dynamical netw orks based on a recen t measure of Granger causalit y b etw een time series, based on kernel meth o ds. The generaliza tion of kernel Granger causalit y to the multi v ariate case, h ere presented, shares the follo wing features with the biv ariate measures: (i) the nonlinearit y of the regression mo del can b e controlled by choosing the kernel function a nd (ii) the problem of false-causal ities, arising as th e complexit y of the mo del increases, is addressed by a selection stra tegy of t h e eigen vectors of a reduced Gram matrix whose range represen ts the additional features due to the second time series. Moreo ver, there is no a priori assumption that th e netw ork must b e a d irected acyclic graph. W e apply the prop osed app roac h to a net work of c haotic maps and to a sim ulated ge netic regulatory netw ork: it is sho wn that the underlying top ology of the netw ork can b e reconstructed from time series of no de’s dy namics, pro vided that a sufficien t num b er of samples is av ailable. Considering a linear d ynamical netw ork, built by preferential attac hment scheme, we sho w t hat for limited data use of biva riate Granger causalit y is a b etter c hoice w.r.t metho ds using L 1 minimization. Finally we consider real expression data from HeLa cells, 94 genes and 48 time p oints. The analysis of static correlations b etw een genes revea ls tw o modu les corresponding to w ell k no wn transcription factors; Granger analysis puts in evidence nineteen causal relationships, all invol ving genes related to tumor devel opment. P ACS n umbers: 05.45.Xt , 87.18.Vf I. INTR ODUCTION Dynamical netw orks [1] mo del physical and biological b ehavior in many a pplications; exa mples range from netw orks of neurons [2], J osephson junctions arrays [3 ] to genetic netw orks [4], protein in teractio n nets [5] a nd metab olic net works [6]. Sync hronizatio n in dynamical net works is influenced by the top ology of the netw ork [7]. A gr eat need exists for the developmen t o f effectiv e metho ds of inferr ing netw ork s tructure from time s eries data; a metho d for detecting the topo logy of dyna mical netw ork s , based on chaotic synchronization, has b een prop osed in [8]; a r ecent approach deals with the case of low num b er of s a mples and prop osed metho ds ro o ted on L1 minimization [9]. Granger caus alit y has b ecome the method of choice to determine whether and how tw o time series exert causa l influences on each o ther [10]. This appro ach is based on prediction: if the pr ediction error of the first time s eries is reduced by including mea surements from the seco nd one in the linear reg ression model, then the seco nd time series is sa id to hav e a causal influence on the first one. This frame has b een us e d in many fields of science, including neural systems [11], reo -chaos [12] and cardiov ascula r v ariability [13]. The estimation of linea r Gra nger causa lit y from F ourier and wa velet transforms of time ser ies data has b een rece ntly addressed [14]. Kernel algor ithms work b y embedding data into a Hilbert s pace, and s e a rching for linear relations in that spa ce [15]. The embedding is perfor med implicitly , b y spec ifying the inner pro duct b etw een pairs of points [1 6]. W e hav e recently exploited the prop erties o f kernels to pr ovide no nlinear meas ures o f biv ariate Grang er causality [17]. W e reformulated linear Grang er causa lity and intro duced a new s ta tistical pro cedure to handle ov er-fitting [18] in the linear case. O ur new form ulation was then generalized to the nonlinear case by means of the kernel trick [1 6], th us obtaining a metho d with the following t wo main fea tures: (i) the no nlinea rity of the regr ession mo del can b e controlled by choo sing the kernel function; (ii) the problem of false-c a usalities, whic h ar ises as the complexity of the mo del increas es, is addres s ed b y a selection strateg y of the eigenv ectors of a reduced Gram matrix whose range represents the additiona l features due to the seco nd time series. In this pap er w e describ e in detail the kernel Granger appr oach and a ddress use o f Gra nger causality to estimate, from multiv a riate time series data , the top olog y and the drive-response relationships of a dynamical net work. T o this ∗ Electronic address: daniele.marinazzo@ba.infn.it † Electronic address: mari o.pelli coro@ba.infn.it ‡ Electronic address: sebastiano.stramaglia@ba.infn.it 2 aim, we ge ner alize o ur metho d in [17] to the case of multiv ariate data. The pap er is or ganized as follo ws. In the next section we describ e the k ernel Granger ca usality metho d in the biv aria te case, a dding some details to the presentation in [17]. In s ection I I I we generalize the metho d to pro ces s m ultiv ariate time series data, a nd show tha t the prop osed metho d can discern whether an interaction is direct or mediated by a third time series. The case of dynamical netw orks is describ ed in s ection IV: we analyze a s ystem o f in tera cting chaotic maps and a mo del of gene regulator y net works. In Section V we consider systems with sparse connectivity and limited data, and compare the biv ariate Granger a ppr oach with a multiv ariate metho d based on L1 minimization; then we analyze a r e a l data set, gene expressions of HeLa cells. Section V summar izes our conclusions . II. BIV ARIA TE GRANGER CAUSALITY In this section we review the kernel method fo r Granger caus a lit y prop osed in [17]. Let us start with the linear case. A. Linear Granger causality Suppos e to mo del the tempo ral dynamics of a stationa ry time series { ξ n } n =1 ,.,N + m b y an autor egressive mo del o f order m : ξ n = m X j =1 A j ξ n − j + E n , and b y a biv ar ia te autoregress ive mo del which tak es int o account a lso a sim ultaneously re c o rded time series { η n } n =1 ,.,N + m : ξ n = m X j =1 A ′ j ξ n − j + m X j =1 B j η n − j + E ′ n . The co efficients o f the mo dels are calculated by standard least squares optimization; m is usually chosen a ccording to Ak aike c r iterion [19] or embedding techniques from the theory of nonlinear dynamical systems [20]. The co ncept of Gra nger causality is [1 0]: η Gr a nger-caus e s ξ if the v ariance of residuals E ′ is s ignificantly smaller than the v a r iance of residuals E , a s it happens when co efficients B j are join tly significa ntly different from zer o. This can be tested b y p erforming an F-test or Levene’s test for equality of v a riances [21]. An index measur ing the strength of the ca us al interaction is then defined as: δ = 1 − h E ′ 2 i h E 2 i , (1) where h·i means av era ging ov er n (note that h E i = h E ′ i = 0 ). Exchanging the roles o f the tw o time series, o ne may equally test causa lit y in the opp os ite direc tio n, i.e. to chec k whether ξ Granger -causes η . W e use the shorthand notatio ns: X i = ( ξ i , . . . , ξ i + m − 1 ) ⊤ , Y i = ( η i , . . . , η i + m − 1 ) ⊤ and x i = ξ i + m , for i = 1 , . . . , N . W e trea t these quantities as N realizations of the sto chastic v ariables X , Y and x . Let us denote X the m × N matrix having vectors X i as columns, and Z the 2 m × N matrix having vectors Z i = ( X ⊤ i , Y ⊤ i ) ⊤ as c olumns. The v alues of x ar e or ganized in a vector x =( x 1 , . . . , x N ) ⊤ . In full gener ality w e assume that each co mponent o f X and Y has zer o mean, and that vector x has zero mea n and is normalized, i.e. x ⊤ x =1. Now, for each i = 1 , . . . , N , we define: ˜ x i = m X j =1 A j ξ i + m − j , 3 ˜ x i ′ = m X j =1 A ′ j ξ i + m − j + m X j =1 B j η i + m − j . The vectors ˜ x =( ˜ x 1 , . . . , ˜ x N ) ⊤ and ˜ x ′ =( ˜ x 1 ′ , . . . , ˜ x N ′ ) ⊤ are the estimated v alues by linear regres sion, in the tw o cases. It is easy to show that ˜ x and ˜ x ′ hav e the fo llowing geometrical int erpr etation. Let H ⊆ ℜ N be the r ange o f the N × N ma tr ix K = X ⊤ X . Then ˜ x is the pro jection of x on H . In o ther words, calling v 1 , . . . , v m the (o rthonormal) eigenv ectors o f K with non-v anishing eigenv alue and P = m X i =1 v i v ⊤ i the pro jector on the space H , we hav e ˜ x = P x . Let us define y = x − Px . A nalo g ously ˜ x ′ = P ′ x , P ′ being the pro jector on the 2 m -dimensional space H ′ ⊆ ℜ N , equal to the ra nge of the matrix K ′ = Z ⊤ Z . Moreover, it is easy to show that δ = ˜ x ′ ⊤ ˜ x ′ − ˜ x ⊤ ˜ x 1 − ˜ x ⊤ ˜ x . (2) Now note that H ⊆ H ′ . Therefore we may decompo se H ′ as follows: H ′ = H ⊕ H ⊥ , where H ⊥ is the space of all vectors of H ′ orthogona l to all vectors of H . H ⊥ corresp onds to the a dditional fea tures due to the inclusion o f { η } v ar iables. Ca lling P ⊥ the pro jector on H ⊥ , we can wr ite: δ = || P ⊥ y || 2 1 − ˜ x ⊤ ˜ x . (3) Now we note that H ⊥ is the r a nge o f the matrix ˜ K = K ′ − K ′ P − P ( K ′ − K ′ P ) = K ′ − PK ′ − K ′ P + PK ′ P . Indeed, for an y u ∈ ℜ N , we hav e ˜ Ku = v − P v , wher e v = K ′ ( I − P ) u ∈ H ′ , and ˜ Ku ∈ H ⊥ . It follows that H ⊥ is spanned by the set of the eig en vectors, with non v anishing eigenv alue, of ˜ K . Calling t 1 , . . . , t m these eigenv ector s , we hav e: δ = m X i =1 r 2 i , (4) where r i is the Pearso n’s correla tion co efficient of y and t i (since the overall sign o f t i is arbitrary , w e can assume that r i is p ositive). Let π i be the probability that r i is due to chance, obtained by Student’s t test. Since we are dealing with multiple comparison, we use the Bonferroni correction to select the eigen vectors t i ′ , correla ted with y , with exp ected fraction o f false p os itive q (equal to 0 . 05 ). Therefore we ca lculate a new ca usality index by summing, in equation (4), o nly ov er the { r i ′ } such that π i ′ < q /m , thus obtaining a filter e d linear Gra nger causa lit y index: δ F = X i ′ r 2 i ′ . (5) It is assumed that δ F measures the causality η → ξ , without further statistical test. B. Kernel Granger causality In this subsection we describ e the generalization of linear Gr a nger ca usality to the nonlinear ca s e, using methods from the theory of Repro ducing Kernel Hilb ert Spaces (RKHS) [16]. Given a kernel function K , with sp ectral representation K ( X , X ′ ) = P a λ a φ a ( X ) φ a ( X ′ ) (see Mercer ’s theorem [15]), w e consider H , the ra nge of the N × N Gram matrix K with elements K ( X i , X j ). In or der to make the mea n of all v a riables φ a ( X ) zero, we replace K → K − P 0 K − K P 0 + P 0 K P 0 , where P 0 is the pro jector onto the one-dimensio nal subspace spanned by the vector such that ea c h comp onent is equal to the unity [1 6]; in the following we assume that this op eration has been per formed on eac h Gra m matrix. As in the linear case, w e ca lculate ˜ x , the pro jection of x on to H . Due to the sp e c tr al repr e s en tation of K , ˜ x coincides with the linear r egression of x in the feature space spanned by √ λ a φ a , the eigenfunctions of K ; the regr ession is nonlinear in the orig inal v ariables. 4 While using b oth X and Y to predict x , we ev aluate the Gram matrix K ′ with ele ments K ′ ij = K ( Z i , Z j ). The regress io n v alues no w form the vector ˜ x ′ equal to the pro jection of x on H ′ , the ra nge of K ′ . Before ev a luating the filtered causality index, as in the linear ca se, we note that not all kernels may b e used to ev aluate Grang er causa lit y . Indeed if Y is statistically indep endent o f X and x , then ˜ x ′ and ˜ x should co incide in the limit N → ∞ . This prop erty , in v ariance of the risk minimizer when statistica lly indep endent v ariables are added to the se t of input v ar iables, is satisfied only by suitable kernels, as discuss ed in [22]. In the following we consider tw o po ssible choices, which fulfill the inv ariance requirement. Inhomo gene ous p olynomial kernel . The inhomo geneous po lynomial (IP) kernel of in teger o rder p is: K p ( X, X ′ ) = 1 + X ⊤ X ′ p . In this case the eigenfunctions are made o f all the monomials, in the input v aria bles, up to the p − th deg ree. The dimension of the spa ce H is m 1 = 1 /B ( p + 1 , m + 1) − 1, where B is the b eta function, a nd p = 1 corresp onds to the linea r regres sion. The dimensio n o f space H ′ is m 2 = 1 /B ( p + 1 , 2 m + 1) − 1. As in the linea r cas e, we no te that H ⊆ H ′ and decomp ose H ′ = H ⊕ H ⊥ . Subsequen tly we calculate ˜ K = K ′ − PK ′ − K ′ P + PK ′ P ; the dimension of the range of ˜ K is m 3 = m 2 − m 1 . Along the same lines as those describ ed in the linear c a se, we construct the kernel Granger causality taking into account only the eigenv ectors of ˜ K which pass the Bonferroni test: δ K F = X i ′ r 2 i ′ , (6) the sum b eing only ov er the eig en vectors of ˜ K with pro babilit y π i ′ < q /m 3 . Gaussian kernel . The Gaussia n k ernel r eads: K σ ( X, X ′ ) = exp − ( X − X ′ ) ⊤ ( X − X ′ ) 2 σ 2 ! , (7) and dep ends on the width σ . σ controls the complexity o f the model: the dimension of the rang e of the Gr am matrix decreases as σ increa s es. As in previous cases, we may consider H , the rang e of the Gram matrix K , a nd H ′ , the range of K ′ , but in this case the co ndition H ⊆ H ′ would not necessarily hold; therefore some diff erence s in the approach must be undertaken. W e call L the m 1 -dimensional span of the eigenv ectors of K whose eigenv alue is no t smaller than µλ max , where λ max is the lar gest eigenv alue of K and µ is a s mall num ber (we use 10 − 6 ). W e ev aluate ˜ x = P x , wher e P is the pr o jector on L . After ev aluating the Gr am matrix K ′ , the following matrix is considered: K ∗ = m 2 X i =1 ρ i w i w ⊤ i , (8) where { w } a re the e ig env ectors of K ′ , and the sum is over the eigenv alues { ρ i } not smaller than µ times the largest eigenv alue of K ′ . Then we ev aluate ˜ K = K ∗ − PK ∗ − K ∗ P + PK ∗ P , and denote P ⊥ the pro jector onto the m 3 - dimensional rang e of ˜ K . Note that the condition m 2 = m 1 + m 3 may not b e strictly sa tisfied in this case (howev er in our exper imen ts we find that the violation of this relatio n is alwa ys very small, if a ny). The kernel Granger causa lit y index for the Ga ussian kernel is then co nstructed as in the prev io us ca s e, see equation (6). II I. MUL TIV ARIA TE KERNEL CA USALITY Let { ξ ( a ) n } n =1 ,.,N + m , a = 1 , . . . , M , b e M simultaneously recorded time series. In o rder to put in evidence the drive-respo ns e pa ttern in this system, one may ev aluate the biv ariate Granger ca usality , des c ribe d in the pr evious sections, b etw een every pair of time series. It is recommended, howev er, to tre at the data-s e t as a whole, thus generalizing kernel Gr a nger caus a lit y to the multiv ariate cas e , a s follows. W e denote X ( c ) i = ( ξ ( c ) i , . . . , ξ ( c ) i + m − 1 ) ⊤ , for c = 1 , . . . , M a nd i = 1 , . . . , N . In o rder to ev aluate the causality { ξ ( a ) } → { ξ ( b ) } , we define, for i = 1 , . . . , N , Z i = ( X (1) ⊤ i , . . . , X ( a ) ⊤ i , . . . , X ( M ) ⊤ i ) ⊤ , containing all the input v aria bles, and X i = ( X (1) ⊤ i , . . . , X ( M ) ⊤ i ) ⊤ , 5 containing all the input v a riables but those r elated to { ξ ( a ) } . Gra m matrices K and K ′ are then ev aluated: K ij = K ( X i , X j ) and K ′ ij = K ( Z i , Z j ). The target vector is now x =( ξ ( b ) 1+ m , . . . , ξ ( b ) N + m ) ⊤ . Along the same lines as in the biv ar ia te ca s e, for IP kernel or the Gaus s ian o ne, w e then ca lculate the causality index a s in eq uation (6 ): it is denoted δ K F ( a → b ) and meas ures the s trength of causa lit y a → b , taking into a ccount all the av ailable v ar iables. Repea ting these steps for all a and b , the casuality pa ttern in the data set is ev alua ted. Note that the thres hold for the Bonferro ni’s cor rection, in the multiv a riate case, must b e lowered by the n umber of pairs M ( M − 1) / 2 . A. Three coupled maps As an example, we co nsider the following system of three logis tic ma ps [23]: x 1 ,t = 0 . 8 1 − ax 2 1 ,t − 1 + 0 . 2 1 − ax 2 2 ,t − 1 + sτ 1 ,t , x 2 ,t = 1 − ax 2 2 ,t − 1 + sτ 2 ,t , x 3 ,t = 0 . 8 1 − ax 2 3 ,t − 1 + 0 . 2 1 − ax 2 1 ,t − 1 + sτ 3 ,t ; (9) here a = 1 . 8, s = 0 . 01 and τ ’s are unit v ariance Ga us sian nois e terms. The causal relationships implemen ted in these equations are 2 → 1 a nd 1 → 3. Analyzing s e g men ts of length N = 100 0 , w e ev aluate b oth the m ultiv a riate causality , as descr ibed in section 4, and the biv ariate c a usality for a ll pairs of ma ps. W e use the IP kernel with v ario us v a lues of p ; the results are display ed in figure (1 ). It is well known [11] that p erforming pairwise ev aluation fo r mu ltiv ariate data has the drawbac k that one cannot discer n whether the influence b etw een tw o time series is dir ect or is mediated b y other time series. This is wha t happ ens in the pr esent example. Bo th the multiv ariate and the biv aria te analysis reveal the influences 2 → 1 and 1 → 3 . On the other hand, the biv aria te ana ly s is reveals a lso the influence 2 → 3, which is actually media ted by 1: the multiv ariate analysis recognizes 2 → 3 as non-sig nifica tiv e. IV. ANAL YSIS OF D YNAMICAL NETW ORKS In this se c tio n we simulate tw o dynamical netw or k s and apply the m ultiv a riate Gr anger a nalysis to estimate the topo logy structure of sys tems from time series data. A. Netw ork of c haotic maps Let us consider a coupled map lattice o f n no des, with equations, for i = 1 , . . . , n : x i,t = 1 − n X j =1 c ij 1 − ax 2 i,t − 1 + n X j =1 c ij 1 − ax 2 j,t − 1 + sτ i,t , (10) where a , s and τ ’s are the sa me as in equa tion (9), and c ij represents the coupling j → i . W e fix n = 34 and construct couplings as follo ws. W e c o nsider the w ell known Za ch ar y data set [24], a n undirected net work of 34 no des. W e assign a direction to each link, with equal probability , and set c ij equal to 0.05 , for each link of the directed graph th us o btained, and zero otherwis e . The netw ork is display ed in figure (2): here the goa l is to e s timate this directed net work fro m the measurements of time series on no des. The multiv ariate Gra nger ana ly sis, descr ibed in the pr e v ious section, p erfectly r e c overs the underlying net work using the IP kernel with p = 2, m = 1 and N = 1 0 000. Note that while ev aluating δ K F ( j → i ), for all i and j , 39270 Pearson’s co efficients r are calculated. Their distribution is represented in fig ur e (3): there is a strong p eak at r = 0 (corresp onding to pro jections that are discarded), and a v ery low n umber of pro jections with a r ather large v alue of r , up to a b out r = 0 . 6. It is interesting to describ e the results in terms of a threshold for correlations. Given a threshold v alue r , we select the co rrelation co efficients whos e v alue is gr e a ter than r . W e then calculate the corresp onding causality indexes δ K F ( j → i ), and construct the directed netw ork whose links co rresp ond to non-v anishing elements of δ K F ( j → i ). In figure (4)-top we plot the to ta l num b er o f links of the reconstructed netw ork, as a function of the threshold r : th e curv e shows a plateau, around r = 0 . 1, corresp onding to a directed netw ork whic h is stable against v a riations of r . At the plateau 4 28 pro jections ar e se lec ted, which coincide with those selected by means of Bonferroni’s test. In figure (4)-b ottom we plot the num b er of err o rs (the sum of the num b er of links that exist in the true net work and are not recov ered, plus the num be r o f links that exist o nly in the recov ered netw ork) versus the threshold r : the plateau leads to perfect reco nstruction of the original netw ork. W e stress that a large num ber 6 of sa mples is needed to recov er the underlying netw ork : in th e t ypical case we find tha t the netw ork is perfectly reconstructed if N ≥ 5000, whilst if N is further low ered some erro rs in the reco nstructed net work a ppea r. Moreover, it is imp ortant to observe that, although all couplings c ij hav e the same magnitude, the causa lit y strengths δ K F ( j → i ) depend on the link, as it is shown in figure (5). Gra nger ca usalit y is a measure of the information b eing tra nsferred from one time s eries to another, and it should not b e identified with couplings. B. Genetic regulatory netw ork In this subsection we consider time series from a mo del o f genetic reg ulatory netw ork made o f genes link ed by weigh ted c onnections (inhibitory or e x citatory) [25]. The expression levels of all genes, or ganized in a vector g , evolve as follows: g t +1 = g t + A ( g t − T I ) + Σ , (11) where A is a connectivit y strength ma trix co rresp onding to the netw ork, T = 50, I is the identit y matrix and Σ is a vector of random v ariables uniform in [ − 10 , 1 0 ]. The v a lues o f g are restricted b y flo or and ceiling function to range in [0 , 100 ]: this constraint provides the no nlinear character of the mo del. As the simulation r uns, multiv ariate data are sa mpled every t s time steps. Moreov er, the co ntin uous data v alues a re discretized into n c categories (with equal bin sizes). In [25] dyna mic Bay esian net work (DBN) models [26] were trained to data o f length N to recov er the structure of matrix A : the v alues t s = 5, n c = 3 and N ≥ 2 000 were found to lead to the bes t rec o nstruction of genetic net works b y DBN. The genetic netw ork we consider here is a n example from [25] and consists of ten genes with co nnections describ ed in figure (6): ther e are tw o indep endent r egulatory pa th wa ys, one of which includes a la rge feedback structure. In figure (7) the typical curve of expression for a gene in the net work is repr esented (top); the distribution of ex pr essions, for the same gene, is bimo da l (b ottom). W e simulate 10 0 times the system e q uations, starting from different initial conditions, and sample time ser ies o f length N = 2 0 00, t s = 5 and n c = 3. The typical rec ov ered netw ork by DBN, on this ex ample, corres po nds to o ne missing link (from no de 7 to 10) [2 5]. The linea r m ultiv a riate Grang er approach, with m = 2, lea ds to p erfect reco nstruction of the netw ork in 90 cases out of the 1 00; w e obtain similar results on all the examples presented in [25]. Using IP (with p > 1) a nd Gaussia n kernels w e obtain similar p erformances as the ones from the linear k ernel. It is in teresting to s tr ess that the p ossibility that o ne has to r e c onstruct the true g enetic netw ork dep ends on the sampling rate. In figure (8) we plot the mean n umber of erro rs (ov er 1 00 realizations ) in the reconstructed netw ork as a function of t s for the linear kernel and Gaussian kernel: the p erfor mance degr ades as t s gets far from 5. Let us now discuss the case of large t s : all Grang er causa lities a r e re c ognized a s no n sig nificativ e. On the other hand, at larg e t s , we find significant static linear co rrelations be t ween time ser ies of all pairs of genes belo nging to the same pathw ay . In o ther words, referr ing to fig ure (6), the linear co rrelations of times s eries fro m every pair o f g e nes extracted from { 1 , 2 , 3 , 4 , 8 , 9 } is significant, as well a s the linear corr elation for every pair extr acted from { 5 , 6 , 7 , 1 0 } ; consistently the linear correla tio n, for pairs of genes from different pathw ays, is no t s ignificant. W e conclude that, at large t s Granger causa lit y a nalysis is not effective, but static corre lation analysis may anyw ay put in ev idence gr o ups of genes b elonging to the same regula tory pathw ay . V. SP A RSEL Y CONNECTED DYNAMICAL NETW ORKS AND LIMITED D A T A The Gra nger causality approach for dynamical netw orks here pr e sent ed requires a la rge amount of data samples to provide trus ta ble answers. How ever, there are s ituations (frequent in Bio informatics) where the num b e r o f samples is s maller than the n umber of v a riables (ge nes ): in these situations the mu ltiv ariate Granger approach is unfeasible. Under the assumption of spars e connectivity , it has b e en prop os ed to repla c e least sq uares metho dology with a m ultiv ariate approach using minimization with resp ect to L 1 norm [9]. Here we show that there are situations where, even in pr e s ence of sparse connectivity and limited data, use of biv ariate Granger causality is a b etter choice w.r.t L 1 minimization. Indeed, in these ca ses, the statistical robustness of the estimation of information flow b etw een pairs of time series may still b e go o d, with the drawback that some ca usality links, found by the biv ariate approach, may not be direct but mediated. W e construct a netw ork o f 100 no des and 1 00 links using the preferential attac hment pr o cedure [27]; we giv e randomly a direction to each link, with 1 / 2 pro ba bilities, th us obtaining a dire c ted netw ork. Let us denote d ( i ) the 7 n umber of no des from which a link p oint ing to i starts. W e evolv e a linea r system on this netw ork, with equations: x i,t = a i x i,t − 1 + X j → i 0 . 8 d ( i ) x j,t − 1 + τ i,t . (12) The sum is ov er no des such that j → i is a link of the netw ork; τ ’s are unit v a riance Gaussianly distributed noise terms; a i is one, if d ( i ) = 0, and 0 . 2 otherwise. After a transient, we sample n s consecutive tim e po in ts, with n s = 20 , 30 , 4 0 , 50 , 60 . The L 1 appro ach we use is the following. F or each i = 1 , . . . , 100, we find the vector c with minim um L 1 norm, among all those s atisfying: x i,t +1 = 100 X j =1 c j x j,t , (13) t = 1 , . . . , n s − 1. The interaction j → i is consider ed significant if the absolute v alue of c j exceed a threshold, fixed so that the total num b er of false p ositive connections is five. Subsequen tly we apply the biv ariate linear Grange r approach, descr ib ed in Section I IA, for each pair of no des: also for Gr anger’s appro ach we fix a threshold for the correla tio n co efficients r , see equation (4), so that the total num b er of false p ositive connections is five. In figure (9) we depict the num b er o f true p ositive connections found by the tw o a pproaches, a s a function of n s . It is clear that here the biv a riate Granger appro ach outper forms L 1 minimization. A. HeLa gene expression regulatory netw ork HeLa is the most famo us cell culture line to date [28]. These are cells iso lated from a h uman uterine cervical carcinoma in 1951 and used in bio medical research esp ecially to culture viruses. Whilst the patient ultimately died of her cancer eight months after the op era tion, her cells have lived on, still surviv ing in lab ora tories to day . HeLa cells hav e somehow acquired cellular immortality , in that the normal mechanisms of pr o grammed cell death after a certain n umber of divisions hav e somehow been switc hed off. W e apply our approach to the HeLa cell gene ex pr ession da ta of [29 ]. Data cor resp onds to 94 genes a nd 48 time po in ts, with an ho ur interv al separating t wo successive readings (the HeLa cell c y cle lasts 1 6 ho ur s). The 94 genes were selected, from the full data set describ ed in [3 0], o n the bas is of the as so ciation with cell cycle regulation a nd tumor development . First of all, we p erform the analysis o f the static pa ir wise cor relations b etw een time series: 800 pairs of genes are significantly correlated. Drawing a link for each co rrelated pair leads to an undirected netw ork depicted in figure (10): it is clear that ther e are tw o mo dules, and symbols in figure (10) corresp onds to the partition by the method of mo dule iden tification describ ed in [31]. The first mo dule is made o f 23 genes and corresp onds to the r egulatory netw ork of the transcriptiona l factor NFkB [3 3]; it contains several w ell known activ ators and tar gets o f NFkB [34], like, e.g., A20, ICAM-1, IL-6 ,V CAM-1, Ik appaB a, JunB, MCP-1, FGF 2, Cyclin. The second mo dule, 62 g enes, app ears to b e orchestrated by transcr iptional factors p53 and ST A T3 . Note, how ever, that the t wo modules are not indep endent , as they for m a highly rela ted netw ork. The proto- oncongene c-myc app ears to b e central betw een the tw o mo dules: it has 12 significant s ta tic cor relations with b o th mo dules. After the discussio n in section IV-B, we assume that the mo dular structure depicted in figure (10) is the r esult o f regulatory mechanisms a cting o n time scales muc h smaller than the sa mpling time. Next, in order to detect causalities acting on the time s c a le of the sampling time, we apply biv aria te Grang er causality analysis. F or all pairs ( i, j ), we use the linea r version ( p = 1, m = 1) of our appr oach and ev aluate the Pearson corre lation co e fficient r , equation (4), for the ca usality i → j . Due to the small n umber of samples, we do not use t-test to ev aluate the proba bilit y π co r resp onding to r : we genera te a set of sur rogates by p ermuting the temp oral indices of the i-th times series while keeping fixed those of the j-th time series. The pr obability π is identified with the fraction of times that an higher co efficient is obtained ov er 3 × 10 6 random shufflings of time indices o f the i- th time series. Moreover, we use the F als e Discov ery Rate (FDR) metho d [32] instead of Bonferr oni’s cor rection. FDR works in the following way: the 9 4 × 93 = 874 2 Pearson co efficient s a re or der ed, { r ℓ } , accor ding to their incr easing π ℓ v alues, and a par ameter q , which cont ro ls the fraction of false po sitive, is set to 0 . 05. The index ℓ ′ is identified a s the lar gest s uc h that for a ll ℓ ≤ ℓ ′ we hav e π ℓ ≤ ℓq 8742 . Pearson co efficients r ℓ are a ccepted for ℓ ≤ ℓ ′ . This pro c e dur e selects 1 9 causal relationships, out of 8742; they are listed in T able I. Ik appaBa is the most abundant inhibitory protein for NFkB [35 ]: our a pproach detects the sig nificant causality Ik appa Ba → NFkB. W e find tha t NFkB is also casually related to IAP , an ant i-a po ptotic gene, and B99 (a direct target for transcriptional activ ation by p53: here no significant interaction b etw een B99 and p53 ha s bee n detected). Three causality relationships inv olve Bcl-xL, the dominant regulator of ap optosis (active cell suicide) and TSP1 , a p eptide shown in s ome tumor s y stems to be linked with ang io genesis. Notably T able I also co nt ains fibro blast growth factors, F GF7 and FGFR4, the tumor necro sis 8 Ik appaBa → NFkB NFkB → B99 IAP → NFk B c-myc → FGFR4 TSP1 → c-myc Killer/DR5 → c- myc R2 → c-myc VCAM-1 → TPD52L Bcl-XL → OCT 4 A20 → Bcl-XL IRF-2 → BR CA1 TSP1 → Bcl-XL Cyclin E1 → E2F-1 OCT4 → VCAM-1 F GF7 → MCP-1 TPD52L → TNF-a TPD52L → MAS PIN PKIG → ICAM-1 PKIG → TSP1 T ABLE I: Causalities for HeLa gene netw ork. factor Killer /DR5, the m yeloid tumor suppresso r g ene PKIG, the tumor protein TPD52-L and Cyclin E1, a gene which is overexpressed in many tumors. In [2 9] data hav e b een analyze d with the spar se vector autor egressive mo del, a m ultiv ar iate L1 approach which depends o n a regularization para meter, λ , fixed b y cross-v alidation. Only one causality relationship, out of the 19 in T able I, was r evealed also in [2 9]: A20 → B cl-XL. VI. DISCUSSION Our metho d of analys is of dynamical netw o rks is based on a recent measure o f Grang er causa lit y b etw een time series, ro o ted on kernel metho ds, who s e mag nitude dep ends on the amount of flow of information from one series to another. By definition of Gr anger c a usality , o ur metho d allows analysis of netw or ks containing cycles. Firstly we have demonstrated the effectiv eness of the metho d on a netw ork of chaotic maps with links obtained assigning a direction to the edg es of the well known Zachary da ta set, using a nonlinear kernel: p erfect reconstruction of the directed net work is achiev ed provided that a s ufficient num b er o f samples is av ailable. Secondly we studied a sim ulated genetic regula tory netw ork. The results fro m our metho d were better than those from DBN a pproach. How ever our p erformance was strongly dependent on the sa mpling time, as it o c c ur red also using DBN method. In this example, use of IP k ernel, with ( p > 2), o r Gaussian kernels did not lead to improv ement in the per formance with resp ect to the linea r kernel: this means that these kernel are not suitable to model the nonlinear constraint connected to the fact that expr essions are co nfined in [0 , 10 0]. F urther work will b e devoted to the sea rch for kernels capable to ca pture this kind of nonlinear it y: for a given a pplica tion one should choos e the pro per kernel out of the many po s sible classes [16]. Then w e considered the case of sparse connectivity a nd limited data. Using an exa mple consisting in a linear dynamical net work on a graph grown b y preferential a ttac hment, we hav e shown that there are instances where the m ultiv ariate Granger a pproach is unfeasible, but the application o f biv ariate Granger a nalysis, to every pair of time series, leads to b etter results than those from a metho d ba sed o n L1 minimization. Finally w e have a nalyzed a real data set of temp oral gene expres sion s a mples fro m HeLa cells . The static corr elation a nalysis betw een time series , which is the result o f regulation mechanisms with time scaler fas ter than the sampling rate, revealed the presence of t wo mo dules. Use of biv ariate Gra nger causality has put in evidence 19 ca usality relations hips a c ting on the time scale of one hour, a ll inv olving genes playing s ome role in pro cesses rela ted to tumor developmen t. Our result on HeLa data has very little ov erlap with those from the output of a metho d based on mult iv ariate L1 minimization, but this is not surprising, a s we observed the same fact a lso on the linea r dynamical mo del o f Section V, where the tr ue connectivity was known. W e remark that currently av ailable da ta size and data qualit y ma ke the reconstruction of gene netw orks from gene expressio n data a challenge. Detecting c a use-effects influences b etw een c o mpo nen ts of a c omplex system is an active mult idisciplinary area of research in these years. The kernel appr oach here pr esent ed, provides a statistically robust tool to a s sess drive-respo nse relationships in many fields of science. 9 The a uthors thank J. Y u, A. Hartemink a nd E. Jarvis (Duke Univ ersity , USA) and A. F uijta, C.E. F err eira (Uni- versit y o f Sao Paolo, Bra zil) for v alua ble co rresp ondences. [1] A.L. Barabasi , Linke d: the new scienc e of networks . (Perseus Publishing, Cambridge Mass., 2002); S. Boccaletti, V. Latora, Y. Moreno, M. Cha vez and D.-U. Hwa ng, Phys. Rep. 424 , 175 (2006).. [2] L.F. Abb ott, C. van V reeswijk, Phys. Rev. E 48 , 1483 (1993). [3] K. Wiesenfeld, Physica B 222 , 315 (1996). [4] T.S. Gardner, D. Bernardo, D. Lorenz, J.J. Collins, Science 301 , 102 (2003). [5] C.L. T ucker, J.F. Gera, P . Uetz, T rends Cell Biol. 11 , 102 (2001). [6] H. Jeong, B. T ombor, R. Alb ert, Z.N. Oltv ai, A.L. Barabasi, Nature 407 , 651 (2000). [7] M.E. Newman, Phys.Rev.Lett. 89 , 208701 (2002); S. Boccaletti, D.U. Hw ang, M. Cha vez, A. A mann, J. Kurths, and L.M. P ecora, Ph ys. R ev. E 74 , 16102 (2006). [8] D. Y u, M. Righero, L. Ko carev, Phys.Rev.Lett. 97 , 18870 1 (2006). [9] D. N apoletani, T. S auer, Ph ys. Rev. E 77 , 26103 (2008). [10] C.W.J. Granger, Econometrica 37 , 424 (1969); for recent reviews see K. Hlav ack ov a-Schindler, M. Palus, M. V ejmelk a, J. Bhattac harya, Physics Rep orts 441 , 1 (2007), and M. Lungarella, K. Ishiguro, Y . Kuniyoshi, N. O tsu, Int. J. Bifurcation and Chaos 17 , 903 (2007). [11] M. Kaminski, M.Z. Ding, W.A. T ruccolo, S.L. Bressler, Biologica l Cyb ernetics 85 , 145 (2001); K.J. Blino wsk a, R. Kus, M. Kaminski, Phys. Rev. E 70 , 50902(R) (2004); A.K. Seth, Netw ork: Computation in Neural Sy stems 16 , 35 ( 2005). [12] R. Ganapathy et al., Phys. Rev. E 75 , 16211 (2007). [13] L. F aes, G. Nollo, K.H. Chon, An nals of Biomedical Engineering 36 , 381 (2008). [14] M. D hamala, G. Rangara jan, M. Ding, Phys.Rev.Lett. 100 , 18701 (2008). [15] V. V apnik, Statistic al L e arning T he ory ( John Wiley & Sons, INC., 1998). [16] J. S ha we-T aylor and N. Cristianini, Kernel Metho ds F or Pattern Analysis . (Cambridge Universi ty Press, London, 2004). [17] D. Marinazzo, M. Pel licoro and S. Stramaglia, Kernel metho d for nonline ar Gr anger c ausality , preprint arXiv:0711. 2643 , accepted for pu blication in Physical Review Letters. [18] M. Palus, M. V ejmelk a, Phys. Rev. E 75 , 56211 (2007); H. Nalatore and M.Z. Ding, Phys. Rev. E 75 , 31123 ( 2007); K. Ishiguro, N. O tsu, M. Lungarella, Y. Kuniyoshi, Ph ys. R ev. E 77 , 26216 (2008). [19] H. A kai ke, IEEE T rans. A utom. Con trol 19 , 716 (1974). [20] H. Kantz, T. Schreiber, Nonline ar time series analysis (Cam bridge Universit y Press, Cambridge, 1997). [21] J. Gewek e, Journal of the American Statistical Association, 77, 304 (1982). [22] N. A n cona and S. Stramaglia, Neural Comput. 18 , 749 (2006). [23] E. O tt, Chaos in dynamic al systems . ( Cambridge Universit y Press, Lond on, 2002). [24] W.W. Zac hary , J. Anthropol. Res. 33 , 452 (1977). [25] J. Y u, V.A. Smith, P .P . W ang, A.J. H artemink, and E.D. Jarv is, Bioninformatics 20 , 3594 ( 2004). [26] N. F riedman, M. Linial, I. Nachman, and D. Pe’er, J. Comput. Biol. 7 , 601 (2000). [27] A.L. Barabasi, R. Alb ert, Science 286 , 509 (1999). [28] J.R. Masters, Nature R eviews Cancer 2 , 315 (2002). [29] A. F ujita et al., BMC System Biology 1:39 , 1 (2007). [30] M.L. Whitfi eld et al., Mol. Biol. Cell 13 , 1977 (2002). [31] L. Angelini, S. Bo ccaletti, D. Marinazzo, M. P ellicoro, S. Stramaglia, Chaos 17 , 23114 (2007). [32] J. Benjamini, J. and Y. Ho ch b erg, Y., J.R. Stat. So c. B 57 , 289(1995 ). [33] J. I n oue, J. Gohda, T. Akiyama, K. Semba, Cancer Sci. 98 , 268 (2007). [34] H. L. Pa hl, Oncogene 18 , 6853 (1999). [35] F. Chen, V. Castrano v a, X. S hi, Am. J. Pathol. 159 , 387 (2001). 10 2 3 4 5 0 0.5 1 1−>2 δ F K 2 3 4 5 0 0.5 1 1−>3 2 3 4 5 0 0.5 1 2−>1 δ F K 2 3 4 5 0 0.5 1 2−>3 2 3 4 5 0 0.5 1 3−>1 δ F K p 2 3 4 5 0 0.5 1 3−>2 p FIG. 1: The causal relationships b etw een all pairs of maps, in the example of three logistic maps described in the text , u s ing multi v ariate Granger causalit y (empty circles) and biv ariate Granger causalit y (stars). Here m = 1 and th e IP kernel, with v arious v alues of p , is used. 1 2 3 4 5 6 7 8 9 10 11 12 13 14 15 16 17 18 19 20 21 22 23 24 25 26 27 28 29 30 31 32 33 34 FIG. 2: The directed n etw ork of 34 no des obtained assigning rand omly a d irection to links of the Zac hary netw ork. 11 0 0.1 0.2 0.3 0.4 0.5 0 1000 2000 3000 4000 5000 6000 7000 8000 9000 r # entries FIG. 3: The distribution of the 39270 r - v alues calculated while ev aluating the causalit y indexes of the coupled map lattice (see the text). 0 0.1 0.2 0.3 0.4 0.5 0 50 100 150 r # links 0 0.1 0.2 0.3 0.4 0.5 0 50 100 150 r # errors FIG. 4: (top) Concerning th e coupled map lattice, the horizon tal axis represents the threshold for the v alues of r ; the plot sho ws the number of links of the d irected netw ork constructed from th e pro jections whose Pearso n’s co efficien t exceeds the threshold. (b ottom) The total number of errors, in the reconstructed n etw ork, is plotted vers us the threshold r . At large r th e errors are due only to missing links, whereas at large r th e errors are d u e only to links th at do not exist in the true n e tw ork and are reco vered. 12 5 10 15 20 25 30 5 10 15 20 25 30 FIG. 5: The causality indexes δ K F ( j → i ), for all pairs of maps, are represen ted in a gray scale. White sq u are means zero causalit y , b lack squares corresp ond to the maximal causalit y observed (0.55). 1 2 3 4 5 6 7 8 9 10 −0.20 −0.05 0.10 −0.10 −0.20 −0.20 −0.10 −0.05 −0.15 FIG. 6: The genetic regula tory n et work analyzed in the t ex t. Numbers next to links sp ecify regula tion strength; arro ws: excitatory; flat heads: inhibitory . 13 0 200 400 600 800 1000 0 20 40 60 80 100 t g 0 20 40 60 80 100 0 100 200 300 g # entries FIG. 7: T op: the typical cu rve of exp ression of a gene in the simulated regulatory netw ork. Bottom: the distribution of expressions for t he same gene. 1 2 3 4 5 6 7 8 9 10 0 0.5 1 1.5 2 2.5 3 t s FIG. 8: The mean num b er of errors (ov er 100 realiza tion of the system of length N = 2000) obtained u sing linear kernel ( p = 1, empty circles) and Gaussian kernel (stars), is plotted versus the sampling time t s . In the Gaussian case, σ = 50 is used. The leve l of discretization is n c = 3 and m = 2. 14 20 30 40 50 60 0 10 20 30 40 50 60 70 n s TP FIG. 9: The true p ositive connections found by biv ariate Granger approach ( stars) and b y m ultiv ariate L 1 minimization (empty circles)on t he preferenti al attachmen t dynamical netw ork. The error bar represents one standard d eviation, ev aluated o ver 50 realizatio ns. The num b er of false p ositive connections is alw ays 5. FIG. 10: The undirected netw ork obtained d ra wing a link b etw een all pairs of significantly correl ated genes of t h e HeLa data set (9 genes are not represen ted here as they are not correlated with any other gene; hence the n umb er of no des is 85). Squares and circles corresp onds to the partition in tw o mod ules p erformed by the metho d describ ed in [31]. The large squ are corresp onds to the transcriptional factor NFk B.
Original Paper
Loading high-quality paper...
Comments & Academic Discussion
Loading comments...
Leave a Comment