P-values for high-dimensional regression
Assigning significance in high-dimensional regression is challenging. Most computationally efficient selection algorithms cannot guard against inclusion of noise variables. Asymptotically valid p-values are not available. An exception is a recent pro…
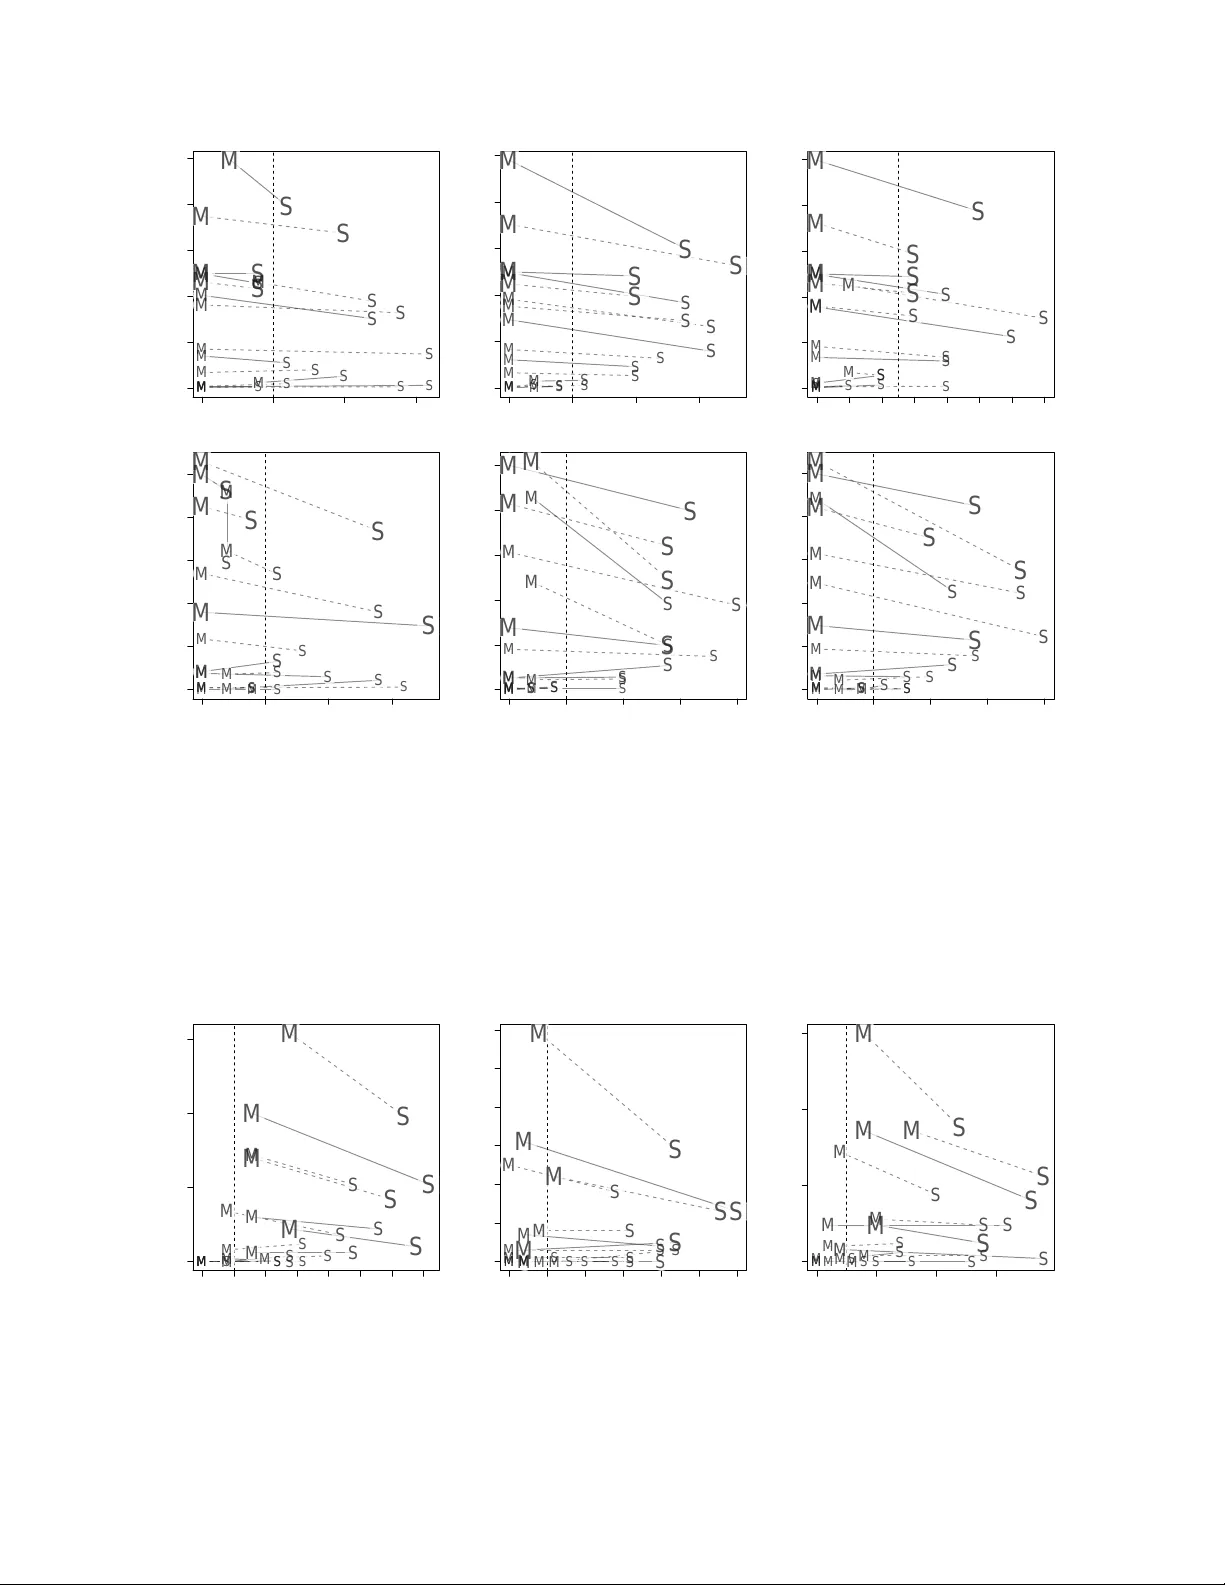
Authors: Nicolai Meinshausen, Lukas Meier, Peter B"uhlmann
P-V alues for High-Dimensional Regression Nicolai Meinshausen ∗ † Luk as Meier ∗ ‡ P eter B ¨ uhlmann ‡ No v em b er 26, 2024 Abstract Assigning significance in high-dimensional regression is c hallenging. Most computa- tionally efficien t selection algorithms cannot guard against inclusion of noise v ariables. Asymptotically v alid p-v alues are not a v ailable. An exception is a recen t prop osal b y W asserman and Ro eder (2008) whic h splits the data in to t wo parts. The n um b er of v ariables is then reduced to a manageable size using the first split, while classical v ariable selection techniques can b e applied to the remaining v ariables, using the data from the second split. This yields asymptotic error control under minimal conditions. It inv olv es, ho wev er, a one-time random split of the data. Results are sensitive to this arbitrary c hoice: it amoun ts to a ‘p-v alue lottery’ and mak es it difficult to reproduce results. Here, we sho w that inference across m ultiple random splits can b e aggregated, while k eeping asymptotic con trol o ver the inclusion of noise v ariables. W e sho w that the resulting p-v alues can be used for con trol of b oth family-wise error (FWER) and false discov ery rate (FDR). In addition, the prop osed aggregation is sho wn to improv e p o w er while reducing the num ber of falsely selected v ariables substan tially . Keyw ords: High-dimensional v ariable selection, Data splitting, Multiple comparisons, F amily- wise error rate, F alse discov ery rate. 1 In tro duction The problem of high-dimensional v ariable selection has received tremendous attention in the last decade. Sparse estimators lik e the Lasso (Tibshirani, 1996) and extensions thereof (Zou, ∗ These authors con tributed equally to this work † Departmen t of Statistics, Universit y of Oxford, UK ‡ Seminar f ¨ ur Statistik, ETH Zuric h, Switzerland 1 2006; Meinshausen, 2007) ha v e b een shown to b e very p o w erful b ecause they are suitable for high-dimensional data sets and b ecause they lead to sparse, in terpretable results. In the usual w ork-flow for high-dimensional v ariable selection problems, the user sets p oten- tial tuning parameters to their prediction optimal v alues and uses the resulting estimator as the final result. In the classical low-dimensional setup, some error control based on p-v alues is a widely used standard in all areas of sciences. So far, p-v alues were not av ailable in high-dimensional situations, except for the prop osal of W asserman and Ro eder (2008). An ad-ho c solution for assigning relev ance is to use the b o otstrap to analyze the stability of the selected predictors and to fo cus on those whic h are selected most often (or even alw ays). Bac h (2008) and Meinshausen and B ¨ uhlmann (2008) s ho w for the Lasso that this leads to a consisten t mo del selection pro cedure under fewer restrictions than for the non-b o otstrap case. More recently , some progress has b een ac hiev ed to obtain error control (W asserman and Ro eder, 2008; Meinshausen and B ¨ uhlmann, 2008). Here, w e build up on the approac h of W asserman and Roeder (2008) and sho w that an extension of their ‘screen and clean’ algo- rithm leads to a more p ow erful v ariable selection pro cedure. Moreov er, family-wise error rate (FWER) and false discov ery rate (FDR) can be con trolled, while W asserman and Ro eder (2008) fo cus on v ariable selection rather than assigning significance via p-v alues. W e also extend metho dology to con trol of the false discov ery rate (Benjamini and Ho ch berg, 1995) for high-dimensional data. While the main application of the pro cedure are high-dimensional data, where the num ber p of v ariables can greatly exceed sample size n , w e show that the metho d is also quite comp etitiv e with more standard error cont rol for n > p settings, indeed often giving a b etter detection pow er in the presence of highly correlated v ariables. This article is organized as follows. W e discuss the single-split metho d of W asserman and Ro eder (2008) briefly in Section 2, sho wing that results can strongly dep end on the ar- bitrary c hoice of a random sample splitting. W e prop ose a m ulti-split method, remo ving this dependence. In Section 3 we pro ve FWER and FDR-control of the multi-split metho d, and we sho w in Section 4 n umerically for simulated and real data-sets that the metho d is more p ow erful than the single-split v ersion while reducing substantially the n um b er of false disco v eries. Some p ossible extensions of the proposed metho dology are outlined in Section 5. 2 2 Sample Splitting and High-Dimensional V ariable Se- lection W e consider the usual high-dimensional linear regression setup with a response vector Y = ( Y 1 , . . . , Y n ) and an n × p fixed design matrix X such that Y = X β + ε, where ε = ( ε 1 , . . . ε n ) is a random error v ector with ε i iid. N (0 , σ 2 ) and β ∈ R p is the parameter v ector. Extensions to other models are outlined in Section 5. Denote b y S = { j ; β j 6 = 0 } the set of activ e predictors and similarly b y N = S c = { j ; β j = 0 } the set of noise v ariables. Our goal is to assign p-v alues for the null-h ypotheses H 0 ,j : β j = 0 v ersus H A,j : β j 6 = 0 and to infer the set S from a set of n observ ations ( X i , Y i ), i = 1 , . . . , n . W e allo w for p oten tially high-dimensional designs, i.e. p n . This makes statistical inference very c hallenging. An approac h prop osed by W asserman and Ro eder (2008) is to split the data in to t w o parts, reducing the dimensionalit y of predictors on one part to a manageable size of predictors (k eeping the imp ortant v ariables with high probabilit y), and then to assign p-v alues and making a final selection on the second part of the data, using classical least squares estimation. 2.1 FWER con trol with the Single-Split Metho d The pro cedure of W asserman and Ro eder (2008) attempts to control the family-wise error rate (FWER), which is defined as the probabilit y of making at least one false rejection. The metho d relies on sample-splitting, performing v ariable selection and dimensionality reduction on one part of the data and classical significance testing on the remaining part. The data are splitted randomly into tw o disjoin t groups D in = ( X in , Y in ) and D out = ( X out , Y out ) of equal size. Let ˜ S b e a v ariable selection or screening pro cedure which estimates the set of activ e predictors. Abusing notation sligh tly , w e also denote by ˜ S the set of selected predictors. Then v ariable selection and dimensionality reduction is based on D in , i.e. we apply ˜ S only on D in . This includes the selection of p otential tuning parameters inv olv ed in ˜ S . The idea is to break do wn the large n um b er p of p oten tial predictor v ariables to a smaller n umber k p with k at most a fraction of n while k eeping all relev ant v ariables. The regression co efficien ts and the corresp onding p-v alues ˜ P 1 , . . . , ˜ P p of the selected predictors are determined based on D out b y using ordinary least squares estimation on the set ˜ S and setting ˜ P j = 1 for all 3 j / ∈ ˜ S . If the selected mo del ˜ S contains the true mo del S , i.e. ˜ S ⊇ S , the p-v alues based on D out are un biased. Finally , each p-v alue ˜ P j is adjusted b y a factor | ˜ S | to correct for the m ultiplicit y of the testing problem. The selected mo del is given b y all v ariables in ˜ S for which the adjusted p-v alue is b elow a cutoff α ∈ (0 , 1), ˆ S single = n j ∈ ˜ S : ˜ P j | ˜ S | ≤ α o . Under suitable assumptions discussed later, this yields asymptotic con trol against inclusion of v ariables in N (false p ositives) in the sense that lim sup n →∞ P h | N ∩ ˆ S sing le | ≥ 1 i ≤ α, i.e. control of the family-wise error rate. The metho d is easy to implement and yields the asymptotic control under w eak assumptions. The single-split metho d relies, how ev er, on an arbitrary split in to D in and D out . Results can change drastically if this split is chosen differen tly . This in itself is unsatisfactory since results are not repro ducible. 2.2 FWER con trol with the New Multi-Split Metho d An ob vious alternativ e to a single arbitrary split is to divide the sample rep eatedly . F or eac h split w e end up with a set of p-v alues. It is not ob vious, though, ho w to com bine and aggregate the results. In the remainder of the section, we will giv e a p ossible answer. F or each h yp othesis, a distribution of p-v alues is obtained for random sample splitting. W e will prop ose that error con trol can b e based on the quantiles of this distribution. W e will sho w empirically that, ma yb e unsurprisingly , the resulting pro cedure is more pow erful than the single-split method. The m ulti-split metho d also mak es results reproducible, at least approximately if the n umber of random splits is chosen to be v ery large. The m ulti-split metho d uses the follo wing pro cedure: F or b = 1 , . . . , B : 1. Randomly split the original data in to t wo disjoint groups D ( b ) in and D ( b ) out of equal size. 2. Using only D ( b ) in , estimate the set of activ e predictors ˜ S ( b ) . 3. (a) Using only D ( b ) out , fit the selected v ariables in ˜ S ( b ) with ordinary least squares and calculate the corresp onding p-v alues ˜ P ( b ) j for j ∈ ˜ S ( b ) . 4 (b) Set the remaining p-v alues to 1, i.e. ˜ P ( b ) j = 1 , j / ∈ ˜ S ( b ) . 4. Define the adjusted (non-aggregated) p-v alues as P ( b ) j = min ˜ P ( b ) j | ˜ S ( b ) | , 1 , j = 1 , . . . , p (2.1) Finally , aggregate ov er the B p-v alues P ( b ) j , as discussed below. The pro cedure leads to a total of B p-v alues for each predictor j = 1 , . . . , p . It will turn out that suitable summary statistics are quan tiles. F or γ ∈ (0 , 1) define Q j ( γ ) = min n 1 , q γ { P ( b ) j /γ ; b = 1 , . . . , B } o , (2.2) where q γ ( · ) is the (empirical) γ -quan tile function. A p-v alue for each predictor j = 1 , . . . , p is then given b y Q j ( γ ), for any fixed 0 < γ < 1. W e will sho w in Section 3 that this is an asymptotically correct p-v alue, adjusted for m ultiplicit y . T o give an example, for a choice of γ = 0 . 5, the quan tit y Q j (0 . 5) is t wice the median of all p-v alues P ( b ) j , b = 1 , . . . , B . A prop er selection of γ ma y b e difficult. Error control is not guaran teed anymore if w e searc h for the best v alue of γ . W e prop ose to use instead an adaptiv e v ersion whic h selects a suitable v alue of the quan tile based on the data. Let γ min ∈ (0 , 1) b e a low er b ound for γ , t ypically 0 . 05, and define P j = min n 1 , 1 − log γ min inf γ ∈ ( γ min , 1) Q j ( γ ) . o (2.3) The extra correction factor 1 − log γ min ensures that the family-wise error rate remains con trolled at lev el α despite of the adaptiv e search for the best quan tile, see Section 3. F or the recommended choice of γ min = 0 . 05, this factor is upp er b ounded b y 4; in fact, 1 − log(0 . 05) ≈ 3 . 996. W e comment briefly on the relation b etw een the prop osed adjustment to false disco v ery rate (Benjamini and Ho c h b erg, 1995; Benjamini and Y ekutieli, 2001) or family-wise error (Holm, 1979) con trolling pro cedures. While w e pro vide a family-wise error con trol and as suc h use union b ound corrections as in Holm (1979), the definition of the adjusted p- v alues (2.3) and its graphical represen tation in Figure 1 are v aguely reminiscen t of the false disco v ery rate pro cedure, rejecting h yp otheses if and only if the empirical distribution of p-v alues crosses a certain linear b ound. The empirical distribution in (2.3) is only taken 5 ADJUSTED P−VALUE FREQUENCY 0.0 0.2 0.4 0.6 0.8 1.0 0 20 40 60 80 ADJUSTED P−VALUES ECDF 0.000 0.005 0.010 0.015 0.0 0.1 0.2 0.3 0.4 Figure 1: L eft: a histo gr am of adjuste d p-values P ( b ) j for the sele cte d variable in the motif r e gr ession data example of Se ction 4.3. The single split metho d picks r andomly one of these p-values (a ‘p-value lottery’) and r eje cts if it is b elow α . F or the multi-split metho d, we r eje ct if and only if the empiric al distribution function of the adjuste d p-values cr osses the br oken line (which is f ( p ) = max { 0 . 05 , (3 . 996 /α ) p } ) for some p ∈ (0 , 1) . This b ound is shown as a br oken line for α = 0 . 05 . F or the given example, the b ound is inde e d exc e e de d and the variable is thus sele cte d. 6 for one predictor v ariable, though, whic h is either in S or N . This w ould corresp ond to a m ultiple testing situation where we are testing a single h yp othesis with multiple statistics. Figure 1 sho ws an example. The left panel con tains the histogram of the adjusted p-v alues P ( b ) j for b = 1 , . . . , B of the selected v ariable in the real data example in Section 4.3. The single split metho d is equiv alen t to picking one of these p-v alues randomly and selecting the v ariable if this randomly pick ed p-v alue is sufficiently small. T o a v oid this ‘p-v alue lottery’, the multi-split method computes the empirical distribution of all p-v alues P ( b ) j for b = 1 , . . . , B and rejects if the empirical distribution crosses the brok en line in the right panel of Figure 1. A short deriv ation of the latter is as follows. V ariable j is selected if and only if P j ≤ α , whic h happ ens if and only if there exists some γ ∈ (0 . 05 , 1) suc h that Q j ( γ ) ≤ α/ (1 − log 0 . 05) ≈ α/ 3 . 996. Equiv alently , using definition (2.2), the γ -quan tile of the adjusted p-v alues, q γ ( P ( b ) j ), has to b e smaller than or equal to αγ / 3 . 996. This in turn is equiv alent to the ev en t that the empirical distribution of the adjusted p-v alues P ( b ) j for b = 1 , . . . , B is crossing ab o v e the bound f ( p ) = max { 0 . 05 , (3 . 996 /α ) p } for some p ∈ (0 , 1). This bound is shown as a broken line in the righ t panel of Figure 1. The resulting adjusted p-v alues P j , j = 1 , . . . , p can then b e used for b oth FWER and FDR con trol. F or FWER con trol at level α ∈ (0 , 1), simply all p-v alues below α are rejected and the selected subset is ˆ S multi = { j : P j ≤ α } . (2.4) W e will show in Section 3.2 that indeed, asymptotically , P ( V > 0) ≤ α , where V = | ˆ S multi ∩ N | is the n um b er of falsely selected v ariables under the prop osed selection (2.4). Besides b etter repro ducibilit y and asymptotic family-wise error con trol, the multi-split version is, ma yb e unsurprisingly , more p ow erful than the single-split selection metho d. 2.3 FDR con trol with the multi-split metho d Con trol of the family-wise error rate is often considered as to o conserv ative. If many rejec- tions are made, Benjamini and Ho c hberg (1995) prop osed to control instead the exp ected prop ortion of false rejections, the false disco very rate (FDR). Let V = | ˆ S ∩ N | b e the n um b er of false rejections for a selection method ˆ S and R = | ˆ S | the total n umber of rejections. The false disco very rate is defined as the exp ected proportion of false rejections E ( Q ) , with Q = V / max { 1 , R } . (2.5) F or no rejections, R = 0, the denominator ensures that the false discov ery prop ortion Q is 0, conforming with the definition in Benjamini and Ho ch berg (1995). The original FDR con trolling pro cedure in (Benjamini and Ho ch berg, 1995) first orders the 7 observ ed p-v alues as P (1) ≤ P (2) ≤ . . . ≤ P ( p ) and defines k = max { i : P ( i ) ≤ i p q } . (2.6) Then all v ariables or hypotheses with the smallest k v alues are rejected and no rejection is made if the set in (2.6) is empty . FDR is con trolled this w a y at lev el q under the condition that all p-v alues are indep endent. It has b een shown in Benjamini and Y ekutieli (2001) that the pro cedure is conserv ative under a wider range of dep endencies b etw een p-v alues; see also Blanc hard and Ro quain (2008) for related work. It would, ho w ever, require a big leap of faith to assume an y such assumption for our setting of high-dimensional regression. F or general dep endencies, Benjamini and Y ekutieli (2001) sho w ed that con trol is guaran teed at lev el q P p i =1 i − 1 ≈ q (1 / 2 + log ( p )). The standard FDR pro cedure is working with the ra w p-v alues, whic h are assumed to be uni- formly distributed on [0 , 1] for true n ull hypotheses. The division by p in (2.6) is an effective correction for multiplicit y . The prop osed multi-split metho d, ho w ev er, is pro ducing already adjusted p-v alues, as in (2.3). Since w e are w orking already with m ultiplicity-corrected p- v alues, the division b y p in (2.6) turns out to b e sup erfluous. Instead, w e can order the corrected p-v alues P j , j = 1 , . . . , p in increasing order P (1) ≤ P (2) ≤ . . . ≤ P ( p ) and select the h v ariables with the smallest p-v alues, where h = max { i : P ( i ) ≤ iq } . (2.7) The selected set of v ariables is denoted, with the v alue of h given in (2.7), by ˆ S multi ; FDR = { j : P j ≤ P ( h ) } , (2.8) with no rejections, ˆ S multi ; FDR = ∅ , if P ( i ) > iq for all i = 1 , . . . , p . The procedure (2.8) will ac hiev e FDR con trol at level q P p i =1 i − 1 ≈ q (1 / 2 + log p ). T o get FDR control at lev el q , we replace q in (2.7) b y q / ( P p i =1 i − 1 ), completely analogous to the standard FDR-pro cedure under arbitrary dep endence of the p-v alues in Benjamini and Y ekutieli (2001). W e will pro ve error control in the follo wing section and show empirically the adv an tages of the prop osed multi-split v ersion o ver b oth the single-split and standard FDR con trolling pro cedures in the later section with numerical results. 3 Error Con trol and Consistency 3.1 Assumptions T o achiev e asymptotic error con trol, a few assumptions are made in W asserman and Ro eder (2008) regarding the crucial requirements for the v ariable selection procedure ˜ S . 8 (A1) Scr e ening pr op erty : lim n →∞ P h ˜ S ⊇ S i = 1 . (A2) Sp arsity pr op erty: | ˜ S | < n/ 2. The scr e ening pr op erty (A1) ensures that all relev an t v ariables are retained. Irrelev ant noise v ariables are allow ed to b e selected, to o, as long as there are not to o many as required b y the sp arsity pr op erty (A2). A violation of the sparsity prop ert y w ould make it imp ossible to apply classical tests on the retained v ariables. The Lasso (Tibshirani, 1996) is an imp ortant example which satisfies (A1) and (A2) un- der appropriate conditions discussed in Meinshausen and B ¨ uhlmann (2006), Zhao and Y u (2006), v an de Geer (2008), Meinshausen and Y u (2009) and Bic k el et al. (2008). The adaptiv e Lasso (Zou, 2006; Zhang and Huang, 2008) satisfies (A1) and (A2) as w ell under suitable conditions. Other examples include, assuming appropriate conditions, L 2 Bo osting (F riedman, 2001; B¨ uhlmann, 2006), orthogonal matching pursuit (T ropp and Gilb ert, 2007) or Sure Indep endence Screening (F an and Lv, 2008). W e will typically use the Lasso (and extensions thereof ) as screening metho d. Other algo- rithms w ould b e p ossible. W asserman and Ro eder (2008) studied v arious scenarios under whic h these t w o prop erties are satisfied for the Lasso, dep ending on the c hoice of the regu- larization parameter. W e refrain from rep eating these and similar arguments, just w orking on the assumption that w e ha v e a selection pro cedure ˜ S at hand which satisfies both the scr e ening pr op erty and the sp arsity pr op erty . 3.2 FWER con trol W e prop osed t w o versions for m ultiplicity-adjuste d p-v alues. One is Q j ( γ ) as defined in (2.2) whic h relies on a choice of γ ∈ (0 , 1). The second is the adaptiv e v ersion P j defined in (2.3) whic h mak es an adaptiv e choice of γ . W e sho w that both quan tities are m ultiplicit y-adjusted p-v alues pro viding asymptotic FWER-error con trol. Theorem 3.1. Assume (A1) and (A2). L et α, γ ∈ (0 , 1) . If the nul l-hyp othesis H 0 ,j : β j = 0 gets r eje cte d whenever Q j ( γ ) ≤ α , the family-wise err or r ate is asymptotic al ly c ontr ol le d at level α , i.e. lim sup n →∞ P h min j ∈ N Q j ( γ ) ≤ α i ≤ α, wher e P is with r esp e ct to the data sample and the statement holds for any of the B r andom sample splits. A proof is given in the app endix. 9 Theorem 3.1 is v alid for any pre-defined v alue of the quantile γ . How ever, the adjusted p-v alues Q j ( γ ) in volv e the somehow arbitrary choice of γ whic h might p ose a problem for practical applications. W e therefore prop osed the adjusted p-v alues P j whic h searc h for the optimal v alue of γ adaptiv ely . Theorem 3.2. Assume (A1) and (A2). L et α ∈ (0 , 1) . If the nul l-hyp othesis H 0 ,j : β j = 0 gets r eje cte d whenever P j ≤ α , the family-wise err or r ate is asymptotic al ly c ontr ol le d at level α , i.e. lim sup n →∞ P h min j ∈ N P j ≤ α i ≤ α, wher e the pr ob ability P is as in The or em 3.1. A proof is given in the app endix. A brief remark regarding the asymptotic nature of the results seems in order. The prop osed error control relies on all truly imp ortant v ariables b eing selected in the screening stage with v ery high probabilit y . This is our scr e ening pr op erty (A1). Let A be the ev en t S ⊆ ˜ S . The results abov e for example in Theorem 3.2 can b e formulated in a non-asymptotic wa y as P [ A ∩ { min j ∈ N P j ≤ α } ] ≤ α, and P ( A ) → 1, t ypically exp onentially fast, for n → ∞ . Analogous remarks apply to Theorem 3.1 and 3.3 b elow. 3.3 FDR con trol The adjusted p-v alues can b e used for FDR con trol, as laid out in Section 2.3. The set of selected v ariables ˆ S multi ; FDR w as defined in (2.8). Here, we show that FDR is indeed con trolled at the desired rate with this pro cedure. Theorem 3.3. Assume (A1) and (A2). L et q ∈ (0 , 1) . L et ˆ S multi ; FDR b e the set of sele cte d variables, as define d in (2.8) and V = | ˆ S multi ; FDR ∩ N | and R = | ˆ S multi ; FDR | . The false disc ov- ery r ate (2.5) with Q = V / max { 1 , R } is then asymptotic al ly c ontr ol le d at level q P p i =1 i − 1 , i.e. lim sup n →∞ E ( Q ) ≤ q p X i =1 1 i . A proof is given in the app endix. As with FWER-con trol, w e could b e using, for an y fixed v alue of γ , the v alues Q j ( γ ), j = 1 , . . . , p instead of P j , j = 1 , . . . , n . W e refrain from giving the full details since, in our exp erience, the adaptiv e version ab o v e works reliably and do es not require an a-priori choice of the quan tile γ that is necessary otherwise. 10 3.4 Mo del Selection Consistency If we let level α = α n → 0 for n → ∞ , the probabilit y of falsely including a noise v ariable v anishes b ecause of the preceding results. In order to get the prop ert y of consistent mo del selection, we ha ve to analyze the asymptotic b ehavior of the p o w er. It turns out that this prop ert y is inherited from the single-split metho d. Corollary 3.1. L et ˆ S single b e the sele cte d mo del of the single-split metho d. Assume that α n → 0 c an b e chosen for n → ∞ at a r ate such that lim n →∞ P [ ˆ S single = S ] = 1 . Then, for any γ min (se e (2.3)), the multi-split metho d is also mo del sele ction c onsistent for a suitable se quenc e α n , i.e. for ˆ S multi = { j ∈ ˜ S ; P j ≤ α n } it holds that lim n →∞ P h ˆ S multi = S i = 1 . W asserman and Ro eder (2008) discuss conditions whic h ensure that lim n →∞ P [ ˆ S sing le = S ] = 1 for v arious v ariable selection metho ds suc h as the Lasso or some forward v ariable selection sc heme. The reverse of the Corollary ab o ve is not necessarily true. The m ulti-split metho d can b e consisten t if the single-split metho d is not. A necessary condition for consistency of the single-split metho d is lim sup n →∞ P [ P ( b ) j ≤ α ] = 1 for all j ∈ S , where the probability is with respect to b oth the data and the random split-point, as there is a positive probability otherwise that v ariable j will not b e selected with the single-split approach. F or the multi- split method, on the other hand, we only need a b ound on quan tiles of P ( b ) j o v er b = 1 , . . . , B . W e refrain from going into more details here and rather sho w with n umerical results that the m ulti-split metho d is indeed more p o w erful than the single-split analogue. W e also remark that the Bonferroni correction in (2.1), m ultiplying the ra w p-v alues with the num b er | ˜ S ( b ) | of selected v ariables, could p ossibly b e improv ed upon b y using ideas in Hothorn et al. (2008), further impro ving the pow er of the pro cedure. 4 Numerical Results In this section w e compare the empirical p erformance of the differen t estimators on sim ulated and real data sets. Simulated data allo w a thorough ev aluation of the mo del selection prop erties. The real data set shows that w e can find signals in data with our prop osed metho d that w ould not b e pick ed up b y the single-split metho d. W e use a default v alue of α = 0 . 05 ev erywhere. 11 4.1 Sim ulations W e use the follo wing sim ulation settings: (A) Sim ulated data set with n = 100, p = 100 and a design matrix coming from a cen tered m ultiv ariate normal distribution with cov ariance structure Cov( X j , X k ) = ρ | j − k | with ρ = 0 . 5. (B) As (A) but with n = 100 and p = 1000. (C) Real data set with n = 71 and p = 4088 for the design matrix X and artificial re- sp onse Y . The data set in (C) is from gene expression measurements in Bacillus Subtilis. The p = 4088 predictor v ariables are log-transformed gene expressions and there is a resp onse measuring the logarithm of the pro duction rate of rib ofla vin in Bacillus Subtilis. The data is kindly pro vided by DSM (Switzerland). As the true v ariables are not kno wn, we consider a linear mo del with design matrix from real data and sim ulating a sparse parameter v ector β as follo ws. In eac h sim ulation run, a new parameter vector β is created b y either ‘uniform’ or ‘v arying-strength’ sampling. Under ‘uniform’ sampling, | S | randomly c hosen comp onen ts of β are set to 1 and the remaining p − | S | comp onen ts to 0. Under ‘v arying-strength’ sampling, | S | randomly c hosen comp onen ts of β are set to v alues 1 , . . . , | S | . The error v ariance σ 2 is adjusted suc h that the signal to noise ratio (SNR) is maintained at a desired level at each sim ulation run. W e perform 50 sim ulations for eac h setting. The sample-splitting is done suc h that the mo del is trained on a data set of size b ( n − 1) / 2 c and the p-v alues are calculated on the remaining data set. This sligh tly un balanced scheme prev en ts us from situations where the full mo del might be selected on the first data set. Calculations of p-v alues w ould not b e p ossible on the remaining data in suc h a situation. W e use a total of B = 50 sample-splits for eac h sim ulation run. As in W asserman and Ro eder (2008), w e compute p-v alues for all pro cedures using a normal approximation. Results are qualitativ ely similar when using a t-distribution instead. W e compare the a v erage n um b er of true p ositives and the family-wise error rate (FWER) for the single- and multi-split metho ds for all three simulation settings (A)–(C) and v ary in eac h the SNR to 0.25, 1, 4 and 16 (which corresp onds to p opulation R 2 v alues of 0.2, 0.5, 0.8 and 0.94, resp ectively). The num b er | S | of relev an t v ariables is either 5 or 10. As initial v ariable selection or screening method ˜ S w e use three approaches, which are all based on the Lasso (Tibshirani, 1996). The first one, denoted by ˜ S f ixed , uses the Lasso and selects those b n/ 6 c v ariables whic h appear most often in the regularization path when v arying the p enalt y parameter. The constant n umber of b n/ 6 c v ariables is c hosen, somewhat arbitrarily , to ensure a reasonably large set of selected co efficien ts on the one hand and to ensure, on 12 the other hand, that least squares estimation will w ork reasonably well on the second half of the data with sample size b n/ 2 c . While the c hoice seems to work well in practice and can b e implemen ted v ery easily and efficiently , it is still slightly arbitrary . Avoiding any such c hoices of non-data adaptiv e tuning parameters, the second metho d, ˜ S cv , uses the Lasso with p enalt y parameter c hosen b y 10-fold cross-v alidation and selecting the v ariables whose corresp onding estimated regression co efficien ts are differen t from zero. The third metho d, ˜ S adap , is the adaptive Lasso of Zou (2006) where regularization parameters are chosen based on 10-fold cross-v alidation with the Lasso solution used as initial estimator for the adaptiv e Lasso. The selected v ariables are again the ones whose corresp onding estimated regression parameters are differen t from zero. Results are sho wn in Figures 2 and 3 for b oth the single-split metho d and the multi-split metho d with the default setting γ min = 0 . 05. Using the multi-split method, the a v erage n um b er of true p ositives (the v ariables in S which are selected) is typically sligh tly increased while the FWER (the probabilit y of including v ariables in N ) is reduced sharply . The single-split metho d has often a FWER ab ov e the level α = 0 . 05 at which it is asymptotically con trolled while for the m ulti-split metho d the FWER is ab ov e the nominal level only in few scenarios. The asymptotic control seems to giv e a go o d control in finite sample settings with the multi-split metho d, ma yb e apart from the metho d ˜ S f ixed on the very high-dimensional dataset (C). The single-split metho d, in con trast, selects in nearly all settings to o man y noise v ariables, exceeding the desired FWER sometimes substantially . This suggests that the asymptotic error con trol seems to work better for finite sample sizes for the m ulti- split metho d. Ev en though the multi-split metho d is more conserv ative than the single-split metho d (ha ving substantially low er FWER), the n umber of true disco v eries is often increased. W e note that for data (C), with p = 4088, and in general for lo w SNR, the num ber of true p ositiv es is low since w e con trol the v ery stringen t family-wise error criterion at α = 0 . 05 significance lev el. As an alternative, con trolling less conserv ative error measures is possible and is discussed in Section 5. W e also exp erimen ted with using the v alue of Q j ( γ ) directly as an adjusted p-v alue, without the adaptiv e choice of γ but using a fixed v alue γ = 0 . 5 instead, i.e. lo oking at t wice the median v alue of all p-v alues across multiple data splits, as suggested in a different con text b y v an de Wiel et al. (2009). The results w ere not as con vincing as for the adaptiv e choice and w e recommend the adaptive v ersion with γ min = 0 . 05 as a goo d default choice. 4.2 Comparisons with adaptiv e Lasso Next, we compare the m ulti-split selector with the adaptiv e Lasso (Zou, 2006). W e ha v e used the adaptiv e Lasso previously as a v ariable selection metho d in our prop osed multi- 13 0.00 0.05 0.10 0.15 0 2 4 6 8 10 P( FALSE POSITIVES > 0 ) MEAN( TRUE POSITIVES ) M M M M M M M M M M M M M M M M S S S S S S S S S S S S S S S S 0.00 0.05 0.10 0.15 0 2 4 6 8 10 P( FALSE POSITIVES > 0 ) MEAN( TRUE POSITIVES ) M M M M M M M M M M M M M M M M S S S S S S S S S S S S S S S S 0.00 0.02 0.04 0.06 0.08 0.10 0.12 0.14 0 2 4 6 8 10 P( FALSE POSITIVES > 0 ) MEAN( TRUE POSITIVES ) M M M M M M M M M M M M M M M M S S S S S S S S S S S S S S S S 0.00 0.05 0.10 0.15 0 1 2 3 4 5 P( FALSE POSITIVES > 0 ) MEAN( TRUE POSITIVES ) M M M M M M M M M M M M M M M M S S S S S S S S S S S S S S S S 0.00 0.05 0.10 0.15 0.20 0 1 2 3 4 5 P( FALSE POSITIVES > 0 ) MEAN( TRUE POSITIVES ) M M M M M M M M M M M M M M M M S S S S S S S S S S S S S S S S 0.00 0.05 0.10 0.15 0.20 0 1 2 3 4 5 P( FALSE POSITIVES > 0 ) MEAN( TRUE POSITIVES ) M M M M M M M M M M M M M M M M S S S S S S S S S S S S S S S S Figure 2: Simulation r esults for setting (A) in the top and (B) in the b ottom r ow. Aver age numb er of true p ositives vs. the family-wise err or r ate (FWER) for the single split metho d (‘S’) against the multi-split version (‘M’). FWER is c ontr ol le d (asymptotic al ly) at α = 0 . 05 for b oth metho ds and this value is indic ate d by a br oken vertic al line. F r om left to right ar e r esults for ˜ S f ixed , ˜ S cv and ˜ S adap . R esults of a unique setting of SNR, sp arsity and design ar e joine d by a line, which is solid if the c o efficients fol low the ‘uniform’ sampling and br oken otherwise. Incr e asing SNR is indic ate d by incr e asing symb ol size. 0.00 0.05 0.10 0.15 0.20 0.25 0.30 0.35 0.0 0.5 1.0 1.5 P( FALSE POSITIVES > 0 ) MEAN( TRUE POSITIVES ) M M M M M M M M M M M M M M M M S S S S S S S S S S S S S S S S 0.00 0.05 0.10 0.15 0.20 0.25 0.30 0.0 0.2 0.4 0.6 0.8 1.0 1.2 P( FALSE POSITIVES > 0 ) MEAN( TRUE POSITIVES ) M M M M M M M M M M M M M M M M S S S S S S S S S S S S S S S S 0.0 0.1 0.2 0.3 0.0 0.5 1.0 1.5 P( FALSE POSITIVES > 0 ) MEAN( TRUE POSITIVES ) M M M M M M M M M M M M M M M M S S S S S S S S S S S S S S S S Figure 3: The r esults of simulation setup (C). 14 split metho d. The adaptive Lasso is usually emplo yed on its own. There are a few choices to mak e when using the adaptiv e Lasso. W e use the same choices as previously . The initial estimator is obtained as the Lasso solution with a 10-fold CV-choice of the p enalt y parameter. The adaptiv e Lasso penalty is also obtained b y 10-fold CV. Despite desirable asymptotic consistency prop erties (Huang et al., 2008), the adaptive Lasso do es not offer error control in the same wa y as Theorem 3.1 do es for the multi-split metho d. In fact, the FWER (the probability of selecting at least one noise v ariable) is very close to 1 with the adaptiv e Lasso in all the sim ulations w e ha ve seen. In con trast, our m ulti-split metho d offers asymptotic con trol, which was seen to b e v ery well matched by the empirical FWER in the vicinity of α = 0 . 05. T able 1 sho ws the simulation results for the multi-split metho d using ˜ S adap and the adaptiv e Lasso on its own side b y side for a sim ulation setting with n = 100, p = 200 and the same settings as in (A) and (B) otherwise. The adaptive Lasso selects roughly 20 noise v ariables (out of p = 200 v ariables), ev en though the n umber of truly relev ant v ariables is just 5 or 10. The av erage num b er of false p ositiv es is at most 0.04 and often simply 0 with the prop osed multi-split metho d. E( T rue Positiv es ) E( F alse Positiv es ) P( F alse Positiv es > 0 ) Uniform Multi Adaptive Multi Adaptiv e Multi Adaptiv e Sampling | S | SNR Split Lasso Split Lasso Split Lasso NO 10 0.25 0.00 2.30 0 9.78 0 0.76 NO 10 1 0.58 6.32 0 20.00 0 1 NO 10 4 4.14 8.30 0 25.58 0 1 NO 10 16 7.20 9.42 0.02 30.10 0.02 1 YES 10 0.25 0.02 2.52 0 10.30 0 0.72 YES 10 1 0.10 7.46 0.02 21.70 0.02 1 YES 10 4 2.14 9.96 0 28.46 0 1 YES 10 16 9.92 10.00 0.04 30.66 0.04 1 NO 5 0.25 0.06 1.94 0 11.58 0 0.84 NO 5 1 1.50 3.86 0.02 19.86 0.02 1 NO 5 4 3.52 4.58 0.02 23.56 0.02 1 NO 5 16 4.40 4.98 0 27.26 0 1 YES 5 0.25 0.02 2.22 0 12.16 0 0.8 YES 5 1 0.82 4.64 0.02 22.18 0.02 1 YES 5 4 4.90 5.00 0 24.48 0 1 YES 5 16 5.00 5.00 0 28.06 0 1 T able 1: Comp aring the multi-split metho d with CV-L asso sele ction, ˜ S adap , with the sele ction made when using the adaptive L asso and a CV-choic e of the involve d p enalty p ar ameters for a setting with n = 100 and p = 200 . 15 There is clearly a price to pa y for controlling the family-wise error rate. Our prop osed m ulti- split metho d detects on av erage less truly relev ant v ariables than the adaptiv e Lasso. F or v ery lo w SNR, the difference is most pronounced. The m ulti-split metho d selects in general neither correct nor wrong v ariables for SNR = 0 . 25, while the adaptiv e Lasso av erages b et w een 2 to 3 correct selections, among 9-12 wrong selections. Dep ending on the ob jectiv es of the study , one would prefer either of the outcomes. F or larger SNR, the m ulti-split method detects almost as many truly important v ariables as the adaptive Lasso, while still reducing the n umber of falsely selected v ariables from 20 or ab o ve to roughly 0. The m ulti-split metho d seems hence b eneficial in settings where the cost of making an erroneous selection is rather high. F or example, exp ensive follo w-up exp erimen ts are usually required to v alidate results in bio-medical applications and a stricter error control will place more of the a v ailable resources into exp erimen ts whic h are lik ely to b e successful. 4.3 Motif regression W e apply the multi-split metho d to a real data set ab out motif regression (Conlon et al., 2003). F or a total of n = 287 DNA segmen ts w e hav e the binding in tensit y of a protein to eac h of the segmen ts. These will b e our resp onse v alues Y 1 , . . . , Y n . Moreov er, for p = 195 candidate words (‘motifs’) we ha v e scores x ij whic h measure how w ell the j th motif is represen ted in the i th DNA sequence. The motifs are t ypically 5–15bp long candidates for the true binding site of the protein. The hop e is that the true binding site is in the list of significant v ariables sho wing the strongest relationship b etw een the motif score and the binding intensit y . Using a linear mo del with ˜ S adap , the m ulti-split metho d iden tifies one predictor v ariable at the 5% significance level. The single-split metho d is not able to iden tify a single significan t predictor. In view of the asymptotic error control and the empirical results in Section 4 there is substan tial evidence that the selected v ariable corresp onds to a true binding site. F or this sp ecific application it seems desirable to pursue a conserv ativ e approac h with low FWER. As mentioned ab ov e, we could con trol other, less conserv ativ e error measures as discussed in Section 5. 4.4 Comparison with standard lo w-dimensional FDR control W e mentioned that control of FDR can b e an attractive alternative to FWER if we expect a sizable num ber of rejections. Using the corrected p-v alues P 1 , . . . , P p , a simple FDR- con trolling pro cedure w as deriv ed in Section 2.3 and its asymptotic control of FDR w as sho wn in Theorem 3.3. W e now lo ok empirically at the behavior of the resulting metho d and its p o wer to detect truly in teresting v ariables. T urning again to the sim ulation setting 16 c(1, 2) c(0, maxy) n p rho |S| SNR c(1, 2) c(0, maxy) 0 5 10 15 20 E( TRUE POSITIVES ) 100 90 0.5 10 0.25 0.5 1 4 16 100 110 0.25 5 0.25 0.5 1 4 16 150 30 0 5 0.25 0.5 1 4 16 200 50 0.75 10 0.25 0.5 1 4 16 200 100 0.5 10 0.25 0.5 1 4 16 200 180 0.2 5 0.25 0.5 1 4 16 200 250 0.2 5 0.25 0.5 1 4 16 400 350 0.5 30 0.25 0.5 1 4 16 500 20 0.9 5 0.25 0.5 1 4 16 Figure 4: The r esults of FDR c ontr ol ling simulations for the multi-split metho d (dark b ar) and standar d FDR c ontr ol (light b ar). The settings of n, p, ρ, | S | and SNR ar e given b elow e ach simulation. The height of the b ars c orr esp onds to the aver age numb er of sele cte d im- p ortant variables. F or p > n , the standar d metho d br e aks down and the c orr esp onding b ars ar e set to height 0. 17 (A), we v ary the sample size n , the n um b er of v ariables p , the signal to noise ratio SNR, the correlation ρ b et w een neighboring v ariables and the n umber s of truly interesting v ariables. It was sho wn already ab ov e extensiv ely that the m ulti-split method is preferable to the single- split metho d. Here, w e are more interested in comparison to well understo o d traditional FDR con trolling pro cedures. F or p < n , the standard approac h w ould b e to compute the least squares estimator once for the full dataset. F or eac h v ariable a p-v alue is obtained and the FDR controlling pro cedure as in (2.6) can b e applied. This approach obviously breaks down for p > n . Our prop osed approach can b e applied b oth to lo w-dimensional ( p < n ) and high-dimensional ( p ≥ n ) settings. In all settings, the empirical FDR of our metho d (not shown) is b elo w q = 0 . 05 and often close to zero. Results regarding p ow er are sho wn in Figure 4 for con trol at q = 0 . 05. It is may b e unexp ected, but the multi-split metho d trac ks the p o w er of the standard FDR con trolling pro cedure quite closely for low-dimensional data p < n . In fact, the multi-split metho d is doing considerably b etter if n/p is b elo w, sa y , 1.5 or the correlation among the tests is large. An intuitiv e explanation for this b ehavior is that, as p approac hes n , the v ariance in each estimated co efficien t v ector under the OLS estimate is increasing substantially . This in turn increases the v ariance of all OLS comp onen ts ˆ β j , j = 1 , . . . , p and reduces the abilit y to select the truly imp ortan t v ariables. The multi-split metho d, in contrast, trims the total n um b er of v ariables to a substan tially smaller num ber on one half of the samples and suffers then less from an increased v ariance in the estimated co efficien ts on the second half of the samples. Rep eating this ov er m ultiple splits leads thus to a surprisingly p ow erful v ariable selection procedure ev en for low-dimensional data. Nev ertheless, w e think that the main application will b e high-dimensional data, where the standard approac h breaks down completely . 5 Extensions Due to the generic nature of our prop osed metho dology , extensions to any situation where (asymptotically v alid) p-v alues ˜ P j for h yp otheses H 0 ,j ( j = 1 , . . . , p ) are a v ailable are straigh tforw ard. An imp ortan t class of examples are generalized linear mo dels (GLMs) or Gaussian Graphical Mo dels. The dimensionality reduction step would t ypically in v olve some form of shrink age estimation. An example for Gaussian Graphical Mo dels would b e the recently prop osed ‘Graphical Lasso’ (F riedman et al., 2008). The second step would rely on classical (e.g. likelihoo d ratio) tests applied to the selected submo del, analogous to the metho dology prop osed for linear regression. In some settings, con trol of FWER at, sa y , α = 0 . 05 is to o conserv ativ e. One can either 18 resort to control of FDR, as alluded to ab o v e. Alternatively , FWER con trol can easily b e adjusted to con trol the expected num ber of false rejections. T ak e as an example the adjusted p-v alue P j , defined in (2.3). V ariable j is rejected if and only if P j ≤ α . (F or the follo wing, assume that adjusted p-v alues, as defined in (2.1), are not capp ed at 1. This is a tec hnical detail only as it do es not mo dify the prop osed FWER con trolling pro cedure.) Rejecting v ariable j if and only if P j ≤ α con trols FWER at lev el α . Instead, one can reject v ariables if and only if P j /K ≤ α , where K > 1 is a correction factor. Call the num b er of falsely rejected v ariables V , V = X j ∈ N 1 { P j /K ≤ α } . Then the exp ected n umber of false positives is controlled at lev el lim sup n →∞ E [ V ] ≤ α K. A pro of of this follo ws directly from the pro of of Theorem 3.2. Of course, we can equiv alen tly set k = α K and obtain a con trol lim sup n →∞ E [ V ] ≤ k . F or example, setting k = 1 offers a m uc h less conserv ativ e error con trol, if so desired, than control of the family-wise error rate. 6 Discussion W e prop osed a multi-sample-split method for assigning statistical significance and construct- ing conserv ative p-v alues for hypothesis testing for high-dimensional problems where the n um b er of predictor v ariables may be m uch larger than sample size. Our method is an ex- tension of the single-split approac h of W asserman and Roeder (2008) and is extended to false disco v ery rate (FDR) con trol. Combining the results of m ultiple data-splits, based on quan- tiles as summary statistics, improv es repro ducibilit y compared to the single-split metho d. The multi-split metho d shares with the single-split metho d the prop erty of asymptotic error con trol and mo del selection consistency . W e argue empirically that the m ulti-split metho d usually selects muc h few er false p ositives than the single-split metho d while the n umber of true p ositives is sligh tly increased. The main area of application will b e high-dimensional data, where the n um b er p of predictor v ariables exceeds sample size n , as standard ap- proac hes rely on least-squares estimation and th us fail in this setting. It w as, ho w ever, sho wn that the metho d is also an in teresting alternativ e to standard FDR and FWER con- trol in lo w er-dimensional settings as the proposed FDR con trol can b e more pow erful if p is reasonably large but smaller than sample size n . The metho d is v ery generic and can be used for a broad sp ectrum of error con trolling pro cedures in m ultiple testing, including linear and generalized linear mo dels. 19 A Pro ofs Pr o of of The or em 3.1. F or tec hnical reasons w e define K ( b ) j = P ( b ) j 1 { S ⊆ ˜ S ( b ) } + 1 { S 6⊆ ˜ S ( b ) } . (A.9) K ( b ) j are the adjusted p-v alues if the estimated active set contains the true active set. Oth- erwise, all p-v alues are set to 1. Because of assumption (A1) and for fixed B , P [ K ( b ) j = P ( b ) j for all b = 1 , . . . , B ] on a set A n with P [ A n ] → 1. Therefore, we can define all the quan tities in volving P ( b ) j also with K ( b ) j , and it is sufficient to sho w under this sligh tly altered pro cedure that P [min j ∈ N Q j ( γ ) ≤ α ] ≤ α. In particular w e can omit here the limes superior. W e also omit for the pro ofs the function min { 1 , ·} from the definitions of Q j ( γ ) and P j in (2.2) and (2.3) resp ectiv ely . The selected sets of v ariables are clearly unaffected and notation is simplifies considerably . Define for u ∈ (0 , 1) the quantit y π j ( u ) as the fraction of b o otstrap samples that yield K j ( b ) less than or equal to u , π j ( u ) = 1 B B X b =1 1 K ( b ) j ≤ u . Note that the ev en ts { Q j ( γ ) ≤ α } and { π j ( αγ ) ≥ γ } are equiv alen t. Hence, P h min j ∈ N Q j ( γ ) ≤ α i ≤ X j ∈ N E h 1 Q j ( γ ) ≤ α i = X j ∈ N E h 1 π j ( αγ ) ≥ γ i . (A.10) Using a Mark ov inequalit y , X j ∈ N E h 1 π j ( αγ ) ≥ γ i ≤ 1 γ X j ∈ N E [ π j ( αγ )] . By definition of π j ( · ), 1 γ X j ∈ N E [ π j ( αγ )] = 1 γ 1 B B X b =1 X j ∈ N ∩ ˜ S ( b ) E h 1 K ( b ) j ≤ αγ i . Moreo v er, using the definition of K ( b ) j in (A.9), E h 1 K ( b ) j ≤ αγ i ≤ P h P ( b ) j ≤ αγ S ⊆ ˜ S ( b ) i = αγ | ˜ S ( b ) | . 20 This is a consequence of the uniform distribution of ˜ P ( b ) j giv en S ⊆ ˜ S ( b ) . Summarizing these results w e get P h min j ∈ N Q j ( γ ) ≤ α i ≤ 1 γ 1 B B X b =1 E h X j ∈ N ∩ ˜ S ( b ) αγ | ˜ S ( b ) | i ≤ α, whic h completes the proof. Pr o of of The or em 3.2. As in the proof of Theorem 3.1 w e will w ork with K ( b ) j instead of P ( b ) j . Analogously , instead of ˜ P ( b ) j w e w ork with ˜ K ( b ) j . F or an y ˜ K ( b ) j with j ∈ N and α ∈ (0 , 1), E h 1 ˜ K ( b ) j ≤ αγ o γ i ≤ α. (A.11) F urthermore, E h max j ∈ N 1 K ( b ) j ≤ αγ γ i ≤ E h X j ∈ N 1 K ( b ) j ≤ αγ γ i ≤ E h X j ∈ N ∩ ˜ S ( b ) 1 K ( b ) j ≤ αγ γ i and hence, with (A.11) and using the definition (A.9) of K ( b ) j , E h max j ∈ N 1 K ( b ) j ≤ αγ γ i ≤ E h X j ∈ N ∩ ˜ S ( b ) α | ˜ S ( b ) | i ≤ α. (A.12) F or a random v ariable U taking v alues in [0 , 1], sup γ ∈ ( γ min , 1) 1 U ≤ α γ γ = 0 U ≥ α , α/U αγ min ≤ U < α, 1 /γ min U < α γ min . Moreo v er, if U has a uniform distribution on [0 , 1], E h sup γ ∈ ( γ min , 1) 1 U ≤ α γ γ i = Z αγ min 0 γ − 1 min dx + Z α αγ min αx − 1 dx = α (1 − log γ min ) . Hence, by using that ˜ K ( b ) j has a uniform distribution on [0 , 1] for all j ∈ N , conditional on S ⊆ ˜ S ( b ) , E h sup γ ∈ ( γ min , 1) 1 ˜ K ( b ) j ≤ αγ γ i ≤ E h sup γ ∈ ( γ min , 1) 1 ˜ K ( b ) j ≤ αγ γ S ⊆ ˜ S ( b ) i = α (1 − log γ min ) . 21 Analogously to (A.12), w e can then deduce that X j ∈ N E h sup γ ∈ ( γ min , 1) 1 K ( b ) j ≤ αγ γ i ≤ α (1 − log γ min ) . Av eraging o v er all b o otstrap samples yields X j ∈ N E h sup γ ∈ ( γ min , 1) 1 B P B b =1 1 K ( b ) j /γ ≤ α γ i ≤ α (1 − log γ min ) . Using again a Mark o v inequality , X j ∈ N E h sup γ ∈ ( γ min , 1) 1 { π j ( αγ ) ≥ γ } i ≤ α (1 − log γ min ) , where w e ha ve used the same definition for π j ( · ) as in the pro of of Theorem 3.1. Since the ev ents { Q j ( γ ) ≤ α } and { π j ( αγ ) ≥ γ } are equiv alen t, it follows that X j ∈ N P h inf γ ∈ ( γ min , 1) Q j ( γ ) ≤ α i ≤ α (1 − log γ min ) , implying that X j ∈ N P h inf γ ∈ ( γ min , 1) Q j ( γ )(1 − log γ min ) ≤ α i ≤ α. Using the definition of P j in (2.3), X j ∈ N P h P j ≤ α i ≤ α, (A.13) and th us, b y the union b ound, P h min j ∈ N P j ≤ α i ≤ α, whic h completes the proof. Pr o of of The or em 3.3. W e use iden tical notation to the pro of of Theorem 1.3 in Benjamini and Y ekutieli (2001). An exception is that we use the v alue q instead of q /m in the FDR- con trolling procedure since we are w orking with adjusted p-v alues. Let p ij k = P ( { P i ∈ [( j − 1) q , j q ] } and C ( i ) k ) , where C ( i ) k is the even t that if v ariable i were rejected, then k − 1 other v ariables w ere also rejected. No w, as sho wn in equation (10) and then again in (28) in Benjamini and Y ekutieli (2001), E ( Q ) = X i ∈ N p X k =1 1 k k X j =1 p ij k . 22 Using this result, we use in the b eginning a similar argumen t to Benjamini and Y ekutieli (2001), E ( Q ) = X i ∈ N p X k =1 1 k k X j =1 p ij k = X i ∈ N p X j =1 p X k = j 1 k p ij k ≤ X i ∈ N p X j =1 p X k = j 1 j p ij k ≤ X i ∈ N p X j =1 1 j p X k =1 p ij k = p X j =1 1 j X i ∈ N p X k =1 p ij k (A.14) Let us denote f ( j ) := X i ∈ N p X k =1 p ij k , j = 1 , . . . , p The last equation (A.14) can then b e rewritten as E ( Q ) ≤ p X j =1 1 j f ( j ) = f (1) + p X j =2 1 j j X j 0 =1 f ( j 0 ) − j − 1 X j 0 =1 f ( j 0 ) (A.15) = p − 1 X j =1 ( 1 j − 1 j + 1 ) j X j 0 =1 f ( j 0 ) + 1 p p X j 0 =1 f ( j 0 ) (A.16) Note that, in analogy to (27) in Benjamini and Y ekutieli (2001), p X k =1 p ij k = P { P i ∈ [( j − 1) q , j q ] } ∩ p [ k C ( i ) k = P P i ∈ [( j − 1) q , j q ] and hence f ( j ) = X i ∈ N p X k =1 p ij k = X i ∈ N P P i ∈ [( j − 1) q , j q ] , from whic h it follo ws by (A.13) in the pro of of Theorem 3.2 that j X j 0 =1 f ( j 0 ) = X i ∈ N P P i ≤ j q ≤ j q . Using this in (A.17), we obtain E ( Q ) ≤ p − 1 X j =1 ( 1 j − 1 j + 1 ) j q + 1 p pq = p − 1 X j =1 1 j ( j + 1) j + 1 q = q p X j =1 1 j , (A.17) whic h completes the proof. 23 Pr o of of Cor ol lary 3.1. Because the single-split method is mo del selection consisten t, it m ust hold that P [max j ∈ S ˜ P j | ˜ S | ≤ α n ] → 1 for n → ∞ . Using m ultiple data-splits, this prop- ert y holds for each of the B splits and hence P [max j ∈ S max b ˜ P ( b ) j | ˜ S ( b ) | ≤ α n ] → 1, which implies that, with probabilit y conv erging to 1 for n → ∞ , the quan tile max j ∈ S Q j (1) is b ounded from ab ov e by α n . The maxim um o v er all j ∈ S of the adjusted p-v alues P j = (1 − log γ min ) inf γ ∈ ( γ min , 1) Q j ( γ ) is th us bounded from ab ov e b y (1 − log γ min ) α n , again with probabilit y con verging to 1 for n → ∞ . References Bac h, F. R. (2008). Bolasso: Model consistent Lasso estimation through the b o otstrap. In ICML ’08: Pr o c e e dings of the 25th international c onfer enc e on Machine le arning , New Y ork, NY, USA, pp. 33–40. A CM. Benjamini, Y. and Y. Ho c h b erg (1995). Controlling the false disco v ery rate: A practical and p ow erful approac h to m ultiple testing. Journal of the R oyal Statistic al So ciety Series B 57 , 289–300. Benjamini, Y. and D. Y ekutieli (2001). The control of the false discov ery rate in m ultiple testing under dep endency . Annals of Statistics 29 , 1165–1188. Bic k el, P ., Y. Ritov, and A. Tsybako v (2008). Sim ultaneous analysis of Lasso and Dantzig selector. Annals of Statistics . T o appear. Blanc hard, G. and E. Ro quain (2008). Tw o simple sufficient conditions for FDR control. Ele ctr onic Journal of Statistics 2 , 963–992. B ¨ uhlmann, P . (2006). Bo osting for high-dimensional linear mo dels. Annals of Statistics , 559–583. Conlon, E. M., X. S. Liu, J. D. Lieb, and J. S. Liu (2003). In tegrating regulatory motif disco v ery and genome-wide expression analysis. Pr o c e e dings of the National A c ademy of Scienc e 100 , 3339 – 3344. F an, J. and J. Lv (2008). Sure indep endence screening for ultra-high dimensional feature space. Journal of the R oyal Statistic al So ciety Series B 70 , 849–911. F riedman, J., T. Hastie, and R. Tibshirani (2008). Sparse in v erse cov ariance estimation with the graphical Lasso. Biostatistics 9 , 432. F riedman, J. H. (2001). Greedy function appro ximation: A gradient b o osting machine. The A nnals of Statistics 29 , 1189–1232. 24 Holm, S. (1979). A simple sequen tially rejective m ultiple test pro cedure. Sc andinavian Journal of Statistics 6 , 65–70. Hothorn, T., F. Bretz, and P . W estfall (2008). Simultaneous inference in general parametric mo dels. Biometric al Journal 50 , 346–363. Huang, J. and Ma, S. and Zhang, C.H. (2008). Adaptiv e lasso for sparse high-dimensional regression models. Statistic a Sinic a 18 , 1603–1618. Meinshausen, N. (2007). Relaxed Lasso. Computational Statistics and Data A nalysis 52 , 374 – 393. Meinshausen, N. and P . B ¨ uhlmann (2006). High-dimensional graphs and v ariable selection with the Lasso. Annals of Statistics 34 , 1436–1462. Meinshausen, N. and P . B ¨ uhlmann (2008). Stability selection. Preprint. Meinshausen, N. and B. Y u (2009). Lasso-t yp e reco very of sparse represen tations for high- dimensional data. A nnals of Statistics 37 , 246–270. Tibshirani, R. (1996). Regression shrink age and selection via the Lasso. Journal of the R oyal Statistic al So ciety Series B 58 , 267–288. T ropp, J. and A. Gilb ert (2007). Signal reco very from random measuremen ts via orthogonal matc hing pursuit. IEEE T r ansactions on Information The ory 53 (12), 4655 – 4666. v an de Geer, S. (2008). High-dimensional generalized linear mo dels and the Lasso. A nnals of Statistics 36 , 614–645. v an de Wiel, M. and J. Berkhof and W. v an Wieringen (2009). T esting the prediction error difference betw een 2 predictors. Biostatistics . T o appear. W asserman, L. and K. Ro eder (2008). High dimensional v ariable selection. Annals of Statis- tics . T o app ear. Zhang, C.-H. and J. Huang (2008). The sparsit y and bias of the Lasso selection in high- dimensional linear regression. Annals of Statistics 36 , 1567–1594. Zhao, P . and B. Y u (2006). On mo del selection consistency of Lasso. Journal of Machine L e arning R ese ar ch 7 , 2541–2563. Zou, H. (2006). The adaptive Lasso and its oracle prop erties. Journal of the A meric an Statistic al Asso ciation 101 , 1418–1429. 25
Original Paper
Loading high-quality paper...
Comments & Academic Discussion
Loading comments...
Leave a Comment