A Bayesian semi-parametric model for small area estimation
In public health management there is a need to produce subnational estimates of health outcomes. Often, however, funds are not available to collect samples large enough to produce traditional survey sample estimates for each subnational area. Althoug…
Authors: ** - Donald Malec (U.S. Census Bureau) - Peter Müller (M. D. Anderson Cancer Center) **
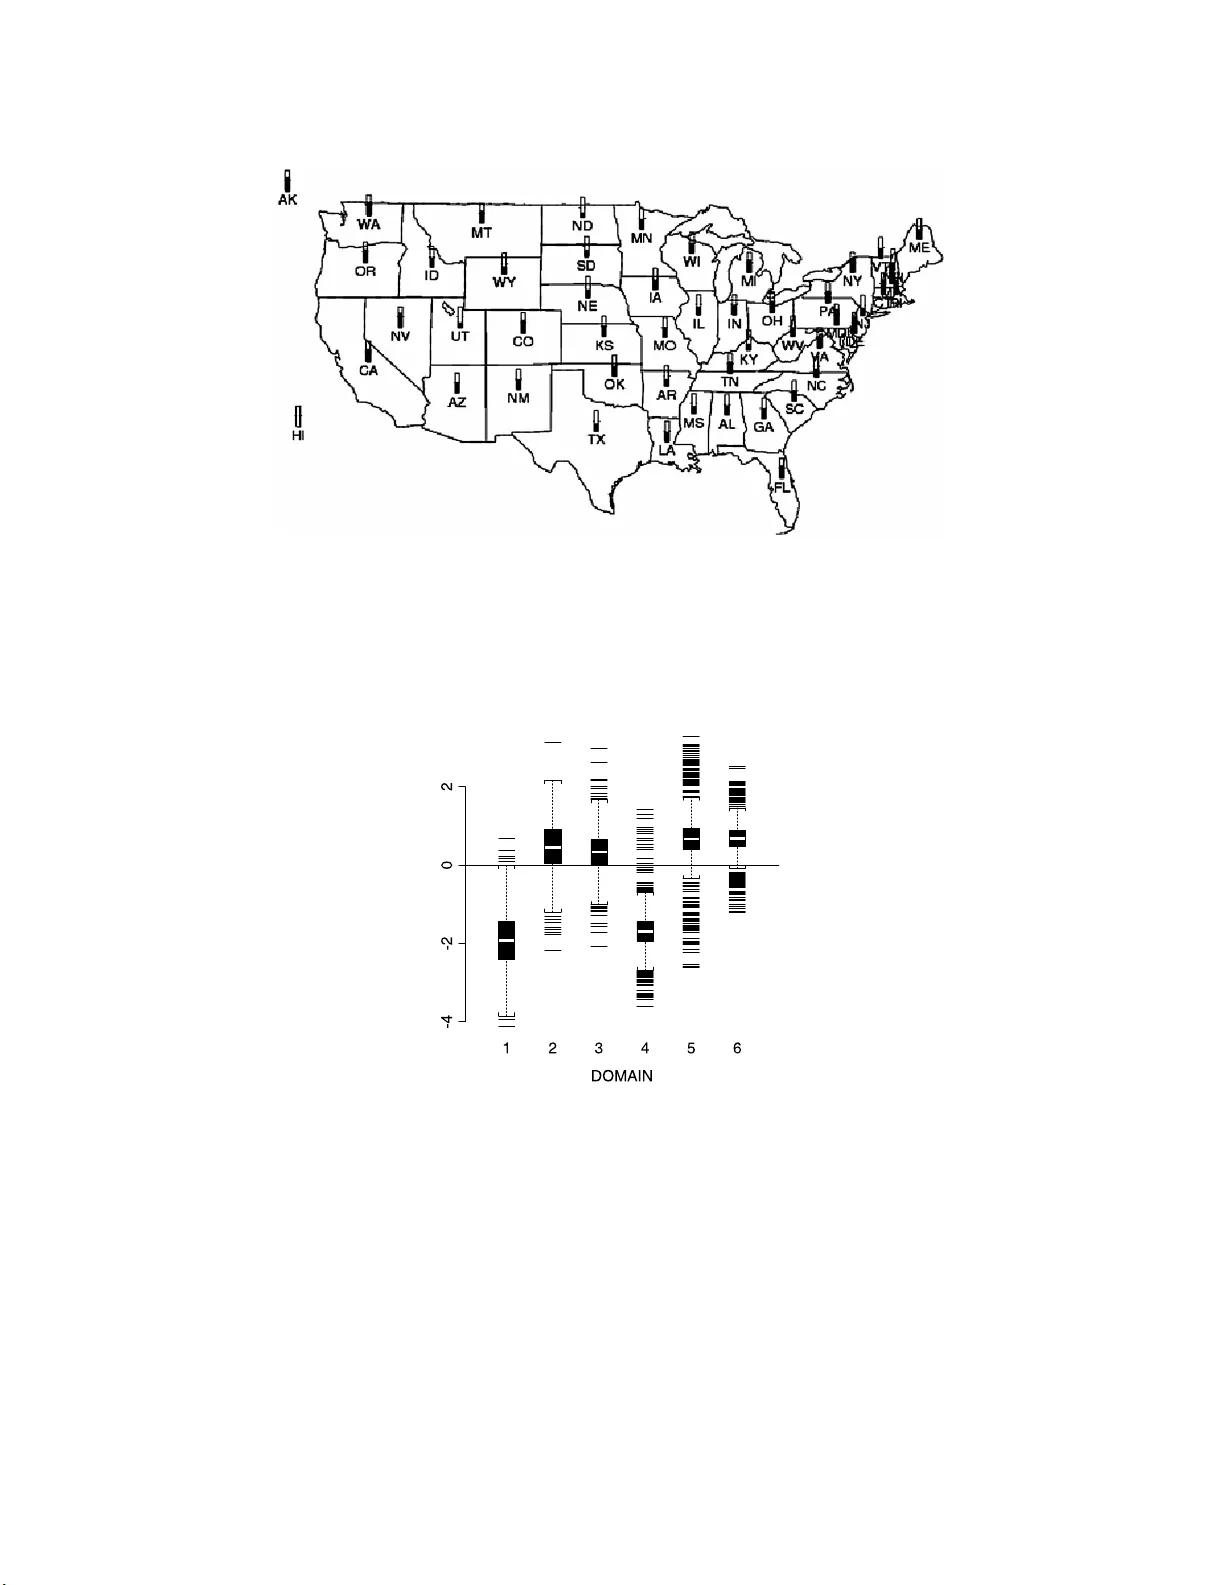
IMS Collectio ns Pushing the Limits of Con temp orary Statist ics: Contributions in Honor of Jay an ta K. Ghosh V ol. 3 ( 2008) 223–236 c In the Public Doma in , 2008 DOI: 10.1214/ 07492170 80000001 65 A Ba y esian semi-parametric mo d el for small area estimation Donald Malec 1 and P eter M ¨ uller 2 U.S. Census Bur e au and M. D. Anderson Canc e r Center Abstract: In public hea lth manag emen t the re is a need to pro duce subna - tional estimates of h ealth outcome s. Often, ho we v er, funds are not a v ailable to collect samples large enough to pro duce traditional survey sample estimates for eac h subnational area. Although parametric hierarchical m ethods ha v e b een successfully used to derive estimates from small samples, there is a concern that the geographic diversit y of the U.S. population ma y be ov ersimplified in these models. In this pap er, a semi- parametric mo del is used to describe the geographic v ari ability component of the m odel. Sp ecifically , we assume Di r ich- let pr ocess mixtures of norm als f or coun ty-specific random eff ects. Results are compared to a parametric mo del based on the base m easure of the Dir ichlet process, using binary health outc omes related to mammogram usage. Con ten ts 1 Int ro duction . . . . . . . . . . . . . . . . . . . . . . . . . . . . . . . . . . . 223 2 Early and current metho ds for s mall area estimation . . . . . . . . . . . . 224 3 The NHIS and the selectio n of v ar iables for estimation . . . . . . . . . . . 225 4 A semi-para metric randomized block mode l . . . . . . . . . . . . . . . . . 227 5 Posterior simulation . . . . . . . . . . . . . . . . . . . . . . . . . . . . . . 230 6 The national health interview survey . . . . . . . . . . . . . . . . . . . . . 23 1 7 Discussion . . . . . . . . . . . . . . . . . . . . . . . . . . . . . . . . . . . . 233 Appendix: Resampling the logistic re g ression parameters . . . . . . . . . . . . 2 34 References . . . . . . . . . . . . . . . . . . . . . . . . . . . . . . . . . . . . . . 235 1. Introduction Large national surveys are generally constructed to provide estimates for a diverse group o f data users. Estimates, from a s ingle survey , often cov er scores of topics and are usually provided for as many p opula tion groups a s the sample size will supp ort. Population groups of interest co nsist of b oth lar ge and demogra phic gro ups and subnational areas. As the data users are thought to hold a v ariety of prior opinions, estimates for a particular gr oup ar e usually constructed using only sample da ta 1 Statistical Researc h Divi sion, U.S. Bureau of the Census W ashington, DC, USA, e-mail: donald.j .malec@c ensus.gov This r eport is released to inform interested parties of ongoing r esearc h t o encourage discussion of work in progress. The views expressed on s tatistical, metho dological, tec hnical or operational issues are t hose of th e authors and not necessarily those of the U.S. Census Bureau 2 Departmen t of Biostatistics, M . D. Anderson Cancer Center, Houston TX 7703 0, USA, e-mai l: pmueller @mdander son.org AMS 2000 subje c t classific ations: 62G07, 62-07. Keywor ds and phr ases: Dirichlet pro cess, mixture m odels, National Health In terview Surv ey. 223 224 D. Male c and P. M¨ ul ler from the gro up in question along with randomiza tion theory . Often estimates are needed for small p opulation subgroups that do not co ntain eno ugh data fo r precise estimation. In this situation, small area estimation metho ds, based on statistical mo dels and parametric exchangeability assumptions that use da ta fr om similar groups ar e often used. These exc hangeability a ssumptions a re genera lly applied across s mall are as if ther e is no a prio ri evidence to the contrary . Of cour se, this assumption may be incorr ect and, without a lternatives to this assumption, will remain througho ut the infer e nce. W e prop o s e a semi-parametric, hierarchical mo del for small area estimation. The mo del pro duces estima tes for a small area that selectively use data from only subs ets of other small area s. The uncerta int y about whic h subsets a re v alid is automatica lly accounted for. This mo del is useful when, a priori , one suspects that all small areas are not equally similar but o ne do es not know w he r e the dissimilar ities a re. The mo del is an extension of cur rently used para metr ic hier archical mo dels for small area estimatio n. Although the parametr ic hier archical models are flexible enough to a djust for the a mo unt o f “b orr owing,” it is requir ed that the subsets where “b orrowing” ca n take plac e b e pr esp ecified. In practice, subset identit y ma y not be known. In addition, some sma ll areas may be outliers and should no t b e used in drawing inference ab out other areas a nd, vice versa, other areas should not be used in drawing inference ab out them. The semipara metric mo del, pr o p osed here, will adapt to such outliers. The desired flexibilit y is accomplished b y using a Dirichlet pro cess (DP) prior to define a pr obability mo del o n p os s ible partitions of small areas . Specifically , the DP prior defines partitions o f the set of all counties. Conditional on an assumed par tition the mo del assumes a homogeneous p opulatio n within all coun ties in a partitioning subset. This alleviates the difficult pro blem of sp ecifying a lar ge num ber of prior probabilities for possible partitions a s in Malec and Sedra ns k [ 9 ]. In a ddition, the DP mo del is computationally tra ctable. The mo del is applied to the National Hea lth In terview Survey (NHIS) for estimates of mammography utilizatio n. W e begin with a histor ical ov erview of metho dologica l improv emen ts for small area estimation in Sectio n 2 . This is follow ed, in Section 3 , by a description o f the NHIS and how the v ariables w ere selected fo r the mode l of mammog raphy utilization. In Sectio n 4 w e motiv a te and describ e the prior mo del on the r a ndom effects. Section 5 discusses details of the implemen ta tion by Marko v chain Mon te Carlo s im ulation. In Section 6 we apply the mo del to the NHIS a nd compa re r esults with alternative approaches. 2. E arly and current metho ds for s mall area estim ation Early estimates for small areas w ere based on the assumption that an o utco me is primarily a function of de mo graphic class. By knowing the demogr aphic c haracteris- tics of a small area and estimating the national-level prev alence of o utcomes within the same demographic gro ups, one can derive small ar ea estimates. Estimates based on this ass umption ar e known as “syn thetic estimates.” One of the first publications using this metho d pertained to s y nt hetic state estimation of disability [ 14 ]. A systematic, empirica l study of biases in synthetic estimation was undertaken by Sc haible et al. [ 20 ]. Little data is usually av ailable to ev aluate the bias of actua l small area estimates. How ever, using a wide rang e of outcomes av ailable in the U.S. decennial census, it was sho wn that the basic homogeneity as sumptions underlying synthetic es timation w ere frequent ly un w arranted. T o a lleviate this problem, the Semi-p ar ametric smal l ar e a estimation 225 biases in synthetic small a rea estimates can b e mo dele d as random effects. Related estimates of this t ype hav e b een prop osed in F ay and Herriot [ 3 ], Dempster and T omberlin [ 2 ] and Ba ttese and F uller [ 1 ]. The mo del- based a pproach using ran- dom e ffects op ens up the po ssibility for a v ar iety of mo dels, resulting in realistic estimators that may combine data in a no nlinear manner. Much of the rec ent dev elopmen t in small area estimation has concen trated on obtaining estimates fro m random effect mo dels without r esorting to asymptotic approximations using Bayesian Inference a nd Mar ko v chain Monte Ca rlo metho ds (see, e.g., [ 10 ]). In c urrent re s earch, the distributional assumptions of the random effects mo dels a re b eing ques tio ned. F o r example, alternative models which allow for spatia l effects hav e been employ ed b y Ghosh et al. [ 5 ] and o thers. Maiti [ 7 ] uses finite mixture mo dels for r andom effects. F or a r ecent more detailed review of sma ll area estimation, see Rao [ 16 ]. 3. The NHIS and the sel ection of v ariables for estimation The NHIS is typical o f many national, representativ e, p er s onal interview sur veys. A per sonal in terview ca n b e rela tively costly but resp onse rates are gener ally higher than for other mo des of interview and complica ted questio ns, especia lly questions inv o lving visua l cues, can b e asked. A s ubstantial con tributor to the total cost of a per sonal interview survey is travel cost. T o minimize tr av el costs, eac h interviewer usually conducts in terviews near his o r her res idence. Hence, sampling units are usually small g eogra phic land ar eas. As a result, there is a relatively larg e sa mple size in these selected areas but relatively few areas selected acro ss the country . In addition, the overall sample size is selec ted to pro duce traditional, rando mization- based survey estimates a t the natio nal level. Due to high sampling costs, the sample size is usually inadequate to make precise design-based estimates for most small areas. How ev er, estimates a re usually desired at smaller levels, for example, for allo cation o f funds or for asses s ing and administering health services. The required precision of these estimates is usua lly of the same order of magnitude as that required for national estimates, r esulting in an extreme sho rtfall of data for making small ar ea estimates. The NHIS is redes igned every ten years following the decennial census, taking adv antage of up- to-date popula tion data. The NHIS is based on a complex sample design of clusters of housing units, called segments. Segments a re selected from within a Prima ry Sampling Unit (P SU), which is usua lly a group o f co ntiguous counties. PSUs ar e sa mpled from strata, constructed to contain PSUs with similar so cio-demog raphic conten t. See Ma ssey et al. [ 11 ] for details. The segment is the smallest sa mpling unit fo r many questions asked in the NHIS. Subsamples, within segments, are also collected o n s p ecia l health topics from either a s ubsample of households or from peo ple within househo lds . The questio ns on mammogr aphy usage, studied her e, a re from a subsample of ho using units, within segments sampled during years 1 9 93 and 1994. The sampled outcomes from the NHIS are not an i.i.d. sample from the p opu- lation. They should not b e considered a simple r andom sa mple due to both non- resp onse and to p o s sible selection bias due to the s ampling design. Nonresp ons e is accounted for b y p o s tstratifying b y count y , a ge and race groups. Sa mple selection effects are count ered b y including de s ign v ar iables in the mo del. An example of an alternative appro ach, in which the sample selection process is modeled directly , is given by Ma lec et al. [ 8 ]. 226 D. Male c and P. M¨ ul ler In this pap er w e consider inference rela ted to one o f the questions in the NHIS which a s ks whether a mammo gram had been obtained within the past t w o y ears. Periodic mammograms for screening of breast ca ncer are highly recommended for women of cer tain ag es. E s timation of the mammography utilization r ate by age and race for lo cal areas is imp or tant for ev aluation pur p o ses. Although NHIS data based on sing le years o f a g e by r ace within each count y is av ailable, a s a re census po pulation estimates for count ies b y ra ce a nd five-year age groups, w e chose to ev alua te the D = 6 demographic groups defined b y the three age groups (30–3 9 , 40–49 , 5 0+) crossed with race (black, non-black). W e co ns ider a mo del: (1) P ( y idk = 1) = p id , where y idk = 1 if the k - th p erson in demogra phic group d and count y i did re- ceive a mammogra m in the past t wo years, and y idk = 0 otherwise. It is assumed throughout that there may b e difference s b etw ee n lo cal effects of ma mmo graphy utilization due to demographic gro ups. This is why six different prev alence ra tes , p id , d = 1 , . . . , D , are used f or eac h count y i . The first step in the mo del selection pro cess is to select coun t y cov ar iates to accoun t for small ar ea effects. The count y v aria bles used are from the Area Resource File [ 22 ]. Tw ent y- tw o c o unt y cov ariates were ev aluated. These co v aria tes comprised r e g ional status of the count y , urban v aria bles, p e r cent of p opulation working in white collar jobs, p er cent of populatio n working in agric ultur e and construction, urban status, unemplo yment rate, p er- cent o f households that are renters, per c ent minor it y (blac k, asian, hispanic and mexican), degr ee o f education, p opulation density , and median ho me v alue. Let x i denote a v ector of all possible count y-level cov ariates and let µ d denote demographic effects, d = 1 , . . . , D . Using a mo del (2) P id = lo git( p id ) = µ d + x ′ i b, and Sc h w arz’s criterio n we identified tw o count y-level cov a r iates: p ercent o f w ork- force in white colla r jobs ( x i 1 ) and perce nt of p er sons ag ed 25+ with no more than a nin th-grade education ( x i 2 ). A second model-fitting step was used to determine whether interactions of the t w o count y v ariables with the D demogra phic g roups were present. Using a log istic regr ession mo del like ( 2 ) with additional interactions of count y v ariables and demographic groups, w e again used Sch warz’s criterio n and by forw ard step wise selection identified the b est set of interactions. W e found in- teractions o f b oth cov ariates with the demogra phic group of 30– 39 year old whites. The estimated interaction term amounted to dropping all cov ariate effects on this particular demog raphic group. As a last chec k, plots of av erage residuals were used to determine that a linear rela tionship with the log its a ppea red reaso nable. Although the coun t y cov ar iates use d in the mo del selection are close to the v aria bles that w ere used to des ign sa mpling strata, Malec et al. [ 10 ] fo und that strata effects may still b e present in the data. Sampling strata w ere defined by grouping the count y -based P SUs into 198 strata so that the PSUs in each stratum hav e s imilar summary mea s ures of so cio-econo mic status [ 11 ]. By a ssuring that each stratum contains a presp ecified sa mple size, a more systematic coverage o f the p opulation is po s sible. W e will include stratum effects in the mo del to ac count for this imp ortant prior knowledge based o n the design. W e shall use an additional subindex s in p sid and x sid to indicate strata . In the prio r sp ecifica tion, ins tea d of ass uming that all stra tum effects are dis- tributed i.i.d., we allow their v ariability to be distinct within bro ad mega s tr ata. Semi-p ar ametric smal l ar e a estimation 227 W e defined tw o mega- strata b y g r ouping the 1 98 str ata into those r epresenting the very la r ge metrop olitan areas (like the New Y ork City a r ea) versus all other s. 4. A semi-parametric randomized blo c k mo del Based o n the discussion ab ove, we include random stratum effects ν s as well as random (count y by demo graphic) group effects β sid . Let n sid denote the n um- ber o f individuals interviewed in demographic domain d , d = 1 , . . . , D , count y i , i = 1 , . . . , I , a nd stratum s , s = 1 , . . . , S . Counties a r e nested within strata , and demographic domains ar e cr ossed with counties. Let y sid ∼ B i n ( n sid , p sid ) denote the nu m ber of po sitive res po nses among these n sid individuals. Let s ( i ) denote the stratum containing co unt y i , and let β i = ( β sid , s = s ( i ) , d = 1 , . . . , D ) denote the D dimensional random effects vector for count y i . Since co unt y indices i are unique acro ss stata, the subindex s in β sid is redundant and we use it only when it helps to clarify the hiera rchical structure of the mo del. W e as sume a logistic reg ression o f the succes s probabilities p sid on some quantitativ e cov a riates x sid and count y-sp ecific a nd stratum-sp ecific ra ndom effects: (3) P sid = lo git( p sid ) = x ′ sid b + β sid + v s ( i ) , with priors β i ∼ h ( β i ) , v s ∼ N (0 , δ 2 m ( s ) ) , b ∼ N ( m b , V b ) , δ − 2 m ∼ Ga( a δ , b δ ) m = 1 , . . . , M . Here m ( s ) denotes the mega-s tratum containing str atum s , a nd Ga( a, b ) denotes a gamma distribution with mea n a/b . In w ords, the random effects β i are generated b y some distr ibutio n h ( · ), details of which will be discussed below. The stratum r a ndom effects are a pri ori normal with random v ariance δ m . The mo del is completed with conjugate hyperprior s f or δ m and b , with the latter pos - sibly non-infor mative by choos ing V − 1 b = 0. While a lar ge n um ber o f exp erimental units are av a ilable to inform inference ab out the count y-sp ecific rando m effects β i , only a moder ate (198 ) and small (2) nu m be r of stratum and mega- stratum-sp ecific effects are included in the mo del. Therefor e, w e use fully para metr ic r a ndom effects distributions for ν s and δ m , but a flex ible non-parametr ic mo del for β i . The c hoice of the prior mo del h ( · ) is guided b y the following cons iderations. First, health related outcomes alwa ys v ary b y age and race, but are correlated within counties. Thus we need a multiv ar iate pr ior on ( β i 1 , . . . , β iD ) allowing for different effects in different demographic do mains, and interactions be t ween these effects. Second, the mo del includes only few c ov a r iates, leaving significant heterogeneity due to other un-recorded cov a r iates. T o account for such heterog eneity the model needs to allo w for po s sible clusters o f sub-p opulations no t identified b y the given cov a riates and ov erdisper sion. Third, as with any health outcome the mo del needs to accommo date outliers without unduly influencing inference. Finally , the model should be a na tur al generalization of more co nv en tional multiv ariate normal random effects distributions. These c onsiderations lead us to use a mixture o f nor mals pr ior mo del. Let ϕ θ ( · ) denote a multiv ariate norma l probability density function with moments θ = ( µ, Σ). Then β i ∼ ∞ X j =1 w j N ( β i ; µ ′ j , Σ ′ j | {z } θ ′ j ) = Z ϕ θ ( β i ) dG ( θ ) , 228 D. Male c and P. M¨ ul ler where G = ∞ X j =1 w j δ θ ′ j . The mixture of normals mo del ( 4 ) allows for heterog eneity , outliers , skewness etc., as desired. The mo del includes a simple multiv ar iate normal prior model a s a spec ia l case. By ch o osing a hyp e rprior on G which a priori favors a few dominating ter ms in the mixtur e we forma lize the idea that a p riori we assume simple struc tur e, but as the data dictates the mo del allo ws in troduction of mor e co mplicated structure a p osteriori , like a discr ete mixture o f a few dominating no rmal kernels. This is achiev ed using a DP prior on G , G ∼ D P ( αG ν ). Here G ν is the (standardized) base measure and α > 0 is the total ma s s pa rameter. The base meas ur e can p os s ibly depe nd on further h yperpar ameters ν . Below, w e will specify a base measur e and hyperprior on ν and the total mass parameter α . See F erguson [ 4 ] for a complete description of the DP; a discuss io n o f DP and DP mixture mo dels lik e ( 4 ) can be found in, e.g., [ 6 ], [ 13 ] a nd [ 23 ]. W e summarize some prop erties which ar e relev a n t in the context of our applica- tion. 1. The base measure G ν has an in terpretation as the pr ior mean for the r an- dom measure; the total mass parameter α is a precision pa rameter. F or an y measurable set A we ha ve E { G ( A ) } = G ν ( A ) and V ar { G ( A ) } = G ν ( A ) { 1 − G ν ( A ) } / (1 + α ) . 2. The random measure G is a .s. discrete. Let F 0 and F denote the c.d.f. of G ν and G , respectively . Then F can be thought of as a ra ndom step function approximating F 0 . The size w j of the steps depends on α . The larger the α , the smaller the weigh ts, i.e., steps sizes, w j . 3. Consider a random sample θ i ∼ G , i = 1 , . . . , n . Because of the discreteness of G , with positive probabilit y some of the θ i will be iden tical. Sp ecifica lly , we hav e the prio r proba bilities P ( θ i = θ j | θ h ) = 1 / ( α + n − 1) for j < i, i 6∈ { j, h } . A commonly used dev ice in p osterior sim ulation when the likelihoo d in volv es a mixture like in ( 4 ) is to break the mix tur e b y in tro ducing laten t v ariables [ 18 ]. W e implemen t this by rewriting the DP mixture mo del ( 4 ) a s (4) β i ∼ N ( β i ; µ i , Σ i ) , ( µ i , Σ i ) ∼ G, G ∼ DP ( α, G ν ) . The mo del is completed b y sp ecifying a bas e measure G ν , (5) G ν ( µ, Σ) = N ( µ ; m, B ) W [Σ − 1 ; s, ( sS ) − 1 ] , and a hyperpio r fo r ν = ( m, B , S ) a nd α , (6) S ∼ W [ q , ( R/ q )] , m ∼ N ( a, A ) , B − 1 ∼ W [ c, ( cC ) − 1 ] , α ∼ G ( a α , b α ) . Here W ( n, A ) denotes a Wishart distribution with scalar par a meter n and matrix parameter A , and G ( a, b ) deno tes a Gamma distribution with shape para meter a and scale par a meter b , parameterize d suc h that the ex pe c ted v alue of G ( a, b ) is a/b . The mo del is summar ized in Figure 1 . W e will r efer to model ( 3 ) together with prior ( 4 ) or, equiv alently , ( 4 ) a nd h yper- prior ( 5 ) and ( 6 ) as the MDP (Diric hlet pro c e ss mixture) mo del. Alternativ ely to the Semi-p ar ametric smal l ar e a estimation 229 Fig 1 . Gr ap hic al mo del r epr esentation. Cir cles i ndica te the variables, i nc luding the data, p ar am- eters, c ovariates and hyp erp ar ameters. Solid arr ows indic ate that the pr ob abilit y mo dels for the tar ge t variable ar e indexe d by the variable a t the sour c es of the arr ow. Dashe d lines r epr esent the deterministic expr ession f or P sid . Fixe d hyp erp ar ameters ar e not indic ate d. MDP pr ior o ne could choos e fully parametric norma l mixture mo dels as prop osed by , for example, Ro eder a nd W asser man [ 19 ] or Richardson and Green [ 17 ]. Bas ed on exp erience with similar models, w e would expe c t predictive inference, lik e the po sterior predictive inf erence for state totals, including coun ties without samples, not to b e muc h different under these models than inference us ing mixtur e models with DP prior s. Still, we prefer the semi-par ametric for mu lation fo r s everal reasons. First, the prior par ameters G ν and α in the DP prior mo del have a straightforward int erpretation as the mean a nd dispe rsion parameters (“equiv ale n t pr ior sample size”). It is no t immediately clea r what implication certain choices for prior s on the parameter s of the mixture mo del would hav e on the marginal distribution of y in the finit e mixture mo de l. Seco nd, the computationa l effo r t is co mparable in all three mo dels. 230 D. Male c and P. M¨ ul ler 5. Posterior simulation Mo del ( 3 ) with prior ( 4 )–( 6 ) can b e estimated by Markov c hain Monte Ca rlo sim- ulation. W e s hall use β for β = ( β i , i = 1 , . . . , I ), µ for µ = ( µ 1 , . . . , µ I ), etc. Let y denote the data vector, y i = ( y sid , d = 1 , . . . , D ) deno te the data vec- tor for count y i (with s = s ( i ) e qual to the stratum containing count y i ), and y s = ( y sid , i : s ( i ) = s, d = 1 , . . . , D ) denote the data v ector for stratum s . An ent ry of the t ype a | b, c, y indicates that parameter a is being up dated conditional on the currently imputed v alues of b and c and the data y . Absence of a v ar iable d in the conditioning set indicates conditional independence of a and d or that the mo del is b eing mar ginalized ov er d . W e outline the sequence of the updating scheme, with details discus s ed below. Let (i) b | β , v , y , (ii) β i | µ i , Σ i , b, v , y i , (iii) v | b, β , δ, y , (iv) δ | v , (v) µ, Σ , ν , α | β . Steps (i)–(v) describ e the transition pro bability o f a Marko v chain in ( b, β , v , µ, Σ). Step (v) refers to up dating the parameters of the mixture mo del h ( · ), including µ i , Σ i , i = 1 , . . . , I , the h yperpa rameters ν o f the base measure G ν , and the to- tal mass parameter α . In a straightforward Gibbs sa mpler implemen tation each of the up dating steps would draw from the respective complete conditional p osterio r distribution to genera te a new imput ed v alue of the re sp ective para meter. Unfortu- nately this is only pos sible for Step (iv). In all other steps the co nditional p oster ior distribution is no t in a format allo wing efficient random v a riate generation. The ap- propriate MCMC implementation for steps (i)–(iii) is ex plicated in the Ap pe ndix . Step (v) is des c rib ed in [ 15 ]. By construction, the stationary distribution of this chain is the desired pos ter ior distribution p ( b, β , v, µ, Σ | y ). Mos t posterio r inferences tak e the fo rm of in tegrals with res pe ct to the p osterio r, such as the p os terior mean ¯ b = R b dp ( b, β , v , µ, Σ | y ), and such p oster ior in tegrals can be approximated b y er g o dic a verages. F or ex a mple ¯ b ≈ 1 / T P T t =1 b t , where b t denotes the v alue of b after t iterations of the Markov chain. The aim of the small area estimation mo del ( 3 ) is to provide inference for both the sampled units a nd for the s a mpling units for which no data is a v ailable, and to summariz e such inference b y subpo pula tions of interest, like states, etc. The po sterior simulation descr ibe d ea rlier in this section a llows us to compute s uch inference with minimal additional computationa l cost. Index with i = I + 1 , . . . , J counties not included in the av a ilable sample. Denote with N sid , i = 1 , . . . , J, s = s ( i ) , d = 1 , . . . , D , the total p opulations in ea ch cell o f co unt y a nd demog raphic domain. The popula tion tota ls N sid and cov ar iates x sid are a v ailable for all counties i = 1 , . . . , J , from census data. T o compute inference for state totals , w e pro ce ed by the following steps. Index the states with a = 1 , . . . , A . Denote with a ( i ) the index of the state a con taining count y i . Let Y sid denote the total num ber of sub jects in count y i and demographic domain d who had a mammogra m within the last t wo years. Let Y a = P { i : a ( i )= a } P d Y sid denote the total for s tate a . A t each iteration of the Marko v c hain Monte Carlo s im ulation we have imputed v alues for b , β sid , i = 1 , . . . , I , and v s , s = 1 , . . . , S . T o impute random effects for counties a bsent in the sample, i = I + 1 , . . . , J , we sim ulate v alues for θ i = ( µ i , Σ i ), i = I + 1 , . . . , J , using the following probabilities: P ( θ i = θ j ) = 1 / ( α + i − 1) , j = 1 , . . . , i − 1 , P ( θ i 6 = θ j , j < i ) = α/ ( α + i − 1) and P ( θ i | θ i 6 = θ j , j < i ) = G ν ( θ i ) , (7) Semi-p ar ametric smal l ar e a estimation 231 and P ( β i | θ i ) = N ( µ i , Σ i ). Giv en imputed v alues for the random effects fo r al l counties and all strata, a nd for the log istic regr ession coefficients b , we can now impute success probabilities p sid for all counties, and s imulate to ta l co unt s Y sid ∼ B i n ( N sid , p sid ) for all counties. Adding up the state totals Y a = P i : a ( i )= a P d Y sid we get simulated v alues Y a ∼ p ( Y a | y ) from the pos ter ior distribution on the state totals. 6. The national health interview surv ey Figure 2 shows the fina l inference o n the state tota ls (as a p ercentage of total po pulation N a for state a ). Note how inference from the semi- parametric mo del corres p o nds to a compromise b e tw een the ov e r smo othing synthetic estimates, and the overfitting empirical means (based o n obser ved data in each state only). The states ar e sorted by decreasing imputed probability to facilitate comparis o n. The po sterior standard deviations in the sta te percentages are b etw een 2 a nd 6 percent- age p oints. This is the uncer taint y due to estimating the state totals based on the partial s ample information only . Another sour ce of e r ror is due to ev aluating the po sterior means n umerically b y simulation only . The corresp onding uncer tainties are negligible relative to the inherent posterio r standard dev iations. Figure 3 sho ws the same informatio n in a geo graphical map of the U.S. Figure 4 s hows a summary of the imputed random effects β sid . Clearly , ass uming random effects for differen t do mains to b e i.i.d. generated from some univ ariate Fig 2 . Estimate d state totals E ( Y a | y ) under the pr op ose d mo del (b ar plot), the synthetic metho d (dashe d line) and as sample aver ages over observe d samples in ea ch state (dotte d line). The short b ars b elow the horizontal axis show one p osterior s.d. S D ( Y a | y ) for the state totals. Err or b ars at e ach sample aver age estimate indic ate c orr esp onding sampling err ors (assuming that al l observations in a given state wer e indep endent). The sam ple did not include any data for NE and ND. Thus, ther e is no “sample estimate” f or these states. 232 D. Male c and P. M¨ ul ler Fig 3 . Posterior pr e dictive me ans p er state for the p er c entage of women who had a mammo gr am done in the p ast two yea rs. The solid ly fil le d fr action of the thermometer in e ach state c orr esp onds to the estimate d mammo gr am utilization in that state. T o highlight the differ enc es b etwe en states, the me asur ements ar e shown r e lative to the minimum and maximum estimate d p er c e ntage usage. A ful ly fil le d thermometer c orr esp onds to 58.4%, an e nt ir e ly empty t hermometer c orr esp onds to 37%. Fig 4 . Boxplots of impute d r andom effe ct s β sid , split by domain d , b ase d on the r andom effe cts as impute d after 3000 iter ations of the simulation. random effects distribution w ould be inappropria te. Posterior correlations of β sid across d r ange fro m − 0 . 5 to 0 . 6 . Figure 5 shows some features of the estimated mixing distribution G . A fully parametric mo del would corres po nd to e ither a point mass G , or a conjugate multiv ariate normal (in µ ) measur e G , corresp onding to a hierarchical mo del. Neither seems to be a go o d a ppr oximation to G . Figure 6 s hows the p oster ior distribution on the n um ber of distinct µ i in the mixture model ( 4 ). The estimated str atum-sp ecific random effects v s are shown in Figur e 7 . Semi-p ar ametric smal l ar e a estimation 233 Fig 5 . Estimate d mixi ng distribution G ( µ ) . Fig 6 . The p osterior distribution p ( k | y ) on t he numb er k of distinct µ i in the mixtur e mo del ( 4 ) . Ther e is a total of I = 3060 c ounties in the sample, i.e., 1 ≤ k ≤ 3060 . 7. Di scussion The pr op osed appro ach address ed some limitations o f cur r ently used models in small ar ea estimation b y substituting a no n-parametr ic model for the random ef- fects distribution of the count y- and domain-sp ecific r andom effects. Resulting in- ference a llows mor e fidelity to the data than ov e rsmo othing synt hetic estimates, without completely abandoning the borr owing of strength acro ss counties, domains and str ata as forma lized in the hierarchical mo del. Still, several assumptions remain in the mo del. This inc ludes the linear regressio n implied b y the term x ′ sid b in ( 3 ) and the normal prior o n the s tratum-sp ecific random effects. While r esidual plots (not sho wn here) indicate that the linear r egressio n assumption was not severely contraindicated by the da ta, a less r estrictive appr oach is desirable. Giv en the mas- sive da ta av a ila ble to fit the model, more ge ne r al non-parametric regressio n mo dels are p os sible. Also, the skewed distr ibution in Figure 7 indicates the need for less restrictive prior mo dels on the stratum-sp ecific rando m effects v s . Both gene r al- izations are po s sible with methods discus sed in this paper and will be pur sued in 234 D. Male c and P. M¨ ul ler Fig 7 . E { v s | y } , s = 1 , . . . , S . The figur e shows a histo gr am of impute d str atum-sp e c ific effe cts v s . future resea rch. Other extensions could add additional robustness by , for example, replacing the informal v a riable selection that we used for the demographic cov ariates b y mode l av eraging, by allowing stra tum-sp e cific rando m effects for the regression on demo- graphic c ov ar iates, and by including spatial smoo thing. Besides the basic test of fit by residua l plots one could ca rry out sp ecific mo del v alidatio n to in vestigate the use of such model ex tens io ns. App endix: Re sampling the log istic regression parameters Steps (i), (ii) and (iii) in Section 5 require the up dating of logistic reg r ession pa- rameters. W e describ e an indep endence chain implementation for Step (i). Steps (ii) and (iii) allo w analo gous implementations. T o up date b = ( b 1 , . . . , b p ), we fir st compute the moments of the norma l ap- proximation to the lik eliho o d based on the linearized logistic link function in a logistic reg r ession model (cf., [ 12 ], p. 41 ). Denote the moments of the resulting p -dimensional nor mal a pproximation by ( m 1 , V 1 ). The N ( m 1 , V 1 ) appro ximation o f the likelihoo d is no w co mb ined with the N ( m b , V b ) prior to obtain a biv ar iate normal appr oximation o f the conditiona l p osterio r p ( b | β , v , D ). Let m 3 and V 3 denote the moments of this approximation. Draw a candidate ˜ b ∼ N ( m 3 , V 3 ), and compute the following acceptance pr obability . Let ω denote the full parameter vector, and ˜ ω the parameter vector with b r eplaced by ˜ b . (8) a ( b, ˜ b ) = min 1 , p ( y | ˜ ω ) ϕ ( b ; m 1 , V 1 ) p ( y | ω ) ϕ ( ˜ b ; m 1 , V 1 ) , where ϕ ( x ; m, V ) denotes a normal density with momen ts m a nd V , ev aluated at x . Replace b by ˜ b with pro bability a . T o deriv e expr ession ( 8 ) consider the general expr ession for acceptance pro ba- bilities in a Metrop olis– Hastings algorithm (see, for example, [ 21 ]). Denote with g ( ˜ ω | ω ) the prop osa l distribution. Then a ( ω , ˜ ω ) = min 1 , p ( ˜ ω | y ) p ( ω | y ) g ( ω | ˜ ω ) g ( ˜ ω | ω ) . Semi-p ar ametric smal l ar e a estimation 235 Substitute for g ( ˜ ω | ω ) /g ( ω | ˜ ω ): ϕ ( ˜ β i ; m 3 , V 3 ) ϕ ( β i ; m 3 , V 3 ) = ϕ ( ˜ β i ; m 1 , V 1 ) ϕ ( ˜ β i ; m 2 , V 2 ) ϕ ( β i ; m 1 , V 1 ) ϕ ( β i ; m 2 , V 2 ) Also, p ( ˜ ω | y ) /p ( ω | y ) = [ p ( y i | ˜ ω i ) ϕ ( ˜ β i ; m 2 , V 2 )] / [ p ( y i | ω i ) ϕ ( β i ; m 2 , V 2 )]. The factors ϕ ( · ; m 2 , V 2 ) in p ( ˜ ω | y ) /p ( ω | y ) c ancel ag ainst the s a me factor s in g ( ˜ ω | ω ) /g ( ω | ˜ ω ) and we a r rive at ( 8 ). References [1] Ba ttese, G. and Fuller, W. (1981). Prediction of count y crop are a s using survey and satellite data. In Pr o c e e dings of the Americ an Statistic al Asso cia - tion, Survey R ese ar ch Se ction 5 00–50 5. [2] Dempster, A . and Tomberlin, T. (1980). The Analysis of Census Under- count form a P ostenumeration Survey . In Pr o c e e dings of the Confer enc e on Census Under c oun t , Arli ngton , V A 88–9 4. [3] F a y, R. and Herriot, R. (1979 ). Estimates of income for small places: An application of James –Stein pr o cedures to census data. J. A mer. Statist. As so c. 74 269– 2 77. MR05480 19 [4] Fer guson, T. S. (1973). A Ba y esian analysis of some nonpara metric prob- lems. Ann. Statist. 1 20 9–23 0. MR035 0949 [5] Ghosh, M., Na t arajan, K., S tr oud, T. W. F. an d Carl in, B. (1998). Generalized linear mo dels for small-area estimation. J. Amer. Statist. Asso c. 93 273– 2 82. MR16146 44 [6] MacEa chern, S . N. and M ¨ uller, P. (2000). E fficie nt MCMC s chemes for robust mo del extensions using encompassing Dirichlet proc ess mixture mo dels In R obust Bayesian A nalysis (F. Rugge r i and D. R ´ ıos-Insua, eds.) 295–3 16. Springer, New Y or k. MR17952 22 [7] Maiti, T. (2001). Robust generalized linear mixed mo dels for small are a esti- mation. J. Statist. Plann. Infer enc e 98 2 25–23 8. MR186 0396 [8] Malec, D., D a vis, W. and Cao, X. (199 9). Mo del based small area es- timates of o verw eigh t prev alence using sample selection adjustment. Statist. Me d. 1 8 3189– 3200 . [9] Malec, D. and Sedransk, J. (1992 ). Bay esian metho dology for combin - ing results from differ ent exp er iments when the sp ecifications for p o oling are uncertain. Biometrika 79 593 –601 . [10] Malec, D., Sedransk, J., Moriarity, C. and Le Clere, F. (1997 ). State e stimates of disability us ing a hierarchical mo del: an empiric a l ev aluation. J. A mer. St atist. Asso c. 92 815–8 26. [11] Massey, J. T., Mo ore, T. F., P arsons , V. L . and T adr os, W. (1989). Design a nd Es tima tio n for the Natio nal Health In terview Survey , 1 985– 94. Na- tional Center for He alth Statistics, Vital and He alth Statistics 2 11 0. Av a ila ble at http:/ /www. cdc.gov/ nchswww/data/sr2_110.pdf . [12] McCullagh, P. and Nelder, J. A. (1989). Gener alize d Line ar Mo dels , 2nd ed. Chapman and Hall, New Y ork. MR07278 36 [13] M ¨ uller, P. and Quint a na, F. (2004). Nonpara metric Bay esian data anal- ysis. Statist. Sci. 19 95–11 0. MR20821 49 [14] Na tional Center for Heal th St a tistics (1968 ). Synthetic state esti- mates of disability . PHS Publica tion No. 175 9. W ashington, D.C., U.S. Gov- ernment Printing Office. 236 D. Male c and P. M¨ ul ler [15] Neal, R . M. (200 0). Mark ov chain sa mpling methods for Diric hlet process mixture mo dels. J. Comput. Gr aph. Statist. 9 249– 2 65. MR18238 04 [16] Rao, J. N. K. (2 003). Smal l A r e a Estimation. Wiley , Ho bo ken, NJ. MR19530 89 [17] Richardson, S. and Green, P . (199 7). On Ba y esian analysis o f mixtures with a n unknown num ber of co mpo nents (with discussio n). J . R oy. Statist. So c. Ser. B 59 73 1 –792 . MR148321 3 [18] Rober t, C. (1995). Inference in mixture models. In Marko v Chain Mo nte Carlo in Pr actic e (W. R. Gilks, S. Ric hardson and D. J. Spiegelhalter, eds.) 441–4 64. Chapman a nd Hall, London. MR139 7974 [19] Roeder, K. and W asserman, L. (199 7). Practica l Bay esian density es- timation using mixtur es o f nor mals. J. Amer. Statist. A sso c. 92 894– 902. MR14821 21 [20] Schaible, W., Br ock, D. and Schnack, G. (1977). An empirica l com- parison of the simple inflation, syn thetic and compo s ite estimator s for sma ll area statistics . In Pr o c e e dings of the Americ an Statistic al Asso ciation, So cial Statistics Se ction 1017– 1021. [21] Tierney, L. (1994). Mark ov c hains for exploring pos terior distributions (with discussion). Ann. Statist. 4 170 1–17 6 2. MR13291 66 [22] U.S. Dep ar tment of Heal th and H uman Ser vices (1989). The Area Re- source File (ARF) System. Office of Data Analysis and Management (OD AM) Repo rt No. 7–8 9. [23] W alk er, S., D amien, P., L aud, P. and Smith, A. (1999). Bayesian non- parametric inference for distributions and related fun ctions (with discussion). J. R oy. Statist. So c. S er. B 61 485–5 2 7. MR17078 58
Original Paper
Loading high-quality paper...
Comments & Academic Discussion
Loading comments...
Leave a Comment