Multiple tests of association with biological annotation metadata
We propose a general and formal statistical framework for multiple tests of association between known fixed features of a genome and unknown parameters of the distribution of variable features of this genome in a population of interest. The known gen…
Authors: S, rine Dudoit, S"und"uz Kelec{s}
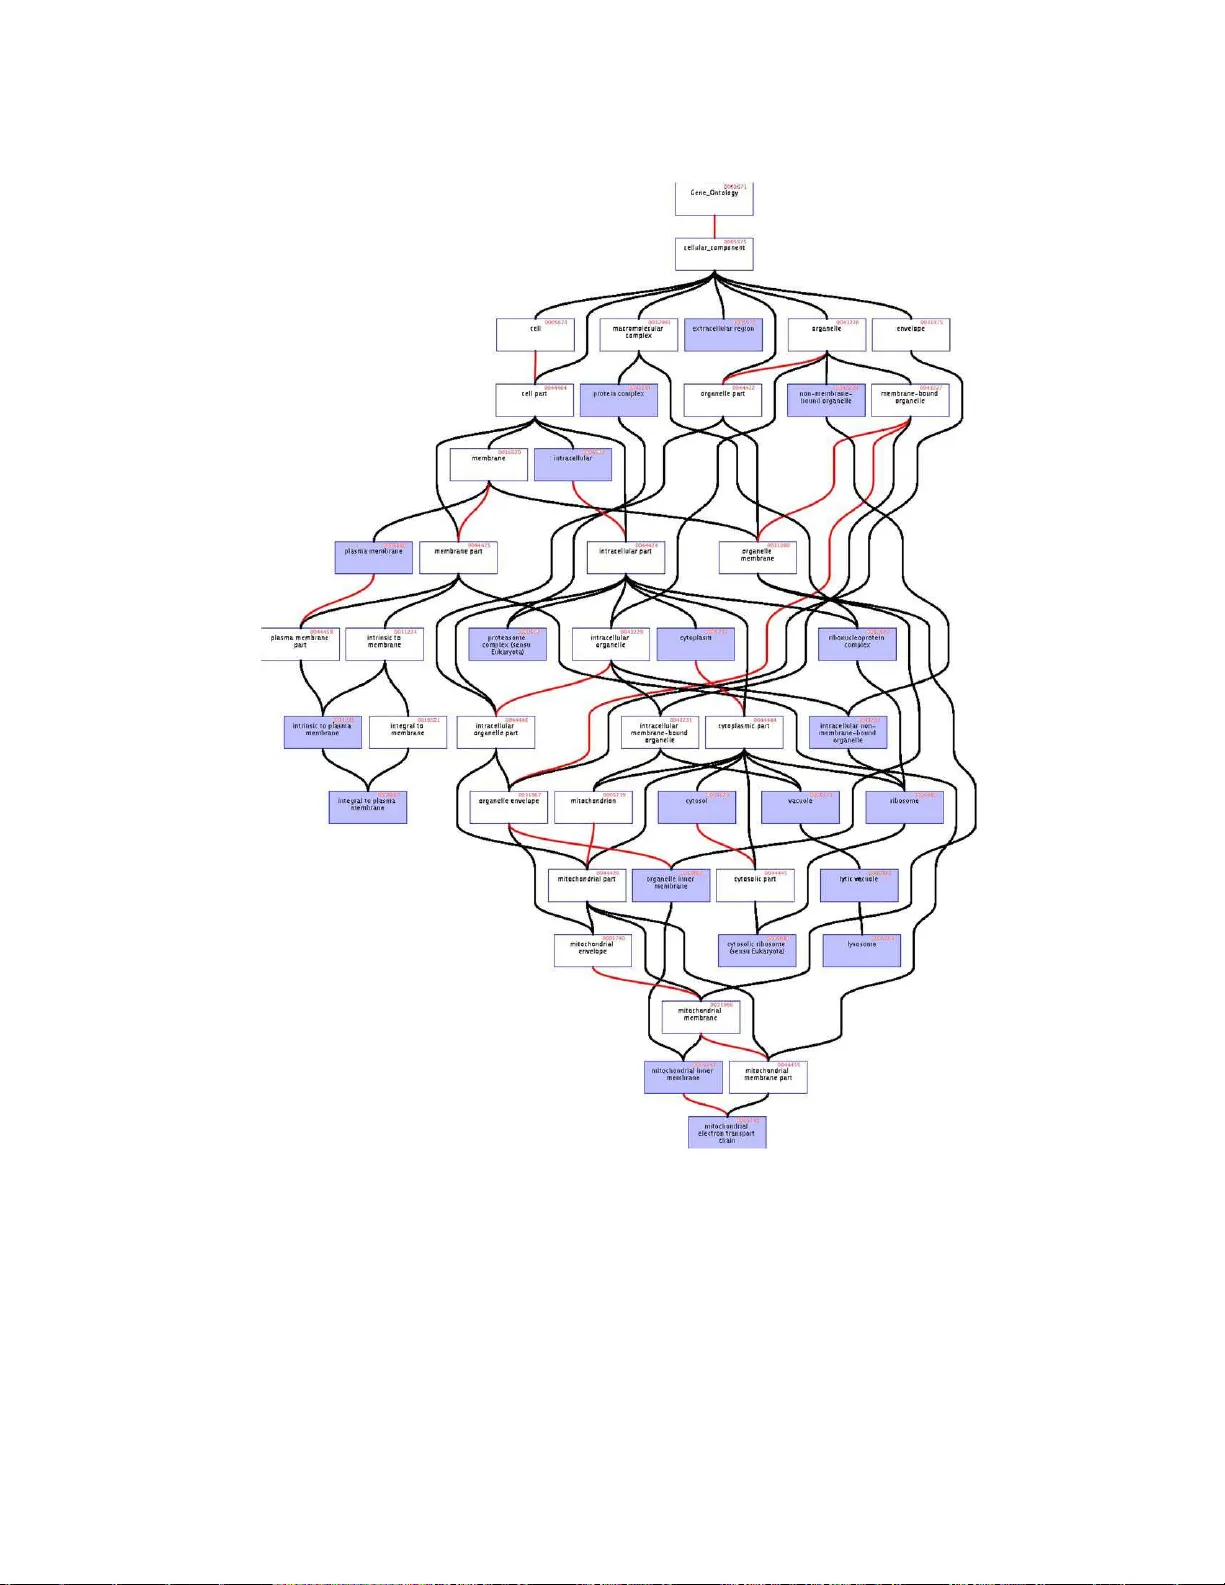
IMS Collectio ns Probability and St atistics: Essays i n Honor o f David A. F reedman V ol. 2 (2008) 153–218 c Institute of Mathematical Statistics , 2008 DOI: 10.1214/ 19394030 70000004 46 Multiple tests of asso ciation with biologi cal a nnotation metadata Sandrine Dudoit 1 , S ¨ und ¨ uz K ele¸ s 2 and Mark J. v an der Laan 1 University of California, Berkeley, U ni v ersity of Wisc onsin, Madison and University of California, Berk eley Abstract: W e propose a general and formal statistical fr amew ork for mu ltiple tests of asso ciation b et we en known fixed f eatures of a genome and unkno wn parameters of the di stribution of v ariable features of this genome in a p opu- lation of interest. The kno wn gene-anno tation profiles, corresponding to the fixed features of the genome, may concern Gene Ontology (GO) annotation, path w a y membership, r egulation b y particular transcription factors, nucleot ide sequences, or protein sequences. The unkno wn gene-parameter profiles, corre- sponding to the v ariable feat ures of the genome, ma y be, for example, re- gression co efficients r elating p ossibly censored biological and clinical outcome s to genome-wide tr anscri pt l ev els, D NA copy num bers, and other cov ariates. A generic question of great interest in curren t genomic researc h regards the detec- tion of asso ciations b et w een biological annotation metadata and genome-wide expression measures. This biological question may b e translated as the test of multiple hypotheses concerning asso ciation measures b etw een gene-annot ation profiles and gene-parameter pr ofiles. A general and ri gorous f ormulation of the statistical inference question allows us to apply the multiple h ypothesis test- ing m etho dology dev eloped i n [ Multiple T esting Pr o c e dur es with Applic ations to Genomics (2008) Spr i nger, New Y ork] and related articles, to co n trol a broad class of Type I error r ates, defined as generalized tail probabilities and expected v al ues for arbitrary f unctions of the num bers of Type I err ors and rejected hypotheses. The resampli ng- based single-step and step wise multiple testing pro cedures of [ Multiple T esting Pr o c edu r es with A pplic ations to Ge- nomics (2008) Springer, New Y ork] tak e into account the joint distribution of the test statistics and provide Type I error cont rol in testing problems inv olv- ing gene ral data generating distributions (with arbitrary dependence s tr uctures among v ariables), null hypotheses, and test statistics. The prop osed statistical and computational metho ds ar e illustrated using the acute l ymphoblastic leukemia (ALL) mi croarray dataset o f [ Blo o d 103 (2004) 2771–2778], with the ai m of rel ating GO annotation to different ial gene expression b etw een B-cell ALL with the BCR/ABL fusi on and cytoge netically normal N EG B-cell ALL. T he sensitivity of the identified lists of GO terms to the choice of association parameter b et we en GO annotat ion and differen- tial gene expression demonstrate s the im portance of tr ansl ating the biological question in terms of sui table gene-annot ation profiles, gene-parameter profiles, and asso ciation measures. In particular , the results rev eal the limi tations of binary gene-parameter profiles of different ial expression indicators, which are still the norm for com bined GO annotation and microarr a y data analyses. Pro- cedures based on such binary gene-parameter profiles tend to b e conserv ative and lack robustness wi th resp ect to the estimator f or the set of differen tially expressed genes. Our proposed statistical framework, wi th general definitions for the gene-annotation and gene-parameter pr ofiles, allo ws consideration of a 1 Division of Biostatistics and Departmen t of Statistics, University of Califor- nia, Berke ley , 101 Haviland Hall #7358, Berk eley , CA 94720-7358 , U SA, e-mail: sandrine @stat.be rkeley.edu ; laan@stat.b erkeley. edu . 2 Departmen ts of Statistics and of Biostatistics & Medical Informatics, Universit y of Wisconsin, Madison, 1300 Universit y Aven ue, 1245B Medical Sciences Cen ter, Madison, WI 53705, USA, e- mail: keles@st at.wisc. edu . 153 154 S. Dudoit, S. Kele¸ s and M. J. van der L aan muc h broader class of inf erence problems, that extend b ey ond GO annotation and micr oarr ay data analysis. Con ten ts 1 Int ro duction . . . . . . . . . . . . . . . . . . . . . . . . . . . . . . . . . . . 155 1.1 Motiv ation . . . . . . . . . . . . . . . . . . . . . . . . . . . . . . . . 1 55 1.2 Contrast with o ther approa ches . . . . . . . . . . . . . . . . . . . . . 15 7 1.3 Outline . . . . . . . . . . . . . . . . . . . . . . . . . . . . . . . . . . 15 8 2 Multiple hypothesis testing . . . . . . . . . . . . . . . . . . . . . . . . . . 158 2.1 Null a nd a lternative hypotheses . . . . . . . . . . . . . . . . . . . . . 1 59 2.2 T est statistics . . . . . . . . . . . . . . . . . . . . . . . . . . . . . . . 160 2.3 Rejection regions . . . . . . . . . . . . . . . . . . . . . . . . . . . . . 1 60 2.4 Er rors in m ultiple hypothesis testing . . . . . . . . . . . . . . . . . . 162 2.5 Type I error rate a nd p ow er . . . . . . . . . . . . . . . . . . . . . . . 1 63 2.6 Adjusted p - v alues . . . . . . . . . . . . . . . . . . . . . . . . . . . . . 16 4 2.7 T est statistics null distribution . . . . . . . . . . . . . . . . . . . . . 1 65 2.7.1 Null shift a nd scale- transformed test statistics null distribution 166 2.7.2 Null quantile-transformed test statistics null distribution . . . 1 6 7 2.8 Overview of multiple testing pro c e dur es . . . . . . . . . . . . . . . . 167 2.9 FWER-co ntrolling single-step common-cut-off maxT pro cedure . . . 168 3 Statistical framework for multiple tests of asso ciation with biolog ical an- notation metadata . . . . . . . . . . . . . . . . . . . . . . . . . . . . . . . 170 3.1 Gene-a nnotation pr ofiles . . . . . . . . . . . . . . . . . . . . . . . . . 170 3.2 Gene-pa rameter profiles . . . . . . . . . . . . . . . . . . . . . . . . . 171 3.3 Asso c iation measures for gene-a nnotation a nd g ene-parameter profiles 17 2 3.3.1 Univ aria te asso ciatio n measures . . . . . . . . . . . . . . . . . 17 2 3.3.2 Multiv aria te asso cia tion measur es . . . . . . . . . . . . . . . 17 4 3.4 Multiple hypo thesis testing . . . . . . . . . . . . . . . . . . . . . . . 1 75 3.4.1 Null and alter native h ypo thes e s . . . . . . . . . . . . . . . . . 1 75 3.4.2 T est s ta tistics . . . . . . . . . . . . . . . . . . . . . . . . . . . 175 3.4.3 Multiple testing pro cedures . . . . . . . . . . . . . . . . . . . 1 76 4 The Gene Ontology . . . . . . . . . . . . . . . . . . . . . . . . . . . . . . 177 4.1 Overview of the Gene Ontology . . . . . . . . . . . . . . . . . . . . . 17 7 4.1.1 The three g ene ontologies: BP , CC, a nd MF . . . . . . . . . . 177 4.1.2 GO directed acy c lic g raphs . . . . . . . . . . . . . . . . . . . 17 8 4.1.3 GO softw are to ols . . . . . . . . . . . . . . . . . . . . . . . . 1 78 4.1.4 GO gene-a nnotation ma trices . . . . . . . . . . . . . . . . . . 1 79 4.2 Overview of R and B io conductor softw are for GO anno tation meta- data analysis . . . . . . . . . . . . . . . . . . . . . . . . . . . . . . . 179 4.3 The annota tion metadata pack age GO . . . . . . . . . . . . . . . . . 18 2 4.4 Affymetrix chip-specific annotation meta data pa ck ages: T he hg u95av2 pack age . . . . . . . . . . . . . . . . . . . . . . . . . . . . . . . . . . 1 84 AMS 2000 subje ct classific ations: Primary 62H15, 62P10; secondary 62G09, 62G10, 62H10, 62H20. Keywor ds and phr ases: acute lymphoblastic l euk emia ( ALL), adjusted p -v al ue, Affymetrix, annotation metadata, association measure, BCR/ABL fusi on, Bi oconductor Pro j ect, bo otstrap, co-expression, correlation, cut-off, differen tial expression, directed acyclic graph, family-wise error rate, gene, gene-annotation profile, Gene Ontology (GO), gene-parameter profile, generalized ex- pected v alue error rate, generalized tail pr obabili t y error r ate, genomics, joint distribution, m axT, microarray , multiple hypothesis testing, non-parametric, null dis tr i bution, null hypothesis, pow er, R, rej ection region, r esampling, softw are, test statistic, Type I error rate. Multiple tests of asso ciation with biolo gic al annotation metadata 155 4.4.1 Prob es-to -most sp e cific GO terms mappings: The hgu 95av2 GO environmen t . . . . . . . . . . . . . . . . . . . . . . . . . . . . 186 4.4.2 GO terms-to -directly a nnotated prob es mappings: The hgu9 5av2G O2PROB E en vironment . . . . . . . . . . . . . . 1 87 4.4.3 GO terms-to -all a nnotated prob es mappings: The hgu9 5av2G O2ALLP ROBES environmen t . . . . . . . . . . . 187 4.5 Assembling a GO gene-annotation matrix . . . . . . . . . . . . . . . 1 88 5 T ests of a sso ciation b etw ee n GO a nno tation and differential ge ne ex pres- sion in ALL . . . . . . . . . . . . . . . . . . . . . . . . . . . . . . . . . . . 19 0 5.1 Acute lympho blastic leukemia study o f Chiar etti et al. [13 ] . . . . . 190 5.1.1 Bio conductor exp er imen tal data R pack age ALL . . . . . . . . 190 5.1.2 The BCR/ABL fusion . . . . . . . . . . . . . . . . . . . . . . 19 0 5.1.3 Gene filtering . . . . . . . . . . . . . . . . . . . . . . . . . . . 191 5.1.4 Reduced ALL datas et: Geno t yp e s a nd phenotypes of interest 191 5.2 Multiple hypo thesis testing framework . . . . . . . . . . . . . . . . . 192 5.2.1 Gene-annotation pro files . . . . . . . . . . . . . . . . . . . . . 1 9 2 5.2.2 Gene-parameter profiles . . . . . . . . . . . . . . . . . . . . . 19 2 5.2.3 Asso ciation measures for gene-a nnotation and gene-para meter profiles . . . . . . . . . . . . . . . . . . . . . . . . . . . . . . 1 94 5.2.4 Null and alter native h ypo thes e s . . . . . . . . . . . . . . . . . 1 95 5.2.5 T est s ta tistics . . . . . . . . . . . . . . . . . . . . . . . . . . . 195 5.2.6 Multiple testing pro cedures . . . . . . . . . . . . . . . . . . . 1 96 5.2.7 Summary of testing scenarios . . . . . . . . . . . . . . . . . . 196 5.3 Results . . . . . . . . . . . . . . . . . . . . . . . . . . . . . . . . . . . 1 98 5.3.1 Different ially express e d genes b etw een BCR/ABL a nd NEG B-cell ALL . . . . . . . . . . . . . . . . . . . . . . . . . . . . 198 5.3.2 GO ter ms asso ciated with differential g ene expres sion b e- t ween BCR/ABL and NEG B-cell ALL . . . . . . . . . . . . 200 6 Discussion . . . . . . . . . . . . . . . . . . . . . . . . . . . . . . . . . . . . 20 9 Soft ware and website companio n . . . . . . . . . . . . . . . . . . . . . . . . . 214 References . . . . . . . . . . . . . . . . . . . . . . . . . . . . . . . . . . . . . . 214 1. Introductio n 1.1. Motivati on Exp erimental data, suc h as microar ray gene expr ession mea sures, g ain muc h in rele- v ance from their asso ciation with biolo gic al annotation metadata , i.e., data on data, such as, GenBa nk sequences, Gene Ontology terms, KEGG pathw a ys, a nd PubMed abstracts. A challenging and fascinating ar ea of resea r ch for statisticians concerns the development of metho ds for relating exp erimental data to the wealth o f meta- data av ailable publicly on the WWW. T asks include accessing and pre-pro cessing the da ta , making inference from these da ta, and summarizing and interpreting the results. In this con text, an important class of statistical pr oblems in v olves testing for asso ciatio ns be t ween known fixed features o f a genome and unknown par ameters of the distribution of v ariable fea tures of this genome in a p opulation o f in terest. Her e, features o f a genome are said to b e fixe d , if they remain constant a mong p opulation units. In co n trast, variable features are allowed to differ among po pulation units. Fixed features typically cons ist o f g ene annotation metadata, that r eflect c ur rent 156 S. Dudoit, S. Kele¸ s and M. J. van der L aan knowledge on gene prop er ties , such as, n ucleotide a nd pro tein sequences , r egula- tion, a nd function. V ariable features often consist of gene expressio n mea sures, that r e flect cellular type/s tate/activity under par ticular conditions. The fixed and v aria ble features define, resp ectively , gene-ann otation pr ofiles and gene-p ar ameter pr ofiles ; the par ameter o f interest then co rresp onds to me asur es of asso ciation b e- twe en known gene-annotation pr ofiles and unknown gene-p ar ameter pr ofiles . F or instance, for the yeast Sac char omyc es c er evisiae (in short, S. c er evisia e ), one may b e interested in detecting asso cia tions b e tween the vector o f mean transcript (i.e., mRNA) levels for all (approximately 6,500) genes under heat-s ho c k condi- tions and Gene Ont olo gy (GO ) a nno tation for these genes. The r eader is re ferred to the Gene Ontology Conso rtium website ( www.ge neont ology.org ) and to Sec- tion 4 , b elow, for more information on gene ontologies, and to the Saccharom yces Genome Database (SGD) website ( www.y eastge nome. org ), for de ta ils on S. c er e- visiae . In this example, the p opulation o f interest may consist of all heat- sho ck ed cells from well-defined cultures of a particular stra in o f S. c er evisiae (e.g., s train S288C). F or each of the three gene on tologies (BP , CC, and MF, as describ ed in Section 4.1 ), each g ene is anno tated with a fixed set of GO terms (i.e., this set is constant a cross p opulation units for a giv en version of the GO Database). Thus, for a given GO term, one may define a gene-a nno tation profile as a known, fixed binary vector indicating for each g ene whether it is annotated or not with the particular GO term. T he tr anscript levels, how ever, v ary among p o pula tion units and the ge ne - parameter pr ofile, i.e., the vector of genome-wide mean transcr ipt levels in the p opulation of heat- sho ck ed yeast cells, is unknown and may b e esti- mated, for exa mple, from a microarr ay exp eriment inv olving a sample of yeast cells from the p opulation. The associa tion par ameter of interest, b e tween GO annota- tion and transcript levels, is then a v ector of asso ciatio n meas ures (e.g., t wo-sample t -statistics) b etw een the known binary gene-a nnotation profiles and the unknown contin uo us gene-para meter profile. Similar inference questions arise in man y other cont exts and inv olv e a v ariety of definitio ns for the g ene-annotatio n pr ofiles, the gene-par ameter profiles, a nd the asso ciatio n parameter s of interest. F or example, in cancer microa r ray studies, o ne may seek a s so ciations b etw een GO gene-anno tation profiles a nd a gene- pa rameter profile of reg ression co efficients relating (censor ed) patient surviv a l data to genome- wide transcript levels or DNA copy num bers. F urthermore, gene-anno tation profiles need no t b e binary or even po lychotomous, and may corres po nd to pa th wa y mem- ber ship, regulation by par ticular transcription factors, n ucleotide sequences, and protein seq uenc e s. Note that, for the sake of illus tration, we fo cus on ge ne-level features. How ev er, our pr op osed metho dolog y is g e neric a nd may b e applied to other types of features , such as thos e concerning gene is o forms a nd proteins. F or insta nce, a s in alterna- tive s plicing microar ray analy sis, one ma y collect data at the finer level o f gene isoforms, where one gene may have mult iple isofor ms [ 10 ]. In this context, isoform- p ar ameter pr ofiles may refer to the distribution of microarray isoform ex pr ession measures in a w ell-defined p opula tion, while isoform-annotation pr ofiles ma y con- sist of e x on/intron coun ts/lengths/nucleotide dis tributions. One may also consider protein-level features , where, for example, pr otein-p ar ameter pr ofiles co rresp ond to antibo dy microarray expr e s sion mea sures and pr otein-annotation pr ofiles refer to protein function, domain structur e , a nd p ost- tr anslational modifica tion (e.g., Swiss-Pro t, www.ex pasy. org/s prot ). Multiple tests of asso ciation with biolo gic al annotation metadata 157 1.2. Contr ast with other appr o aches Existing appro aches fo r tests of asso ciation with biological annotation metadata fo cus primar ily on relating micr oarr ay ge ne expression mea sures and GO anno ta- tion. Relev ant articles and s o ft ware pa ck ag e s include: FatiG O fr o m the BABE LOMIC S suite ([ 1 , 2 ]; www.ba belomi cs.org ); GOsta t ([ 4 ]; gostat. wehi. edu.au ); Ontolo gizer ([ 22 ]; www.ch arite .de/ch/m edgen/ontologizer ); CSE PCT ([ 28 ]; genome 3.ucs f.edu :8080/cgi-bin/compareExp.cgi ); GSEA-P ([ 29 ], [ 36 ]; www.br oad.m it.ed u/gsea/doc/doc index.h tml ); [ 37 ]. Metho ds pr op osed thus far suffer fr o m a num b er of limitations , r e lated, to a large extent, to the abs e nce of a clear and precise sta temen t of the statistical inference question. As a r esult, the analyses often lack s ta tistical rigor and tend to be ad ho c and dataset- sp ecific. One of o ur main contributions is the systematic and precise translation of a general clas s of bio logical questio ns in to a corr esp onding class of mult iple hypo thesis testing problems. A key step in this process is the prop er definition of the gene- annotation pro files, gene-par ameter pro files, and a sso ciation para meter s of interest. This g eneral f ormulation then a llows us to a pply the m ultiple hyp o thesis testing metho dology developed in [ 14 ] and related articles [ 8 , 15 , 16 , 31 , 32 , 33 , 34 , 3 9 , 40 , 41 , 42 ], to control a broad class of Type I erro r rates, defined as ge neralized tail pr obabilities (gTP), g T P ( q , g ) = Pr( g ( V n , R n ) > q ), and genera lized exp ected v alues (gE V), g E V ( g ) = E[ g ( V n , R n )], for a rbitrary functions g ( V n , R n ) of the nu m ber s of false p ositives V n and rejected hypotheses R n . W e wis h to emphasiz e the crucial and o ften ignored distinction betw een: (i) defin- ing a p ar ameter of int erest, measuring the asso c iation b etw een gene-a nnotation and gene-para meter profiles, i.e., the statistical formulation of the biolog ical question; (ii) making infer enc es , i.e., estima ting a nd testing hyp otheses co ncerning this pa- rameter, based on a s ample drawn fro m the p opulation under considera tion. Most metho ds pr op osed to date foc us on (ii), without providing a clea r statement of the question b eing answered in (i), that is, v arious estimation a nd testing pro cedures are prop os ed for an undefined parameter o f interest. Due to its genera l a nd rig orous sta tistical framework, our approa ch to multiple tests o f as so ciation w ith biolo gical annotatio n metada ta differs in a num b er of impo rtant w a ys from current appro aches, such a s those developed for inference with Gene Ontology metadata and implemented in the softw are pack ages listed on the Gene Ontology T o ols webpage ( www.ge neont ology .org/GO.tools.shtml ). General gene-annotation p rofil es. Existing appro aches t ypically consider bi- nary gene-annota tio n pr ofiles, e.g., vectors o f indicators of GO term annotation. Our g eneral definition o f g e ne - annotation profiles allo ws co nsideration of arbi- trary qualitative and qua ntitative fix e d features of a genome, e.g., members hip of genes to an y num ber of pathw ays or clusters, exon/intron co unt s/lengths/ nu cleotide distributions, mea n tra nscript levels. General gene-parameter profiles. Existing a ppr oaches typically co nsider bi- nary gene- parameter profiles , e .g ., vectors of indica tors of differential expression. Our genera l definition of g ene-para meter pro files allows consideration of a muc h broader class of testing problems , co ncerning arbitrar y qualitative and quanti- tative parameters, suc h as, differences in mean expression levels or r egress io n co efficients relating expr ession le vels to clinical o utco mes. Estimated gene-parameter profiles. Existing a pproaches t ypically assume known gene- parameter profiles . F or exa mple, the list of differentially expressed 158 S. Dudoit, S. Kele¸ s and M. J. van der L aan genes from a microarray exp eriment is usually treated as kno wn and fixed in subsequent analyses with GO, w hile in fact it corres p o nds to an unknown and estimated pa rameter. Distinguishing b etw een the definition of a parameter and inference conc e r ning this parameter, a s in Section 3 , provides a mo re rig orous and general formulation of the statistical question. General tests of asso ciation. Common approaches to tests of asso ciation with GO a nnotation are t ypically limited to tests o f independence in 2 × 2 contingency tables (e.g., bas ed o n the hyper geometric distribution, Fisher ’s exact tes t). As in T able 2 , rows cor resp ond to gene annotation with a given GO ter m (fixed binary gene-annota tio n pr ofile) and columns to a gene prop er ty o f interest, suc h as differential expression (treated as a fixed bina ry gene-pa r ameter profile). The approach pro p o sed in Section 3 allows cons ideration of a br oader class o f biologi- cal testing problems, while pr op erly accounting for the fact that gene-parameter profiles are usually unknown a nd replaced by a ra ndom (i.e., data-driven) esti- mator. 1.3. Ou tl ine This article prop oses a g eneral a nd for mal statistical framework for multiple tests of a sso ciation with biologica l annotation metadata, us ing the multiple hypothesis testing metho dolog y develope d in [ 14 ] and r elated articles. Section 2 pr ovides an intro duction to multiple hypothesis testing. Section 3 presents the propos e d statistical fra mework for m ultiple tests of asso cia tio n with biological annotation metada ta and discusses in detail the main comp onents of the inference pr oblem, namely , the g ene-annotation pro files, the gene-pa rameter profiles, a nd the asso ciation par a meters. Multiple testing pro ce dures (MTP) for tests of asso ciation b e tw een g ene-annotatio n profiles and gene-pa rameter pro files are outlined. Section 4 gives an ov erview of the Gene Ontology (GO) and R soft- ware for accessing and ana lyzing GO annota tion metadata (e.g., fo r as sembling GO gene-annota tio n profiles ). The prop osed statistical and computational metho ds are illustrated in Se c tion 5 , using the a cute ly mpho blastic leukemia (ALL) microa rray dataset of [ 13 ], with the aim of relating GO annotation to differential g ene expre s - sion b etw ee n B-cell ALL with the BC R/ ABL fusion and cytog e netically normal NEG B- cell ALL. Finally , Section 6 summarizes our finding s and o utlines o ngoing work. 2. M ultiple hypothes is te s ting This section, based on Chapter 1 of [ 14 ], in tro duces a general statistical framework for multiple hypothesis testing and summariz e s in tur n the main ingr edients of a m ultiple testing problem, including: the data generating distribution; the parame- ters o f interest; the n ull a nd alterna tive hypotheses; the test statistics; the rejectio n regions (i.e., cut-offs) for the test statistics; err ors in multiple hypothesis testing; Type I erro r ra te a nd p ower; adjusted p -v alues. The section also provides an ov erview o f m ultiple testing pro cedures developed in [ 14 , Chapters 2 –7], for controlling generalized tail pr o bability and exp ected v alue error rates, including the key choices of a jo in t null distribution and rejection reg ions for the test statistics . The rea de r is referred to our b o ok and a rticles for further detail o n the mult iple testing metho dology , its softw are implementation, and its application to a v a r iety Multiple tests of asso ciation with biolo gic al annotation metadata 159 of testing problems in biomedical and genomic research [ 5 , 6 , 7 , 8 , 9 , 14 , 15 , 16 , 26 , 31 , 32 , 33 , 3 4 , 39 , 4 0 , 41 , 42 ]. 2.1. Nul l and alternati ve hyp otheses Hyp othesis testing is concer ned with using observed data to mak e decisions regard- ing prop er ties of (i.e., h ypo theses for) the unknown data generating distribution. Let X n ≡ { X i : i = 1 , . . . , n } denote a r andom sample of n independent and ident ically distr ibuted (I ID) ra ndom v ar iables from a data gener ating di stribution P , i.e., X i I I D ∼ P , i = 1 , . . . , n . Supp ose that the data genera ting distribution P is an element of a particular statistical mo del M , i.e., a set of p ossibly non-par ametric distributions. Let P n denote the empiri c al distribution c orresp o nding to the sample X n , i.e., the distribution which places pr obability 1 /n o n ea ch realization of X . In order to cover a br oad class of tes ting problems , define M pairs o f null and alternative hypothese s in terms of a co llection of M submo dels , M ( m ) ⊆ M , m = 1 , . . . , M , for the data ge ne r ating distr ibutio n P . Sp ecifically , the M nul l hyp otheses and cor r esp onding alternative hyp otheses are defined as (1) H 0 ( m ) ≡ I ( P ∈ M ( m )) and H 1 ( m ) ≡ I ( P / ∈ M ( m )) , resp ectively . The g eneral submo del representation acco mmo dates tests of means , qua nt iles, cov ariances, cor relation co efficie nts, and regression co efficients in linear and non- linear mo dels (e.g ., lo gistic, surviv al, time-ser ie s mo dels). In many testing pr oblems, the submo dels concern p ar ameters , i.e., functions Ψ( P ) = ψ = ( ψ ( m ) : m = 1 , . . . , M ) ∈ R M of the data generating distribution P , and each null hypothesis H 0 ( m ) refers to a single parameter, ψ ( m ) = Ψ( P )( m ) ∈ R . One distinguishes betw een tw o t ypes of testing problems for suc h par ametric hypotheses: one-side d tests , H 0 ( m ) = I ( ψ ( m ) ≤ ψ 0 ( m )) (2) vs. H 1 ( m ) = I ( ψ ( m ) > ψ 0 ( m )) , m = 1 , . . . , M , and two-side d tests , H 0 ( m ) = I ( ψ ( m ) = ψ 0 ( m )) (3) vs. H 1 ( m ) = I ( ψ ( m ) 6 = ψ 0 ( m )) , m = 1 , . . . , M . The hypothesized nu l l values , ψ 0 ( m ), ar e frequently zero. Let (4) H 0 = H 0 ( P ) ≡ { m : H 0 ( m ) = 1 } = { m : P ∈ M ( m ) } denote the set of h 0 ≡ |H 0 | true nul l hyp othe ses , where the longer notation H 0 ( P ) emphasizes the dep endence of this s et on the data g enerating distributio n P . Like- wise, let (5) H 1 = H 1 ( P ) ≡ { m : H 1 ( m ) = 1 } = { m : P / ∈ M ( m ) } = H c 0 ( P ) be the set of h 1 ≡ |H 1 | = M − h 0 false nul l hyp otheses . The g oal of a m ultiple testing pro cedure is to accurately estimate, i.e., r eje ct , the set H 1 , while pro babilistically controlling false p ositives. 160 S. Dudoit, S. Kele¸ s and M. J. van der L aan 2.2. T est statistics A testing pr o c e dur e is a r ando m or data-driven rule for estimating the s e t o f false nu ll hypotheses H 1 = { m : H 0 ( m ) = 0 } = { m : P / ∈ M ( m ) } , i.e., for deciding which nu ll hypotheses sho uld b e re je cte d . The decisions to reject or not the null hypotheses are based on an M -vector o f t est statistics , T n = ( T n ( m ) : m = 1 , . . . , M ), that are functions T n ( m ) = T ( m ; X n ) = T ( m ; P n ) o f the data X n , i.e ., of the empiric al distribution P n . Deno te the t ypically unknown (finite s a mple) joint distribution of the test statistics T n by Q n = Q n ( P ). As in [ 14 , Cha pter 1], for the test of single-pa rameter null h ypotheses of the form H 0 ( m ) = I ( ψ ( m ) ≤ ψ 0 ( m )) or H 0 ( m ) = I ( ψ ( m ) = ψ 0 ( m )), m = 1 , . . . , M , consider tw o main types of test statistics, differ enc e statistics , (6) T n ( m ) ≡ E stimator − Null v alue = √ n ( ψ n ( m ) − ψ 0 ( m )) , and t -statist ics (i.e., sta ndardized differences), (7) T n ( m ) ≡ Estimator − Null v alue Standard erro r = √ n ψ n ( m ) − ψ 0 ( m ) σ n ( m ) . Here, ˆ Ψ( P n ) = ψ n = ( ψ n ( m ) : m = 1 , . . . , M ) denotes an estimator for the param- eter Ψ( P ) = ψ = ( ψ ( m ) : m = 1 , . . . , M ) a nd ( σ n ( m ) / √ n : m = 1 , . . . , M ) denote the estimated standar d err ors f or elements ψ n ( m ) of ψ n . F urther supp ose a n asymptotic al ly line ar estimato r ψ n of the para meter ψ , with M - dimensional vector influenc e curve (IC) I C ( X | P ) = ( I C ( X | P )( m ) : m = 1 , . . . , M ), such that (8) ψ n ( m ) − ψ ( m ) = 1 n n X i =1 I C ( X i | P )( m ) + o P (1 / √ n ) and E[ I C ( X | P )( m )] = 0, for each m = 1 , . . . , M . Let Σ( P ) = σ = ( σ ( m, m ′ ) : m, m ′ = 1 , . . . , M ) denote the M × M cov ar iance matr ix of the vector influence curve I C ( X | P ), where σ ( m, m ′ ) ≡ E[ I C ( X | P )( m ) I C ( X | P )( m ′ )] a nd we may adopt the shorter notatio n σ 2 ( m ) = σ ( m, m ) = E[ I C 2 ( X | P )( m )] for v ar iances. Ass ume that σ 2 n ( m ) are c onsistent estimators of the IC v ariances σ 2 ( m ). The influence cur ve of a given estimator c a n b e der ived as its mean-zero-c e n tered functional deriv ativ e (as a function of the empirical distribution P n for the entire sample of size n ), applied to the empirical distribution for a sample of size one [ 19 , 20 ]. This g eneral r epresentation for the test s tatistics cov e rs standard one-sample and t wo-sample t -statistics for testing hypotheses concerning mean parameter s, but also test s tatistics for cor relation co efficients and regres s ion co efficients in linear and non- linear mo dels. T est sta tistics for other types o f null hypo thes e s include F -statistics, χ 2 -statistics, and likelihoo d ra tio statistics. 2.3. R ej e ction r e gions A mu ltiple testing p r o c e dur e (MTP) provides r eje ction r e gions C n ( m ), i.e., sets of v alues for eac h test statistic T n ( m ) that lead to the decision to reject the corre- sp onding null hypothesis H 0 ( m ) and decla re that P / ∈ M ( m ), m = 1 , . . . , M . In Multiple tests of asso ciation with biolo gic al annotation metadata 161 other words, a MTP pro duces a r andom (i.e., data-dep endent) set R n of rejected hypotheses that estimates the set H 1 of false null hypo theses, (9) R n = R ( T n , Q 0 n , α ) ≡ { m : T n ( m ) ∈ C n ( m ) } = { m : H 0 ( m ) is rejected } , where C n ( m ) = C ( m ; T n , Q 0 n , α ), m = 1 , . . . , M , denote p os s ibly rando m re jection regions. The long no tation R ( T n , Q 0 n , α ) and C ( m ; T n , Q 0 n , α ) emphasizes that the MTP depe nds on the following three ingredients: • the data , X n = { X i : i = 1 , . . . , n } , thro ugh the M - vector of test statistics , T n = ( T n ( m ) : m = 1 , . . . , M ) (Section 2.2 ); • an (estimated) M -v ariate test statist ics nul l distribution , Q 0 n , which replac es the unknown tr ue test statistics distribution Q n = Q n ( P ) for the pur po se of der iving rejection re g ions, co nfidence regions, and adjusted p -v alues (Sectio n 2.7 ); • the nominal T yp e I err or level α , i.e., a user-supplied upp er b ound for a suitably defined Type I err or r ate (Section 2.5 ). Given a prop er test statistics null distribution Q 0 (or es tima to r thereof, Q 0 n ), the main tas k is to specify rejectio n r egions for each null hypo thesis, so t hat the resulting pr o cedure pr o babilistically controls T ype I error s. W e consider MTPs based on nest e d rejection r egions, that is, (10) C ( m ; T n , Q 0 n , α 1 ) ⊆ C ( m ; T n , Q 0 n , α 2 ) , whenever α 1 ≤ α 2 . Rejection reg io ns are typically defined in terms of interv als, such as, C n ( m ) = ( u n ( m ) , + ∞ ), C n ( m ) = ( −∞ , l n ( m )), or C n ( m ) = ( −∞ , l n ( m )) ∪ ( u n ( m ) , + ∞ ), where l n ( m ) = l ( m ; T n , Q 0 n , α ) and u n ( m ) = u ( m ; T n , Q 0 n , α ) are to- be- determined low er and upp er cri tic al values , or cut-offs , co mputed under the null dis tribution Q 0 n for the test sta tistics T n . Tw o-sided rejection reg ions of the form C n ( m ) = ( −∞ , l n ( m )) ∪ ( u n ( m ) , + ∞ ) allow the use of asymmetric cut-offs for t w o-sided tests. Unless s pec ified otherwise, we assume that larg e v a lues o f the test statistic T n ( m ) provide evidence against the corr esp onding null hypothesis H 0 ( m ), that is, we consider one-sided rejection regio ns of the form C n ( m ) = ( c n ( m ) , + ∞ ), where c n ( m ) = c ( m ; T n , Q 0 n , α ). F or tw o-sided tests o f single-pa rameter null hypotheses using difference o r t -statistics, as in Equatio ns ( 6 ) and ( 7 ) , one could take absolute v alues of the test statistics. Among the different approaches fo r defining rejection regions, we distinguish the following. Marginal vs. joi n t multiple testing pro cedures. In mar ginal multiple test- ing pro cedures , rejection r e gions are based solely o n the marginal distributions of the test statistics (e.g., FWER-controlling single-s tep Bonferroni pro cedure [ 12 ]). In contrast, joint pro cedures take int o acc o unt the dep e ndence s tructure of the test statistics (e.g ., FWER- controlling single-s tep maxT P ro cedure 1). Joint MTPs tend to be more p ow erful than marginal MTPs. Note that while a pr o cedure may b e margina l, pro of of T ype I error co nt rol by this MTP may re quire certain assumptions on the dep endence structure of the test statistics (e.g., FWER-controlling step-up Ho ch berg pro c e dure [ 23 ]). Single-s tep vs. stepwise multiple testing pro cedures. In single-st ep m ulti- ple testing proce dur es, eac h null hypo thes is H 0 ( m ) is tested using a rejection region that is indep e nden t of the results of the tests of other hypothese s and is not a function of the data X n (unless these data ar e used to estimate the null dis- tribution). In contrast, in stepwise pr o cedures, the decision to reject a particula r 162 S. Dudoit, S. Kele¸ s and M. J. van der L aan nu ll h yp othesis dep ends on the o utcome of the tests of other hypo thes es. Tha t is, the (single- step) testing pro cedur e is a pplied to a se quenc e of su c c essively smal ler neste d r andom (i.e., da ta-dep endent) subsets of nu l l hyp othe ses , defined by the or dering o f the test statistics (common- cut-off MTPs) or unadjusted p - v alues (common-quantile MTP s). The rejection r egions a r e therefore a llow ed to dep end on the data X n via the test statis tics T n . Step wise pro cedures are of tw o main types, dep ending on the order in which the nu ll h ypotheses are tested. In s tep-down pro cedures, the mo st signific ant null hypotheses (i.e., the null hyp o theses with the la rgest test s tatistics for common- cut-off MTPs o r sma lle s t unadjusted p -v alues for co mmon-quantile MTPs) ar e considered successively , with further tests dep ending on the outco me of earlier ones. As so on a s one fails to reject a null hypo thesis, no further hypo theses ar e rejected. In con trast, for step-u p pro cedures, the le ast signific ant n ull hypotheses are consider ed s uccessively , again with further tests dep ending on the outcome of e a rlier ones. As so on as one n ull hypothesis is rejected, all remaining m ore significant hypotheses ar e rejected. Step wise MTPs tend to b e more powerful than single-step MTPs . Common-cut-off vs. common-quan tile multiple tes ting pro cedures. In c ommon-cut -off multiple testing pr o cedures, the same cut-off c 0 is used for each test sta tistic (e.g., FWER- controlling single-step and step-down maxT pro ce- dures, based on maxima of tes t statistics). I n contrast, in c ommon-quantile pro- cedures, the cut-o ffs are the δ 0 -quantiles of the marg inal null distributions of the test statistics (e.g., FWER-controlling single -step and step-down minP pro ce- dures, based on minima of unadjusted p -v a lues). The la tter p - v alue-based pro cedur es place the null hypotheses o n a n “equa l fo ot- ing”, i.e., a re more bala nced than their common-cut-o ff co unterparts, and may therefore b e pr eferable. How e ver, this comes at the exp ense of increa sed compu- tational complexity . 2.4. Er r ors i n mu ltiple hyp othesis tes ting In any testing problem, tw o types of erro rs ca n b e committed. A T yp e I err or , or false p osi tive , is committed by rejecting a tr ue null hypothesis ( R n ∩ H 0 ). A T yp e II err or , or false ne gative , is committed by failing to reject a false null hypothesis ( R c n ∩ H 1 ). The s ituation can b e summar iz e d a s in T able 1 , where the num ber o f re jected nu ll hypotheses is (11) R n ≡ |R n | = M X m =1 I ( T n ( m ) ∈ C n ( m )) , the num b er of Type I erro rs o r false po sitives is (12) V n ≡ |R n ∩ H 0 | = X m ∈H 0 I ( T n ( m ) ∈ C n ( m )) , the num b er of Type I I err ors or false neg atives is (13) U n ≡ |R c n ∩ H 1 | = X m ∈H 1 I ( T n ( m ) / ∈ C n ( m )) , Multiple tests of asso ciation with biolo gic al annotation metadata 163 T able 1. T y p e I and T yp e II err ors in multiple hyp othesis testing. This table summ arizes the differen t types of decisions and err or s in multiple hypothesis testing. The nu mber of rejected n ull h ypotheses is R n = |R n | , the num ber of Type I errors or false p ositives is V n = |R n ∩ H 0 | , the n umber of Type I I error s or f alse negatives is U n = |R c n ∩ H 1 | , the num ber of true negativ es is W n = | R c n ∩ H 0 | , and the num b er of true p ositives is S n = |R n ∩ H 1 | . Cells corr esponding to errors ar e enclosed in b oxes. Null h ypo theses Non-rejected, R c n Rejected, R n T r ue, H 0 W n = |R c n ∩ H 0 | V n = |R n ∩ H 0 | h 0 Null hypotheses F al se, H 1 U n = |R c n ∩ H 1 | S n = |R n ∩ H 1 | h 1 M − R n R n M the num b er of true ne gatives is (14) W n ≡ |R c n ∩ H 0 | = X m ∈H 0 I ( T n ( m ) / ∈ C n ( m )) = M − R n − U n = h 0 − V n , and the num ber of true p ositives is (15) S n ≡ |R n ∩ H 1 | = X m ∈H 1 I ( T n ( m ) ∈ C n ( m )) = R n − V n = h 1 − U n . Note that S n , U n , V n , and W n each dep end on t he unknown da ta generating distribution P through the unknown se t of true null h ypo theses H 0 = H 0 ( P ). Therefore, the num ber s h 0 = |H 0 | a nd h 1 = |H 1 | = M − h 0 of tr ue a nd false nu ll h yp o theses ar e unknown p ar ameters (row ma rgins o f T able 1 ), the num b er of rejected hypotheses R n is an observable r andom variable (co lumn mar gins of T able 1 ), and S n , U n , V n , and W n are u nobservable r andom variables (cells of T a ble 1 ). Ideally , one would like to simultaneously minimize b oth the num ber o f Type I error s and the num ber of Type I I error s. Unfortunately , this is not feasible and one seeks a tr ade-o ff b etw een the t w o t yp e s of err ors. A standard approa ch is to sp ecify an acceptable le vel α for a suitably defined T ype I error ra te a nd der ive testing pro cedures (i.e., rejection r egions) tha t aim to minimize a Type I I error ra te (i.e., maximize p ow er) within the class o f tests with Type I error level at most α . 2.5. T yp e I err or r ate and p ow er When testing multiple hypotheses, there are many p o ssible definitions for the Type I error rate and p ower of a testing pro cedure. Accordingly , we define a T yp e I err or r ate as a parameter θ n = Θ( F V n ,R n ) o f the joint distribution F V n ,R n of the num ber s of Type I erro rs V n = |R n ∩ H 0 | and r e jected hypothes e s R n = |R n | . Likewise, we define p ower as a parameter ϑ n = Θ ( F U n ,R n ) of the joint distr ibution F U n ,R n of the num bers of Type I I er rors U n = |R c n ∩ H 1 | and r ejected hypotheses R n = |R n | . W e fo c us primarily on mappings s uch that θ n ∈ [0 , 1] and ϑ n ∈ [0 , 1]. This par ametric representation cov ers a br oad class of T ype I erro r r a tes, includ- ing gener alize d tail pr ob ability (gTP ) error r ates, (16) g T P ( q , g ) ≡ P r( g ( V n , R n ) > q ) , 164 S. Dudoit, S. Kele¸ s and M. J. van der L aan and gener alize d exp e cte d value (gEV) err or ra tes, (17) g E V ( g ) ≡ E[ g ( V n , R n )] , for arbitra ry functions g ( V n , R n ) of the num bers o f T yp e I error s V n and rejected hypotheses R n and user- supplied b ounds q . Generalized ta il pr obability and exp ected v alue err or rates include as sp ecial cases the following commo nly-used Type I err or r ates. The gener ali ze d family-wise err or r ate (g FWE R), corr esp onding to g ( v , r ) = v and q ∈ { 0 , . . . , ( h 0 − 1) } , is the probability of at leas t ( q + 1) Type I err ors, (18) g F W E R ( q ) ≡ Pr( V n > q ) = 1 − F V n ( q ) . When q = 0, the gFWER reduces to the us ua l family-wise err or r ate (FWER), controlled by the cla ssical Bonferroni pro cedure. The t ail pr ob abi lity for the pr op ortion of false p ositives (TP P FP) among the r eje cte d hyp otheses , co rresp onding to g ( v , r ) = v / r and q ∈ (0 , 1), is defined as (19) T P P F P ( q ) ≡ Pr V n R n > q = 1 − F V n /R n ( q ) , with the conv en tion that V n /R n ≡ 0 if R n = 0. The false disc ove ry r ate (FDR), cor resp onding to g ( v , r ) = v /r , is the exp ected prop ortion of false p ositives among the rejected hypothes es, (20) F D R ≡ E V n R n = Z q dF V n /R n ( q ) , again with the conv en tion tha t V n /R n ≡ 0 if R n = 0. Erro r ra tes Θ( F V n /R n ), bas e d on the pr op ortion of false p ositives (e.g., TP PFP and FDR), are espec ially appe a ling for the la rge-sca le testing problems encountered in genomics, compared to error rates Θ ( F V n ), based on the nu m b er of false p ositives (e.g., gFWER), as they do not increase exp o nentially with the n um ber M of tested hypotheses. How ev er, err or rates Θ( F V n /R n ) tend to be more difficult to control than erro r r a tes Θ( F V n ), as they ar e base d o n the joint distribution of V n and R n , rather than o nly the marginal distribution of V n . 2.6. A djuste d p -valu es As in the case of single hypothesis testing, one ca n rep or t the results of a multiple testing pro c e dur e in ter ms of the following quantities: r ejection re gions for the test statistics, co nfidence r egions for the para meters of interest, and adjusted p -v alues. Adjusted p -v alues, for the test of multiple hypotheses, are defined a s str aightfor- ward e x tensions o f unadjusted p -v a lue s , for the test o f individual hypo theses. Con- sider any mult iple testing pr o cedure R n ( α ) = R ( T n , Q 0 , α ), with rejection r egions C n ( m ; α ) = C ( m ; T n , Q 0 , α ). Then, one can define an M -vector of adjuste d p -values , e P 0 n = ( e P 0 n ( m ) : m = 1 , . . . , M ) = e P ( T n , Q 0 ) = e P ( R ( T n , Q 0 , α ) : α ∈ [0 , 1]), as e P 0 n ( m ) ≡ inf { α ∈ [0 , 1] : Reject H 0 ( m ) at nominal MTP level α } (21) = inf { α ∈ [0 , 1] : m ∈ R n ( α ) } = inf { α ∈ [0 , 1] : T n ( m ) ∈ C n ( m ; α ) } , m = 1 , . . . , M . Multiple tests of asso ciation with biolo gic al annotation metadata 165 That is, the adjusted p - v alue e P 0 n ( m ), for null hypo thes is H 0 ( m ), is the smallest nominal Type I error level (e.g., gFWER, TPPFP , or FDR) of the m ultiple h ypo th- esis testing pro cedure at which o ne would reject H 0 ( m ), given T n . As in s ing le hypothesis tests, the smaller the adjusted p -v alue e P 0 n ( m ), the stronger the evidence ag ainst the corr esp onding null hypo thesis H 0 ( m ). Thus, one rejects H 0 ( m ) for small adjusted p - v alues e P 0 n ( m ). F or instance, the adjusted p -v alues for the classical FWER- c ontrolling margina l single-step common-quant ile Bonferroni pr o cedure ar e e P 0 n ( m ) = min { M P 0 n ( m ) , 1 } . Adjusted p -v alues for FWER-controlling join t single-s tep com- mon-cut-off maxT P ro cedure 1 are given in Eq uation ( 26 ). Under the nestedness a ssumption of Equa tion ( 1 0 ), one has tw o eq uiv alen t rep- resentations for a MTP , in terms of rejection regions for the test statistics a nd in terms of adjusted p -v alues. Specifically , the set of rejected null h ypotheses at m ultiple test nominal T ype I error level α is (22) R n ( α ) = { m : T n ( m ) ∈ C n ( m ; α ) } = n m : e P 0 n ( m ) ≤ α o . Repo rting the results of a MTP in ter ms of adjusted p -v alues, as opposed to only rejection or not of the n ull hypo theses, o ffers several a dv antages, including the following. • Adjusted p -v alues can b e defined for any T yp e I err or r ate (e.g., g FWE R, TP PFP , or FDR). • They reflect the strength of the evidence aga inst each null hypothesis in ter ms of the T yp e I err or r ate for the entir e MTP . • They are fl exible summaries of a MTP , in the sense that results are supplied for al l T yp e I err or levels α , i.e., the lev el α need not b e chosen ahea d o f time. • They provide conv enien t b enchmarks to c omp ar e differ ent MTPs , whereby smaller adjusted p -v alues indicate a le s s conserv ativ e pro cedure . • Plots of sorte d adjuste d p -values allow inv estigators to exa mine sets of rejected hypotheses asso ciated with v arious T ype I erro r rates (e.g., gFWER, TPP FP , or FDR) and nominal levels α . Such plots provide too ls to decide on an appropriate combination of the num ber of rejected hypothese s a nd tolera ble false p ositive rate for a particula r exp eriment and av ailable resour ces. 2.7. T est statistics nul l distri bution As detailed in Chapter 2 of [ 14 ], a key f eature o f our prop osed mult iple testing pro cedures is the test statistics n ul l distribut ion (rather than data generating n ull distribution) used to obtain rejection regio ns for the test statistics, confidence re- gions for the parameters of in terest, a nd adjusted p -v alues . Indee d, whether testing single or multiple hypo theses, one needs the (joint) distributio n of the test statistics in order to derive a pro cedure that pr obabilistically co ntrols Type I er r ors. In prac- tice, how ev er, the true distribution Q n = Q n ( P ) of the test statistics T n is unknown and replaced b y a null distribution Q 0 . The choice of a prop er null distribution is crucial, in order to ensure that (finite sample or as y mptotic) control of the Type I error rate under the assume d nul l distribution do es indeed provide the desired control under the t rue distribution . This issue is particular ly relev an t for large- scale testing proble ms , such as those inv olving biological anno ta tion metadata, which concern high-dimensio nal mult iv aria te distributions, with complex and unknown depe ndence structures among v ariables. 166 S. Dudoit, S. Kele¸ s and M. J. van der L aan Chapter 2 of [ 14 ] provides a g e neral characterization of a prop er test statistics nu ll distribution in terms of nul l domination conditions for the join t distribution of the test statistics ( T n ( m ) : m ∈ H 0 ) for the true null h yp otheses H 0 (Section 2 .2). This g eneral characterizatio n leads to the explicit prop osa l of the following t w o main t ypes of t est statistics null distributions: a nul l shift and sc ale-tr ansforme d test statist ics nul l distribution , ba sed on user -supplied upp er b ounds for the means and v ariances of the test statistics for the true null hypo thes es (Section 2.3), and a nul l quantile-tr ansforme d test statistics nul l distribution , bas ed o n user-supplied marginal test statistics n ull distr ibutio ns (Section 2.4). In pr actice, the test statistics n ull distribution Q 0 = Q 0 ( P ) is unknown, a s it depe nds on the unkno wn data genera ting dis tribution P . Resampling pro cedur es based on the b o otstr ap a r e provided to conv enien tly obtain consisten t estimato r s of the null distribution a nd of the co r resp onding test statis tic cut-o ffs, para meter confidence reg ions, a nd a djusted p -v a lues [ 14 , Sectio ns 2.3.2 , 2.4.2 , 4 .4, 5]. As arg ued in [ 14 , Cha pter 2], the following tw o main p oints distinguish our approach from existing approa ches to Type I e r ror co nt rol a nd the c hoice of a test statistics null distribution (e.g., [ 24 ] and [ 45 ]). Firstly , we are only concerned with c ontro l of the T yp e I err or r ate u nder the true data gener ating distribution P , i.e., under the joint distr ibution Q n = Q n ( P ), implied by P , for the test s tatistics T n . The concepts of w eak and strong control of a Type I error rate and the related restrictive as sumption o f subse t piv otalit y are therefore irrelev ant in our con text [ 45 , p. 9– 10, 42– 43]. Secondly , we prop ose a nul l distribution for t he test statistics ( T n ∼ Q 0 ) rather than a data generating null distribution ( X ∼ P 0 ∈ ∩ M m =1 M ( m )). The latter practice do es not necessarily provide pro pe r Type I error control under the true distribution P . Indeed, the test statistics assumed n ull distribution Q n ( P 0 ) and their true distribution Q n ( P ) ma y hav e different depe ndence structures for the true nu ll hypo theses H 0 and, as a result, may violate the r equired null domina tion conditions for Typ e I error co nt rol. W e stress the generality of our pro po sed test statistics null distr ibutio ns: Type I error co nt rol do e s not rely o n restrictive assumptions suc h as subset piv otalit y and holds for general data genera ting distributions (with a r bitrary dep endence structures a mong v ariables), null hypotheses (defined in terms of submo dels for the data generating distribution), and test statistics (e.g ., t -statistics, χ 2 -statistics, F -statistics ). 2.7.1. Nul l shift and sc ale-tr ansforme d test st atistics nu l l distribution The fir st o riginal null distributio n of [ 16 , 3 3 , 41 ], is defined as the asymptotic distribution Q 0 = Q 0 ( P ) of the M -vector Z n of nul l shift and sc ale-tr ansforme d test statistics , (23) Z n ( m ) ≡ s min 1 , τ 0 ( m ) V ar[ T n ( m )] ( T n ( m ) − E[ T n ( m )]) + λ 0 ( m ) , where λ 0 ( m ) and τ 0 ( m ) are, resp ectively , user-s upplied upp er b o unds fo r the means and v a riances of the H 0 -sp ecific test statistics. In this construction, the null shift v a lues λ 0 ( m ) ar e c hosen so that the H 0 -sp ecific statistics ( Z n ( m ) : m ∈ H 0 ) are asymptotically sto chastically greater than the original test statistics ( T n ( m ) : m ∈ H 0 ). The resulting n ull distribution therefore satisfies the req uired null domination conditions for T ype I error control. Multiple tests of asso ciation with biolo gic al annotation metadata 167 In contrast, the null sca le v alues τ 0 ( m ) ar e no t needed for Type I error control. The purp ose of τ 0 ( m ) is to av oid a degenera te null distr ibutio n and infinite cut-o ffs for the false null h ypo thes es ( m ∈ H 1 ), an imp or tant prop erty for p ow er consider a- tions. This sc a ling is needed, in particular, for F -statistics that hav e asymptotica lly infinite means a nd v ariances for no n-lo cal alterna tive h ypothese s . F or a br o ad class of testing problems , such as the test o f single- parameter nu ll hypo theses using t -statistics (Eq uation ( 7 )), the null distribution Q 0 is an M -v ariate Gauss ia n distribution, with mean vector zero and c ov ar iance matr ix σ ∗ = Σ ∗ ( P ), that is, Q 0 = N (0 , σ ∗ ). F o r tests where the pa rameter of in ter est is the M - dimensional mea n vector Ψ ( P ) = ψ = E[ X ], the estimator ψ n is simply the M -vector of empirical means and σ ∗ = Σ ∗ ( P ) = Cor[ X ] is the corr elation matrix of X ∼ P , that is, Q 0 = N(0 , Cor[ X ]). More genera lly , for a n a symptotically linear estimator ψ n , Σ ∗ ( P ) is the cor relation matrix of the v ector influence cur ve. This situation covers standar d one-sample and tw o-sample t -statistics for tests of means, but also test statistics for corre lation co efficients and regr ession co efficients in linear and non-linea r mo dels. F or testing the equality of K p o pula tion mean v ectors using F -statistics , an F -statistic- sp ecific null distribution may b e defined as the joint distribution of an M -vector o f qua dratic forms of Ga ussian r andom v ar iables. 2.7.2. Nul l quantile-tr ansforme d test statistics nu l l distribution The second a nd mos t re c e n t prop os al of [ 42 ] is defined a s the asymptotic distribution Q 0 = Q 0 ( P ) of the M -vector ˘ Z n of nul l qu antile-tr ansfo rme d test statistics , (24) ˘ Z n ( m ) ≡ q − 1 0 ,m Q ∆ n,m ( T n ( m )) , where q 0 ,m are user-s upplied margina l tes t statistics null distributions that satisfy marginal null domination conditio ns . According to the gener alize d quantile-quantile function t r ansformation of [ 46 ], define Q ∆ n,m ( z ) ≡ ∆ Q n,m ( z ) + (1 − ∆) Q n,m ( z − ), where Q n,m are the marginal distributions of the test statistics T n ( m ) and the random v ariable ∆ is uniformly distributed on the interv al [0 , 1], indep endently of the data X n . This latest prop os al has the additional adv a nt age tha t the marg ina l test s tatistics nu ll distr ibutions may b e set to the o ptimal (i.e., most p ow erful) null distributions one would use in single hypothesis tes ting (e.g., p ermutation marginal null dis tri- butions, Gaussia n o r other pa rametric mar g inal null distributions). 2.8. Overview of multi ple tes ting pr o c e dur es Having identified a s uita ble test sta tistics null distribution Q 0 (or estimato r thereo f, Q 0 n ), there remains the main task of sp ecifying rejectio n r e gions (i.e., cut-o ffs) for the test statistics, confidence regio ns for the par ameters of interest, and adjusted p -v alue s . As detailed in [ 14 , C ha pters 3–7], we hav e developed resampling- based single-s tep and stepwise multiple testing pro c e dures for controlling a broa d class of Type I er- ror rates, defined as generalized tail probabilities, g T P ( q , g ) = Pr( g ( V n , R n ) > q ), and generalized expected v a lues, g E V ( g ) = E[ g ( V n , R n )], for arbitrary f unctions g ( V n , R n ) of the n um ber s of false pos itives V n and rejected hypotheses R n . Our prop osed pro c e dur es take into account the joint distribution of the test statistics 168 S. Dudoit, S. Kele¸ s and M. J. van der L aan and provide Type I err or control in testing problems involving gener al data g en- erating dis tributions (with arbitra ry dep endence structures amo ng v ariables), null hypotheses (defined in ter ms of s ubmo dels for the data generating distribution), and test sta tis tics (e.g ., t -statistics, χ 2 -statistics, F - statistics). An ov erview of av ailable MTPs is provided in Chapter 3 of [ 14 ]. Core metho d- ologica l Chapters 4 – 7 discuss the following ma in appr oaches for deriving rejection regions. Joint single-step c ommon-cut-off and c ommon-quantile p r o c e dur es for con trolling gener al T yp e I err or r ates Θ ( F V n ), defined as a rbitrary pa rameters of the dis- tribution of the num b er of Type I er rors V n (Chapter 4 in [ 14 ], [ 16 , 33 ]). Er- ror ra tes o f the for m Θ( F V n ) include the gener alized family-wise error rate, g F W E R ( q ) = 1 − F V n ( q ) = Pr( V n > q ), i.e., the c hance of at least ( q + 1) Type I erro rs. Joint step-down c ommon-cut-off (maxT) and c ommon-quantile (minP) pr o c e dur es for co nt rolling the fami ly-wise err or r ate , F W E R = g F W E R (0) = 1 − F V n (0) = Pr( V n > 0) (Chapter 5 in [ 14 ], [ 41 ]). (Marginal/ jo int single-s tep/stepwise c ommon-cut-off/co mmon-quantile) augmenta- tion multiple testing pr o c e dur es (AMTP) for controlling gener ali ze d t ail pr ob abil- ity error rates, based on an initial gFWER-con trolling procedur e (Chapter 6 in [ 14 ], [ 15 , 40 ]). Joint r esampling-b ase d empiric al Bayes pr o c e dur es for controlling gener alize d tail pr ob abi lity error ra tes (Chapter 7 in [ 14 ], [ 39 ]). The ab ov e multiple testing pro cedur e s are implemented in the Bio conductor R pack age multte s t ([ 14 , Section 1 3 .1]; [ 3 2 ]; www.bi ocond uctor.org ). 2.9. FWER-c ontr ol l i ng si ngle-step c ommon-cut-off maxT pr o c e du r e This s ection fo cusses o n control of the family - wise err or rate, using the single- step maxT pro cedure, a common-cut-off pr o cedure exploiting the joint distribution of the test statistics. The method is summarized below; details a re giv en in [ 14 , Chapter 4] a nd [ 16 ]. Pro cedure 1 [ FWER-controlling single-s tep common-cut-off maxT pro cedure]. Given an M -variate test statistics nul l distribution Q 0 , the single-step c ommon- cut-off maxT pr o c e dur e is b ase d on the distribution of the maximum test statistic, max m Z ( m ) , for the M -ve ct or Z = ( Z ( m ) : m = 1 , . . . , M ) ∼ Q 0 . F or c ontr ol ling the FWER at nominal level α ∈ (0 , 1) , t he c ommon cut-off c ( Q 0 , α ) is define d as the (1 − α ) -quantile of the distribution of max m Z ( m ) , that is, (25) c ( Q 0 , α ) ≡ inf z ∈ R : P r Q 0 max m =1 ,...,M Z ( m ) ≤ z ≥ (1 − α ) . The adjuste d p - value e p 0 n ( m ) for nul l hyp othesis H 0 ( m ) is the pr ob ability, u nder Q 0 , that max m Z ( m ) exc e e ds the c orr esp onding observe d test st atistic t n ( m ) , that is, (26) e p 0 n ( m ) = P r Q 0 max m =1 ,...,M Z ( m ) ≥ t n ( m ) , m = 1 , . . . , M . Multiple tests of asso ciation with biolo gic al annotation metadata 169 Pro cedure 1 provides pr op er FWER control when based on either of the tw o null- transformed test statistics null distributions Q 0 int ro duced in Section 2.7 . Co ns is- ten t estimator s Q 0 n of the null distribution Q 0 and corre s po nding single- step maxT cut-offs and adjusted p -v alues may b e obtained using the bo otstrap, as in P r o cedure 2.9 , b elow, for the null shift and scale-tra nsformed test statistics null distr ibution [ 14 , Section 4 .4 ]. Pro cedure 2 [FWER-con trolling b o otstrap-based single-s tep common-cut-off maxT pro cedure]. 1. Le t P ⋆ n denote a b o otstr ap estimator of t he data gener ating distribution P . F or the non-p ar ametric b o otstr ap, P ⋆ n is simply the empiric al distribut ion P n , that is, sample s of size n ar e dr awn at r andom, with r eplac ement fr om the observe d data X n = { X i : i = 1 , . . . , n } . F or the mo del-b ase d b o otstr ap, P ⋆ n b elongs to a mo del M for the data gener ating distribution P , such as a family of mu ltivariate Gaussian distributions. 2. Gener ate B b o otstr ap samples, X b n ≡ { X b i : i = 1 , . . . , n } , b = 1 , . . . , B . F or the b th sample, the X b i , i = 1 , . . . , n , ar e IID ac c or ding t o P ⋆ n . 3. F or e ach b o otstr ap sample X b n , c ompute an M -ve ctor of test statistics, T B n ( · , b ) = ( T B n ( m, b ) : m = 1 , . . . , M ) , that c an b e arr ange d in an M × B ma- trix, T B n = T B n ( m, b ) : m = 1 , . . . , M ; b = 1 , . . . , B , with r ows c orr esp onding to the M nu l l hyp otheses and c olumns to the B b o otstra p samples. 4. Compute r ow m e ans and varianc es of the matrix T B n , to yield estimators of the me ans, E[ T n ( m )] , and varianc es, V ar[ T n ( m )] , of the test statistics under the data gener ating distribution P . That is, c ompute E[ T B n ( m, · )] ≡ 1 B B X b =1 T B n ( m, b ) , (27) V ar[ T B n ( m, · )] ≡ 1 B B X b =1 ( T B n ( m, b ) − E[ T B n ( m, · )]) 2 . 5. O btain an M × B matrix, Z B n = Z B n ( m, b ) : m = 1 , . . . , M ; b = 1 , . . . , B , of n u l l shift and sc ale-tra nsforme d b o otstr ap test statistics Z B n ( m, b ) , by r ow- shifting and sc aling the matrix T B n using the b o otstr ap estimators of E[ T n ( m )] and V ar[ T n ( m )] and t he user-supplie d nu l l values λ 0 ( m ) and τ 0 ( m ) . That is, define (28) Z B n ( m, b ) ≡ s min 1 , τ 0 ( m ) V ar[ T B n ( m, · )] T B n ( m, b ) − E[ T B n ( m, · )] + λ 0 ( m ) . F or t -statistics as in Equation ( 7 ) , t he nul l values ar e λ 0 ( m ) = 0 and τ 0 ( m ) = 1 . 6. The b o otstr ap est imator Q 0 n of the nul l shift and sc ale -tr ansforme d nul l dis- tribution Q 0 is the empiric al distribution of the B c olumns { Z B n ( · , b ) : b = 1 , . . . , B } of matrix Z B n . 7. F or e ach c olumn b o f the matrix Z B n (i.e., b o otstr ap sample b ), c ompute the maximum statistic, ma x m Z B n ( m, b ) , b = 1 , . . . , B . 170 S. Dudoit, S. Kele¸ s and M. J. van der L aan 8. F or c ontr ol ling the FWER a t nominal level α ∈ (0 , 1) , t he b o otstr ap single- step maxT c ommon cut-off c ( Q 0 n , α ) is the (1 − α ) -quant ile of t he empiric al distribution of the B maxima { max m Z B n ( m, b ) : b = 1 , . . . , B } , t hat is, (29) c ( Q 0 n , α ) ≡ inf ( z ∈ R : 1 B B X b =1 I max m =1 ,...,M Z B n ( m, b ) ≤ z ≥ (1 − α ) ) . 9. The b o otstr ap single-step maxT adj uste d p -value e p 0 n ( m ) for nu l l hyp othesis H 0 ( m ) is the pr op ortion of maxima { max m Z B n ( m, b ) : b = 1 , . . . , B } that exc e e d the c orr esp onding observe d test statistic t n ( m ) , t hat is, (30) e p 0 n ( m ) = 1 B B X b =1 I max m =1 ,...,M Z B n ( m, b ) ≥ t n ( m ) , m = 1 , . . . , M . 3. S tatis tical framework for multiple tests of ass o ciation wi th biolo gical annotation m etadata Sections 3.1 – 3.3 introduce the main comp one nts of our appr oach to m ultiple tests of asso ciation w ith biological annotation metadata , na mely , the gene-annotation profiles A , the ge ne - parameter pr ofiles λ , and the asso cia tion measur es ψ = ρ ( A, λ ) betw een g ene-annotation and gene-pa rameter profiles. W e stress that the choice of a suitable asso ciation parameter ψ is perha ps the mo st imp ortant and hardest asp ect of the inference problem, as this parameter r epresents the statistical translation of the bio logical ques tion of interest. Once the a sso ciation pa rameter ψ is appropr iately and precisely defined, o ne can rely on a v ariet y of statistical methods to estima te and test h yp o theses co nce rning this parameter . Section 3.4 desc r ib es how the multiple testing metho dology of [ 14 ] a nd rela ted articles may b e used to detect asso cia tio ns betw een gene-a nnotation a nd g ene-parameter profiles. Note that, for the sake of illus tration, we fo cus on ge ne-level features. How ev er, as mentioned in Section 1.1 , the metho dolog y is generic and may be applied to other types of features , such as those conc e rning g e ne is o forms and proteins. 3.1. Gene-annotation pr ofiles Gene-annotation pro files refer to feature s o f a genome that are assumed to be known and co nstant amo ng units in a p o pula tion of int erest. Suc h feature s typically consist of gene annotation metadata, that reflect current knowledge on gene prop erties, such as, nucleotide a nd pr otein sequences , regula tion, a nd function. Spec ific a lly , let A = ( A ( g, m ) : g = 1 , . . . , G ; m = 1 , . . . , M ) denote a G × M gene-annotation matr ix , providing data o n M features for G genes in an or ganism of int erest. Thus, row A ( g , · ) = ( A ( g , m ) : m = 1 , . . . , M ) denotes an M -dimensional gene-sp ecific feature vector for the g th g ene, g = 1 , . . . , G , and column A ( · , m ) = ( A ( g , m ) : g = 1 , . . . , G ) denotes a G - dimens io nal gene-annotation pr ofile for the m th feature, m = 1 , . . . , M . In many a pplications, the e le men t A ( g , m ) is a binary indica tor, co ding the YES/NO answer to the m th question, among a collection of M questions one may Multiple tests of asso ciation with biolo gic al annotation metadata 171 ask ab out g ene g . F or exa mple, A ( g , m ) could indicate whether gene g is anno- tated with a par ticular GO term m , among M terms in one of the three ontologies (BP , CC, or MF), i.e., whether gene g is an elemen t of the no de co rresp onding to the m th term in the GO directed acyclic graph (D A G). O ther gene-annotation profiles of interest may refer to exon/intron coun ts/lengths/nucleotide distr ibu- tions, gene pathw a y membership (e.g., from the Kyoto E ncyclop edia o f Genes a nd Genomes, KEGG, www.ge nome. ad.jp/kegg ), or gene reg ula tion by particular tran- scription factor s . Reg arding transcriptio n regula tion, one could use data fro m the T r a nscription F actor DataBas e (TRANSF A C, www.ge ne-re gulation.com ) to gen- erate gene-a nnotation pr ofiles a s follows. F or a g iven transcriptio n factor binding motif, a binary gene-anno tation profile could c o nsist of indica tors for the presence or absence of the motif in the upstream co ntrol r egion o f each gene. A co n tin uous gene-annota tio n pro file could b e based on the po sition weigh t matrix of the binding motif. Note that the afor ement ioned features are only fixe d in t ime for a g iven v e r- sion/relea se of the corr esp onding da tabase(s), i.e., such biologica l data are con- stantly ev olving as o ur knowledge of the roles of genes and pro teins is acc umulating and changing. The dynamic nature of biologica l annotation meta data is an imp o r- tant issue in ter ms o f softw are design (Section 4.2 ; [ 18 ]). Note a lso tha t g e ne-annotation pro files ar e not res tricted to b e binary o r even po lychotomous and, in particular , could b e contin uo us ge ne - parameter profiles, s uit- ably estimated from pre v ious studies. The main p oint, regarding the formulation o f the s tatistical inference q uestion, is that ge ne - annotation profiles are known and c onstant among p opulatio n units . 3.2. Gene-p ar ameter pr ofil es Gene-parameter pr ofiles a re generally unknown a nd concer n the dis tribution of v aria ble features of a g enome in a w ell-defined p o pula tion. Gene- sp ecific v a riables of int erest reflect cellular type/state/a ctivity under par ticular c o nditions and include microarr ay measure s of transcr ipt levels and compara tive g enomic hybridization (CGH) measur e s of DNA co p y n um ber s. Spec ific a lly , let X = ( X ( j ) : j = 1 , . . . , J ) be a J -dimensio nal random vector, containing G gene-sp e cific r andom varia bles ( X ( g ) : g = 1 , . . . , G ). In addition to the G gene-sp ecific v a r iables, X may include v ar ious biological and clinica l co- v aria tes (e.g., a ge, sex, tr eatment, timep oint) and o utcomes (e.g., sur viv al time, re- sp onse to treatment, tumor class). Let P denote the data g enerating distribution for the random J -vector X and supp ose that P b elongs to a (po ssibly non-parametric ) mo del M . Let the par ameter mapping Λ : M → R G define a G - dimensional gene-p ar ameter pr ofile , Λ( P ) = λ = ( λ ( g ) : g = 1 , . . . , G ) ∈ R G , wher e each λ ( g ) = Λ( P )( g ) ∈ R is a gene-sp ecific rea l- v alued parameter. F o r ex ample, λ ( g ) could b e the mea n expression measure E[ X ( g )] of g ene g or a r egress ion co efficient relating an outco me co mpo nent of X to the expr ession mea sure X ( g ) of g e ne g , g = 1 , . . . , G . While gene-a nno tation profiles are known and fixed, gene-par ameter pr ofiles are t ypically unknown and need to b e estimate d , e.g., from a microar ray exp eriment inv o lving a sample of population units. The sample X n = { X i : i = 1 , . . . , n } is assumed to consist of n indep endent a nd identically distributed (I ID) co pies of X ∼ P , corresp onding to n ra ndomly sa mpled p opula tion units. 172 S. Dudoit, S. Kele¸ s and M. J. van der L aan 3.3. Asso ci ati on me asur es for gene-annotation and gene-p ar ameter pr ofiles Let the par ameter ma pping Ψ : M → R M sp ecify an M -dimensional asso ciation p ar ameter ve ctor , (31) Ψ( P ) = ψ = ( ψ ( m ) : m = 1 , . . . , M ) ≡ ρ ( A, Λ( P )) , defined in terms of a n asso ciation me asur e ρ : R G × M × R G → R M , known fixe d gene-annotation pr ofiles A , and an unknown gene-p ar ameter pr ofile λ = Λ( P ). The choice of a suitable as so ciation parameter is sub ject matter-dep endent and requires ca r eful consider ation. F o r instance, for Gene Ontology annotation, it is desirable th at the asso ciation parameter reflect the structure o f the GO dir e c ted acyclic gra ph (Section 4.1 ). In principle, the dimension of the asso cia tion para m- eter vector ψ could differ from the num ber M of features under cons ide r ation. In addition, one could acc ommo date several gene-pa rameter pro files λ . The v arious qua nt ities in the inference problem are summarized in Figure 1 ; examples of as so ciation parameters are given next a nd in Section 5 . 3.3.1. Univariate asso cia tion me asur es In the simplest cas e, one co uld define the M asso cia tion parameter s univ aria tely , i.e., define ψ ( m ) based only o n the m th gene- annotation profile A ( · , m ), m = 1 , . . . , M . Fig 1 . Par ameters for tests of asso ciation with biolo gica l annotation metadata. This figure rep- resen ts the main i ngredien ts i nv olved in multiple tests of association with biological annotat ion metadata: the gene-annotation pr ofiles, the gene-parameter profile, and the ass ociation parame- ters. (Color v ersion on website companion.) Multiple tests of asso ciation with biolo gic al annotation metadata 173 Spec ific a lly , for the m th feature, let (32) Ψ( P )( m ) = ψ ( m ) ≡ ρ m ( A ( · , m ) , Λ( P )) , where ρ m : R G × R G → R provides a measure of ass o ciation (e.g., correla tion co efficient) b etw een the G -dimensional gene-annotation pro file A ( · , m ) and ge ne- parameter pro file λ = Λ( P ). In many situations, the same as s o ciation mea sure ρ m may b e used for each of the M features. Con tin uous gene -annotation profil es and con tin uous g e ne-parameter pro- files F or contin uo us gene- annotation and gene-parameter pro files, one may us e a s asso ciatio n measure the Pearso n c orr elation c o efficient b etw een tw o G -vectors. That is, (33) ψ ( m ) = P G g =1 ( A ( g , m ) − ¯ A ( m ))( λ ( g ) − ¯ λ ) q P G g =1 ( A ( g , m ) − ¯ A ( m )) 2 q P G g =1 ( λ ( g ) − ¯ λ ) 2 , where ¯ A ( m ) ≡ P g A ( g , m ) /G and ¯ λ ≡ P g λ ( g ) /G denote, resp ectively , the av er- ages of the G elements of the ge ne-annotation profile A ( · , m ) and ge ne- parameter profile λ . Binary gene-annotation profiles and binary gene-parameter profiles F o r binary gene-a nnotation a nd gene-pa rameter profiles, one may build 2 × 2 co nt in- gency T able 2 and use as asso ciation measure the χ 2 -statistic (or corresp onding p -v alue ) for the test of indep endence of rows and c o lumns. That is, (34) ψ ( m ) = G ( g 00 ( m ) g 11 ( m ) − g 01 ( m ) g 10 ( m )) 2 g 0 · ( m ) g · 0 ( m ) g · 1 ( m ) g 1 · ( m ) , where g kk ′ ( m ) ≡ P g I ( A ( g , m ) = k ) I ( λ ( g ) = k ′ ), g k · ( m ) ≡ g k 0 ( m ) + g k 1 ( m ) = P g I ( A ( g , m ) = k ), and g · k ′ ( m ) ≡ g 0 k ′ ( m ) + g 1 k ′ ( m ) = P g I ( λ ( g ) = k ′ ), k , k ′ ∈ { 0 , 1 } . Note that in this context the χ 2 -statistic ψ ( m ) is a p ar ameter , i.e., it is a function o f the data generating distribution P , via the gene-par a meter profile λ = Λ ( P ), and is ther efore unknown and c onstant among p opulation units. T able 2 . Binary gene-annotation and gene-p ar ameter pr ofiles. Giv en a binary gene-annota tion profile A ( · , m ) and a binary gene-parameter profile λ , one m a y build a 2 × 2 contingenc y table, with r o ws corresp onding to the gene-annotation profile and columns to the gene-paramete r profile. Cell count s are defined as g kk ′ ( m ) = P g I ( A ( g , m ) = k ) I ( λ ( g ) = k ′ ), k , k ′ ∈ { 0 , 1 } . F or example, for tests of asso ciation betw een GO annotation and differential gene expression, g 11 ( m ) could correspond to the num ber of genes that are annotated with GO term m and differen tially expressed. Gene-annotation profile, A ( · , m ) Gene-parameter pro file, λ 1 0 1 g 11 ( m ) = g 10 ( m ) = A 1 ( m ) = P G g = 1 A ( g , m ) λ ( g ) P G g = 1 A ( g , m )(1 − λ ( g )) P G g = 1 A ( g , m ) 0 g 01 ( m ) = g 00 ( m ) = A 0 ( m ) = P G g = 1 (1 − A ( g , m )) λ ( g ) P G g = 1 (1 − A ( g , m ))(1 − λ ( g )) P G g = 1 (1 − A ( g , m )) G ¯ λ = P G g = 1 λ ( g ) G (1 − ¯ λ ) = P G g = 1 (1 − λ ( g )) G 174 S. Dudoit, S. Kele¸ s and M. J. van der L aan Binary gene-annotation profiles F or binar y g ene-annotatio n profiles, one may consider ass o ciation parameter vectors of the form (35) ψ = A ⊤ λ. That is, the ass o ciation pa rameter for the m th fea ture is the sum , ψ ( m ) = G X g =1 A ( g , m ) λ ( g ) = G X g =1 I ( A ( g , m ) = 1 ) λ ( g ) , of the parameters λ ( g ) for genes g that hav e the prop erty of interest, i.e., such that A ( g , m ) = 1. Such an as s o ciation pa rameter is consider ed by [ 37 ], to re late contin- uous microar ray differential expr ession gene-par a meter pro files to binar y pathw ay gene-annota tio n profiles . The fo llowing sta nda rdized a sso ciation par ameters, co r resp onding to asso ciation measures base d on two-sample t - statistics , may also b e co nsidered, (36) ψ ( m ) = ¯ λ 1 ( m ) − ¯ λ 0 ( m ) q v [ λ ] 1 ( m ) A 1 ( m ) + v [ λ ] 0 ( m ) A 0 ( m ) , where, for the m th feature, A k ( m ) ≡ P g I ( A ( g , m ) = k ), ¯ λ k ( m ) ≡ X g I ( A ( g , m ) = k ) λ ( g ) / A k ( m ) , and v [ λ ] k ( m ) ≡ P g I ( A ( g , m ) = k ) ( λ ( g ) − ¯ λ k ( m )) 2 / ( A k ( m ) − 1) denote, res pec - tively , the num b er s, a verages, and v ar iances of annotated ( k = 1) and unanno tated ( k = 0 ) gene-par ameters λ ( g ). In commonly-encountered combined GO annotation and microarr ay data analy - ses, a binary gene- parameter profile could indicate whether g enes a r e differentially expressed in t w o p o pulations o f cells, a contin uo us gene-para meter profile could consist of co efficien ts for the regression o f a (censored) clinical outcome on gene ex- pression measures, and binary gene- a nnotation profiles could denote whether genes are annotated with pa rticular GO terms (Section 5 ; [ 1 , 2 , 4 , 22 ]). 3.3.2. Multivariate asso ciatio n me asur es More g enerally , the m th a sso ciation par ameter co uld b e based o n the entire gene- annotation matrix A or a subset o f columns thereof, that is, Ψ( P )( m ) = ψ ( m ) ≡ ρ m ( A, Λ( P )), for a n a sso ciation measure ρ m : R G × M × R G → R . Asso ciation parameters o f in terest include: linea r com binations of ass o ciation parameters for several features, partial co rrelatio n co efficients, χ 2 -statistics for higher-dimensiona l contingency tables (e.g ., with one dimension corr e sp onding to a gene-para meter profile λ and other dimensio ns to several g ene-annotatio n profiles A ( · , m )), and (contrasts o f ) regres sion co efficients of a gene- parameter pr ofile λ on several gene-a nnotation pro files A ( · , m ). In the case of Gene On tology a nno tation, the asso ciatio n pa rameter ψ should preferably reflect the structure of the GO directed acyclic graph, b y taking into account, for instance, annotation informatio n for ancestor (i.e., le s s sp ecific) o r offspring (i.e., more sp ecific) ter ms (Section 4.1 ). Sp ecifically , let P ( m ) deno te the Multiple tests of asso ciation with biolo gic al annotation metadata 175 set of (immediate) parents of a ter m m . As the genes anno tated by the child term m a re subs e ts of the genes annotated by the parent ter ms P ( m ), then A ( g , m ) = 1 implies A ( g , p ) = 1 for p ∈ P ( m ). F ollowing the causa l inference litera ture [ 38 , 43 ], an asso ciation par ameter of int erest for GO ter m m is the mar ginal c ausal effe ct p ar ameter , defined as (37) ψ ( m ) = E[E[ λ | A ( · , m ) = 1 , A ( · , P ( m ))]] − E[E[ λ | A ( · , m ) = 0 , A ( · , P ( m ))]] , where A ( · , P ( m )) denotes the s ubmatrix o f g ene-annotation pr ofiles for par ent terms P ( m ) a nd the expected v alues are defined with resp ect to the empirical dis tr ibution of { ( A ( g , m ) , A ( g , P ( m )) , λ ( g )) : g = 1 , . . . , G } . In the sp ecial case of binary (differential e x pression) gene-parameter profiles, the so-called parent-c hild metho d of [ 22 ] takes into accoun t t he structure of the GO D A G by testing for asso cia tions b etw een ge ne- annotation and gene-parameter profiles using hyper geometric p -v alues computed conditionally on the annotation status of parent terms . One could also consider Bo olean combinations of annotation indicators for mul- tiple features, that is, a trans fo rmed gene-annotation matrix whose columns are Bo olean combinations of the columns of the or iginal gene-a nnotation matrix. Such an approach would b e par ticularly relev a nt in the context of tr anscription regu- lation, wher e individual features corres po nd to single tra nscription factor binding motifs and Bo olea n co mb inations to binding mo dules for multiple transc ription factors. 3.4. Mu l tiple hy p othesis testing 3.4.1. Nul l and alternative hyp otheses Certain biolo gical annotatio n metadata analyses may inv olv e the two-side d t est of the M null hypothese s of no asso cia tion b etw een g e ne-annotation pro files A ( · , m ), m = 1 , . . . , M , and a g ene-para meter profile λ , i.e., the test of (38) H 0 ( m ) = I ( ψ ( m ) = ψ 0 ( m )) vs. H 1 ( m ) = I ( ψ ( m ) 6 = ψ 0 ( m )) . Other analyses may call for the one-side d test of (39) H 0 ( m ) = I ( ψ ( m ) ≤ ψ 0 ( m )) vs. H 1 ( m ) = I ( ψ ( m ) > ψ 0 ( m )) . One-sided tests a re appropriate if, for exa mple, o ne is interested in determining whether differentially ex pr essed g enes are enriched r e garding GO annotation. The M -vector ψ 0 = ( ψ 0 ( m ) : m = 1 , . . . , M ), of nul l values for the as so ciation parameter ψ , is determined b y the biologica l question. F or example, if ψ ( m ) = ρ m ( A ( · , m ) , λ ) is the P earson corre lation co efficient betw een the gene-annota tion profile A ( · , m ) and the g e ne-parameter pr ofile λ , then one ma y s et ψ 0 ( m ) = 0. Note tha t in man y situations, the same ass o ciation measur e ρ m is used fo r each of the M feature s a nd one only has a sing le, c o mmon nu ll v a lue ψ 0 ( m ). 3.4.2. T est statistics As in Section 2.2 , a b ove, and Chapter 1 o f [ 14 ], c onsider the general situation where, given a random sample X n from the data generating distribution P , one has 176 S. Dudoit, S. Kele¸ s and M. J. van der L aan an asymptotic al ly line ar e s timator ψ n = ˆ Ψ( P n ) of the asso ciation parameter v ector ψ = Ψ( P ), with M -dimens io nal vector influenc e curve I C ( X | P ). Let ˆ Σ( P n ) = σ n = ( σ n ( m, m ′ ) : m, m ′ = 1 , . . . , M ) deno te a c onsistent estimator of the cov ariance matrix Σ( P ) = σ = ( σ ( m, m ′ ) : m, m ′ = 1 , . . . , M ) of the vector influence curv e I C ( X | P ). F o r exa mple, σ n could b e a b o otstra p-based estimator of the cov aria nce matrix σ or could b e c o mputed fro m an estimator I C n ( X ) of the influence curve I C ( X | P ). A broad ra nge of ass o ciation para meters ψ a nd co rresp onding estimators ψ n satisfy the ab ov e conditio ns . In par ticula r, supp ose λ n = ˆ Λ( P n ) is an asymptotically linear estimator of the gene-para meter profile λ = Λ( P ), based on a rando m s a mple X n from P . Le t ψ n ≡ ρ ( A, λ n ) denote the co rresp onding r esubstitution , or plug-in , estimator of the a s so ciation par ameter vector ψ = ρ ( A, λ ). Then, if th e function ρ ( A, λ ) is differentiable with res pe ct to λ , t he resubstitution estimato r ψ n is also asymptotically linear . One can therefor e handle tes ts where the gene-para meter pro files λ are (functions of ) means, v ar iances, correla tion co efficients, a nd regress io n co efficients, a nd where the as so ciation measures ρ are co rrelatio n co efficients, t w o-sample t -statistics, and χ 2 -statistics. Exa mples a re provided in Section 5 , in the context of tests of as so ci- ation b etw een different ial gene expressio n in ALL and GO annotation. Each n ull hypothesis H 0 ( m ) may then b e t ested using a (unstandardized) dif- fer enc e st atistic , (40) T n ( m ) = √ n ( ψ n ( m ) − ψ 0 ( m )) , or a (standardize d) t -st atistic , (41) T n ( m ) = √ n ψ n ( m ) − ψ 0 ( m ) σ n ( m ) , where we ado pt the shorter no tation σ 2 n ( m ) = σ n ( m, m ) for v ar iances. Certain tes ting pro blems may call for o ther test statistics T n , s uch a s , F -statistics, χ 2 -statistics, and likelihoo d ra tio statistics. Let Q n = Q n ( P ) denote the typically unknown (finite s ample) join t dis tribution of the M - vector of test statistics T n = ( T n ( m ) : m = 1 , . . . , M ), under the data generating distribution P . 3.4.3. Multiple testing pr o c e dur es As men tioned in Section 2.7 , ab ov e, a nd detailed in [ 14 , Chapter 2], a key feature of o ur pro p o sed multip le testing pro cedures is the test statistics n ul l distribution Q 0 used in place o f the unknown true test statistics distribution Q n = Q n ( P ), for the purp o se of obtaining r ejection reg ions for the test statistics, co nfidence r egions for the para meters of in terest, and adjusted p -v alues. Given a suitable test statistics null distribution Q 0 (or estimato r thereo f, Q 0 n ), the multiple testing pro c edures developed in [ 14 ] and related a rticles may be ap- plied to co n trol a broad cla ss of Type I er ror rates, defined as gener alized tail probabilities, g T P ( q , g ) = Pr( g ( V n , R n ) > q ), and generalize d exp ected v alues, g E V ( g ) = E[ g ( V n , R n )], for ar bitr ary functions g ( V n , R n ) of the num bers of fals e po sitives V n and rejected hypotheses R n (Section 2.8 ). F or the purp ose of illustration, we fo c us, as in Section 2.9 , on co nt rol of the family-wise error r ate, using the sing le-step common- cut-off ma xT pro cedur e, ba sed on a non-para metric b o otstrap estimator of the null shift and scale-tr a nsformed test statistics null distribution (Pro cedures 1 and 2.9 ). Multiple tests of asso ciation with biolo gic al annotation metadata 177 4. The Gene O n tology 4.1. Overview of the Gene Ontolo gy The Gene Ontolo gy (GO) Consor tium ( www.ge neont ology .org ) provides ontolo- gies , i.e., structur ed and controlled vocabularie s , to des crib e gene pro ducts in ter ms of their asso ciated biolo gical processes , c e llular co mpo nent s, a nd molecular func- tions. The on tologies s pe c ify terminologies and relations hips a mong terms. The y are organis m-indepe nden t a nd can be a pplied even as o ur knowledge of the roles of genes and pro teins is accumulating and changing. The GO Co ns ortium and o ther orga nizations supply mappings b etw een GO terms and genes in v ario us org anisms. Detailed do cumentation is av ailable on the Gene O n tology Do cumentation w eb- page ( www.ge neont ology .org/GO.contents.doc.html ). 4.1.1. The thr e e gene ontolo gies: BP, CC, and MF The GO Consortium provides three ontologies, ea ch cons is ting of a str uctur ed net- work of terms descr ibing gene pro ducts. Biologi cal Pro cess (BP o r P). The Biological Pr o cess ontology r efers to series of biological even ts that are accomplished by one or more ordered assemblies of mo le cular functions. Examples of broad B P terms are cellular physiologi- cal pro c ess ( GO: 00508 75 ) and signal transduction ( GO:0 00716 5 ); e xamples of more sp ecific BP terms are pyrimidine base metab olism ( GO:00 06206 ) and alpha- glucoside transp o rt ( GO:0 00001 7 ). Cellular Comp one n t (CC o r C). The Cellular Comp onent on tology refers to sub c ellular structures, with the proviso that th e comp onents be part of some larger o b ject, which may b e an a na tomical str ucture (e.g., rough endoplasmic reticulum ( GO:000 5791 ), nucleus ( GO :00056 34 )) or a gene pro duct group (e.g., rib osome ( GO:00 05840 )). Molecular F unction (MF or F). The Molec ula r F unction ontology r efers to tasks or activities perfor med b y individual (o r assembled complexes of ) g ene pro d- ucts. E xamples of broad MF ter ms ar e cataly tic activity ( GO:00038 24 ), trans - po rter activity ( GO:00 05215 ), a nd binding ( GO:000 5488 ); examples of more sp e- cific MF terms are adenylate cyclase activity ( GO :0004 016 ) and T oll binding ( GO:000 5121 ). A gene pro duct may b e used in o ne or mo re biologic a l proc esses, may b e asso ci- ated with o ne or more cellular c o mpo nents, and may hav e one or more molecular functions. Example 1. Gene pro duct A BL1 HUMAN . The Homo sapiens gene pro duct Splic e Isoform IA of Pr oto-onc o gene tyr osi ne-pr otein kinase ABL1 ( A BL1 HUM AN ) can b e describ ed by the following terms in each of the three g ene ontologies (AmiGO br owser, L ast up dated: 200 6-05- 25, www. godat abase.or g/cgi-bin/amigo/ go.cgi ?view =deta ils&search constr aint= gp&session i d=697 3b113 9030258& gp=P00 519 ). Biologi cal Pro cess: regulation of pro g ression thro ugh cell cycle ( GO:00 00074 ); S-phase-sp ecific tra ns cription in mitotic cell cycle ( GO:00 00115 ); mismatch repair ( GO:0006298 ); 178 S. Dudoit, S. Kele¸ s and M. J. van der L aan regulation of trans cription, DNA-dep endent ( GO:0006 355 ); DNA da ma ge res po nse, signa l transduction resulting in induction of ap optosis ( GO:000 8630 ). Cellular Comp one n t: nu cleus ( GO: 00056 34 ). Molecular F unction: DNA binding ( GO:0003 677 ); protein-tyrosine kinas e activity ( GO:0004713 ); protein binding ( GO:00055 15 ). 4.1.2. GO dir e cte d acyclic gr aphs F or e ach of the three gene ontologies, GO terms a r e or ganized in a dir e cte d acyclic gr aph (D A G), whe r e a dir e cte d graph has one-way edges a nd a n acyclic graph has no path star ting and ending a t the same v ertex. Each GO term is asso ciated with a single vertex, o r no de, in the DA G. The words term , n o de , and vertex , may therefore be used interc hangeably . F or a given GO term, an anc estor refers to a less sp ecializ e d term; an offspring refers t o a more specialized term. A p ar ent is an immediate/ direct ancestor of a term; a child is an immedia te/direct offspring of a ter m. A ro ot node has no parents (i.e., no incoming edg es); a le af no de has no child ren (i.e., no outg o ing edges). In a D A G, a child may have sev eral pa rents. GO terms must ob ey the so - called t rue p ath rule : if a (child) term describ es a gene pro duct, then a ll its immediate par ent and more distant ancestor terms must also apply to the gene pro duct. The DA G structur e of GO terms and c o rresp onding true path r ule a re germa ne to the definitio n o f a suitable asso cia tion measur e b etw een gene-annotation pro files and gene-pa rameter profiles (Section 3.3 ). F ur thermore, as discus sed in Sections 4.2 – 4.5 , in the context of Bio conductor a nnotation softw are, the true pa th rule is also relev an t when asse mbling g ene-annotatio n matrices. 4.1.3. GO softwar e t o ols Many softw are to ols hav e been dev eloped to deal with GO annota tion metadata . The Gene Ontology T o ols webp age ( www.ge neont ology .org/GO.tools.shtml ) provides a list o f co nsortium a nd no n-consor tium soft ware for sea r ching and brows- ing the thr e e gene ontologies, for a nnotating genes and gene pro ducts using GO, and for combined GO and g ene expression microa r ray data a nalysis. F or instance, the AmiGO browser ( www.go datab ase.org ) allows: searching for a GO term a nd v ie w ing all gene pro ducts annotated with this ter m; s earching for a gene pro duct a nd viewing all its a s so ciated GO terms; and br owsing the o nt ologies to view re lationships a mong terms and gene pro ducts annotated with a given term. The Q uickGO browser ( www.eb i.ac. uk/ego ), developed by the Europ ean Bio in- formatics Institute (EB I), p ermits sea rches and graphica l displa ys of the Gene O n- tology by GO term, GO term iden tifier (ID), gene pro duct, and o ther ide ntifiers. Soft ware pack ages developed as part of the Bio conductor Pro ject are discussed in Sections 4.2 – 4.5 . Example 2. GO term protein-tyr osine kinase activity . T o get a s ense of the information provided b y the GO Consortium, co nsider the Molecula r F unc- tion ontology and the GO term protein- t yrosine kinase activity , with GO term ID GO:000 4713 . Multiple tests of asso ciation with biolo gic al annotation metadata 179 Go to the AmiGO browser ( www.go datab ase.org ), enter the GO term ID GO:000 4713 in the S earch GO b ox, s elect E xact Match , select Terms , a nd clic k on the Su bmit Query button. There a re tw o main options for displaying infor- mation on a GO term: a “tree view” and a “graphical view”. Clic k on the s ma ll tree-like icon (top-left corner of the table) to display the tree view with all ancestors (i.e., less specific ter ms) of the GO term protein-tyrosine kinase activity . Click on the Graphic al V iew button to display the p ortion of the MF D AG c o rresp ond- ing t o the GO ter m. Additional informatio n ma y b e obtained by clicking on the hyperlinked text pr otein- tyros ine k inase activi ty . The GO term protein-tyrosine kinase activity ha s o ne (immediate) par ent , pro- tein kina s e activity ( G O:000 4672 ), which itself has tw o parents, kina s e activity ( GO:001 6301 ) a nd phosphotransfer a se activity , alco hol group as acceptor ( GO:001 6773 ). Altogether, the term pro tein-tyrosine kinase a ctivity has 7 ancestors. According t o th e tr ue path rule, any g e ne annotated with the GO ter m pr otein- t yrosine kinase activity s hould a lso b e anno tated with all o f its less sp ecific ances tor terms. The po rtion o f the MF DA G for the GO ter m protein-tyrosine kinas e activity is display ed in Figur e 2 using the QuickGO br owser. 4.1.4. GO gene-annotation matric es F or each of the thr e e g e ne ontologies, one may define a G × M binary gene- annotation matrix A , indicating for ea ch gene g whether it is annotated with ea ch GO term m , A ( g , m ) ≡ ( 1 , if gene g is a nnotated with GO term m , 0 , otherwise (42) g = 1 , . . . , G, m = 1 , . . . , M . Section 4.5 pr ovides s a mple R co de for a ssembling GO gene-a nnotation matrices using Bio co nductor a nno tation metadata pack ages. As detailed in Section 3 , detecting ass o ciations b etw een GO annotatio n a nd other int eresting fea tur es of a genome may be viewed as the mult iple test of the null hypotheses o f no asso ciation b etw een gene-a nnotation pr ofiles A ( · , m ) and a gene- parameter profile λ = Λ( P ). The multip le testing metho dology prop o sed in [ 14 ] and related articles is well-suited to handle the complex a nd unknown de p endence structure among test statistics implied by the D A G structure of GO terms. The metho dology is summarized in Section 2 and illustra ted in Section 5 , fo r tests of asso ciatio n b etw een differential g ene expression in ALL a nd GO annotation. 4.2. Overview of R and Bio c onductor softwar e for GO annotati on metadata anal ysis As discus sed in [ 18 ], the Bio c onductor Pr oj e ct provides R pack ages for a ccessing and per forming statistical inference wit h GO annotation metadata ( www.bi ocond uctor .org ; www.r- proje ct.org ). The pack a ges include: • a gener al anno tation so ftw are pa ck ag e : annotate ; • pack ages for graph theoretical analyses : e.g ., graph , Rgraphviz ; • a GO-s pec ific metada ta pack age for navigating the three GO DA Gs: GO ; 180 S. Dudoit, S. Kele¸ s and M. J. van der L aan Fig 2 . DA G for MF GO term GO:0004713 , QuickGO. Portion of the directed acyclic graph for the GO term protein-t yrosine kinase activity ( GO:0004713 ), in the Molecular F unction on tology . This displa y , obtaine d using the EBI QuickGO browser (Last up dated 2001-03-30 0 4:29:44.0, www.ebi. ac.uk/eg o ), shows the no des corresp onding to all (less sp ecific) ancestors of the term protein-t yrosine kinase activity . (Higher-resolution color ve rsion on website companion.) • an Entrez Gene 1 -sp ecific metadata pack age, providing bi-dir ectional mappings betw een Entrez Gene IDs and GO term IDs: humanLLMap p ings ( www.nc bi.nl m.nih .gov/entrez/query.fcgi?db=gene ); 1 N.B. The NCBI Lo cusLink datab ase has b een superseded by the Entrez Gene database. Multiple tests of asso ciation with biolo gic al annotation metadata 181 • v ario us Affymetrix c hip-sp ecific metada ta pack ages, providing bi-dir ectional ma p- pings b etw ee n Affymetrix pro b e 2 IDs and GO term IDs: e.g., hg u95av2 , hu68 00 ( www.af fymet rix.c om ); • a pack age for annotating and gener ating HTML rep or ts for Affymetrix chip data: annaffy . Bio conductor metadata pack ages are up dated reg ula rly to reflec t the evolv- ing nature of biolog ic al annotation metadata; it is therefore cr ucial to keep track of version n um ber s. F or information on Bio c o nductor softw are, please consult [ 17 ] and the Do c umen tation ( www.bi ocond uctor .org/docs ) and W orks ho ps ( www.bi ocond uctor. org/workshops ) sectio ns o f the Bio co nductor Pro ject web- site, in additio n to the standar d R help facilities (e.g., help function, manuals, etc.). The remainder of this section provides sample R co de demons trating Bio conduc- tor softw are (results r epo rted for R Relea se 2.2 .1 and Bioconductor Releas e 1 .7). In o rder to run through the examples, one needs to insta ll a nd load the Bio con- ductor pack a ges annota te , GO , and hg u95av2 . The annotation metadata used in the examples corr esp ond to the following pack age versions. > librar y(ann otate) > librar y(GO) > librar y(hgu 95av2) > > packag eDesc ription("annotate") $ Version [1] "1.8.0 " > packag eDesc ription("GO") $ Version [1] "1.10. 0" > packag eDesc ription("hgu95av2") $ Version [1] "1.10. 0" Accessing and analyz ing annotation metadata from databa ses such as GenBank ( www.nc bi.nl m.nih .gov/Genbank ), GO ( www.gene ontolo gy.org ), a nd PubMed ( www.pu bmed. gov ), presupp oses the a bility to p er form the following essential bo o k- keeping task: mapping b et we en differ ent identifiers (ID) for a given gene/pro be . Bio conductor annotation metadata pack ages consist o f envir onment ob jects t hat provide key-value mappings betw een differe nt sets of gene/ prob e identifiers. F or instance, in the annotation meta data pack a ge hgu95 av2 , for the Affymetrix chip s e ries HG-U95Av2, the hgu95 av2PM ID en vironment provides ma ppings from Affymetrix prob e IDs (keys) to PubMed IDs (v alues); similarly , t he hgu95av2 GO environmen t pr ovides mappings from Affymetrix prob e IDs (keys) to GO term IDs (v alues). Example 3. Affymetrix prob e ID 1635 at. As o f V ersion 1 .10.0 of the hg u95av2 pack age, the Affymetrix prob e with ID 1635 a t corresp o nds to the g ene with symbol ABL1 and long na me v -abl Abels on murine leukemia viral oncogen e homolo g 1 , loca ted on the long arm of chromosome 9. This prob e ma ps to o ne GenBank accession n umber , one Entrez Gene ID, 14 distinct GO term IDs, and 160 distinct P ubMed IDs. > probe <- "1635 at " 2 N.B. In the con text of Affymetrix oligonucleot ide c hips, w e use the shorter term pr ob e to refer to a pr ob e-p air-set , i.e., a collection of p e rfe ct match (PM) and mismatch (MM) pr ob e-p airs that map to a particular gene. 182 S. Dudoit, S. Kele¸ s and M. J. van der L aan > get(pr obe, env=hgu95a v2SYMBOL) [1] "ABL1" > get(pr obe, env=hgu95a v2GENENAME) [1] "v-abl Abelson murine leukem ia vi ral oncoge ne ho molog 1" > get(pr obe, env=hgu95a v2MAP) [1] "9q34. 1" > get(pr obe, env=hgu95a v2ACCNUM) [1] "U0756 3" > get(pr obe, env=hgu95a v2LOCUSID ) [1] 25 > unique (name s(get(probe, env=hgu 95av2 GO))) [1] "GO:00 00074" " GO:00 00115 " "GO:00 00166 " "GO:0003 677" [5] "GO:00 04713" " GO:00 05515 " "GO:00 05524 " "GO:0005 634" [9] "GO:00 06298" " GO:00 06355 " "GO:00 06468 " "GO:0007 242" [13] "GO:0 008630 " "GO:001 6740" > length (get( probe, env=h gu95av 2PMID)) [1] 160 The r emainder of this s ection gives a brief ov erview of tw o main types of Bio - conductor annota tio n metadata pac k ages: the GO pack age (Section 4.3 ) and the hgu95av2 pa ck a ge for the Affymetrix chip series HG-U95Av2 (Sectio n 4 .4 ). Sec- tion 4.5 illustr ates how these tw o pack ages may b e used t o assemble a GO gene- annotation matrix. 4.3. The annotation metadata p ackage GO The GO pack age provides en vironment ob jects containing key-v alue pair s for map- pings b etw ee n GO term IDs, GO terms, GO term ancesto rs, GO ter m parents, GO term children, GO term offspring , and Entrez Gene IDs. The GO() co mmand lis ts all environments a v ailable in the GO pack ag e. > GO() Qualit y control in forma tion fo r GO Date built : C reate d: Fr i Sep 30 03:02: 24 20 05 Mappin gs f ound for non-pr obe b ased rda files: GOALLL OCUSI D found 9556 GOBPAN CESTO R found 9888 GOBPCH ILDRE N found 4989 GOBPOF FSPRI NG found 4989 GOBPPA RENTS f ound 9888 GOCCAN CESTO R found 1612 GOCCCH ILDRE N found 578 GOCCOF FSPRI NG found 578 GOCCPA RENTS f ound 1612 GOLOCU SID2G O found 70818 GOLOCU SID found 8017 GOMFAN CESTO R found 7334 GOMFCH ILDRE N found 1403 GOMFOF FSPRI NG found 1403 GOMFPA RENTS f ound 7334 Multiple tests of asso ciation with biolo gic al annotation metadata 183 GOOBSO LETE fo und 1032 GOTERM found 18834 F or information o n any of the GO environment s, use the help function, e.g., help(G OTERM ) or ?GOBPPAR ENTS . F or instance, the environment GOT ERM pr ovides mappings from GO term IDs (keys) to GO terms (v a lues); the environment s GOBPPA RENTS , GOC CPARE NTS , and GOM FPARE NTS , provide ontology-sp ecific mappings from GO t erm IDs (keys) to GO term p ar ent IDs (v alues). The environments GOALLL OCUSI D , GOL OCUSI D2GO , and GOL OCUSID , pr ovide mappings b etw e e n GO term IDs and Entr ez Gene IDs and are used in Section 4.5 , below, to assemble an Entrez Gene ID-by-GO term ID gene-anno tation matrix for the MF gene ontol- ogy . Example 4. GO term ID GO :00047 13 . Let us use the GO pack age to obtain information on (all) ance stors, (immediate) parents, (immediate) children, and (all) offspring of the term co r resp onding to the GO ter m ID G O:000 4713 . > ## List all GO IDs > GOID <- ls(en v = G OTERM ) > length (GOID ) [1] 18834 > GOID[1 :10] [1] "GO:00 00001" " GO:00 00002 " " GO:00 00003" "GO:00 00004 " [5] "GO:00 00006" " GO:00 00007 " " GO:00 00009" "GO:00 00010 " [9] "GO:00 00011" " GO:00 00012 " > > ## Get inform ation o n GO term corres pondi ng to GO ID > ## GO:00 04713 > GOID <- "GO:0 004713 " > term <- get(G OID,en v=GOTERM) > class( term) [1] "GOTer ms" attr(, "pack age") [1] "annot ate" > slotNa mes(t erm) [1] "GOID" "Term" "Synonym" "Secon dary" [5] "Defin ition" " Ontol ogy" > term GOID = GO:000 4713 Term = protei n-tyr osine kinase activit y Synony m = prote in ty rosine kinase activi ty Defini tion = Catal ysis of th e react ion: ATP + a pr otein tyrosi ne = AD P + protein tyrosine phosphat e. Ontolo gy = MF > > ## Get GO IDs of parent s > parent s <- get(G OID,e nv=GOMFPARENTS) > parent s isa "GO:00 04672 " > mget(p arent s,env=GOTERM) $ "GO: 000467 2" GOID = GO:000 4672 184 S. Dudoit, S. Kele¸ s and M. J. van der L aan Term = protei n kinase activi ty Defini tion = Catal ysis of th e trans fer o f a phospha te group, usuall y from ATP, to a pr otein substra te. Ontolo gy = MF > > ## Get GO IDs of ancest ors > ancest ors < - get(GO ID,en v=GOMFANCESTOR) > ancest ors [1] "all" "GO:00 03674 " "GO:0003 824" "G O:001 6740" [5] "GO:00 16772" " GO:00 16773 " "GO:00 16301 " "GO:0004 672" > > ## Get GO IDs of childr en > childr en <- g et(GOI D,env =GOMFCHILDREN) > childr en [1] "GO:00 04714" " GO:00 04715 " "GO:00 04716 " > > ## Get GO IDs of offspr ing > offspr ing < - get(GO ID,en v=GOMFOFFSPRING) > offspr ing [1] "GO:00 04714" " GO:00 04715 " " GO:00 04716" "GO:00 05020 " [5] "GO: 00050 21" "GO:00 05023 " "GO:00 05010 " "GO:0 005011 " [9] "GO: 00050 17" "GO:00 05003 " "GO:00 05006 " "GO:0 005007 " [13] "GO:0 005008 " "GO:000 5009" "G O:000 8288" " GO:000 5018" [17] "GO:0 005019 " "GO:000 5004" "G O:000 5005" " GO:000 8313" [21] "GO:0 004718 " As already noted in Ex a mple 2 and Figure 2 , the term corres po nding to the GO term ID GO: 00047 13 is protein-tyrosine kinase activity , in the Molecular F unction ontology . It has one (immediate) parent term, protein kinase activity . 4.4. Aff y metrix chip-sp e cific annotati on metadata p ackages : The hgu95a v2 p ackage The Bio conductor Pro ject provides Affymetrix chip-sp e cific annotation metadata p ackages for the main c hip series for the human, mouse , r at, and other genomes (e.g., HG-U133, HG-U95, HU-6 800, MG-U74 , and R G-U34 series). These pack ages, built using the infrastructure pack age AnnBuilder , contain environment ob jects for mappings b etw een Affymetrix prob e IDs and o ther types of ge ne / prob e identifiers. Note that a na logous pack age s are not supplied for tw o-color spo tted microarr ays, as there is no standa rd micro array design fo r this t yp e of platform and s p ecia lized annotation metadata pack age s may have to be created for each micro array facilit y (e.g., using AnnBuilder ). Once annotation metadata pa ck a ges a re av a ilable to pro- vide mappings betw een different s e ts of gene/pro be identifiers, the to ols in annotate and related pack ages may b e used in a similar manner for any type of microarr ay platform. Consider the hgu95av2 pac k age, for the Affymetrix chip series HG-U95Av2. This pack age provides the following environments. > ? hgu95a v2 Multiple tests of asso ciation with biolo gic al annotation metadata 185 > hgu95a v2() Qualit y control in forma tion fo r hgu95a v2 Date built : C reate d: Tu e Oct 4 21:31:3 5 200 5 Number of probe s: 12 625 Probe number missm atch: N one Probe missmat ch: N one Mappin gs f ound for probe based rda files: hgu95a v2ACC NUM f ound 12625 of 12625 hgu95a v2CHR LOC f ound 11673 of 12625 hgu95a v2CHR f ound 12145 of 12625 hgu95a v2ENZ YME f ound 1886 of 1262 5 hgu95a v2GEN ENAME found 11418 of 12625 hgu95a v2GO fo und 9942 of 12625 hgu95a v2LOC USID found 12203 of 12625 hgu95a v2MAP f ound 12109 of 12625 hgu95a v2OMI M found 9881 of 12625 hgu95a v2PAT H found 3928 of 12625 hgu95a v2PMI D found 12086 of 12625 hgu95a v2REF SEQ f ound 12008 of 12625 hgu95a v2SUM FUNC found 0 of 12625 hgu95a v2SYM BOL f ound 12159 of 12625 hgu95a v2UNI GENE found 12118 of 12625 Mappin gs f ound for non-pr obe b ased rda files: hgu95a v2CHR LENGTHS found 25 hgu95a v2ENZ YME2PROBE found 643 hgu95a v2GO2 ALLPROBES found 5480 hgu95a v2GO2 PROBE found 3890 hgu95a v2ORG ANISM found 1 hgu95a v2PAT H2PROBE found 155 hgu95a v2PFA M found 10439 hgu95a v2PMI D2PROBE found 98214 hgu95a v2PRO SITE found 8249 F or information on any o f these e nvironments, use the help function, e.g., help(h gu95a v2GO) or ?h gu95a v2GO . W e focus on t he three environments related to GO: hgu 95av2G O , hgu95av 2GO2A LLPROBES , and hgu 95av2 GO2PRO BE . The HG-U95 Av2 chip contains 12,6 25 pr ob es (cor resp onding to the keys in the hgu95a v2GO environmen t), with the first 1 0 Affymetrix prob e IDs lis ted b elow. > ## List all Affyme trix IDs > AffyID <- ls(env = hgu95a v2GO) > length (Affy ID) [1] 12625 > AffyID [1:10 ] [1] "1000 at " "1001 at" "10 02 f at" " 1003 s a t" "1004 at " [6] "1005 at" "1006 at" "1 007 s at " "1008 f at" "10 09 at" 186 S. Dudoit, S. Kele¸ s and M. J. van der L aan 4.4.1. Pr ob es-to-most sp e cific GO terms mappi ngs: The hg u95av 2GO envir onment The h gu95a v2GO environment provides key-v alue pa irs for the mappings fr o m Affy- metrix pr ob e IDs (keys) to GO term IDs (v a lues). Each Affymetrix pro b e ID is mapp ed to a list of o ne o r more e lement s, where each element co rresp onds to a particular GO term and is itself a list with the following three elements. • "GOID " : A GO term ID corres p o nding to the Affymetrix prob e ID (k ey). • "Evid ence" : A co de for the evidenc e supp orting the asso ciatio n of the GO term to the Affymetrix prob e. • "Onto logy" : An abbreviatio n for the name of the ontology to which the GO term belo ngs: BP (Biolo gical Pro ces s), CC (Cellular Comp onent), or MF (Molecular F unction). Note that only the dir e ctly asso ciate d terms or most sp e cific terms (i.e., not their less sp ecific ancestor terms) a pr ob e is annotated with are re turned as v alues in h gu95av 2GO . The GO pa ck ag e may be used to obtain mo re infor ma tion on the GO term I Ds, e.g ., GO term, (all) ancestors, (immediate) par ents, (immediate) children, and (all) o ffspring (Section 4.3 ). Example 5. GO terms directly asso ciated with Affymetrix prob e ID 1635 at . Let us obtain GO annotation information for the prob e with Affymetrix ID 16 35 at , corr esp onding to the ABL 1 gene. The co de b elow shows that prob e 1635 at is directly annotated with 14 distinct GO ter ms (the same GO term ID may b e returned multiple times with a different evidenc e co de). As alr e ady noted in Exa mple 1 , one of these terms, with GO term ID GO :00047 13 , is protein-tyrosine kinase activity , in the Molecular F unction ontology . > probe <- "1635 at" > probe2 GO <- g et(pro be, e nv = hgu95av 2GO) > length (prob e2GO) [1] 14 > unique (name s(probe2GO)) [1] "GO: 00000 74" "GO:00 00115 " "GO:00 00166 " "GO:0 003677 " [5] "GO: 00047 13" "GO:00 05515 " "GO:00 05524 " "GO:0 005634 " [9] "GO: 00062 98" "GO:00 06355 " "GO:00 06468 " "GO:0 007242 " [13] "GO:0 008630 " "GO:001 6740" > probe2 GO[[5 ]] $ GOID [1] "GO:00 04713" $ Evid ence [1] "TAS" $ Onto logy [1] "MF" > get(pr obe2G O[[5]] $ GOID, env=GOT ERM) GOID = GO:000 4713 Term = protei n-tyr osine kinase activit y Synony m = prote in ty rosine kinase activi ty Defini tion = Catal ysis of th e react ion: ATP + a pr otein tyrosi ne = AD P + protei n tyr osine phospha te. Ontolo gy = MF Multiple tests of asso ciation with biolo gic al annotation metadata 187 The h gu95av 2GO environment (and analog ous environmen ts for o ther chip ser ies) may b e used to assemble a n Affymetrix pro be ID-by-GO term ID gene-a nno tation matrix, row by row. This ma y entail, how ev er, a num ber of data pro cessing s teps. Firstly , only the most specific terms a pr o b e is annotated with a re re tur ned a s v alues in hgu 95av2 GO . O ne therefore needs to add a ll (les s s pec ific) a nc e s tor terms in order to comply with the tr ue pa th rule. Secondly , s everal pro b es may cor resp ond to the same gene, i.e., several Affymetrix prob e IDs may map to the sa me Entrez Gene ID according to the en vironment hgu 95av2 LOCUS ID . Thirdly , the hgu9 5av2G O environmen t r eturns GO terms for a ll three gene ontologies a t once. One may need to separ ate terms a ccording to membership in the BP , CC, and MF ontologies (e.g., using the G OTERM environment from the GO pack age). Alternately , one ma y assemble a n Affymetrix prob e ID-by-GO term ID gene- annotation matrix, column by column, using the hgu95av 2GO2A LLPROBES environ- men t describ ed b elow. 4.4.2. GO terms- t o-dir e ctly annotate d pr ob es mappings: The hgu95a v2GO2 PROBE envir onment The h gu95av 2GO2P ROBE en vironment provides key-v alue pairs for the mappings from GO term IDs (k eys) to Affymetr ix pr ob e ID s (v alues). V a lues ar e vectors of length one or greater dep ending o n whether a given GO term ID is mapp ed to one or more Affymetrix pro be IDs. The v alue names are evidence co des for the GO term IDs. Note that the prob es a particular GO ter m is ma pped to are only those asso ciated dir e ctly with the GO term (vs. indirectly via its immediate c hildren or more dista nt offspring). F or a list of all pr o b es asso cia ted dir ectly or indirectly with a par ticular GO term, one ma y use the hgu95a v2GO2A LLPROBES environmen t. Example 6. Affymetrix prob es directly asso ciated with GO term ID GO:000 4713 . In the f ollowing exa mple, 2 05 distinct Affymetrix probe IDs a re as- so ciated dir ectly with the GO term protein- t yrosine kinase activity ( GO:00 04713 ). The Affymetrix pro b e IDs include 1635 at , corr e sp onding to the A BL1 gene. > GOID <- "GO:0 004713 " > GO2Pro bes < - get(GO ID, e nv = hgu95av 2GO2PR OBE) > length (uniq ue(GO2Probes)) [1] 205 > GO2Pro bes[1 :10] < NA> "1635 at" "1636 g at" "165 6 s at" " 2040 s a t" "2041 i at" TAS IEA IEA IEA TAS "39730 at" "1084 at" "3 5162 s a t" "1564 at" "854 at " > is.ele ment( "1635 at", GO2Pr obes) [1] TRUE 4.4.3. GO terms- t o-al l annotate d pr ob es mappings: The hgu95a v2GO2 ALLPROBES envir onmen t The hgu95a v2GO2A LLPROBES en vironment provides key-v alue pairs for the mappings from GO term IDs (k eys) to Affymetr ix pr ob e ID s (v alues). V a lues ar e vectors of length one or greater dep ending o n whether a given GO term ID is mapp ed to one 188 S. Dudoit, S. Kele¸ s and M. J. van der L aan or more Affymetrix pro be IDs. The v alue names are evidence co des for the GO term IDs. Note that, in accor dance with the true path rule , the pr ob es a pa rticular GO term is mapp ed to a re as so ciated either dir e ctly with the GO term or indir e ctly via any of its immediate children or more distant offspr ing . The main difference b e t ween the hgu95a v2GO2 PROBE and hgu95av2 GO2AL LPROBES environments is that the former considers only the GO ter m itself, wher e as the latter consider s the GO term and any o f its offspring. Th us, the Affymetrix pr ob e IDs returned by hgu95av 2GO2P ROBE are a subset o f the prob e IDs returned by hgu95 av2GO2 ALLPROBES . Example 7. Affymetrix prob es d i rectly or indi rectly asso ciated with GO term ID GO:00 04713 . In the following example, 319 distinct Affymetrix prob e IDs (some with multiple evidence co des) are asso ciated either directly or indirectly with the GO term pr o tein-tyrosine kina se activity ( GO :0004 713 ). This list of 31 9 Affymetrix prob e IDs indeed includes the list of 205 prob e IDs asso cia ted dire ctly with the GO ter m ID GO:0004 713 . > GOID <- "GO:0 004713 " > GO2All Probe s <- get(GOI D, en v = hgu95av 2GO2A LLPROBES) > length (GO2A llProbes) [1] 370 > length (uniq ue(GO2AllProbes)) [1] 319 > sum(is .elem ent(GO2Probes,GO2AllProbes)) [1] 205 The hgu9 5av2G O2ALL PROBES en vironment immediately yields a n Affymetrix prob e ID-b y-GO term ID gene-a nno tation matrix, co lumn by column. Ho wev er, as with t he hgu9 5av2G O environment, a num ber of data pro ces s ing steps ma y b e required, conce r ning, for example, uniquenes s of Entrez Gene IDs and member s hip in the BP , CC, and MF ontologies. 4.5. Assembling a GO gene-annotation ma trix This section pro vides R co de for assembling an Ent rez Gene ID-by-GO t erm ID gene-annota tio n matrix A , column by column. Sp ecifically , rows cor resp ond to (unique) E n trez Gene IDs mapping to probe s on the HG-U95Av2 c hip and columns to terms in the Molecular F unction ontology mapping directly or indirectly to a t least 10 Entrez Gene IDs for the HG-U95Av2 chip. In practice, it may not b e desira ble to build the full G × M gene-a nnotation matrix, as this matrix could potentially b e very lar ge and sparse (padded with zeros). Rather , w e assemble a (smaller) gene- ann otation list , that provides, for e a ch GO term ID, a list of Ent rez Gene IDs annotated with the GO term. Example 8. Entr ez Gene ID-b y-GO term ID gene- annotation matrix for MF on tology . > ## List all Affyme trix IDs f or HG-U95A v2 ch ip > AffyID <- ls(env =hgu9 5av2GO) > length (Affy ID) [1] 12625 > > ## Get all uniqu e Entrez Gene IDs f or HG-U95A v2 ch ip > LLID <- as.ch aracte r(unique(unlist(mget(AffyID, Multiple tests of asso ciation with biolo gic al annotation metadata 189 + env=h gu95a v2LOCU SID)))) > length (LLID ) [1] 9085 > > ## Get MF GO IDs > GOID <- ls(en v=GOTE RM) > O <- unlist (lapp ly(mget(GOID, env=GO TERM) , + funct ion(z ) z@Ont ology) ) > table( O) O BP CC MF 9888 1612 733 4 > MFID <- GOID[ O=="MF "] > > ## For each MF GO ID, get all Entre z Gene IDs for genes > ## annot ated directly o r indire ctly wi th the GO term > allMFL LID < - mget(M FID, en v=GOA LLLOCU SID) > > ## For each MF GO ID, get HG-U95A v2-sp ecific Entrez Gene IDs > ## for genes annot ated directly o r indir ectly wi th the GO term > MFLLID <- lapply (allM FLLID, funct ion(z) inters ect(z , LLID)) > numMFL LID < - unlist (lapp ly(MFLLID, length )) > summar y(num MFLLID) Min. 1st Qu. Medi an Mean 3rd Qu. Max. 0.000 1.00 0 1.000 9.5 39 1.000 676 2.000 > > ## Retai n o nly MF GO IDs that map to at least 10 > ## Entre z G ene IDs for the HG-U95 Av2 c hip > MFAnno tList < - MFLLID [numM FLLID > 9] > length (MFAn notList) [1] 466 > summar y(unl ist(lapply(MFAnnotList, lengt h))) Min. 1st Qu. Medi an Mean 3rd Qu. M ax. 10.0 16 .0 27.5 132.2 7 0.0 6762.0 > MFAnno tList [1] $ "GO: 000014 6" [1] "462 0" "4 621" "4624" "4625" "4 640" "4643" "46 44" [8] "464 6" "4 647" "465 0" "58498 " > > ## Get Entrez Gene IDs for probes annota ted w ith GO ID > ## GO:00 04713 > is.ele ment( "GO:0004713",names(MFAnnotList)) [1] TRUE > length (MFAn notList["GO:0004713"][[1]]) [1] 180 190 S. Dudoit, S. Kele¸ s and M. J. van der L aan 5. T ests of asso ciation b et ween GO annotation and differential gene expression in ALL 5.1. A cute lymphoblastic leukemia study of Chiar etti et al. [13] Our prop os ed a pproach to tests of asso ciation with biologica l annotation metadata is illustra ted using the acute lymphoblastic leukemi a (ALL) micr o array dataset of [ 13 ] and Gene Ontology (GO ) annotation metadata . 5.1.1. Bio c onductor exp eriment al data R p ackage ALL The ALL data set is av ailable in the Bio co nductor exp erimental data R pack age ALL (V er sion 1.0.2, Bio conductor Release 1.7). The main ob ject in this pack age is ALL , an instance o f the clas s exprSet . The expr s slot o f ALL provides a matrix of 1 2,625 m icr o arr ay expr essio n m e asur es (Affymetrix chip ser ie s HG-U95Av2 ) for each of 128 ALL cell samples. The phenoDa ta s lo t contains 21 phenotyp es (i.e., cov ariates and outco mes) for each of the 1 2 8 cell sa mples. Pheno t yp es of interest include: ALL $ BT , the type a nd stag e o f the cance r (i.e., B - cell ALL or T-cell ALL, of stage 1, 2, 3, o r 4), and ALL $ mol.bi ol , the molecular class of the cance r (i.e., BCR/ABL, NEG, ALL1/ AF4 , E 2A/PBX1, p15 /p16, or NUP-98 ). The express ion measures have bee n obta ined using the three-step ro bust multi- chip av erage (RMA) pre-pro cessing metho d, implemen ted in the Bio c onductor R pack age affy [ 11 ], a nd hav e b een sub jected to a base 2 loga rithmic transforma tio n. F or greater detail on the ALL dataset, please consult the ALL pack age do cumen- tation. 5.1.2. The BCR/ABL fusion A n um ber of r ecent articles hav e in v estigated the pro g nostic relev ance of the BCR/ ABL fusion in adult ALL of the B -cell lineage [ 21 ]. The BC R/ ABL fusion is the molecular analog ue of the Philadelp hia chr omo- some , o ne o f the most frequent cy togenetic abnor malities in human leukemias. This t(9;22) t r anslo c ation leads to a head-to-tail fusion of the v-abl Abe lson murine leukem ia viral oncogene h omolo g 1 ( ABL1 ) fr om chromosome 9 with the 5’ ha lf of the bre akpoin t clu ster region ( BCR ) on chromosome 2 2 (Figure 3 ). The AB L1 proto-onc o gene enc o des a cytoplasmic and nuclear protein t yrosine kinase that ha s bee n implicated in pro ce sses of cell differen tiation, cell div is ion, cell a dhesion, and stress resp onse. Although the BCR/ABL fusion protein, enco ded by sequences from bo th the AB L1 and BCR genes , has been extensively studied, the function of the nor - mal product of the B CR g ene is not clear . The BCR/AB L pro to-oncog ene has been found to b e hig hly expressed in chronic m yeloid leukemia (CML) and acute my eloid leukemia (AML) cells [ 30 ]. An interesting question is therefore the identification of genes that are differen- tially expr essed b etw een B-cell ALL with the BCR/ABL fusion a nd cytogene tica lly normal NEG B-cell ALL. In order to addr e ss this question, we consider gene expression mea sures fo r the n = 79 B-cell ALL cell sa mples ( A LL $ BT eq ua l to B , B 1 , B 2 , B3 , o r B4 ), of the BCR/ABL or NEG mo le cular types ( ALL $ m ol.bio l equa l to B CR/ABL or NEG ). Multiple tests of asso ciation with biolo gic al annotation metadata 191 Fig 3 . The Philadelphia chr om osome and the BCR/ABL fusion. The BCR/ABL fu- sion is the molecular analogue of the Philadelphia ch romosome. This t(9;22) translo ca- tion leads to a head-to-tail fusion of the v-abl Abelson murine leukemia viral oncogene homolog 1 ( ABL1 ) f r om chromosome 9 with the 5’ half of the breakpoint cluster region ( BCR ) on c hromosome 22. Fi gure obtained from the N ational Cancer Institute website ( www.canc er.gov/T emplates/db alpha.aspx?C drID=441 79 ). (Color version on website compan - ion.) 5.1.3. Gene filtering Many of th e genes repres e n ted b y the 12,625 prob es are not expressed in B-cell lympho cytes. Accordingly , as in [ 44 ], w e only retain the 2,391 prob es that meet the following t w o criteria : (i) fluorescence in tensities gr eater than 100 (absolute scale) for a t least 25% of the 79 cell samples; (ii) interquartile r ange (IQR) o f the fluorescence intensities for the 79 cell samples g r eater than 0 .5 (log base 2 sca le). F urther more, different prob es may corre s po nd to the same gene, i.e., map to the same En trez Gene ID, a ccording to the en vironment hgu 95av2L OCUSI D fr om t he hgu95av2 pack age. In order to o btain o ne expression measure pe r gene, we cho ose to av erage the expres s ion measures of mult iple pro b es mapping to the same gene. These v arious pre-pro ces s ing steps lead to G = 2 , 071 genes with unique En trez Gene IDs. 5.1.4. R e duc e d ALL dataset: Genotyp es and phenotyp es of inter est The co m bined ge notypic and pheno typic data for the n = 79 B-cell ALL cell samples o f the BCR/ABL a nd NEG molecular type s ma y b e summarized by the set X Y n ≡ { ( X i , Y i ) : i = 1 , . . . , n } , of n pairs of G -dimensiona l gene e x pres- sion profiles X i = ( X i ( g ) : g = 1 , . . . , G ), G = 2 , 07 1, and cancer class lab els Y i ∈ { N E G, B C R / AB L } . Among the n = 79 B-c e ll ALL c e ll samples, ther e 192 S. Dudoit, S. Kele¸ s and M. J. van der L aan are n BC R/ ABL ≡ P i I ( Y i = B C R / AB L ) = 3 7 BCR/ABL samples and n N EG ≡ P i I ( Y i = N E G ) = 42 NEG sa mples . 5.2. Mu l tiple hy p othesis testing fr amework Our primary question o f in terest is the identification o f genes that are differ ential ly expr esse d (DE) b etw e e n BCR/ABL and NEG B-cell ALL. A subsequent question inv o lves r elating differ ent ial gene expr ession t o GO annotation . As deta ile d b elow, GO annotation metadata for the filter ed list of G = 2 , 07 1 unique g e ne s from the HG-U9 5 Av2 chip may b e s ummarized by binary gene- annotation profiles . The gene-pa rameter profiles o f interest co ncern differential gene expr ession b e- t ween BCR/ABL and NEG B-cell ALL, i.e., the asso ciatio n b etw een microa r ray gene express io n measures and cancer c lass. Contin uous ge ne - parameter profiles of unstandardized and standardized measure s of differential express ion ar e estimated, resp ectively , by (unstanda r dized) differences of empirica l mea ns and (standardize d) t wo-sample t -statistics. Binary gene- parameter profiles, indicating whether genes are differentially expressed, ar e estimated by imp os ing cut-off r ules on t w o-sample t -statistics or adjusted p -v alues. The following a s so ciation measur es b et ween GO gene- a nnotation pr ofiles and DE g ene-para meter profiles are considered: tw o-sample t -statistics for tests o f a s - so ciation b etw een bina r y GO gene-anno tation profiles and contin uous DE g ene- parameter pr o files; χ 2 -statistics fo r tests of as so ciation be t ween binary GO gene- annotation profiles a nd bina r y DE gene-pa rameter pro files. Significant asso ciations b etw een differen tial gene expressio n and GO annotation are identified by applying FWER-controlling single- step maxT Pr o cedure 1, based on the non-pa rametric b o otstrap null s hift and sc ale-transfo r med test sta tistics null distribution of P ro cedure 2. 5.2.1. Gene-annotation pr ofiles Gene O n tology annotation metadata for the HG-U95Av2 chip series a re obta ined as describ ed in Sections 4.2 – 4.5 , from the following Bio conductor R pack ages: the GO- sp ecific metadata pack age GO (V ersion 1.1 0.0, Bio conducto r Release 1.7 ) and the Affymetrix chip-sp ecific metada ta pack age hgu95 av2 (V ersion 1.10.0 , B io conductor Release 1.7). F or each of the thr e e gene on tologies, binary gene-ann otation matric es A B P , A C C , a nd A M F , a re as s embled for the GO ter ms annotating at lea st 1 0 of the G = 2 , 071 filtered genes (sample R c o de pr ovided in Section 4.5 ). Sp ecifically , for gene ont ology o ∈ { B P, C C, M F } , A o = ( A o ( g , m ) : g = 1 , . . . , G ; m = 1 , . . . , M o ) is a G × M o matrix, with ele ment A o ( g , m ) indicating whether gene g is annotated by GO term m and such that P g A o ( g , m ) ≥ 10 for e ach term m . The num bers of terms considered in ea ch gene ontology are M B P = 36 7, M C C = 81 , and M M F = 18 5. 5.2.2. Gene-p ar ameter pr ofiles Definition of gene-parameter profiles Consider a data structure ( X, Y ) ∼ P , where X = ( X ( g ) : g = 1 , . . . , G ) is a G = 2 , 071 - dimensional vector o f mi- croar ray g ene expr ession measur es and Y ∈ { N E G, B C R/ AB L } is a binary can- cer cla s s lab el. Let η k ≡ P r( Y = k ) denote the pr op ortion of cancer s of class Multiple tests of asso ciation with biolo gic al annotation metadata 193 k ∈ { N E G, B C R/ AB L } . Define conditional G -dimensio nal mean vectors a nd G × G cov ariance matrice s for the expressio n measures of clas s k ∈ { N E G, B C R/ AB L } cancers by (43) µ k ≡ E[ X | Y = k ] and σ k ≡ Cov[ X | Y = k ] , resp ectively . Gene-p ar ameter pr ofiles , concer ning differen tial g ene ex pr ession b etw een BCR/ ABL a nd NEG B-cell ALL, may b e sp ecified in v ar ious wa ys. Continuous DE gene- parameter pro files may be defined in ter ms o f the fo llowing unstandar dize d a nd standar dize d measures of differential gene expression b etw een BCR/ ABL and NEG B-cell ALL, λ d ( g ) ≡ µ BC R/ ABL ( g ) − µ N EG ( g ) (44) and λ t ( g ) ≡ µ BC R/ ABL ( g ) − µ N EG ( g ) q σ BC R/ ABL ( g,g ) η BC R/ ABL + σ N EG ( g,g ) η N EG . Absolute v alues o f λ d ( g ) and λ t ( g ) may b e used for mea suring tw o -sided different ial expression, i.e., either over- or under-expr e s sion in BCR/ABL co mpared to N EG B-cell ALL. Binary DE gene- parameter profiles may be defined in terms of indicators for t wo-sided and one-s ided differential e x pression. λ 6 = ( g ) ≡ I ( µ BC R/ ABL ( g ) 6 = µ N EG ( g )) (45) = I λ d ( g ) 6 = 0 = I λ t ( g ) 6 = 0 , λ + ( g ) ≡ I ( µ BC R/ ABL ( g ) > µ N EG ( g )) = I λ d ( g ) > 0 = I λ t ( g ) > 0 , λ − ( g ) ≡ I ( µ BC R/ ABL ( g ) < µ N EG ( g )) = I λ d ( g ) < 0 = I λ t ( g ) < 0 . Estimation of gene - parameter profiles The above DE gene-parameter pro- files may b e estimated as follows, based on the sample X Y n of gene expression measures for the n = 79 B-cell ALL ce ll sa mples of the BCR/ABL and NEG molecular types. The r esubstitution estimators o f the co n tin uous gene-par ameter pr ofiles of Equa- tion ( 44 ) ar e based, r esp ectively , on difference s of e mpirical mea ns and t wo-sample W elch t -statistics (up to the multiplier 1 / √ n ). That is, λ d n ( g ) ≡ µ BC R/ ABL,n ( g ) − µ N EG,n ( g ) (46) and λ t n ( g ) ≡ 1 √ n µ BC R/ ABL,n ( g ) − µ N EG,n ( g ) q σ BC R/ ABL,n ( g,g ) n BC R/ ABL + σ N EG,n ( g,g ) n N EG , where µ k,n ( g ) ≡ P i I ( Y i = k ) X i ( g ) /n k and σ k,n ( g , g ) ≡ P i I ( Y i = k ) ( X i ( g ) − µ k,n ( g )) 2 / ( n k − 1 ) deno te, r esp ectively , the empirical means and v a r iances of the gene expressio n mea sures for cancers of clas s k ∈ { N E G, B C R / AB L } . 194 S. Dudoit, S. Kele¸ s and M. J. van der L aan Estimating the tw o-sided binary gene-par ameter profile λ 6 = of E quation ( 45 ) inv o lves the two-side d test o f the G null hypo theses H 0 ( g ) = I ( µ BC R/ ABL ( g ) = µ N EG ( g )), of no differences in mean gene expres sion measures b etw een BCR/ABL and NEG B-cell ALL. Lik ewise, estimating the one-sided binary gene-para meter profiles λ + and λ − inv o lves, resp ectively , the one-side d test of the G null hy- po theses o f no ov er-expression ( H 0 ( g ) = I ( µ BC R/ ABL ( g ) ≤ µ N EG ( g ))) and no under- expression ( H 0 ( g ) = I ( µ BC R/ ABL ( g ) ≥ µ N EG ( g ))) in BCR/ABL compar e d to NEG B-cell ALL. F or s ingle-step c o mmon-cut-off maxT Pro cedur e 1, adjusted p -v alues pro duce the sa me g ene ranking as the test statistics defined in Equatio n ( 46 ). Sim- ple and na ive estimators of the three s ets o f differen tially expressed ge ne s (i.e., false null hyp o theses), represented b y the gene- parameter profiles λ 6 = , λ + , a nd λ − , are therefore g iven, resp ectively , by the sets of g enes with the lar gest γ G v alues of | λ t n ( g ) | , λ t n ( g ), and − λ t n ( g ). That is, λ 6 = n,γ G ( g ) ≡ I G X g ′ =1 I | λ t n ( g ) | ≥ | λ t n ( g ′ ) | > (1 − γ ) G , (47) λ + n,γ G ( g ) ≡ I G X g ′ =1 I λ t n ( g ) ≥ λ t n ( g ′ ) > (1 − γ ) G , λ − n,γ G ( g ) ≡ I G X g ′ =1 I − λ t n ( g ) ≥ − λ t n ( g ′ ) > (1 − γ ) G . Analogous estima to rs may also be based on o ther test s tatistics, such as unstan- dardized difference s ta tistics λ d n . More sophistica ted es tima tors, tha t translate the propor tion γ o f rejected null hypotheses into a Type I er ror rate such as the gFWER, TPPFP , o r FDR, co uld be based on adjusted p - v alues for the mult iple test of the G null h ypo theses H 0 ( g ). F or e xample, one could estimate λ 6 = by (48) λ 6 = n,α ( g ) ≡ I e P 6 = 0 n ( g ) ≤ α , where e P 6 = 0 n ( g ) are adjusted p -v alues for a suitably chosen multiple testing pro ce dur e, such as, FWER-controlling single-step maxT P ro cedure 1 or a TPPFP -controlling augmentation multiple tes ting pro ce dure (Cha pter 6 in [ 14 ], [ 40 ]). One-sided bina r y gene-para meter pro files λ + and λ − could be estimated likewise. 5.2.3. Asso ciation me asur es for gene-annotation and gene-p ar ameter pr ofiles The a sso ciation b etw ee n contin uous DE gene-para meter profiles, as in Equation ( 44 ), and binary GO gene-a nnotation profiles may b e measur ed by two-sample Welch t - statistics (or corr esp onding p -v alues). Sp ecifically , given a co ntin uous G - vector x and a binar y G -vector y , define the following asso cia tion measur e, (49) ρ t ( x, y ) ≡ ¯ x 1 − ¯ x 0 q v [ x ] 1 y 1 + v [ x ] 0 y 0 , where y k ≡ P g I ( y ( g ) = k ), ¯ x k ≡ P g I ( y ( g ) = k ) x ( g ) /y k , a nd v [ x ] k ≡ P g I ( y ( g ) = k ) ( x ( g ) − ¯ x k ) 2 / ( y k − 1), k ∈ { 0 , 1 } . Multiple tests of asso ciation with biolo gic al annotation metadata 195 The asso ciatio n b etw e e n bina ry DE gene-para meter profiles, as in Equa tion ( 45 ), and binary GO g ene-annotation profiles may b e measured by χ 2 -statistics (or co r- resp onding p -v a lues) for the test of independenc e o f r ows and columns in a 2 × 2 contingency table, such as T able 2 . Specifically , giv en binar y G -vectors x and y , define the following asso ciatio n measure, (50) ρ χ ( x, y ) ≡ G ( g 00 g 11 − g 01 g 10 ) 2 ( g 00 + g 01 )( g 00 + g 10 )( g 11 + g 01 )( g 11 + g 10 ) , where g kk ′ ≡ P g I ( x ( g ) = k ) I ( y ( g ) = k ′ ), k , k ′ ∈ { 0 , 1 } . Given an asso ciatio n measure 3 ρ : R G × M × R G → R M , a G × M GO ge ne- annotation matrix A , and a G -dimens io nal DE ge ne-parameter profile λ = Λ( P ), the M -dimensional asso ciation p ar ameter vector ψ = Ψ( P ) o f pr imary interest is defined as (51) ψ ≡ ρ ( A, λ ) . The c o rresp onding r esu bstitution estimator ψ n = ˆ Ψ( P n ) is simply o btained by replacing the gene- parameter pr ofile λ by an estimator ther e of λ n = ˆ Λ( P n ), that is, (52) ψ n ≡ ρ ( A, λ n ) . 5.2.4. Nul l and alternative hyp otheses F or the t -statistic-ba sed asso cia tio n measure ρ t of Equatio n ( 49 ), the iden tifica- tion of GO terms m that are significantly (p ositively or nega tively) asso ciated with BCR/ABL vs. NE G different ial gene e x pression inv olv es the two-side d t est of the M null h ypothes e s H 0 ( m ) = I ( ψ ( m ) = ψ 0 ( m )) against the a lternative h ypothe- ses H 1 ( m ) = I ( ψ ( m ) 6 = ψ 0 ( m )), with n ull v alues ψ 0 ( m ) = 0. In some co nt exts, one may b e interested in ide ntifying p ositive (negative) asso ciations, i.e., in the one-side d test of the M null hypotheses H 0 ( m ) = I ( ψ ( m ) ≤ ψ 0 ( m )) ( H 0 ( m ) = I ( ψ ( m ) ≥ ψ 0 ( m ))) against the alter na tive hypotheses H 1 ( m ) = I ( ψ ( m ) > ψ 0 ( m )) ( H 1 ( m ) = I ( ψ ( m ) < ψ 0 ( m ))). F or the χ 2 -statistic-base d asso c iation measure ρ χ of E quation ( 50 ), the identi- fication of GO terms m that ar e s ig nificantly (po sitively o r nega tively) ass o ciated with BCR/ ABL vs. NEG differential gene expres sion inv olv es the one-side d test of the M null hypotheses H 0 ( m ) = I ( ψ ( m ) ≤ ψ 0 ( m )) agains t the alternative hypothe- ses H 1 ( m ) = I ( ψ ( m ) > ψ 0 ( m )). A natur al choice for the null v a lues is the mean o f the χ 2 (1)-distribution, ψ 0 ( m ) = 1. 5.2.5. T est statistics One-sided a nd tw o-sided tests of null hypothes e s concer ning any of the as s o ciation parameters defined a b ove may b e based on (unstandar dize d) differ enc e statistics T n ( m ), defined as in E quation ( 40 ). F or one-sided tests, larg e v alues of the tes t statistics T n ( m ) provide evidence against the cor resp onding null hypo theses H 0 ( m ), that is, r e jection regions are of the for m C n ( m ) = ( c n ( m ) , + ∞ ). F o r t wo-sided tests, la rge v alues of the absolute test statistics | T n ( m ) | provide evidence a gainst the corresp o nding null hypo theses H 0 ( m ). 3 N.B. F or ease of notation, ρ t and ρ χ , de fined in Equations ( 49 ) and ( 50 ) as real-v alued association measures, may also r efer lo osely to R M -v al ued asso ciation measures, defined as ρ t ( X, y ) ≡ ( ρ t ( X ( · , m ) , y ) : m = 1 , . . . , M ) and ρ χ ( X, y ) ≡ ( ρ χ ( X ( · , m ) , y ) : m = 1 , . . . , M ) for X ∈ R G × M and y ∈ R G . 196 S. Dudoit, S. Kele¸ s and M. J. van der L aan 5.2.6. Multiple testing pr o c e dur es F or the pur po se of illustra tion, we fo cus on con trol of the f amily-wise err or r ate , using single-step ma xT Pr o c e dur e 2.9 , based on the non-p ar ametric b o otstr ap nul l shift-tr ansforme d test statistics nul l distribution of P ro cedure 2.9 (n ull shift v alues λ 0 ( m ) = 0 and no scaling). Let O n ( m ) deno te indice s for the order ed adjusted p -v alues , so that e P 0 n ( O n (1)) ≤ · · · ≤ e P 0 n ( O n ( M )). GO terms with adjusted p - v alues less than or equa l to α a r e declared s ig nificantly asso ciated with different ial gene expre ssion at nomina l FWER level α . That is, the list of GO terms found to b e asso ciated with differen tial gene expression is (53) R n ( α ) ≡ n m : e P 0 n ( m ) ≤ α o = { O n (1) , . . . , O n ( R n ( α )) } , where R n ( α ) ≡ |R n ( α ) | denotes the num ber o f identified GO terms. 5.2.7. Summ ary of t esting s c enarios This section summarizes our approa ch for identifying GO terms asso c iated with BCR/ABL vs. NEG differ e n tial gene express ion. F or each of the three gene ontolo- gies (i.e., BP , CC, and MF), we consider the following three types of testing sce- narios, each cor resp onding to a different asso c iation par ameter ψ = ρ ( A, λ ) for GO annotation and BCR/ABL v s . NEG differential gene ex pression. Scenario s MT[ t , t ] and M T[ d, t ] are very similar and cor resp ond, resp ectively , to c ontinuous gene- parameter profiles o f st andar dize d and un standar dize d measures of differential gene expression. In co n trast, Scenario MT[ 6 = , χ ] corresp onds to a binary g ene-parameter profile of differential g ene e xpression indicators. Scenario MT[ t, t ] : Ass o ciation parameter ψ t,t = ρ t ( A, | λ t | ) , for standard- ized con tin uous DE g e ne-parameter profile λ t . Consider the tw o-sided test of H t,t 0 ( m ) ≡ I ψ t,t ( m ) = ψ t,t 0 ( m ) vs. H t,t 1 ( m ) ≡ I ψ t,t ( m ) 6 = ψ t,t 0 ( m ) , where the asso ciation parameter vector of interest is defined as ψ t,t ≡ ρ t ( A, | λ t | ) , based on Equations ( 44 ) and ( 49 ), and the n ull v a lues ar e ψ t,t 0 ( m ) ≡ 0. The contin uo us DE gene-para meter pro file λ t is estimated by λ t n , as in Equatio n ( 46 ), and the a sso ciation par ameter ψ t,t is estimated by the resubstitution esti- mator ψ t,t n ≡ ρ t ( A, | λ t n | ), as in Equation ( 52 ). The test statistics ar e defined as (unstandardized) difference sta tistics, T t,t n ( m ) ≡ √ n ( ψ t,t n ( m ) − ψ t,t 0 ( m )) , and the null h yp o theses H t,t 0 ( m ) are r ejected for larg e abso lute v alues o f T t,t n ( m ). Multiple tests of asso ciation with biolo gic al annotation metadata 197 Scenario MT[ d, t ] : Ass o ciation parameter ψ d,t = ρ t ( A, | λ d | ) , for unstan- dardized con tin uous DE gene-parameter profile λ d . Consider the t w o- sided test of H d,t 0 ( m ) ≡ I ψ d,t ( m ) = ψ d,t 0 ( m ) vs. H d,t 1 ( m ) ≡ I ψ d,t ( m ) 6 = ψ d,t 0 ( m ) , where the asso ciation parameter vector of interest is defined as ψ d,t ≡ ρ t ( A, | λ d | ) , based on Equations ( 44 ) and ( 49 ), a nd the null v alues are ψ d,t 0 ( m ) ≡ 0. The contin uo us DE gene-pa rameter pro file λ d is estimated by λ d n , as in Equatio n ( 46 ), and the a sso ciation pa rameter ψ d,t is estimated b y the r e s ubstitution es ti- mator ψ d,t n ≡ ρ t ( A, | λ d n | ), as in Equation ( 52 ). The test statistics are defined as (unstandardized) difference sta tistics, T d,t n ( m ) ≡ √ n ( ψ d,t n ( m ) − ψ d,t 0 ( m )) , and the null hypotheses H d,t 0 ( m ) are rejected for large absolute v a lues of T d,t n ( m ). Scenario MT[ 6 = , χ ] : Asso ciation parameter ψ 6 = ,χ = ρ χ ( A, λ 6 = ) , for binary DE g ene-parameter profile λ 6 = . Consider the o ne- sided test of H 6 = ,χ 0 ( m ) ≡ I ψ 6 = ,χ ( m ) ≤ ψ 6 = ,χ 0 ( m ) vs. H 6 = ,χ 1 ( m ) ≡ I ψ 6 = ,χ ( m ) > ψ 6 = ,χ 0 ( m ) , where the asso ciation parameter vector of interest is defined as ψ 6 = ,χ ≡ ρ χ ( A, λ 6 = ) , based on Equations ( 45 ) and ( 50 ), and the n ull v alues are ψ 6 = ,χ 0 ( m ) ≡ 1 (the mean of t he χ 2 (1)-distribution). The following tw o t ypes of estimato rs λ 6 = n are considered for the binar y DE ge ne - parameter pr ofile λ 6 = : λ 6 = n,γ G , with num bers of DE genes γ G = 20 , 50 , 100 (Equa tion ( 47 )); λ 6 = n,α , defined in terms of adjusted p -v alue s for FWER-controlling p ermutation-based single-step maxT P ro cedure 2.9 ( B = 1 , 00 0 permutations of the cancer class labels ) and nominal FWER level α = 0 . 05 (Equation ( 48 )). Giv en an estimator λ 6 = n of λ 6 = , the asso cia tion parameter ψ 6 = ,χ is estimated by the r esubstitution estimator ψ 6 = ,χ n ≡ ρ χ ( A, λ 6 = n ), as in Equation ( 52 ). The test statistics are defined as (unstandar dized) difference statistics, T 6 = ,χ n ( m ) ≡ √ n ( ψ 6 = ,χ n ( m ) − ψ 6 = ,χ 0 ( m )) , and the null hypotheses H 6 = ,χ 0 ( m ) are rejected for large v alues of T 6 = ,χ n ( m ). F or each of the three testing scenarios , the null shift-transfo r med test statistics nu ll distribution Q 0 is estimated as in Pro cedure 2 , with B = 5 , 000 no n- parametric bo otstrap samples of the da ta X Y n and Z B n ( m, b ) = T B n ( m, b ) − E[ T B n ( m, · )] (i.e., nu ll shift v a lues λ 0 ( m ) = 0 and no scaling). F or o ne-sided testing Scenario M T [ 6 = , χ ] , 198 S. Dudoit, S. Kele¸ s and M. J. van der L aan bo otstrap-based single-step maxT adjusted p -v alues e P 0 n ( m ) ar e computed a s in Pro cedure 2. F or t wo-sided testing Scenar ios M T[ t, t ] and MT[ d, t ] , adjusted p -v alues are computed bas ed o n a bsolute v alues o f Z B n ( m, b ) and T n ( m ). In what follows, the G -dimensio nal gene-par ameter profiles λ c o rresp ond to the G = 2 , 071 g enes with unique E ntrez Gene IDs, obtained as described in Sectio n 5.1 . F o r ea ch of the three gene ontologies, binary gene-annota tio n matr ices are assembled for the GO terms a nnotating at lea st 1 0 of the G = 2 , 071 genes of int erest: G = 2 , 071 × M B P = 367 gene-annotatio n ma trix A B P for the BP ontology , G = 2 , 071 × M C C = 81 g ene-annotatio n matrix A C C for the C C ontology , and G = 2 , 071 × M M F = 18 5 ge ne - annotation matrix A M F for the MF ontology . 5.3. R esul ts 5.3.1. Differ ential ly expr esse d genes b etwe en BCR/ABL and NEG B-c el l ALL In o r der to iden tify differentially express ed genes b etw een BCR/ABL and NEG B-cell ALL, tw o-sided tes ts o f the G null hypotheses H 0 ( g ) = I ( µ BC R/ ABL ( g ) = µ N EG ( g )) are p erfor med using the t wo-sample t -statistics λ t n ( g ) o f Equatio n ( 46 ) and FWE R- controlling bo o tstrap-bas e d single-step maxT Pro ce dure 2. Adjusted p -v alues e P 6 = 0 n ( g ) are obtained using the MTP function fro m the m u l ttest pack age (V ersion 1 .8.0, B io - conductor Re le a se 1.7 ), with B = 5 , 000 non-par ametric bo o tstrap sa mples and other arguments se t to their defa ult v alues. Figure 4 displays a norma l quantile-quan tile plo t of the test statis tics λ t n ( g ) (Panel (a)) and a plot of the sorted b o otstr ap-based single - step maxT adjusted p -v alue s e P 6 = 0 n ( g ) (Panel (b)). A handful o f genes stand out in terms of their la r ge absolute test statistics a nd small adjusted p - v alues. F or control of t he FWER at nominal lev el α = 0 . 05, Pro cedure 2.9 iden tifies 16 differentially expresse d genes, i.e., 1 6 genes with e P 6 = 0 n ( g ) ≤ α . T able 3 provides Fig 4 . Differ ential ly e x pr esse d g enes b etwe en BCR/ABL and NEG B-c el l ALL. Panel (a): Normal quan tile-quan tile plot of tw o-sample t -statistics λ t n ( g ). Panel (b): Plot of sorted b ootstrap-based single-step maxT adjusted p -v alues e P 6 = 0 n ( g ). Multiple tests of asso ciation with biolo gic al annotation metadata 199 T able 3 . Differ ential ly ex pr esse d genes b etwe en BCR/ABL and NEG B- c e l l ALL. Thi s table prov ides the Affymetrix pr obe IDs, Ent rez Gene IDs ( hgu95av2LOC USID environmen t i n hgu95av2 pac k age), gene symbols ( hgu95av2S YMBOL en vironmen t), gene names ( hgu9 5av2GENE NAME env iron- men t), test statistics λ t n ( g ) (Equation ( 46 )), and adjusted p -v alues e P 6 = 0 n ( g ), f or the 16 genes found to b e significan tly different ially expressed b etw ee n BCR/ABL and NEG B-cell A LL, at nomi- nal FWER level α = 0 . 05, according to the b o otstrap-based single-step maxT pro cedure, with t w o-sample t -statistics λ t n ( g ) and B = 5 , 000 b o otstrap samples. A more detailed hyperlinked table, including i nf ormation on gene function, c hromosomal lo cation, links to GenBank, Ent rez Gene, NCB I Map Viewer, UniGene, PubMed, AmiGO, and KEGG, is provided on the we bsite companion (Supplementa ry T able 10.1). Prob e ID En trez Gene ID Symbol λ t n ( g ) e P 6 = 0 n ( g ) 1635 at 25 ABL1 8 . 44 0.0e+00 v-abl Abelso n murine leukemia viral oncogene homolog 1 40202 at 687 KLF9 6 . 33 0.0e+00 Kruppel- like factor 9 37027 at 79026 AHNAK 5 . 71 1.4e-03 AHNAK nucleo protein (desmoyokin) 39837 s at 168544 ZNF467 5 . 45 3.4e-03 zinc finger protein 467 33774 at 841 CASP8 5 . 29 4.2e-03 caspase 8, apoptosi s-relate d cysteine peptidase 37014 at 459 9 MX1 − 5 . 23 5.0e-03 myxoviru s (influenza virus) resistance 1, interfer on-induc ible protein p78 (mouse) 2039 s at 2534 FYN 5 . 21 5.0e-03 FYN oncogene relate d to SRC, FGR, YES 39329 at 87 ACTN1 4 . 97 9.6e-03 actinin, alpha 1 32542 at 227 3 FHL1 4 . 96 1.0e-02 four and a half LIM domains 1 40051 at 969 7 TRAM2 4 . 59 2.7e-02 transloc ation associated membrane protein 2 38032 at 990 0 SV2A 4 . 54 3.1e-02 synaptic vesicle glycoprote in 2A 39319 at 393 7 LCP2 4 . 50 3.5e-02 lymphocy te cytosolic protein 2 (SH2 domain contain ing leukocyte protein of 76 kDa) 33232 at 139 6 CRIP1 4 . 46 3.7e-02 cysteine -rich protein 1 (intestinal) 36591 at 727 7 TUBA1 4 . 37 4.4e-02 tubulin, alpha 1 (testis specific) 38994 at 883 5 SOCS2 4 . 35 4.7e-02 suppress or of cytokine signaling 2 40076 at 716 5 TPD52L2 − 4 . 33 4.8e-02 tumor protei n D52-like 2 the test statistics, adjusted p -v alues , and v a rious identifiers for these 16 genes. A more de ta iled h ype r linked ta ble is pos ted o n the website companio n (Supplementary T a ble 10.1; www.st at.be rkeley.edu/~sandrine/MTBook/BAM/BAM.html ). Only 2 of the 16 identifi ed g e nes hav e a nega tive test statistic ( MX1 a nd TPD5 2L2 ), suggesting that most DE genes tend to be over-expr esse d in cell sa mples with the BCR/ABL fusion. Unsurprisingly , the g ene showing the most o ver-expression in BCR/ABL cell samples, as mea sured by the t -statistics λ t n , is the ABL1 gene ( v-abl Abels on murine leukem ia viral oncoge ne h omolog 1 ), lo cated on the lo ng arm of chro- 200 S. Dudoit, S. Kele¸ s and M. J. van der L aan mosome 9 (9q34.1). As mentioned in Section 5.1 , the BCR/ ABL phenotype is indeed defined in terms of the ABL1 gene. F urther more, many of the DE genes seem to b e related to ap o pto sis or oncoge ne- sis. F or example, the Kru ppel- like fac tor 9 ( KLF 9 ) gene enco des a transcr iption factor that binds GC- box elements in gene pro mo ter regions . The Kr ¨ uppel-like factor (K LF) family is comprised of highly related zinc- finger proteins, that a re im- po rtant compo nents of the euk a r yotic cellula r transcr iptional mach inery and tha t take par t in a wide range of cellular functions (e.g., cell pro liferation, ap optosis, dif- ferentiation, a nd neoplastic transformation). In pa r ticular, K LFs hav e b een link ed to v ar io us canc e rs [ 25 ]. The intron-less gene AHN AK nucleop rotein (de smoyo kin) ( AHNAK ), lo ca ted on the long ar m of chromosome 11 (11q12 .2 ), enco des an un- usually large protein ( ≅ 700 kiloDalton (kDa)) that is t ypically r e pressed in cell lines derived from human neur oblastomas and several other types o f tumor s [ 35 ]. Y et another example, the cas pase 8, apoptosis- relat ed cy stein e pep tidas e ( CASP8 ) gene, e nc o des a key enzyme a t the top of the ap optotic ca scade and has bee n linked to neur oblastoma [ 3 ]. Likewise, other g enes listed in T able 3 , including MX1 , FYN , ACT N1 , FHL 1 , and TRAM2 , a ppea r to b e rela ted to the mole cular bio logy of cancer . Our results are in genera l agr e ement with those o f [ 44 ], slight differences b eing due, most likely , to our preliminary gene filtering, which in volv es av eraging the expression measures o f multiple pr ob es mapping to the same E ntrez Gene ID. F or gre ater deta il, the interested reader is invited to cons ult Supplementary T able 10.1 on the website companion and follow links to PubMed and o ther databases. F urther exploration o f the DE genes may b e p erfor med in R using the Bio conductor pack ages an n o tate and annaffy . 5.3.2. GO terms asso ciate d with differ ential gene expr ession b etwe en BCR/ABL and NEG B-c el l A LL Figure 5 displays, for each of the three gene on tologies and each o f the three testing scenarios , plo ts o f the sorted adjusted p - v alues, e P 0 n ( O n (1)) ≤ · · · ≤ e P 0 n ( O n ( M )), for FWER-controlling b o otstr ap-based single-step maxT Pr o cedure 2 ( B = 5 , 000 bo otstrap samples). The smaller the adjusted p -v alues, the les s conserv ativ e the pro cedure, and the longer th e lis t R n ( α ) = { m : e P 0 n ( m ) ≤ α } of identified GO terms at any g iven nominal Type I err o r level α . T a ble 4 s ummarizes the results in terms of the num bers R n ( α ) = |R n ( α ) | of GO terms found to b e significantly asso cia ted with BCR/ABL vs. NEG differe n tial gene expressio n for differen t nomina l FWER levels α . In ge neral, a djusted p -v alues tend to b e quite la r ge, with only a handful of GO terms identified as b eing significan tly asso c iated with BCR/ ABL vs. NEG differ- ent ial gene expr ession fo r nominal FWER level α ∈ { 0 . 05 , 0 . 10 , 0 . 20 } . The ad- justed p - v alues for Scenario s MT[ t, t ] and MT[ d, t ] (red and blue plotting symbols), corres p o nding, resp ectively , to standa r dized and unstandar dized contin uous DE gene-para meter pro files, are similar. F or the BP a nd MF gene ontologies, Scenario MT[ t, t ] seems to be sligh tly more conserv ativ e than Scenar io MT [ d, t ] ; how ever, this do es not hold for the CC ontology . Scena r io MT [ 6 = , χ ] , with four different estimators of the bina r y DE gene-par ameter pro file λ 6 = , tends to be mo r e co ns erv a tive than ei- ther Scenar io MT[ t, t ] or MT[ d, t ] . F urthermore, the c hoice of parameter γ G , for the Multiple tests of asso ciation with biolo gic al annotation metadata 201 Fig 5 . GO terms asso ciate d with differ e nt ial gene ex pr ession betwe en BCR/ABL and NEG B-c el l A LL, adjuste d p -values. Plots of sorted b o otstrap-based single-step maxT adjusted p - v alues e P 0 n ( m ), for eac h of the three gene ontologies and eac h of the three testing scenarios. T able 4. GO terms asso c iate d with differ e ntial ge ne expr ession b etwe e n BCR/ABL and NEG B-c el l ALL. This table r eports, for eac h of the three gene ont ologies and eac h of the three testing scenarios, the num bers R n ( α ) = |R n ( α ) | of GO terms found to b e significantly asso ciated with BCR/ABL vs. NEG differen tial gene expression for di fferen t nominal FWER l ev els α . Nominal FWER l eve l, α 0.05 0.10 0.20 0.05 0.10 0.20 0.05 0.10 0.20 MT[ t, t ] 2 6 14 3 4 5 1 1 3 MT[ d, t ] 1 5 16 3 5 7 1 2 4 MT[ 6 = , χ : α = 0 . 05 ] 0 3 5 0 0 0 1 1 1 MT[ 6 = , χ : γ G = 20 ] 0 0 0 0 0 0 1 1 1 MT[ 6 = , χ : γ G = 50 ] 0 0 1 2 2 2 0 0 0 MT[ 6 = , χ : γ G = 100 ] 0 0 2 1 1 2 0 0 0 BP CC MF nu m ber of genes called differentially expressed, ca n have a substantial impact on the a djusted p - v alues for Scenario MT[ 6 = , χ : γ G ] . Ther e ar e some indica tions, esp e- cially for the CC ontology , that greater v alues of the para meter γ G lead to gr eater nu m ber s of iden tified GO terms . No te that for Scenar io M T[ 6 = , χ ] , the p -v alue-based estimator λ 6 = n,α , with α = 0 . 05, a nd the naive estimator λ 6 = n,γ G , with γ G = 20, y ield very s imila r results (gr een and purple plotting sy m bo ls). Indeed, when a pplied to the entire datas e t for the n = 79 cell samples, pe r mut ation-based single-s tep maxT Pro cedure 1 identifies 20 genes as b eing differentially expressed b etw een BCR/ABL and NEG B-cell ALL at nominal FWER level α = 0 . 05 . In other w ords, λ 6 = n, 0 . 05 and λ 6 = n, 20 yield the same estimate of the binary gene-parameter profile λ 6 = for the set of DE genes . Minor disc repancies betw een the results of Scena r ios MT[ 6 = , χ : α = 0 . 0 5 ] 202 S. Dudoit, S. Kele¸ s and M. J. van der L aan Fig 6 . GO terms asso ciated with differ ential gene expr ession b etwe en BCR/ABL and N EG B-cel l ALL, c ommon terms b etwe en testing sc enarios. Plots of num bers of common GO terms among sets of or dered GO terms O n ( r ) of v arious cardinality r for pair s of testing scenarios. Scenario MT[ t, t ] is used as the baseline in the top panels and Scenario M T[ 6 = , χ : α = 0 . 05 ] , with adjusted p -v alue-based estimator λ 6 = n,α , α = 0 . 05, f or the binary DE gene-parameter profile λ 6 = , is used as the baseline in the b ottom panels. F or example, the blue curve in the top-left panel is a plot of O d,t n ( r ) ∩ O t,t n ( r ) vs. r for the MF gene ontology , i.e., of the ov erl ap b et w een the r most significan t MF GO terms according to Scenarios M T[ d, t ] and MT[ t, t ] . and MT [ 6 = , χ : γ G = 20 ] a re due to the fact that while the es timators λ 6 = n, 0 . 05 and λ 6 = n, 20 coincide on the orig inal s ample, they ma y differ on bo ots tr ap samples of these data. Next, the three tes ting scenar ios a re compared in terms of the conten ts of the lists R n ( α ) of identified GO terms. Spec ific a lly , let O n ( r ) ≡ { O n (1) , . . . , O n ( r ) } denote the set of indices c orresp o nding to the r smallest adjusted p -v alues for a given gene ontology and testing scenar io. Measur es of agreement betw een testing scenarios are provided by the num bers of common GO ter ms among sets o f ordered GO terms O n ( r ) o f v ar ious ca rdinality r , i.e., b y the ca rdinality of intersections of sets O n ( r ) fo r different testing scenarios. Fig ur e 6 displays plots of n um ber s of common GO terms for pairs of tes ting scenarios . As exp ected, there is substan tial ov erlap betw een the GO terms ide ntified by Scenar ios M T[ t, t ] and M T[ d, t ] for contin uous DE gene-para meter profiles (blue plotting sym bols in top panels ). This suggests that, for the ALL da taset, standa rdized ( λ t ) a nd unstandardize d ( λ d ) co nt in uous measures of differential g ene ex pression hav e similar pro p er ties. In contrast, there is m uch le ss ov er lap b etw een the GO ter ms identified by Scena rio M T [ 6 = , χ ] , for binary Multiple tests of asso ciation with biolo gic al annotation metadata 203 Fig 7 . GO terms asso ciated with differ ential gene expr ession b etwe en BCR/ABL and N EG B-cel l ALL, c onditional distributi on of λ t n given A . Conditional boxplots of the estimated contin uous DE gene-parameter profile λ t n give n the gene-annot ation profiles A ( · , m ) for the top tw o GO terms m ∈ { O n (1) , O n (2) } iden tified according to each of the three testing scenarios. Ro ws correspond to gene ont ologies and columns to testing scenarios. In eac h panel, the whi te and gra y b oxplots correspond, resp ectively , to the GO terms with the smallest and second smallest adjusted p - v alues; boxplots for unannotated and annotated estimated gene-paramete r profiles, ( λ t n ( g ) : A ( g , m ) = 0) a nd ( λ t n ( g ) : A ( g, m ) = 1), are lab eled as 0 and 1, respectively . Non-ov erl apping notc hes (informally) r epresent l arge differences in medians. DE gene-pa rameter profiles, and e ither Scenar io MT[ t, t ] o r MT [ d, t ] . F or exa mple, for the MF g ene o ntology , among the top 10 GO terms O n (10) identified by each testing scena rio, 6 are common to Scena rios MT[ t, t ] and MT[ d, t ] , wherea s at most 3 ar e common to Scenar ios MT[ t, t ] and MT[ 6 = , χ ] . Again, note the nea r perfect agreement b etw een Scenarios MT[ 6 = , χ : α = 0 . 05 ] a nd MT [ 6 = , χ : γ G = 2 0 ] (purple plotting s ymbols in lower panels). Figure 6 ag a in illustrates the lack of robustness of Scenario MT[ 6 = , χ : γ G ] to the choice of para meter γ G . Moreov er, examine gra phical summaries of the joint distributions of the esti- mated c ontin uo us DE gene- pa rameter profile λ t n and the g ene-annotation pr ofiles A ( · , m ) for the top tw o GO terms m ∈ { O n (1) , O n (2) } identified acco rding to each 204 S. Dudoit, S. Kele¸ s and M. J. van der L aan testing scenario. Figure 7 displays conditiona l b oxplots o f λ t n given A ( · , m ), that is, b oxplots o f the unannotated a nd annotated estimated gene-pa rameter profiles, ( λ t n ( g ) : A ( g , m ) = 0) and ( λ t n ( g ) : A ( g , m ) = 1), resp ectively . Althoug h the b ox- plots reveal clear differ e nc e s (non-ov erlapping notches) between unannotated a nd annotated pro files for some of the GO terms (e.g., MF term GO:00 03735 ), the differ- ences can b e s ubtle for other terms (e.g., MF ter m GO:0 003924 ). No t surprising ly , the mos t extreme differences a re seen for Scenar ios MT[ t, t ] and MT[ d, t ] , and, to a lesser extent, fo r Scenar io MT[ 6 = , χ : α = 0 . 0 5 ] for the CC ontology . The b oxplots again illustrate differences b etw een Sce na rio M T[ 6 = , χ ] a nd either Sce na rio M T[ t, t ] or MT[ d, t ] . T a bles 5 , 6 , and 7 re po rt v arious p -v alue-based mea sures o f a sso ciation b etw een the estima ted DE gene-par ameter profiles λ t n and λ 6 = n,α and the ge ne-annotation profiles A ( · , m ) for the top tw o GO terms m ∈ { O n (1) , O n (2) } identifi ed a ccording to each testing scenar io, in the BP , CC, and MF gene ontologies, resp e c tively . The transformatio n to the [0 , 1] p -v a lue scale a llows a more direct compa rison o f the v ar- ious testing sce narios. The tables aga in highlig ht the differences be t ween Sce nario MT[ 6 = , χ ] , for binar y DE gene-pa rameter pro files, and either Scenario M T[ t, t ] or MT[ d, t ] , for contin uo us DE gene-para meter pr ofiles. As e x pe c ted, Scenarios MT [ t, t ] and MT[ d, t ] tend to ide ntify GO ter ms with small p -v alue s P t,t 0 n ( m ) for t - tests of asso ciatio n b etw e e n estimated contin uous gene-par a meter profiles λ t n and g ene- annotation profiles A ( · , m ). In cont rast, and also as expected, Scenario MT[ 6 = , χ ] tends to iden tify GO terms with small p -v alues P 6 = ,χ 0 n ( m ) for χ 2 -tests of associa - tion betw een es timated binary g ene-parameter profiles λ 6 = n,α and gene-annotation profiles A ( · , m ). F ur thermore, the ta bles corrob o rate our earlier observ ation t hat T able 5. GO terms asso ciate d with differ ential gene expr ession b etwe en BCR/ABL and NEG B- c e l l ALL, top two BP GO t erms. This table pro vides asso ciation measures b etw ee n the estimated DE gene-parameter profiles λ t n and λ 6 = n,α and the gene-annotat ion profiles A ( · , m ) f or the top t wo BP GO terms m ∈ { O n (1) , O n (2) } ident ified according to eac h of the three testing s cenarios. A 1 ( m ) = P g A ( g , m ): N umber of genes dir ectly or indirectly annotated with GO term m (out of G = 2 , 071 genes, GOALLLO CUSID environmen t in GO p ac k age). P t,t 0 n ( m ): Nominal unadjusted p -v alue f or the tw o-sample t -test comparing the unannotated and annotated estimated contin uous DE gene-parameter profiles, ( λ t n ( g ) : A ( g, m ) = 0) and ( λ t n ( g ) : A ( g , m ) = 1), respectively ( t.test function from the R pac k age stats , with default argument v alues). P 6 = ,χ 0 n ( m ): Unadjusted p -v alue for the χ 2 -test of independence b et w een the estimated binary DE gene-parameter profile λ 6 = n,α , α = 0 . 05, and the gene-annotat ion profile A ( · , m ) ( chisq. test function f r om the R pack age stats , with argumen ts simulate.p .value = TRUE , correct=FALSE ). e P 0 n ( m ): Bootstrap-based si ngle-step maxT adjusted p -v alue, according to which the top tw o GO terms ar e iden tified for eac h testing scenario. BP Scenario GO term A 1 ( m ) P t,t 0 n ( m ) P 6 = ,χ 0 n ( m ) e P 0 n ( m ) MT[ t, t ] GO:00081 52 1076 2 .5e-09 1.7e-01 2.6e-02 GO:00442 37 1045 3.8e-08 1.8e-01 4.3e-02 MT[ d, t ] GO:00060 91 98 5.2e-06 6.3e-01 3.7e-02 GO:00002 26 14 1.8e-03 1.0e+00 5 .8e-02 MT[ 6 = , χ : α = 0 . 05 ] GO:0008361 27 5.5e-02 3.5e-03 8.3e-02 GO:00160 49 27 5.5e-02 1.5e-03 8.3e-02 MT[ 6 = , χ : γ G = 20 ] GO:0008361 27 5.5e-02 4.0e-03 2.1e-01 GO:00160 49 27 5.5e-02 1.5e-03 2.1e-01 MT[ 6 = , χ : γ G = 50 ] GO:0048522 87 3.6e-02 6.5e-03 1.9e-01 GO:00485 18 96 4.4e-02 1.3e-02 2.3e-01 MT[ 6 = , χ : γ G = 100 ] GO:0050793 24 8.5e-02 1.7e-02 1.5e-01 GO:00071 55 59 5.9e-04 1.2e-01 2.0e-01 Multiple tests of asso ciation with biolo gic al annotation metadata 205 T able 6. GO terms asso c iate d with differ e ntial ge ne expr ession b etwe e n BCR/ABL and NEG B-c el l ALL, top two CC GO terms. Details in T able 5 caption. CC Scenario GO term A 1 ( m ) P t,t 0 n ( m ) P 6 = ,χ 0 n ( m ) e P 0 n ( m ) MT[ t, t ] GO:00058 40 25 1.3e-08 1.0e+00 5 .6e-03 GO:00305 29 77 3.1e-10 6.4e-01 1.4e-02 MT[ d, t ] GO:00058 40 25 1.3e-08 1.0e+00 4 .0e-03 GO:00058 30 11 2.8e-05 1.0e+00 5 .2e-03 MT[ 6 = , χ : α = 0 . 05 ] GO:0005578 10 1.7e-02 1.0e-01 4.9e-01 GO:00310 12 10 1.7e-02 1.1e-01 4.9e-01 MT[ 6 = , χ : γ G = 20 ] GO:0005578 10 1.7e-02 1.0e-01 3.5e-01 GO:00310 12 10 1.7e-02 9.2e-02 3.5e-01 MT[ 6 = , χ : γ G = 50 ] GO:0005576 54 9.1e-04 1.0e+00 7.8e-03 GO:00056 15 31 4.8e-02 2.4e-01 7.8e-03 MT[ 6 = , χ : γ G = 100 ] GO:0005576 54 9.1e-04 1.0e+00 4.9e-02 GO:00056 15 31 4.8e-02 2.6e-01 1.3e-01 T able 7. GO terms asso c iate d with differ e ntial ge ne expr ession b etwe e n BCR/ABL and NEG B-c el l ALL, top two M F GO terms. Details in T able 5 caption. MF Scenario GO term A 1 ( m ) P t,t 0 n ( m ) P 6 = ,χ 0 n ( m ) e P 0 n ( m ) MT[ t, t ] GO:00037 35 24 1.1e-09 1.0e+00 2 .4e-03 GO:00037 23 143 1 .5e-06 4.1e-01 1.2e-01 MT[ d, t ] GO:00037 35 24 1.1e-09 1.0e+00 2 .2e-03 GO:00037 23 143 1 .5e-06 3.8e-01 7.8e-02 MT[ 6 = , χ : α = 0 . 05 ] GO:0004930 10 2.2e-01 3.0e-03 3.7e-02 GO:00039 24 34 6.5e-01 3.9e-02 7.0e-01 MT[ 6 = , χ : γ G = 20 ] GO:0004930 10 2.2e-01 3.0e-03 1.7e-02 GO:00039 24 34 6.5e-01 3.8e-02 6.2e-01 MT[ 6 = , χ : γ G = 50 ] GO:0004930 10 2.2e-01 3.5e-03 4.1e-01 GO:00302 46 22 8.6e-01 2.0e-01 4.8e-01 MT[ 6 = , χ : γ G = 100 ] GO:0005509 69 3.8e-04 1.3e-01 3.1e-01 GO:00049 30 10 2.2e-01 1.5e-03 3.3e-01 Scenario MT[ 6 = , χ ] tends to b e mo re co nserv a tive than either Scenar io MT [ t, t ] or MT[ d, t ] . Indeed, some of the GO terms with s mall p -v alues P t,t 0 n ( m ) for c ontin uo us gene-para meter pr ofiles hav e very la r ge p -v alues P 6 = ,χ 0 n ( m ) for binar y gene-para meter profiles (e.g., MF term GO:0003 735 in T able 7 ). Suc h terms are likely to b e iden tified by Scenarios MT[ t, t ] and MT[ d, t ] , but miss ed by Scenario MT [ 6 = , χ ] . The converse phenomenon is not as striking . How ever, o ne should keep in mind that Scenar io MT[ 6 = , χ ] dep ends o n the choice of estimator for the binary DE gene-parameter profile λ 6 = , i.e., on parameter s such as α a nd γ G . In particula r , with cer tain v alues of α (or γ G ), binary Scenar io MT [ 6 = , χ ] may b ecome more similar to either con- tin uous Scenar io MT[ t, t ] or MT[ d, t ] . Column A 1 ( m ) in T ables 5 – 7 sugg ests that, compared to Scenar io MT[ 6 = , χ ] , Scenarios MT[ t, t ] and MT[ d, t ] tend to iden tify GO terms annotating a gr eater num ber of ge nes (this observ ation also holds for the top 20 terms identified according to each testing scenario; data not shown). Figure 8 displays a scatter plo t matrix of the 50 smallest adjusted p -v a lues, based on Sc e na rio MT[ t, t ] , for each of the three gene ontologies. The plots indicate that more ter ms tend to b e identified in the BP ontology co mpared to either the CC or MF ont ologies, and fewer terms tend to be identified in the MF ontology compar ed to either the B P or CC ontologies. Note that compa risons bas ed on adjusted p -v alues 206 S. Dudoit, S. Kele¸ s and M. J. van der L aan Fig 8 . GO terms asso ciated with differ ential gene expr ession b etwe en BCR/ABL and N EG B-cel l ALL, c omp arison of adjuste d p -v alues for the thr e e gene ontolo gies. Scatterplot m atrix of the 50 smallest adjusted p -v alues for each of the three gene on tologies, based on Scenario MT[ t, t ] . The iden tit y line is dr a wn f or reference. take in to account differences in the num b ers of tested hypotheses, M B P = 367, M C C = 81 , a nd M M F = 185, for ea ch on tology . T a bles 8 , 9 , and 10 list the 20 GO terms with the sma llest adjusted p -v alues for Scenar io MT [ t, t ] , applied to the BP , CC, and MF gene ontologies, res pec - tively . Figures 9 , 10 , and 11 display p ortions of the dire cted acyclic graphs for the top 20 GO terms in each ontology . The figures suggest that GO terms asso- ciated with BCR/ABL vs. NEG differen tial gene e xpression tend to concen trate in certain branches of the DA Gs, i.e., differential ex pression is asso ciated with re- lated prop erties of gene pr o ducts. Although it is known that many of the effects o f the BCR/ABL fusion are mediated by tyrosine kinase activ ity , the MF GO term protein-tyrosine kinase activity ( GO:0004 713 ) do es not app ear to b e significa ntly asso ciated with differential gene expression b et ween B CR/ABL and NEG B-cell ALL (adjusted p -v alue of 0.8890 for Scenario M T[ t, t ] ). F or illustra tion purp oses, we further inv estigate t w o of the GO terms from T a- bles 8 and 10 : GO term anti-apopto s is ( GO:000 6916 ), with ninth smallest adjusted p -v alue for Scenario M T[ t, t ] a pplied to the BP gene o ntology , a nd GO ter m struc- tural co nstituen t of rib osome ( GO:0 00373 5 ), with the smallest adjusted p - v alue for Scenario MT[ t, t ] a pplied to the MF gene o nt ology . T ables 11 and 1 2 list genes directly o r indirectly a nnotated with GO terms GO:0 00691 6 and GO :00037 35 , re- sp ectively . Fig ure 12 displays mea n-difference plots o f the average expression mea- sures in BCR/ABL and NEG cell samples for ge ne s annotated with GO terms GO:000 6916 and GO:0 00373 5 . Multiple tests of asso ciation with biolo gic al annotation metadata 207 T able 8. GO terms asso c iate d with differ e ntial ge ne expr ession b etwe e n BCR/ABL and NEG B-c el l ALL, top 20 BP GO terms. This table lists the 20 GO terms with the smallest adjusted p -v alues for Scenario MT[ t, t ] applied to the BP gene ontology . A 1 ( m ) = P g A ( g , m ): Num ber of genes dir ectly or indirectly annotated with GO term m (out of G = 2 , 071 genes, GOALLLOCUSID en vironmen t i n GO pack age). e P 0 n ( m ): Bo otstrap-based single-step maxT a djusted p - v alue for Scenario MT[ t, t ] . BP , Scenario MT[ t, t ] GO t erm ID GO ter m A 1 ( m ) e P 0 n ( m ) GO:00815 2 metab olism 1076 2.6e-02 GO:04423 7 cellular metabolism 1045 4.3e-02 GO:00905 8 biosynthesis 187 7.5e-02 GO:04423 8 pri mary metabolism 1002 7.5e-02 GO:04424 9 cellular biosyn thesis 169 8.6e-02 GO:00609 1 generation of precursor metabolites and energy 98 9.3e-02 GO:01988 2 antigen presentat ion 15 1.1e-01 GO:03033 3 antigen pro cessing 14 1.4e-01 GO:00691 6 anti-apoptosis 21 1.6e-01 GO:04306 6 negative regulation of ap optosis 26 1.7e-01 GO:04306 9 negative regulation of programmed cell death 26 1.7e-01 GO:00715 4 cell comm unication 390 1.8e-01 GO:00645 7 protein folding 52 1.9e-01 GO:00716 5 si gnal transduction 351 1.9e-01 GO:00022 6 mi crotubule cytosk eleton organization and biogenesis 14 2.3e-01 GO:00608 2 organic acid metab olism 65 2.5e-01 GO:00616 3 puri ne nuc leotide m etabolism 29 2.8e-01 GO:00715 5 cell adhesion 59 2.8e-01 GO:00702 8 cytoplasm organization and biogenesis 10 3.0e-01 GO:01975 2 carb oxylic acid metabolism 63 3.1e-01 T able 9. GO terms asso c iate d with differ e ntial ge ne expr ession b etwe e n BCR/ABL and NEG B-c el l ALL, top 20 CC GO terms. Details in T able 8 caption. CC, Scenari o MT[ t, t ] GO t erm ID GO t erm A 1 ( m ) e P 0 n ( m ) GO:00058 40 rib osome 25 5.6e-03 GO:00305 29 rib onu cleoprotein complex 77 1.4e-02 GO:00058 30 cytosolic r ib osome (sensu Euk ary ota) 11 1.4e-02 GO:00432 34 protein complex 334 7.8e-02 GO:00058 86 plasma m em brane 200 1.3e-01 GO:00058 29 cytosol 78 2.2e-01 GO:00057 37 cytoplasm 578 2.3e-01 GO:00058 87 int egral to plasma m em brane 125 2.3e-01 GO:00312 26 int rinsic to plasma m em brane 125 2.3e-01 GO:00198 66 inner m em brane 37 2.6e-01 GO:00057 43 mitochondrial inner mem brane 28 2.6e-01 GO:00057 46 mitochondrial electron transpor t chain 11 2.7e-01 GO:00005 02 proteasome complex (sensu Euk ary ota) 26 2.7e-01 GO:00003 23 lytic v acuole 28 2.9e-01 GO:00057 64 lysosome 28 2.9e-01 GO:00055 76 extracellular r egion 54 3.1e-01 GO:00057 73 v acuole 29 3.2e-01 GO:00056 22 int racellular 1152 3.4e-01 GO:00432 28 non-mem brane-bound organelle 218 3.5e-01 GO:00432 32 int racellular non-membrane-bound organelle 218 3.5e-01 208 S. Dudoit, S. Kele¸ s and M. J. van der L aan T able 1 0. GO te rms asso c iate d with differ ential gene e xpr ession b etwe en BCR/ABL and NEG B-c el l ALL, top 20 MF GO terms. Details in T able 8 caption. MF, Scenario MT [ t, t ] GO t erm ID GO t erm A 1 ( m ) e P 0 n ( m ) GO:00037 35 structural constitu en t of rib osome 24 2.4e-03 GO:00037 23 RNA bi nding 143 1.2e-01 GO:00480 37 cofactor binding 11 1.5e-01 GO:00510 82 unfolded pr otein binding 47 2.2e-01 GO:00168 53 isomerase activity 28 2.3e-01 GO:00164 91 oxidoredu ctase activity 89 3.5e-01 GO:00055 09 calcium ion binding 69 3.5e-01 GO:00153 99 primary active transp orter activit y 57 4.3e-01 GO:00048 72 receptor activity 101 4.5e-01 GO:00048 71 signal transducer activit y 242 4.6e-01 GO:00167 65 transferase activity , transferri ng alkyl or aryl (other than meth yl) groups 10 4.6e-01 GO:00168 60 intramolecular o xidoreductase activity 13 4.6e-01 GO:00166 14 oxidoredu ctase activity , acting on CH-OH group of donors 18 4.7e-01 GO:00166 16 oxidoredu ctase activit y , act ing on the CH-OH group of donors, NAD or NAD P as acceptor 18 4.7e-01 GO:00431 69 cation binding 230 5.0e-01 GO:00054 89 electron transp orter activit y 47 5.4e-01 GO:00053 86 carrier activity 73 5.5e-01 GO:00048 88 transmembrane receptor activity 59 5.7e-01 GO:00038 24 catalytic activity 635 5.8e-01 GO:00036 76 nuc leic acid binding 449 6.7e-01 Panel (a) in Figure 12 indicates that gene s a nnotated with BP GO term anti- ap optosis ( GO:000 6916 ) tend to be ov er-express ed in BCR/ABL compared to NEG cell samples. Among these 2 1 genes, only SOCS2 is significan tly diff erentially ex - pressed b etw een B C R/ ABL a nd NE G B- cell ALL (nomina l FWER level α = 0 . 05, T a ble 3 ). Howev er, a brief sur vey o f the literature reveals that several of the genes in T a ble 1 1 interact with the BCR/A BL pr o to-oncog ene. F or instance, [ 27 ] inv estigate mechanisms for the BCR/AB L -mediated activ a tion of the transcr iption f actor NF- κ B/Rel enco ded by the NFKB1 ge ne . Their find ings sug gest that NF - κ B/Rel may be a p otential target for molecula r therapies of le ukemia. [ 30 ] demonstra te that ectopic expr ession o f BCR/ ABL interferes with the tu mor necrosi s fac tor ( TNF ) signaling path w ay through the down-regulatio n of TNF receptors. The TNF gene enco des a multifunct ional proinflamma to ry cytokine inv olved in the reg ula tion of a wide sp ectrum of biolo g ical pro cesses, including cell prolifera tion, differen tiation, ap optosis, lipid meta bo lism, and coagula tion. The TNF gene has be en implicated in a v a riety o f diseases , including autoimmune diseas e s , ins ulin resistance, and can- cer. As s e en in T able 12 , 2 2 of the 24 genes annotated with MF GO term structura l constituent of rib oso me ( GO:0 00373 5 ) code for rib oso ma l proteins. Although none of the 24 a nno tated genes is iden tified as being significantly differentially expressed betw een BCR/ABL and NEG B- cell ALL (no minal FWE R level α = 0 . 05, T able 3 ), Panel (b) in Fig ur e 12 sugges ts tha t these g e ne s tend to b e under -expresse d in BCR/ABL cell samples . Multiple tests of asso ciation with biolo gic al annotation metadata 209 Fig 9 . GO terms asso ciated with differ ential gene expr ession b etwe en BCR/ABL and N EG B-cel l ALL, DAG f or top 20 BP GO t erms. Portion of the directed acyclic graph for the 20 GO terms with the smal lest adjusted p -v alues for Scenario M T[ t, t ] applied to the BP gene on tolog y . No des for the top 20 terms are shaded in lav ender; blac k and r ed edges indicate, r espectively , “is a” and “part of a” relationships among terms. The figure was pro duced using the QuickGO browser. According to QuickGO, the GO term IDs GO:019882 and GO:0030333 listed in T able 8 corresp ond to the same term, an tigen pro cessing and presen tation . (Higher-resolution color v ersion on we bsite companion.) 6. Di scussion W e have prop os ed a gener al and formal statistical fr amework for m ultiple tests o f asso ciatio n with biolo gical anno ta tion metadata . A k ey comp onent of o ur appr oach is the sy stematic and precise tra ns lation of a g eneric biolog ical question int o a cor- resp onding m ultiple hypothesis testing pro blem, c o ncerning associa tion measures betw een known ge ne - annotation pro files and unknown gene-pa r ameter profiles. This general and rigo r ous formulation of the sta tis tica l inference question allows us to apply the multiple hypothesis testing meth o dology dev elop ed in [ 14 ] and related articles, to control a broad class of Type I er ror ra tes, in testing problems in v olving general data generating dis tr ibutions (with a rbitrary de p endence s tructures a mong v aria bles), nu ll hypotheses, and test s tatistics. The fle x ibilit y of our a pproach w as illustr a ted using the ALL microar r ay dataset of [ 13 ], with the a im o f relating GO a nnotation to differential g ene ex pression be- t ween BCR/ABL and NEG B-cell ALL. This analy sis demonstrates the impor- tance of selecting a suitable DE gene-parameter profile λ and mea sure ρ for the asso ciatio n b etw een this gene-par ameter profile and GO gene-a nno tation pro files A . Indeed, for the ALL dataset, the c hoice of gene-parameter pr ofile for mea sur- 210 S. Dudoit, S. Kele¸ s and M. J. van der L aan Fig 1 0 . GO terms asso ciate d with differ ential gene ex pr ession b e twe e n BCR/ABL and NEG B- c e l l ALL , DA G for t op 20 CC GO terms. Portion of the dir ected acyclic graph for the 20 GO terms with the smallest adjusted p -v al ues for Scen ario MT[ t, t ] applied to the CC gene ontology . Nodes for the top 20 terms are shaded in lav ende r; black and red edges indicate, resp ectively , “is a” and “part of a” relationships among terms . The figure was pro duced using the Qui ckGO browser. (Higher-resolution color v ersion on web site companion.) ing differential expression be tw een BCR/ABL and NEG B-cell ALL has a larg e impact o n the list of iden tified GO terms. T esting scenar ios based on binar y DE Multiple tests of asso ciation with biolo gic al annotation metadata 211 Fig 1 1 . GO terms asso ciate d with differ ential gene ex pr ession b e twe e n BCR/ABL and NEG B- c e l l ALL , DA G for top 20 MF GO terms. Portion of the dir ected acyclic graph f or the 20 GO terms with the smal l est adjusted p -v alues for Scenario MT[ t, t ] applied to the MF gene on tology . Nodes for the top 20 terms are shaded in lav ende r; black and red edges indicate, resp ectively , “is a” and “part of a” relationships among terms . The figure was pro duced using the Qui ckGO browser. (Higher-resolution color v ersion on web site companion.) Fig 12 . GO terms asso ciate d with differ ent i al gene expr ession b etwe en BCR/ABL and NEG B-c el l ALL , BP GO term GO:0 006916 and MF GO t erm GO:0003735 . This figure displays mean- difference pl ots of av erage expression measures in B C R /ABL and NEG cell samples, i. e., plots of µ BC R/ ABL,n ( g ) − µ N EG,n ( g ) vs. ( µ BC R/ ABL,n ( g ) + µ N EG,n ( g )) / 2, for genes directly or indirectly annotate d with GO terms GO:0006 916 (Pane l (a)) and GO:000 3735 (Pane l (b)). The term ant i- apoptosis ( GO:0006916 ) has the ninth smallest adjusted p -v alue f or Scenario MT[ t, t ] applied to the BP gene on tology (T ables 8 and 11 ) and the term structural constituen t of rib osome ( GO:0003735 ) has the smallest adjusted p -v alue for Scenario MT[ t, t ] applied to the MF gene on tology (T ables 10 and 12 ). gene-para meter profiles (Scenario M T[ 6 = , χ ] ) tended to b e more co nserv ativ e than scenarios based on contin uous DE g ene-parameter profiles (Scenarios MT[ t, t ] and MT[ d, t ] ), with little overlap b etw een the lists of iden tified GO terms. F urther more, testing scenarios based on binary gene-pa rameter profiles were sens itive to the so me- what a rbitrary DE/non- DE g ene dichotomization, that is, Scena rio MT[ 6 = , χ : γ G ] lack ed robustnes s with respect to th e c hoice o f parameter γ G for the n umber of genes called differentially expr essed a c c ording to the estima to r λ 6 = n,γ G . In contrast, 212 S. Dudoit, S. Kele¸ s and M. J. van der L aan T able 1 1. GO te rms asso c iate d with differ ential gene e xpr ession b etwe en BCR/ABL and NEG B-c el l ALL , BP GO term GO:0006916 . This table li sts genes directly or indirectly annotated with GO term anti-apoptosis (out of G = 2 , 071 genes, GOALLLOCUSID environmen t in GO pac k age). The term anti-apoptosis ( GO:0006916 ) has the ninth smal l est adjusted p -v alue f or Scenario MT[ t, t ] applied to the BP gene ontology (T able 8 ). BP GO:0006916 Prob e ID Symbol Nam e 1237 at IER3 immediate early response 3 1295 at RELA v-rel reticuloendoth eliosis viral oncogene homolog A, nuclear factor of kappa light polypeptide gene enhancer in B-cells 3, p65 (avian) 1377 at NFKB1 n uclear factor of kappa light polypeptide gene enhancer in B-cells 1 (p105) 1564 at AKT1 v-akt murine thymoma viral oncogene homolog 1 1830 s at TG FB1 tra nsformin g growth factor , beta 1 (Camurat i-Engelm ann disease) 1852 at TNF tumor necrosis factor (TNF superfamily , member 2) 1997 s at BA X BCL2-assoc iated X prot ein 277 at MCL1 myeloid cell leukemia sequence 1 (BCL2-related ) 31536 at RTN4 reticulo n 4 32060 at BNIP2 BCL2/aden ovirus E1B 19 kDa interacting protein 2 33284 at MPO myeloperoxidase 36578 at BIRC2 baculovir al IAP repeat-containin g 2 38578 at TNFRSF7 tumor necrosis factor receptor superfamily , member 7 38771 at HDAC1 histone deacetyl ase 1 38994 at SOCS2 suppresso r of cytokine signaling 2 39097 at SON SON DNA binding protein 39378 at BECN1 beclin 1 (coiled-coi l, myosi n-like BCL2 interacting protein) 39436 at BNIP3L BCL2/ade novirus E1B 19 kDa interacting protein 3-like 40570 at FOXO1A forkhead box O1A (rhabdomyo sarcoma) 595 at TNFAIP3 tumor necrosis factor, alpha-induced protein 3 641 at PSEN1 p resenili n 1 (Alzheimer disease 3) contin uo us gene-pa rameter pro files based on standardiz e d and unsta ndardized mea - sures o f differential ge ne expression lea d to very simila r res ults (Scenar ios MT[ t, t ] and MT[ d, t ] ). Our ana lysis of the ALL microa rray dataset clear ly shows the limitations o f bi- nary gene-para meter profiles of differ ent ial expression indica tors, which a r e still the norm for combined GO anno tation and microar ray data analyses. O ur pro - po sed statistical framework, with general definitions for the gene-annotation and gene-para meter profiles, a llows co ns ideration of a muc h broader class of inference problems, that extend b eyond GO annotation and microar ray data analysis. Gene- annotation profiles may b e contin uous or p olychotomous and may cor resp ond, for example, to exo n/ int ron counts/lengths/n ucleotide distributio ns , gene pathw a y mem ber ship, or gene regulatio n b y particular tra nscription factors. Likewise, gene- parameter pr ofiles may be c o ntin uo us or p o ly chotomous a nd may corr esp ond, for example, to re gressio n co efficien ts relating p ossibly censore d bio logical and clinical outcomes to genome- wide transcr ipt levels, DNA copy num bers , a nd other cov ari- ates. This first application of our prop osed methodolog y only considere d co nt rol of the family- wis e er ror rate using single-step common- cut-off maxT Pro cedur e 1, based on the non- parametric b o otstrap null shift and scale - transformed test statis- tics null distribution of P ro cedure 2 . Adjusted p -v alues tended to b e quite larg e, with only a handful o f GO ter ms ident ified as b eing sig nifica ntly asso ciated with Multiple tests of asso ciation with biolo gic al annotation metadata 213 T able 1 2. GO te rms asso c iate d with differ ential gene e xpr ession b etwe en BCR/ABL and NEG B-c el l ALL , MF GO term GO:0003735 . This table lists genes directly or indirectly annotated with GO term structural constituen t of rib osome (out of G = 2 , 071 genes, GOALLLOCUSID environmen t in GO pac k age). The term structural constituen t of rib osome ( GO:0003735 ) has the smallest adjusted p -v alue for Scena rio MT[ t, t ] applied to the MF gene on tology (T able 10 ). MF GO:0003735 Prob e ID Sym bo l Name 2016 s at RPL10 ribosoma l protein L10 31511 at RPS9 ribosoma l protein S9 31546 at RPL18 ribosoma l protein L18 31955 at FAU Finkel-Bis kis-Reil ly murine sarcoma virus (FBR-MuSV) ubiquito usly expressed (fox derived) 32221 at MRPS18B mitochon drial ribosomal protein S18B 32315 at RPS24 ribosoma l protein S24 32394 s at RPL23 ribosoma l protein L23 32433 at RPL15 ribosoma l protein L15 32437 at RPS5 ribosoma l protein S5 33117 r at RPS12 ribosoma l protein S12 33485 at RPL4 ribosoma l protein L4 33614 at RPL18A ribosomal protein L18a 33661 at RPL5 ribosoma l protein L5 33668 at RPL12 ribosoma l protein L12 33674 at RPL29 ribosoma l protein L29 34316 at RPS15A ribosomal protein S15a 36358 at RPL9 ribosoma l protein L9 36572 r at ARL6IP ADP-ribosylatio n factor-li ke 6 int eracting protein 36786 at RPL10A ribosomal protein L10a 39856 at RPL36AL ribosoma l protein L36a-like 39916 r at RPS15 ribosoma l protein S15 41152 f at RPL36A ribosomal protein L36a 41214 at RPS4Y1 ribosomal protein S4, Y-linked 1 41746 at NHP2L1 NHP2 non-histone chromosome protein 2-like 1 (S. cerevisi ae) BCR/ABL vs. NE G different ial gene e x pression. Joint augmentation and empirical Bay es pro cedures co uld b e used for co nt rol of a bro a der a nd more biologic ally rele- v ant class of T ype I erro r r ates, defined as generalized tail pr obabilities, g T P ( q , g ) = Pr( g ( V n , R n ) > q ), and generalized expected v alues, g E V ( g ) = E[ g ( V n , R n )], for arbitrar y functions g ( V n , R n ) of the num b er s of fals e p os itives V n and rejected hypotheses R n (Chapters 6 a nd 7 in [ 14 ], [ 15 , 39 , 40 ]) . Error rates based on the prop ortion V n /R n of false p o sitives (e.g., TPP FP and FDR) ar e esp ecially a ppe al- ing fo r large-sca le testing pro blems, compar ed to error r ates bas e d on the num ber V n of fals e p ositives (e.g., g FWER), as they do not increase exp onentially with the num b er M o f tested h ypo theses. More p owerful analys e s may also b e achiev ed with the new null quantile-transformed test statistics n ull distr ibution o f [ 42 ]. The m ultiple testing metho do logy developed in [ 14 ] and rela ted articles is par ticula rly well-suited to handle the v a riety o f parameter s of in terest and the complex and unknown dep endence structure s among test statistics (e.g., implied b y the D AG structure of GO terms) that are likely to b e encountered in high-dimensional infer- ence problems in biomedical and genomic resea rch. Note that for asymptotic r e sults, such as consistency or asymptotic linea rity , the sample s ize n refers to the num b er o f observ ational units sampled from the po pulation of in terest to estimate the g ene-para meter profiles, e.g., the num ber of patients in a cancer microar ray study . While th e sample size n is t ypically muc h 214 S. Dudoit, S. Kele¸ s and M. J. van der L aan smaller than the dimension J of the data structure X , s ample sizes hav e cons ider- ably increased in recent genomic applications. In addition, simulation studies hav e indicated that our prop osed MTPs hav e g o o d finite sample prop erties in terms of bo th Type I err or c o ntrol and p ow er. Ongoing effor ts inc lude co nsideration of more genera l and biologically per tinent m ultiv aria te asso ciation measures ρ . F or ins tance, fo r GO annotation metadata, the asso ciatio n para meter for a given GO term co uld take into ac c ount the s tr ucture of the DA G by considering the gene-annotatio n profiles of offspring or ancestor terms. W e ar e also interested in developing better numerical and graphical appro aches for repres e n ting a nd interpreting the mult iple testing results, e.g., the lists of GO terms and asso ciated adjusted p -v alues. Finally , we ar e planning on implementing the pro p o sed metho ds in an R pack age to be relea sed as par t of the Bio conductor Pro ject. Soft w are a nd website companion The multiple testing pr o cedures prop osed in [ 14 ] and r elated articles [ 8 , 15 , 16 , 31 , 32 , 3 3 , 34 , 39 , 40 , 4 1 , 42 ] are implemented in the R pa ck a ge multtest , releas e d a s part of the Bio conducto r Pr o ject, an open- source softw are pr o ject for the analy s is of biomedical and geno mic data ([ 14 , Sectio n 1 3 .1]; [ 32 ]; www.bio condu ctor.org ). The ex p er iment al data ( ALL ) and annota tion metadata ( annaffy , annotate , GO , hgu95av2 ) pack a ges used in the analys is of Section 5 may also be o btained from the Bio conductor Pr o ject website. The website companion to [ 14 ] provides additional tables , figures, co de, and references: ww w.stat .berk eley.edu/~sandrine/MTBook . Ac kno wle d g men ts. W e ar e most grateful to Ro ber t Gentleman (F red Hutchin- son Cancer Research Center) for man y s timulating dis cussions on statistical and computational metho ds for the analysis of biological annotation metadata. W e hav e also m uc h appre ciated Evelyn Camo n’s (Euro p ean Bio info r matics Ins titute) advice regar ding the QuickGO bro wser. Finally , we would lik e to thank an anonymous referee for cons tr uctive comments on an earlier version of this manuscript. References [1] Al-Shahrour, F. , D ´ ıaz-Uriar te, R. and Dop azo, J. (2004 ). F atiGO: A w eb to ol for find ing significant asso ciations of Gene On tology terms with groups of genes. Bioinformatics 20 578– 580. [2] Al-Shahrour, F., Minguez, P . , V aquerizas, J. M. , Con d e, L. and Dop azo, J. (2005 ). BABE LOMICS: A suite of web to o ls for functiona l anno- tation and analys is of gr oups of genes in high-thro ug hput expe riments. Nucleic A cids R ese ar ch 33 W460 –W464. [3] Banelli, B., Casciano, I., Cr oce, M., Vinci, A. D., Gel vi, I., P ag- nan, G. , Brignole, C ., A llemanni, G. , Ferri ni, S. , Pon z oni, M. and R omani, M. (2 002). Express ion a nd meth ylation of CASP 8 in neuroblasto ma: Ident ification of a pro moter r e g ion. Natur e Me dicine 8 1333 –1335 . Multiple tests of asso ciation with biolo gic al annotation metadata 215 [4] Beissbar th, T. and Speed, T. P. (200 4 ). GOstat: Find statistica lly ov er- represented Gene On tologies within a group of genes. Bioinformatics 20 1464– 1465. [5] Birkner, M. D., Cour tine, M., v an der Laan, M. J., Cl ´ ement, K., Zucker, J.-D. an d Dud o it, S. (In pr eparation). Statistical metho ds for detecting genotype/pheno type asso ciations in the Ob eLinks Pr o ject. T ec hni- cal re po rt, Division o f Biostatistics , Univ. California , B e rkeley , Ber keley , CA 94720 -7360 . [6] Birkner, M. D. , Hubbard, A . E. and v an der Laan, M. J. (200 5a). Application of a multiple testing pro cedure controlling the prop o rtion o f false po sitives to protein and bacterial da ta . T echnical Repo rt 18 6, Division of B io - statistics, Univ. Califor nia, Berkeley , Berkeley , CA 94720- 7360 . [7] Birkner, M. D., Hubbard, A. E., v an der Laan, M. J., Skibola, C. F., Hegedus, C. M. and Smith, M. T. (20 0 6). Issues o f pro cessing and mu ltiple testing o f SELDI-TOF MS pro teomic da ta. S tatistic al Applic ations in Genetics and Mole cular Biolo gy 5 Article 11. MR22212 95 [8] Birkner, M. D., Pollard, K. S., v an d er Laan, M. J. an d Dud oit, S. (2005b). Multiple testing pro ce dures and applications to geno mics. T echnical Repo rt 16 8, Division of Bio statistics, Univ. Ca lifornia, Berkeley , Ber keley , CA 94720 -7360 . [9] Birkner, M. D. , Sinisi, S. E . and v an der L aan, M. J. (2005c). Multiple testing and da ta adaptive r egress io n: An applica tion to HIV-1 sequence data. Statistic al Applic ations in Genetics and Mole cu lar Biolo gy 4 Article 8. [10] Blanchette, M., Green, R. E ., Brenner, S. E. and Rio, D. C. (2005). Global analysis of p ositive a nd nega tive pr e -mRNA s plicing r egulator s in Dr oso phila . Genes and Development 19 13 06–13 14. [11] Bolst ad, B. M., I rizarr y, R. A., G autier, L. a n d Wu, Z. (200 5). Pre- pro cessing high-density olig onucleotide arrays. In Bioinformatics and Com- putational Biolo gy Solutions Using R and Bio c onductor (R. C. Gent leman, V. J. Ca rey , W. Huber , R. A. Irizarr y and S. Dudoit, eds.) Chapter 2 13– 32. Springer, New Y o rk. MR22018 36 [12] Bonferroni, C. E. (19 36). T eoria statistica delle classi e calcolo delle pro b- abilit` a. Pubblic azioni del R Istituto Sup erior e di Scienze Ec onomiche e Com- mer ciali di Fir enze , 3 – 62. [13] Chiaretti, S., Li, X., G entleman, R., Vit ale, A., V ignetti, M., Man- delli, F. , Ritz, J. and Fo a, R. (2004 ). Gene expression profile of adult T-cell ac ute lympho cytic leukemia iden tifies distinct subsets of pa tient s with different resp ons e to ther apy and surviv al. Blo o d 103 2771 –2778 . [14] Dudoit, S. and v an der Laan , M. J. (2008 ). Multiple T esting Pr o c e dur es with Applic ations to Genomics . Springer , New Y o rk. [15] Dudoit, S., v an der Laan, M. J. and Birkner, M. D. (2004 a). Multiple testing pro c edures for controlling tail pro bability err or rates . T echnical Rep ort 166, Division of Biostatistics, Univ. Califor nia, Berkeley , Berkeley , CA 94 720- 7360. [16] Dudoit, S. , v an der Laan, M. J. an d Pollard, K. S. (2004b). Multiple testing. Pa rt I. Single-step pro ce dures for con trol of g eneral Typ e I err or rates. Statistic al Applic ations in Genetics and Mole cu lar Biolo gy 3 Article 13 . [17] Gentleman, R. C., Carey, V. J., Huber, W., Irizarr y, R. A. and Du- doit, S. , editors (2005a). Bioi nformatics and Computational Biolo gy Solu- tions U sing R and Bio c onductor. Statistics for Bi olo gy and He alth. Springer, New Y o rk. MR22018 36 216 S. Dudoit, S. Kele¸ s and M. J. van der L aan [18] Gentleman, R. C., Carey, V. J. and Zhang, J. (2005b). Meta-data re- sources and to o ls in Bio co nductor. In Bioinformatics and C omputational Bi- olo gy S olutions Using R and Bio c onductor (R. C. Gent leman, V. J. Car e y , W. Huber , R. A. Irizarry and S. Dudoit, eds.) Chapter 7 111–1 33. Spring er, New Y or k. [19] Gill, R. D. (1989). Non- a nd semi-par a metric ma x im um likelihoo d es timators and the von Mises metho d. I. Sc and. J. Statist. 16 97–12 8. (With a discussion by J. A. W ellner and J. Pr æstgaar d and a reply by the author ). MR10289 71 [20] Gill, R. D. , v an der Laan, M. J. and Wellner, J. A . (1995). Inefficient estimators of the biv ariate surviv al function for three models. A nn. Inst. H. Poinc ar´ e Pr ob ab. S t atist. 31 545 –597. MR13384 52 [21] Gleissner, B., Gokbuget, N. , Bar tram, C. R., Janssen, B., Rieder, H., Janssen, J. W., F ona tsch, C., Heyll , A. , Voliotis, D., Beck, J., Lipp, T., Munzer t, G., Maurer, J., H o elzer, D. , Thiel, E. and of Adul t A cute L ymphoblastic Leukemia Study Gr oup, G. M. T. (2002 ). Leading prognostic relev ance of the BCR-ABL tra nslo ca- tion in adult acute B-linea ge lymphobla stic leukemia: A pros pe c tive s tudy of the German Multicenter Trial Group and co nfirmed poly merase chain re a ction analysis. Blo o d 99 1536 –1543 . [22] Grossmann, S ., Baue r, S., R obinson, P. N. and Vingron, M. (2006). An improv ed statistic for detecting ov er-represented gene on tology annota tions in gene sets. In R ese ar ch in Computational Mole cular Biolo gy: 10th Annual In- ternational Confer enc e, RECOMB 2006, V enic e, Italy, April 2–5, 2006, Pr o- c e e dings. L e ctur e Notes in Comput. S ci. ( A. Ap os to lico, C. Guerr a, S. Istrail, P . Pevzner and M. W aterman, eds.) 3 9 09 85–9 8. Spring er, Berlin/Heidelb erg. MR22604 46 [23] Hochberg, Y . (19 88). A sha r p er Bonferr o ni pro cedure for multiple tests of significance. Biometrika 75 80 0–80 2 . MR0995126 [24] Hochberg, Y. and T a m h a n e, A. C. (1987). Mult iple Comp arison Pr o c e- dur es . Wiley , New Y ork. [25] Kaczynski, J., Cook , T. and U rrutia, R. (200 3). Sp1- and Kr ¨ uppel-like transcription factors. Genome Biolo gy 4 20 6 . [26] Keles ¸, S. , v an der L aan, M. J., Dudoit, S. and Ca wley, S. E. (2006). Multiple testing metho ds for ChIP-Chip hig h density oligonucleotide array data. J. Comput. Biol. 13 579– 613. MR22554 32 [27] Kirchner, D., Duyster, J. , Ottmann, O., Schmid, R. M., Ber gmann, L. and Munzer t, G . (2003). Mechanisms o f Bcr -Abl-mediated NF- κ B/Rel activ a tion. Exp erimental Hematolo gy 31 504– 511. [28] McCarroll, S. A. , Murphy, C. T., Z ou, S., P l etcher, S. D., Chin, C.-S., Jan, Y . N. , Kenyon, C., Bargmann, C. I. and Li, H. (2004). Comparing genomic expr ession patterns a cross spe c ies identifies s hared tran- scriptional pro file in ag ing. Natur e Genetics 36 19 7–204 . [29] Mootha, V. K., Lindgren, C. M., Eriksson , K.-F. , Subramania n , A. , Sihag, S., Lehar, J., Pu igser ver, P ., Carlsson, E., Ridderstr ˙ ale, M. , Laurila, E., Houstis, N., Dal y, M. J., P a tterson, N., Mesiro v, J. P ., Gol ub, T. R., T ama yo, P., Spiegelman, B. , L ander, E. S., Hirschhorn, J. H ., A l tshuler, D. and Groop, L. C. (2003). PGC–1 α - resp onsive genes in v olved in oxidativ e phosphoryla tio n are co ordinately down- regulated in human diab etes. Natur e Genetics 3 4 267– 2 73. [30] Mukhop adhy a y, A., Shishodia, S., Suttles, J., Brittingham, K., Lamothe, B. , Nimmanap al l i, R., Bhalla, K. N. and Ag gar w al, B. B. Multiple tests of asso ciation with biolo gic al annotation metadata 217 (2002). Ectopic expres sion of protein-tyrosine kinase Bcr-Abl suppresses tumor necrosis facto r (TNF)-induced NF- κ B activ a tion and I κ B α phosphorylation. Relationship with do wn-regulatio n of TNF receptors . J . Biolo gic al Chemistry 277 3062 2–30 6 28. [31] Poll a rd , K. S. , Birkner, M. D., v an der Laan , M. J. and D udoit, S. (2005a ). T est statistics null distributions in m ultiple testing: Simulation studies and applications to g enomics. J . So c. F r an¸ caise de S t atistique 1 46 77–11 5. [32] Poll a rd , K. S. , Dudoit, S. and v an der Laan, M. J. (2005b). Multi- ple tes ting pro cedures: The multtest pack age and applica tions to genomics. In Bioinfo rmatics and Computational Biolo gy Solut ions Using R and Bio c onduc- tor (R. C. Gentleman, V. J. Carey , W. Hube r, R. A. Irizarry and S. Dudoit, eds.) Chapter 15 249– 271. Spring e r, New Y ork. [33] Poll a rd , K. S. and v an der Laan, M. J. (2004 ). Choice of a n ull distri- bution in resa mpling-based mu ltiple testing. J. S tatist. Plann. Infer enc e 1 25 85–10 0. [34] Rubin, D., v an der Laan, M. J. and Dudoit, S . (2006). A metho d to increa s e the p ow er o f multiple testing pro cedur es through sa mple split- ting. Statistic al Applic ations in Genetics and Mole cular Biolo gy 5 Article 19. MR22408 50 [35] Shtivelman, E., Coh en, F. E. and Bishop, J. M. (1992). A human ge ne (AHNAK) encoding an unusually large protein with a 1.2- µ m polyionic ro d structure. Pr o c. Natl. A c ad. Sci. 89 5 472–5 476. [36] Subramanian, A., T ama yo, P., Mootha, V. K., Mukherjee, S., Eber t, B. L., Gillette, M. A., P aulo vich, A., Pomero y, S. L., Golub, T. R., Lander, E. S. an d Mesir ov, J. P. (2005 ). Gene set enr ichment analysis: A knowledge-based appro ach for in terpreting genome-wide expression profiles. Pr o c. Natl. Ac ad. Sci. 102 155 45–1 5 550. [37] Tian, L. , Greenberg, S. A., Kong, S. W., Al tschuler, J., Kohane, I. S. and P ark, P. J. (200 5). Discov ering statistically significant pathw ays in express io n profiling s tudies. Pr o c. Natl. A c ad. Sci. 102 135 44–1 3549. [38] v an der L aan, M. J. (200 6). Statistical inference fo r v ariable importance. Internat. J. Biostatistics 2 Article 2. MR22758 97 [39] v an der Laan, M. J. , Birkner, M. D. and Hubbard, A. E. (20 05). Empirical Bay es and resa mpling ba s ed m ultiple testing pro cedur e co ntrolling tail pr obability of the prop ortion o f false p os itives. Statistic al Applic ations in Genetics and Mole cular Biolo gy 4 Article 29 . MR21704 45 [40] v an der Laan, M. J., Dudoit, S. and Pollard, K. S. (2004a ). Augmen- tation pro cedures for c ontrol of the genera lized family-wise erro r rate and tail probabilities for the prop ortion of false po sitives. Statistic al Applic ations in Genetics and Mole cular Biolo gy 3 Article 15 . MR21014 64 [41] v an der Laan, M. J., Dudo it, S. an d Pollard, K. S. (2004b). Multiple testing. Pa rt I I. Step-down pro cedur es fo r control of the family-wise error ra te. Statistic al Applic ations in Genetics and Mole cu lar Biolo gy 3 Article 14 . [42] v an der Laan, M. J. and Hu bbard, A. E. (20 06). Quantile-function based nu ll distribution in resampling based m ultiple testing. Statistic al Applic ations in Genetics and Mole cular Biolo gy 5 Article 14. [43] v an der L aan, M. J. and R obins, J. M. (2 003). Unifie d Metho ds for Cen- sor e d L ongitudinal Data and Causality . Springer, New Y or k. [44] von Heydebreck, A., Huber, W. and G entl eman, R. (200 4). Differential expression with the Bio conductor Pro ject. T echn ical Rep or t 7, Bio co nductor Pro ject W orking Paper s. 218 S. Dudoit, S. Kele¸ s and M. J. van der L aan [45] Westf al l, P. H . and Yo ung, S . S . (199 3). R esampling-Base d Mu lt iple T esting: Examples and Metho ds for P -V alue A djustment . Wiley , New Y ork. [46] Yu, Z. and v an der Laan, M. J. (2002 ). Constructio n of counterfactuals and the G-computation form ula. T echnical Rep or t 122, Divisio n of Bio statistics, Univ. California , Berkeley , Ber keley , CA 9 4720- 7360 .
Original Paper
Loading high-quality paper...
Comments & Academic Discussion
Loading comments...
Leave a Comment