Binary Classification Based on Potentials
We introduce a simple and computationally trivial method for binary classification based on the evaluation of potential functions. We demonstrate that despite the conceptual and computational simplicity of the method its performance can match or exce…
Authors: ** - 논문에 명시된 저자 정보가 제공되지 않음 (원문에 저자명 미기재). **
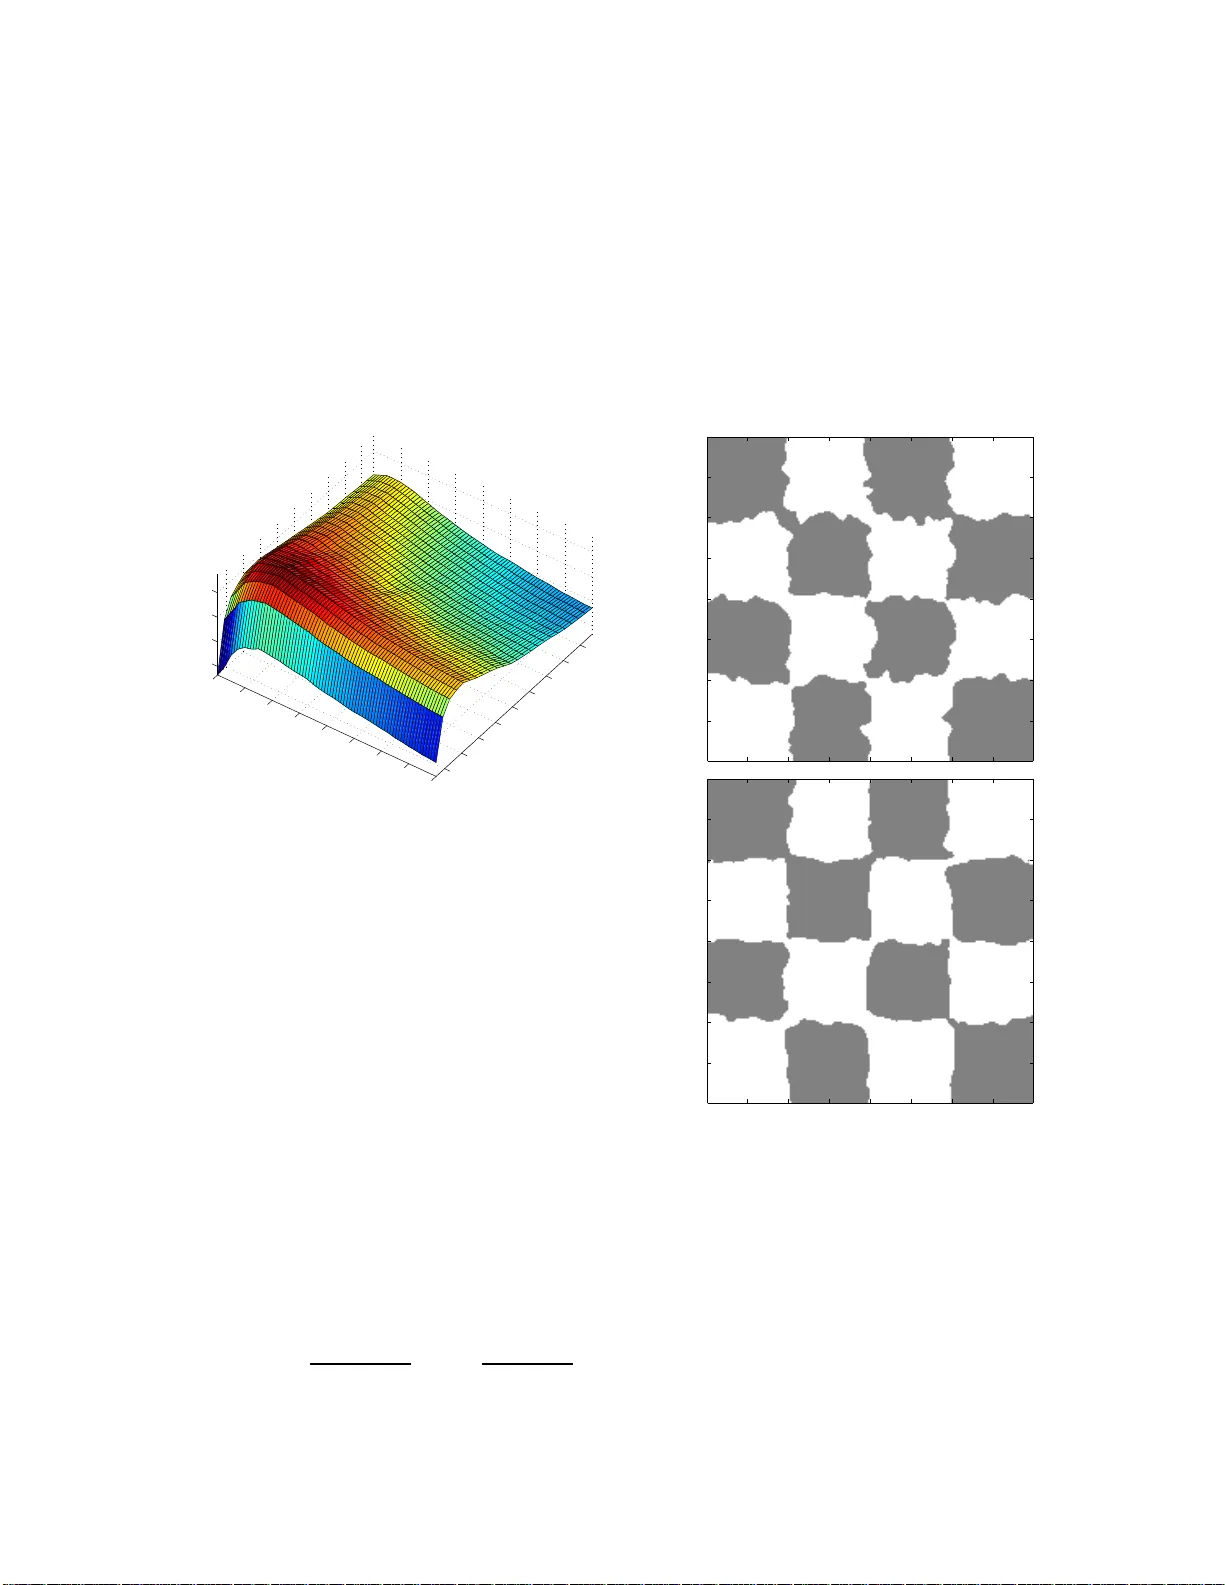
Binary Classific ati on Based on P oten tial F unction s Erik Bo c zk o ∗ Andrew Di Lullo † T o dd Y oung ‡ A bstr act – We intr o duc e a simple and c om - putational ly trivia l metho d for binary clas- sific ation b ase d on the evaluation of p oten- tial functions. We demonstr ate that des pite the c onc eptual and c omputational sim plicity of the metho d its p erforman c e c an match or exc e e d that of standar d Supp ort V e ctor Ma- chine metho ds. Keyw or ds: Mac hine Learning, Mi- croarra y Data 1 In tro d u ction Binary classification is a fundamen ta l focus in mac hine learning and informatics with man y p ossible applications. F or instance in biomedicine, t he introduction of microarray and proteomics data has op ened the do or to connecting a molecular snapshot of an indi- vidual with the presence o r absence of a dis- ease. Ho we v er, microarray data sets can con- tain tens to h undreds of thousands of obse r- v ations and are w ell kno wn to b e noisy [2]. Despite this complexit y , algorithms exist that are capable of producing v ery go o d p erfo r- mance [10, 11]. Most notable among thes e metho ds are the Supp ort V ector Mac hine (SVM) metho ds. In t his pap er we introduce a simple and computationally trivial metho d for binary classification based on p oten t ial functions. This classifier, whic h w e will call the p otential metho d , is in a sense a general- ization of the nearest neigh b or me tho ds and ∗ Biomedical Infor matics, V anderbilt University , Nashville, TN 37 232 † Undergradua te student, Departmen t of Physics, Ohio Universit y , A thens, O H 45701 ‡ Corresp o nding author, Department of Ma th, Ohio Universit y , A thens, O H 45701 is also related to radial basis function ne t- w orks (RBF N) [4], another metho d o f curren t in terest in machine learning. F urther, the metho d can b e view ed a s one p ossible non- linear v ersion of D istance W eigh t ed Discrim- ination (D WD), a recen tly prop osed metho d whose linear v ersion consists of c ho osing a de- cision plane b y minimizing the sum of t he in- v erse distances to the plane [8 ]. Supp ose that { y i } m i =1 is a set of data of one t yp e, that we will call p ositive and { z i } n i =1 is a data set o f another t yp e that w e call ne ga tive . Supp ose that b oth sets o f data are ve ctors in R N . W e will assume that R N decomp oses in to t wo sets Y and Z such that eac h y i ∈ Y , z i ∈ Z and any p oin t in Y should be classi- fied as p o sitiv e and any p oint in Z should b e classified as negativ e. Supp o se that x ∈ R N and we wish to predict whether x b elongs to Y or Z using only information from the finite sets of data { y i } and { z i } . Giv en distance functions d 1 ( · , · ) and d 2 ( · , · ) and p o sitive con- stan ts { a i } m i =1 , { b i } n i =1 , α and β we define a p oten tial function: I ( x ) = m X i =1 a i d 1 ( x , y i ) α − n X i =1 b i d 2 ( x , z i ) β . (1) If I ( x ) > 0 then w e sa y that I classifies x as b elonging to Y and if I ( x ) is negativ e then x is classified as part of Z . The set I ( x ) = 0 w e call the decision surface. Un- der optimal circumstances it should coincide with the b oundary b et we en Y and Z . Pro vided that d 1 and d 2 are sufficien tly easy to ev aluate, then ev aluating I ( x ) is com- putationally trivial. This fact could mak e it p ossible to use the training data to searc h for optimal c hoices of { a i } m i =1 , { b i } n i =1 , α , β and ev en the distance functions d j . An o b- vious c ho ice for d 1 and d 2 is the Euclidean distance. More g enerally , d could be chose n as the distance defined b y the ℓ p norm, i.e. d ( x , y ) = k x − y k p where k x k p ≡ ( x p 1 + x p 2 + . . . + x p N ) 1 /p . (2) A more elab orate c hoice for a distance d migh t b e the follo wing. Let c = ( c 1 , c 2 , . . . , c N ) b e an N -v ector and define d c to b e the c - w eighted distance: d c ,p ( x , y ) ≡ ( c 1 | x 1 − y 1 | p + c 2 | x 2 − y 2 | p + . . . + c N | x N − y N | p ) 1 /p . (3) This distance allo ws assignmen t of differen t w eights to the v arious attributes. Man y metho ds for choosing c migh t be suggested and w e prop ose a few here. Let C b e the v ec- tor asso ciated with the class ification of the data p oin ts, C i = ± 1 dep ending on the clas- sification o f the i-th data p oin t. The v ector c migh t consist of the absolute v alues univ ari- ate c orrelation co efficien ts associat ed with the N v aria bles with respect to C . This w ould hav e the effect of emphasizing direc- tions whic h should b e emphasized, but v ery w ell migh t also suppress directions whic h a re imp ortant for multi-v ariable effects. Cho os- ing c to b e 1 min us the univ ariate p - v alues asso ciated with eac h v ariable could b e ex- p ected to hav e a similar effect. Alterna- tiv ely , c migh t be deriv ed from some multi- dimensional statistical metho ds. In our ex- p erimen ts it turns out that 1 min us t he p - v a lues w orks quite w ell. Rather than a i = b i = 1 w e migh t con- sider other weigh tings of training p o in ts. W e w ould wan t to mak e the c hoice of a = ( a 1 , a 2 , . . . , a m ) and b = ( b 1 , b 2 , . . . , b n ) based on easily a v ailable informatio n. An o bvious c hoice is the set of distances to other test p oin ts. In the c hec ke rb oard exp erimen t b e- lo w w e demonstrate that training p oints to o close to the b oundary b et w een Y and Z ha v e undue influence and cause irregula r it y in the decision curv e. W e would lik e to give less w eight to these points by using the distance from the p oin ts to the b oundary . Ho wev er, since the b oundary is not kno wn, w e use the distance to the closest p oin t in the other set as an approximation. W e show that this approac h give s improv emen t in classification and in the smo othness of the decision surface. Note that if p = 2 in (2) our metho d limits on t o the usual nearest neigh b or metho d as α = β → ∞ since for large α the term with the smallest denominator will dominate the sum. F or finite α our metho d giv es greater w eight to nearb y p oin ts. In the follo wing w e report on tests o f the efficacy of the metho d using v arious ℓ p norms as the distance, v arious c hoices of α = β and a few simple c hoices for c , a , and b . 2 A Simple T est Mo del W e applied the metho d to the mo del prob- lem of a 4 b y 4 c heck erb o ard. In this test w e supp ose tha t a square is partitioned into a 16 equal subsquares and supp o se that p oints in alternate squares b elong to t w o distinct t yp es. F ollo wing [7], we used 1000 randomly selected p oints as the training set and 40 ,0 00 grid p oin ts as the test set. W e c ho ose to de- fine b oth the distance f unctions b y t he usual ℓ p norm. W e will also require α = β and a i = b i = 1 Th us w e used a s the p o ten tial function: I ( x ) = m X i =1 1 k x − y i k α p − n X i =1 1 k x − z i k α p . (4) Using differen t v alues of α and p w e found the p ercen tag e o f test points that are correctly classified b y I . W e rep eated this experiment on 5 0 differen t tra ining sets and tabulated the p ercen tag e of correct classifi cations as a func- tion o f α and p . The results are displa y ed in Figure 1 . W e find that the maxim um occurs at appro ximately p = 1 . 5 a nd α = 4 . 5. 3 4 5 6 7 8 9 10 11 1 1.5 2 2.5 3 3.5 4 4.5 5 87 87.2 87.4 87.6 p α % Figure 1: The p ercen tage of correct classifica- tions for the 4 b y 4 c hec k erb oard test problem as a fun ction of the parameters α and p . Th e m ax- im u m o ccur s near p = 1 . 5 and α = 4 . 5. Notic e that the graph is f airly fl at near the maximum. The relative flatness near the maximum in Figure 1 indicates robustne ss of the method with respect to these parameters. W e fur- ther o bserv ed that changing the training s et affects the lo cation of the maxim um only sligh tly a nd the affect o n the p ercen ta ge cor- rect is small. Finally , we tried classification of the 4 by 4 c hec kerboard using the minimal distance to data of the opp o site type in the co efficien ts for the training da ta, i.e. a and b in: I ( x ) = m X i =1 (1 + ǫ ) a β i k x − y i k α p − n X i =1 (1 − ǫ ) b β i k x , z i k α p . With this w e obtained 96 . 2% accuracy in the classification and a noticably smo other deci- sion surface (see Figure 2 ( b) ) . The optimized parameters for our metho d w ere p ≈ 3 . 5 and α ≈ 3 . 5. In this optimization w e also used the distance to opp osite t yp e t o a p ow er β and the optimal v alue for β w as ab out 3 . 5 . In [7] a SVM metho d obtained 97% cor r ect clas- sification, but only aft er 10 0 ,000 iterations. 0.5 1 1.5 2 2.5 3 3.5 0.5 1 1.5 2 2.5 3 3.5 0.5 1 1.5 2 2.5 3 3.5 0.5 1 1.5 2 2.5 3 3.5 Figure 2: (a) The classification of the 4 b y 4 c hec kerb oard without distance to b oundary w eigh ts. In this test 95% were correctly clas- sified. (b) T he classificatio n usin g distance to b ound ary w eights. Here 96 . 2% were correctly classified. 3 Clinical Data Sets Next w e applied the metho d t o micro- arra y data from t w o cancer study sets Prostate_Tu mor and DLBCL [10, 11]. Based on our ex p erience in the previous problem, w e used the p otential function: I ( x ) = m X i =1 (1 + ǫ ) a β i d c ,p ( x , y i ) α − n X i =1 (1 − ǫ ) b β i d c ,p ( x , z i ) α , (5) where d c ,p is the metric defined in (3). The v ector c i w as taken to b e 1 min us the uni- v a riate p-v alue f o r eac h v ariable with resp ect to the class ification. The weigh ts a i , b i w ere tak en to b e the distance fr o m each data p oin t to t he nearest data p oint of the opp o site ty p e. Using the pot en tial ( 5) w e obtained lea ve- one-out cross v alidation (LOOCV) for v ari- ous v alues of p , α , β , and ǫ . F or these data sets LOOCV has b een sho wn to b e a v alid metho dology [10 ] On the DLBCL data the nearly optimal p er- formance of 9 8 . 7% was acheiv ed for ma ny parameter com binatio ns. The SVM meth- o ds studied in [10, 11] ac hiev ed 97 . 5% cor- rect on this data while the k - nearest neigh t- b or correctly classified only 87%. Sp ecifi- cally , w e found that for eac h 1 . 6 ≤ p ≤ 2 . 4 there w ere ro bust sets of para meter com bina- tions that pro duced p erformance b etter tha n SVM. These para meter sets w ere contained generally in the in terv als: 1 0 < α < 15 and 10 < β < 15 and 0 < ǫ < . 5 . F or the DLBCL data when w e used the ℓ p norm instead of the w eigh ted distances and also dropp ed the data weigh ts ( ǫ = β = 0) the b est p erfo rmance sank to 94 . 8% correct classification at ( p, α ) = (2 , 6). This illus- trates the imp orta nce of these parameters. F or the Prostrate_tumo r data set the re- sults using p otential (5) w ere not quite as go o d. The b est p erfo rmance, 89 . 2% correct, o ccured for 1 . 2 ≤ p ≤ 1 . 6 with α ∈ [11 . 5 , 15, β ∈ [12 , 14], ǫ ∈ [ . 1 , . 175 ] . In [10, 11] v ari- ous SVM metho ds w ere sho wn to achiev e 92% correct and the k -nearest neighbor method ac heiv ed 85 % corr ect. With feature selection w e w ere able to obta in m uch b etter results on the Prostra te_tumor data set. In particular, w e us ed the univ ar iate p -v alues to select the most relev an t features. The optimal p erf o r- mance o ccured with 20 features. In this test w e obtain 96 . 1 % accuracy for a robust set of parameter v alues. data set kNN SVM P ot P ot-FS DLBCL 87 % 97 . 5% 98 . 7% — Prostate 85% 92% 89 . 2% 96 . 1% T a ble 1: Results from the p oten tial metho d on b enchmark DLBCL and Prostate tumor micro- arra y data sets compared with the SVM m etho ds and the k-nearest neigh b or metho d. The last col- umn is th e p erformance of the p oten tial m etho d with univ ariate feature selection. 4 Conclusions The results demonstrate that, despite its sim- plicit y , the p ot en tial method can b e as ef- fectiv e as the SVM metho ds. F urther w ork needs to b e done to realize the ma ximal p er- formance of the metho d. It is imp or t an t that most of the calculations required b y the po - ten tial method are m utually indep enden t and so a r e highly parallelizable. W e p oint out an import a n t difference be- t wee n the p o ten tial metho d and Radial Basis F unction Net works . RBFNs were originally designed to appro ximate a real-v alued func- tion on R N . In classification problems, the RBFN attempts to appro ximate the c harac- teristic functions of the sets Y and Z (see [4]). A k ey p oint of our metho d is to approx- imate the decision surface only . The p oten- tial metho d is designed for classifc ation prob- lems whereas RBFNs hav e man y o ther appli- cations in mac hine learning. W e also not e tha t the po t en tial metho d, b y putting sign ula r it ies at the kno wn data p oin ts, alwa ys classifies some neigh b orho o d of a data p oint as b eing in the class of that po in t. This feature mak es the p oten- tial metho d less suitable when the decision surface is in fact not a surfa ce, but a “fuzzy” b oundary region. There are sev era l av en ues of inv estigation that seem to b e w or t h pursuing. Among these, w e hav e further inv estigated the role of the distance to the b oundary with success [1]. Another direction of inte rest would b e to ex- plore alternative c hoices fo r the we igh tings c , a and b . Another w ould b e to in ve stigate the use of more g eneral metrics b y searc hing for optimal c hoices in a suitable f unction space [9]. Implemen ta tion of feat ure selection with the po t en tial metho d is a lso lik ely to b e fr uit- ful. F eature selec tion routines already exis t in the con text of k - nearest neighbor matho ds [6] and those can b e exp ected to w ork equally w ell for the p o ten tial metho d. F eat ure selec- tion is recongnized to b e v ery imp ortan t in micro-array analysis, and w e view the suc- cess of the metho d without f eatur e selection and with prima t ive feature selection as a go o d sign. References [1] E.M. Bo czko and T. Y oung, Signed distance functions: A new to ol in binary classifica- tion, ArXiv pr eprint : cs.LG/0511105. [2] J.P . Bro dy , B.A. Willia ms, B.J. W old and S.R. Q uak e, Significance and statistical er- rors in the analysis of DNA m icroarray data. P r o c. Nat. A c ad. Sci. , 99 (2002), 12975 -12978 . [3] D.H. Hand , R.J. Till, A simple generaliza- tion of the area u nder the R OC cur v e for m u ltiple class classificatio n p r oblems, Ma- chine L e arning. 45 (2001), 171-186. [4] A. Krzy ˙ z ak, Nonlinear function learning us- ing optimal r adial basis fu nction net w orks, Nonline ar Anal. , 47 (2001), 293-302. [5] J. J. Hopfield, Neural netw orks and physical systems w ith emergent collectiv e computa- tional abilit ies, Pr o c. Natl. A c ad. Sci. , 79 (1982 ), 2554-25 58. [6] L.P . Li, C . W einber g, T. Dard en, L. Ped- ersen, Gene selection for sample ca lssifica- tion based on gene expresion data: stud y of sensitivit y to choic e of p arameters of the GA/KNN m etho d, Bioinformat ics 17 (2001 ), 1131-11 42. [7] O.L. Mangasarian and D.R. Mus icant, Lagrangian Supp ort V ector Mac hin es, J. Mach. L e arn. R es. , 1 (2 001), no. 3, 161– 177. [8] J.V. Rogel, T. Ma, M.D. W ang, Distance W eigh ted Discrimination and S igned Dis- tance F unction algorithms for binary cla s- sification. A comparison study . Prepr in t, Georgia Institute of T ec h nology , 2006. [9] J.H. Mo ore, J.S . P arke r, N.J. Olsen, Sym - b olic discriminant analysis of microarra y data in autoimmune disease, Genet. E pi- demiol. 23 (2002), 57-69. [10] A. Statnik ov, C.F. Aliferis, I . Tsamardi- nos, D. Hardin, S. Levy , A Comprehen- siv e Ev aluation of Multicatego ry Classifi- cation Metho ds for Microarra y Gene E x - pression Cancer Diag nosis, Bioinforma tics 21 (5), 631-43 , 2005. [11] A. Statnik ov, C .F. Aliferis, I. Ts amard inos. Metho ds f or Multi-Categ ory Cancer Diag- nosis from Gene Expression Data: A C om- prehensive Ev aluation to Inform De cision Supp ort S ystem Dev elopment, In Pr o c e e d- ings of the 11th World Congr ess on Me dic al Informatics (MEDINFO) , September 7 -11, (2004 ), San F rancisco, C alifornia, USA
Original Paper
Loading high-quality paper...
Comments & Academic Discussion
Loading comments...
Leave a Comment