MOST: detecting cancer differential gene expression
We propose a new statistics for the detection of differentially expressed genes, when the genes are activated only in a subset of the samples. Statistics designed for this unconventional circumstance has proved to be valuable for most cancer studies,…
Authors: ** - **Heng Lian** (주 저자) *(논문 원문에 다른 공동 저자 정보가 명시되지 않아, 제공된 저자명만 기재)* --- **
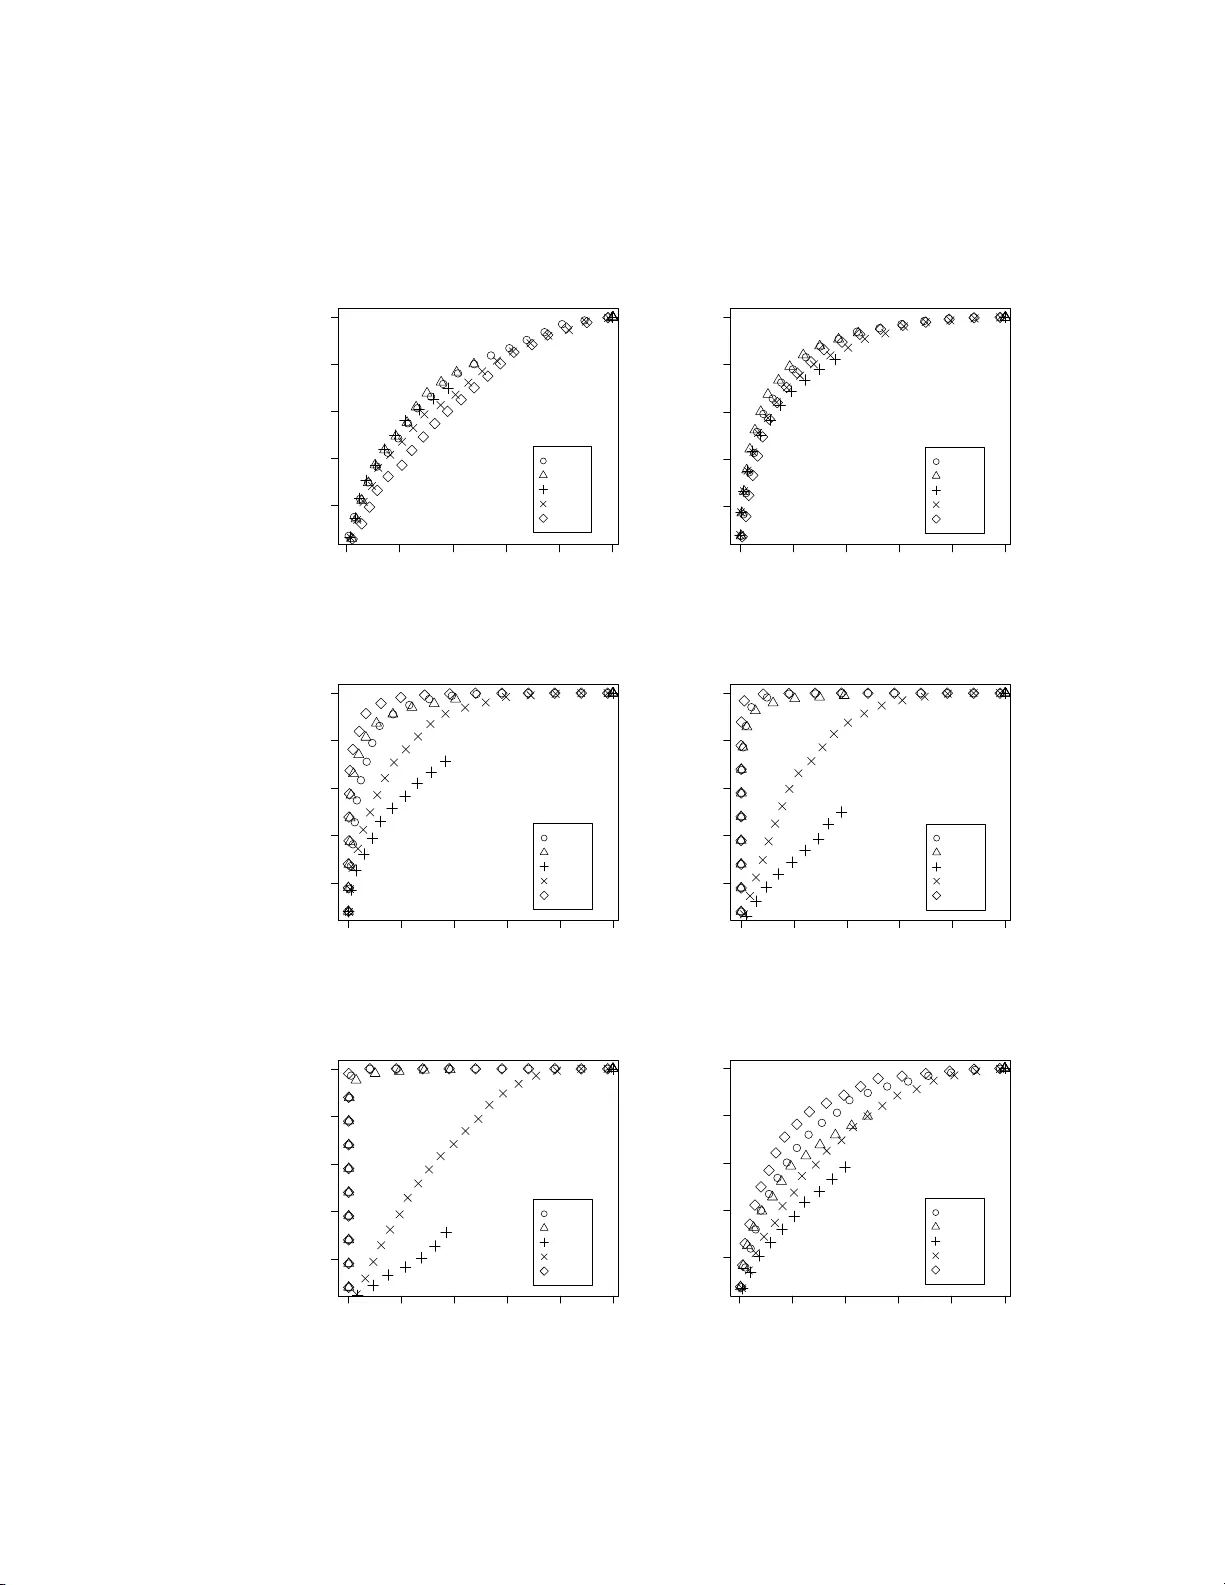
MOST: detecting cancer differen tial gene expression HENG LIAN Octob er 24, 2018 Abstract W e prop ose a new statis tics for the detection of differentia lly expressed genes, when the genes are activ ated only in a subset of the samples. Statis- tics designed for this unconv entional circumstance has p roved to b e val u- able for mo st cancer studies, where o ncogenes are activ ated for a small num b er of disease samples. Previous eff orts made in this direction include COP A ([T omlins and ot hers (2005) ]), OS ([Tibshirani and Hastie(2006)]) and O R T ( [W u(2007)] ). W e prop ose a n ew statistics called maximum or- dered subset t-statistics (MOST) whic h seems to b e natural when the num b er of activ ated samples is unknown. W e compare MOST to other statistics and fin d th e proposed metho d often h as more pow er then its compet itors. Cancer; COP A; D ifferential gene ex pression; Microarra y . 1 In tro duction The most p opular metho d for different ial g ene expression detection in tw o - sample microa rray studies is to compute the t-sta tistics. The differentially ex- pressed genes a re those whose t-statistics exceed a cer tain threshold. Recent ly , due to the r ealization that in many canc e r s tudies, many genes show increas ed expressions in disease s amples, but o nly for a small n umber of those samples. The study of [T omlins and others (20 0 5)] shows that t-statistics has low power in this case, and they int ro duced the so-called “cancer outlier profile analys is ” (COP A). Their study shows clea rly that COP A can p erform better than the traditional t-statistics for cancer micr oarray data sets. More recently , several pro gresses have b een made in this direction with the aim to design b etter statistics to account for the heter ogeneous ac tiv ation pa t- tern of the cancer genes. In [Tibshirani and Hastie(200 6) ], the authors in tro - duced a new statistics, which they ca lled outlier sum. Later, [W u(2007)] pro - po sed outlier robust t-sta tistics (OR T) and show ed it usually outp erformed the previously prop osed ones in b oth simulation study and applicatio n to real data set. In this pap er, we prop ose another statistics fo r the detection of c a ncer dif- ferential gene ex pression which hav e similar p ow er to O R T when the num b er of activ ated samples are very small, but per form b etters when more samples are 1 2 MAXIMUM ORDERE D SUBSET T-ST A TISTICS (MOST) 2 differentially expressed. W e call our new method the maximum order ed subset t-statistics (MOST). Thr ough sim ulation studies we found the new statistics outp e rformed the prev io usly propo sed ones under some circumsta nc e s and never significantly w or se in all situations. Thus we think it is a v alua ble addition to the dictionar y of cancer outlier expression detection. 2 Maxim u m ordered subset t-statistics (MOST) W e consider the simple 2-class microa r ray data for detecting ca ncer genes . W e assume there ar e n no rmal samples a nd m cancer samples. The gene expressio ns for normal sa mples are denoted by x ij for genes i = 1 , 2 , . . . , p and samples j = 1 , 2 , . . . n , while y ij denote the expr essions for cancer samples with i = 1 , 2 , . . . , p and j = 1 , 2 , . . . m . In this pap er, we are only interested in o ne-sided test where the activ a ted genes from cancer sa mples ha ve a higher expr ession level. The extension to tw o- sided test is straig h tforward. The usual t- s tatistics (up to a m ultiplication factor independent of g enes) for tw o-sa mple test o f differences in means is defined for each gene i b y T i = ¯ x i − ¯ y i s i , (1) where ¯ x i = P j x ij /n is the av erag e express io n of gene i in normal samples , ¯ y i = P j y ij /m is the av erage e xpression of gene i in cancer samples , and s i is the usual p o oled standar d devia tion es timate s 2 i = P 1 ≤ j ≤ n ( x ij − ¯ x i ) 2 + P 1 ≤ j ≤ m ( y ij − ¯ y i ) 2 n + m − 2 . The t-statistics is p ow erful when the alter na tiv e distribution is such that y ij , j = 1 , 2 , . . . , m all come from a distribution with a higher mean. [T omlins and others (2005 )] argues tha t for mos t cancer t yp es, heterog eneous activ a tion patterns make t- statistics inefficient for detecting those expres s ion profiles . They defined the COP A statistics C i = q r ( { y ij } 1 ≤ j ≤ m ) − med i mad i , (2) where q r ( · ) is the r th p ercentile o f the data, med i = median ( { x ij } 1 ≤ j ≤ n , { y ij } 1 ≤ j ≤ m ) is the median o f the po oled s amples for gene i , and mad i = 1 . 4 826 × media n ( { x ij − med i } 1 ≤ j ≤ n , { y ij − med i } 1 ≤ j ≤ m ) is the median absolute deviation of the p oo led samples. The choice of r in (2) dep ends on the sub jective judgemen t of the user . The use of med i and mad i to replace the mean and the sta ndard deviation in (1) is due to robustness c o nsiderations since it is alrea dy known that some of the genes ar e differentially ex pressed. In (2), only one v a lue of { y ij } is used in the computatio n. A mor e efficient strategy would b e to use additiona l expr ession v alues. Let O i = { y ij : y ij > q 75 ( { x ij } 1 ≤ j ≤ n , { y ij } 1 ≤ j ≤ m ) + I QR ( { x ij } 1 ≤ j ≤ n , { y ij } 1 ≤ j ≤ m ) } (3) 2 MAXIMUM ORDERE D SUBSET T-ST A TISTICS (MOST) 3 be the outliers from the c ancer samples for gene i , wher e I Q R ( · ) is the interquar- tile range of the data. The OS statistics from [Tibshirani and Ha stie(2006)] is then defined as OS i = P y ij ∈ O i ( y ij − me d i ) mad i . (4) More recently , [W u(200 7 )] studied OR T statistics , which is simila r to OS statis- tics. The imp ortant difference that ma k es OR T sup erior is that o utliers ar e defined rela tiv e to the nor mal sa mple instead of the p o oled s ample. So in their definition, O i = { y ij : y ij > q 75 ( { x ij } 1 ≤ j ≤ n ) + I QR ( { x ij } 1 ≤ j ≤ n ) } (5) By simila r reasoning med i in OS is replaced by med ix and mad j by median ( { x ij − med ix } 1 ≤ j ≤ n , { y ij − med iy } 1 ≤ j ≤ m ), where med ix and med iy are the medians o f normal and cancer s amples resp ectively . In b oth O S and O R T statistics, the outlier s ar e defined so mewhat arbitra rily with no convincing re asons. T o address this question, we pro pose the following statistics that implicitly consider s all p ossible v a lues for outlier thr esholds. Suppo se for no ta tional simplicity that { y ij } 1 ≤ j ≤ m are order e d for each i : y i 1 ≥ y i 2 ≥ · · · ≥ y im . If the num b er of s amples where oncogenes ar e activ ated were known, we would naturally define the statistics as M ik = P 1 ≤ j ≤ k ( y ij − med ix ) median ( { x ij − me d ix } 1 ≤ j ≤ n , { y ij − me d iy } 1 ≤ j ≤ m ) . (6) When k is not known to us, one w ould b e tempted to define M i = max 1 ≤ k ≤ m M ik . But this does not quite work since obviously M ik for differ en t v a lues o f k are not dire c tly compa rable under the null distr ibution that x ij , y ij ∼ N (0 , 1). F o r example, when m = 2, we have E [ y i 1 − med ix ] > 0 while E [ P j =1 , 2 ( y ij − med ix )] = 0. This observ ation motiv ates us to normalize M ik such that ea ch approximately has mean 0 and v aria nce 1. This can be achiev ed by defining µ k = E [ P 1 ≤ j ≤ k z j ] and σ 2 k = V ar ( P 1 ≤ j ≤ k z j ) where z 1 > z 2 > · · · > z m is the order statistics o f m sa mples g enerated fro m the sta ndard nor mal distr ibution. Then we c a n define M ik as: M ik = P 1 ≤ j ≤ k ( y ij − me d ix ) 1 . 4826 × median ( { x ij − me d ix } 1 ≤ j ≤ n , { y ij − me d iy } 1 ≤ j ≤ m ) − µ k /σ k , (7) so that M ik has mea n and v ar iance a pproximately equal to 0 and 1 resp ectively . Finally we can define our new statistics (called MOST) as M i = max 1 ≤ k ≤ m M ik . (8) 3 SIMULA TION STUDIES AND APPLICA TIO N 4 With MOST, w e pra ctically consider every po ssible threshold ab ov e which y ij are taken to b e outliers. In this formulation, the num b er of o utliers is implicitly defined as arg max 1 ≤ k ≤ m M ik . (9) 3 Sim u lati on stu dies and applicatio n Some simulations ar e carrie d out to study MOST, and compa r e its p erformance to OS, OR T, COP A, and t-s ta tistics. F or CO P A, we c ho ose to use the 90th per cen tile in its definition as in [Tibshira ni and Hastie(20 0 6) ]. W e g enerate the expression data from standard normal with n = m = 20 . F or v a rious v alues k , 1 ≤ k ≤ m , which is the n umber of differentially expr essed cancer samples, a co nstan t µ is added for differentially expressed genes. W e s im ulated 1000 differentially and non-differentially expressed genes , and calc ulated the ROC curves from them by choo sing different thresholds for gene calls. Figure 1 and 2 plo ts the ROC c ur v es for some combinations of k and µ . F or µ = 2 a nd k small, all five statistics b ehav e similarly w ith t-statistics p e r forming the worst. As k increas es, t becomes better and OS and CO P A b egin to lose power. F or µ = 1 and medium to large k , the p erformance of MOST is only worse than t a nd better than other statistics. Smaller k in this ca se ba sically leads to ROC curve that is close to a 45 o line for all statistics since the signa l µ = 1 is to o weak in this case, so we do not show these re s ults. F or µ = 4 and small k , MOST is better tha n OR T, COP A and t, and in this situation only O S is comp etitiv e with MOST. La rger k in this case will pro duce nearly per fect ROC c urv es fo r all statistics, and th us tho s e results ar e also omitted. Besides R OC curves, we have a ls o tried examining the p ossibility of using (9) for estimating the num b er o f differ en tially express ed samples k , but so far hav e bee n unable to get a rea sonable es tima te out of it. F ro m the ab ov e simulations, w e judge that our new estimate MOST is at least as g oo d as other pr eviously prop osed statistics, sometimes much better. Thu s it is a v aluable tool for detecting a ctiv ated g enes in man y s ituations. As an example of rea l data applicatio n, the data from [W est and others (2001)] is publicly av a ilable fro m http://data.cgt.duke.edu/w est.php. The micr oarray used in the br east cancer study contains 712 9 genes a nd 49 tumor samples, 25 of which with no p ositive ly mph no des identified a nd the other 24 with po sitiv e no des. Simila r to [W u(2007)], we tak e the log tr a nsformation of the expressions after nor malizing the data. W e apply MOST to the da ta and com- pare it to the t-statistics by co mputing the FDR using the SAM approa c h ([T usher and others (2001)]). Figur e 3 plots the FDR versus the nu mber of genes called significant. F or this exa mple, MOST seems to p erform a little better than t-statistics, althoug h the difference is too small to b e o f any significance. 3 SIMULA TION STUDIES AND APPLICA TIO N 5 0.0 0.2 0.4 0.6 0.8 1.0 0.2 0.4 0.6 0.8 1.0 n=m=20, mu=2, k=2 False Positive Rate True Positive Rate most ort os copa t 0.0 0.2 0.4 0.6 0.8 1.0 0.2 0.4 0.6 0.8 1.0 n=m=20, mu=2, k=5 False Positive Rate True Positive Rate most ort os copa t 0.0 0.2 0.4 0.6 0.8 1.0 0.2 0.4 0.6 0.8 1.0 n=m=20, mu=2, k=10 False Positive Rate True Positive Rate most ort os copa t 0.0 0.2 0.4 0.6 0.8 1.0 0.2 0.4 0.6 0.8 1.0 n=m=20, mu=2, k=15 False Positive Rate True Positive Rate most ort os copa t 0.0 0.2 0.4 0.6 0.8 1.0 0.2 0.4 0.6 0.8 1.0 n=m=20, mu=2, k=20 False Positive Rate True Positive Rate most ort os copa t 0.0 0.2 0.4 0.6 0.8 1.0 0.2 0.4 0.6 0.8 1.0 n=m=20, mu=1, k=10 False Positive Rate True Positive Rate most ort os copa t Figure 1: ROC curves estimated based on simulation. The num b er of nor- mal/cancer sa mple is n = m = 20. V arious co m binations o f µ and k ’s are chosen. Other unin teresting results where all statistics ha ve close to p erfectly go o d or ba d p erformances are e x cluded as explained in the main text. 3 SIMULA TION STUDIES AND APPLICA TIO N 6 0.0 0.2 0.4 0.6 0.8 1.0 0.2 0.4 0.6 0.8 1.0 n=m=20, mu=1, k=20 False Positive Rate True Positive Rate most ort os copa t 0.0 0.2 0.4 0.6 0.8 1.0 0.2 0.4 0.6 0.8 1.0 n=m=20, mu=4, k=1 False Positive Rate True Positive Rate most ort os copa t 0.0 0.2 0.4 0.6 0.8 1.0 0.2 0.4 0.6 0.8 1.0 n=m=20, mu=4, k=2 False Positive Rate True Positive Rate most ort os copa t 0.0 0.2 0.4 0.6 0.8 1.0 0.2 0.4 0.6 0.8 1.0 n=m=20, mu=4, k=5 False Positive Rate True Positive Rate most ort os copa t Figure 2: Mo re ROC curves. REFERENCES 7 0 100 200 300 400 0.0 0.2 0.4 0.6 0.8 1.0 number of genes called FDR t−statistics MOST Figure 3: FDR versus the n umber of genes called significant. References [Tibshirani and Ha stie(2006)] Tibshirani, R. and H astie, T. (20 0 6). Outlier sums for different ial gene expressio n ana lysis. Biostatistics 8 , 2–8. [T o mlins and others (200 5)] Tomlins , S. A., Rhodes, D. R., P erner, S., Dhanasekaran, S. M., Mehra, R., Sun, X. W., V aramball y, S., Cao, X., Tchinda, J., Kuefer, R. and others (2005). Recurre nt fusion o f TMPRSS2 and ETS transcr iption factor genes in pro s tate ca ncer. Scienc e 3 10 , 644–8 . [T usher and others (2001)] Tusher, V., Tibshirani, R. and Chu, G. (200 1). Significance analysis of micr oarrays applied to transcr iptional r espons es to ionizing ra diation. Pr o c e e dings of t he N ational A c ademy of Scienc es of the Unite d States of Americ a 98 , 5 116–21 . [W est and others (2001)] West, M., Blanchette, C., Dressman, H., Huang, E., Ishida, S., Sp ang, R., Zuzan, H., Olson, J. A. J., Marks, J. R. and Nevins, J. R. (2 001). P r edicting the clinical s tatus o f human breast cancer by using gene expr e ssion profiles . Pr o c e e dings of the National A c ademy of Scienc es of t he Un ite d States of Americ a 98 , 1 1 462–46 7. [W u(200 7)] W u, B. (2 0 07). Cancer outlier differential gene expression detec- tion. Biostatistics 8 , 56 6–75.
Original Paper
Loading high-quality paper...
Comments & Academic Discussion
Loading comments...
Leave a Comment