For objective causal inference, design trumps analysis
For obtaining causal inferences that are objective, and therefore have the best chance of revealing scientific truths, carefully designed and executed randomized experiments are generally considered to be the gold standard. Observational studies, in …
Authors: Donald B. Rubin
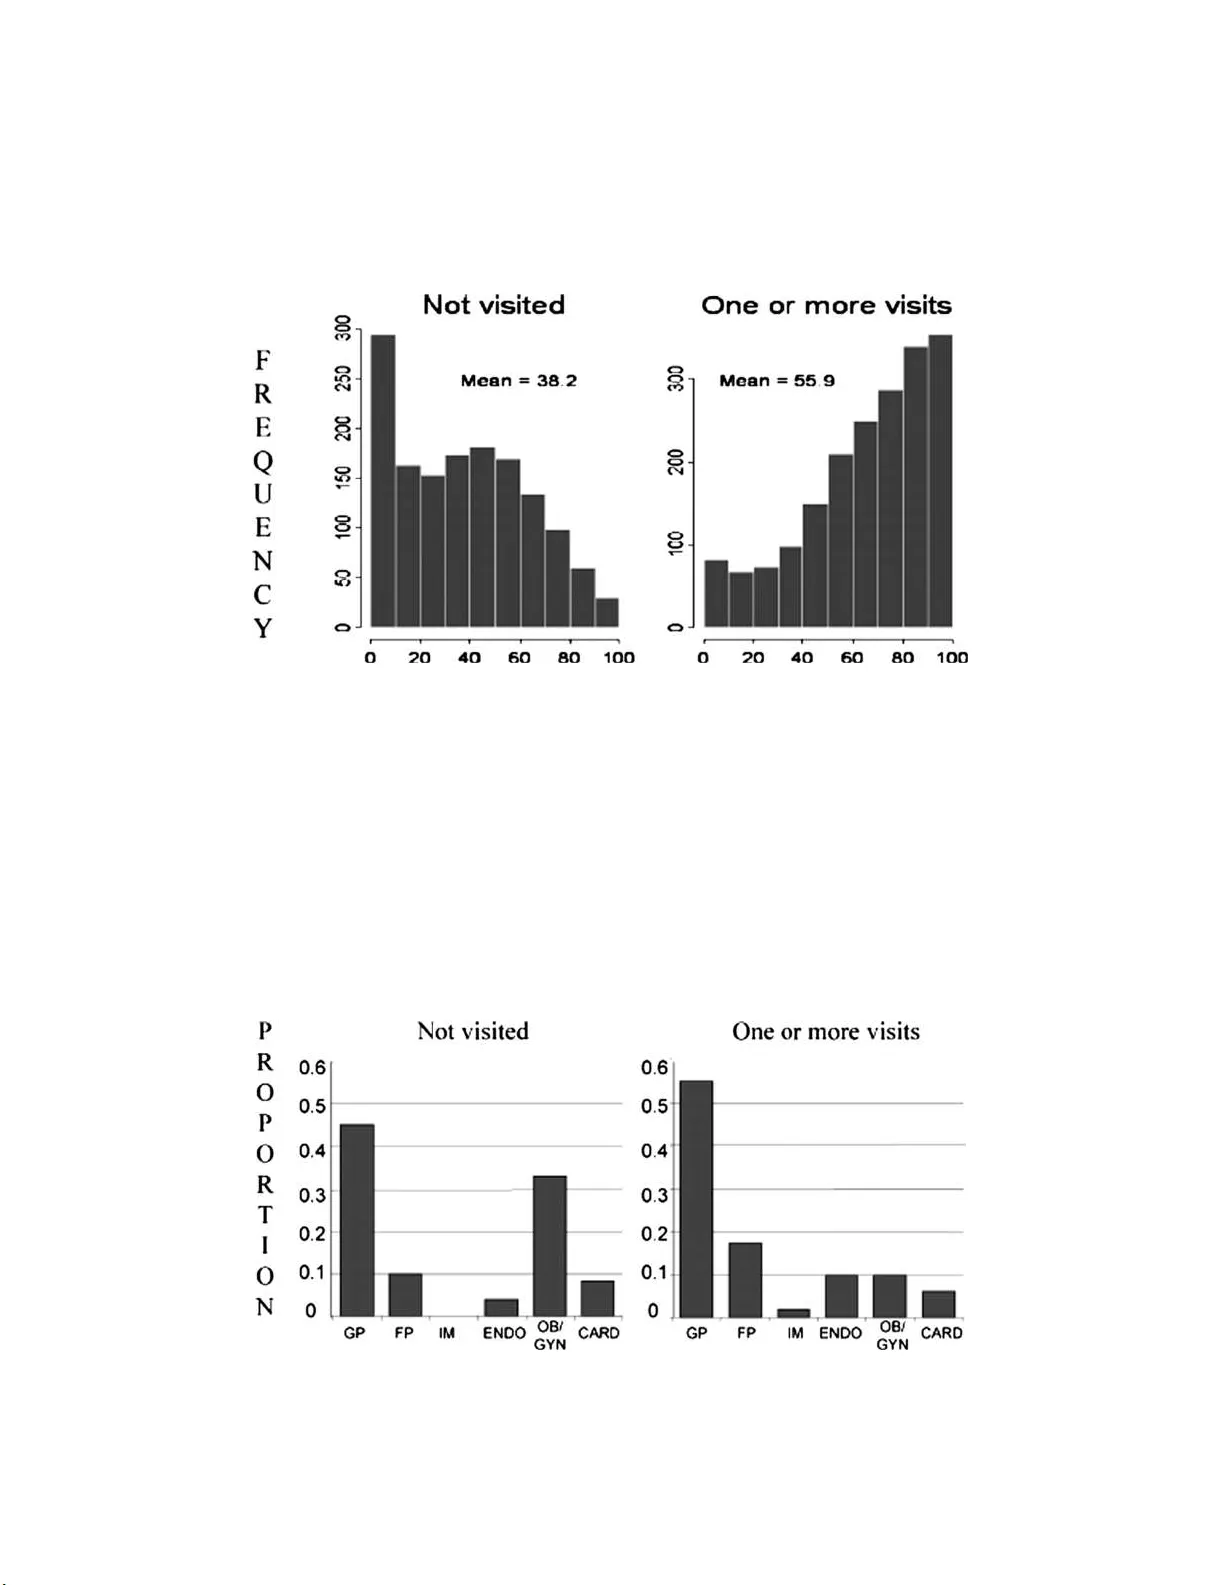
The Annals of Applie d Statistics 2008, V ol. 2, No. 3, 808–84 0 DOI: 10.1214 /08-A OAS187 c Institute of Mathematical Statistics , 2008 F OR OBJECTIVE CA USAL INFERENCE, DESIGN TR UMPS ANAL YSIS 1 By Donald B. R ubin Harvar d University F or obtaining causal inferences that are ob jectiv e, and therefore hav e the b est chance of rev ealing scientific truths, carefully designed and executed randomized experiments a re generally considered to be the gold standard. Observ ational studies, in contrast, are generally fraugh t with p roblems that compromise any claim for ob jectivity of the resulting causal inferences. The thesis here is th at observ ational studies hav e to be caref ully designed to approxima te randomized ex - p erimen ts, in particular, without examining any fi n al outcome data. Often a candidate data set will ha ve to b e rejected as inadequate b e- cause of lac k of d ata on key co va riates, or because of lac k of ov erlap in the distributions of k ey co v ariates b etw een treatment and control groups, often rev ealed by careful prop ensity score analyses. S ome- times th e template for the app roximating randomized exp eriment will ha ve to b e altered, and the use of principal stratification can b e helpful in doing this. These issues are discussed and illustrated u sing the framew ork of p otential outcomes to define causal effects, whic h greatly clari fies critical issues. 1. Randomized exp erimen ts v ersus observ ational studies. 1.1. Historic al dichotomy b e twe en r andomize d and nonr andomize d st ud- ies for c ausal effe cts. F or ma y yea rs, causal in f erence based on randomized exp erimen ts, as describ ed, for example, in classic texts by Fisher ( 193 5 ), Kempthorne ( 195 2 ), Co c hran and Cox ( 1950 ) and Cox ( 1958 ), was an en- tirely d istinct endeav or than causal inference based on observ ational data sets, describ ed, for example, in texts by Blalock ( 1964 ), Kenny ( 1979 ), Campb ell and S tanley ( 196 3 ), Co ok and C ampb ell ( 1979 ), Rothman ( 1986 ), Received Ma y 2008; revised June 2008. 1 This work was supp orted in part by NSF Grant SES - 05-50887 and NIH Grant R01 DA023 879-01. Key wor ds and phr ases. Average causal effect, causal effects, complier a verage causal effect, instrumental vari ables, noncompliance, observ ational stu d ies, prop ensit y scores, randomized experiments, R ubin Causal Mo del. This is an electr o nic reprint of the original ar ticle published by the Institute of Mathematical Statistics in The Annals of Applie d S tatistics , 2008, V ol. 2, No. 3, 80 8 –840 . This re pr in t differs fro m the o riginal in pagination and typogr aphic detail. 1 2 D. B. RUBIN Lilienfeld and Lilienfeld ( 19 76 ), Maddala ( 1977 ) and C o c hr an ( 1983 ). This b egan to change in the 1970’s when the us e of p otent ial outcomes, commonly used in the con text of randomized exp erimen ts to define causal effects since Neyman ( 1923 ), w as used to d efine causal effects in b oth randomized exp er- imen ts and observ ational studies [ Rubin ( 1974 )]. Th is allo w ed the definition of assignment mec h anisms [ Rubin ( 1975 )], with rand omized exp erimen ts as sp ecial cases, thereby allo wing b oth types of studies for causal effects to b e considered w ithin a common framew ork sometimes called the Rubin Causal Mo del [RCM– Holland ( 1986 )]. In particular, the same underlying p rinciples can b e used to design b oth t yp es of stu d ies, and the thesis of this article is that f or ob jectiv e ca usal inference, those principles m u st b e used. 1.2. The app e al of r andomize d e xp eriments for estimating c ausal effe cts. F or m an y ye ars, most researc hers ha v e agreed that f or drawing inferences ab out causal effects, classical randomized exp erimen ts, when feasible, are preferable to other metho ds [e.g., Co c h ran ( 1965 )]. Ho w ev er, randomized exp erimen ts can b e infeasible f or a v ariet y of ethical and other practical considerations, and th e length of time w e ma y ha v e to w ait for their answers can b e to o long to b e helpfu l for imp ending decisions. Neve rtheless, the p ossibilit y of conducting a rand omized experiment should still b e considered whenev er a causal question arises, a p oint also made b y Co c h ran ( 1965 ), whic h he attributed to earlier wo rk b y Dorn ( 195 3 ). Among the w ell-kno wn reasons for this admir ation for randomized ex- p eriment s is the ob jectivit y of th e dec isions for treatmen t assig nmen t—the decision rules are explicit wit h a pr obabilit y strictly b et we en zero and one that eac h exp erimen tal u nit will b e exp osed to either the treatmen t or con- trol condition (for simplicit y of exp osition, this article will deal w ith the case of only t wo exp erimen tal conditions or exp osu r es, called generically “treat- men t” and “cont rol”). Th ese unit-lev el probabilities, or p r op ensit y s cores [ Rosen b au m and Rubin ( 1983 )], are kno wn from the design of the exp eri- men t, and are all t hat are needed to obtain un b iased estimate s of a v erage treatmen t effect s (i.e., the a v erage effect of the treatmen t relativ e to con trol across all units). This unbiasedness prop erty is suggestiv e of the p o werful role that p rop ensit y scores pla y in causal effect estimation, ev en though unbia sedness is not an essentia l, or even alw ays desirable, pr op ert y of esti- mators. Another reason why randomized exp erimen ts are so app ealing, a r ea- son, that is, of course not r eally distinct from their ob jectivit y , is that they ac hiev e, in exp ectati on, “balance” on all pre-treatmen t-assignmen t v ariables (i.e., co v ariates), b oth measured and un measured. Balance here means that within wel l-defined subgroup s of treatmen t and con trol un its, the distribu - tions of co v ariates differ only randomly b et wee n the treatmen t and con trol units. F OR OBJECTIVE CA U SAL IN FERENCE, DESIGN TRUMPS A NAL YSIS 3 A third feature of randomized exp erimen ts is that they are automatical ly designed w ithout access to any outcome data of an y kind; again, a feature not ent irely d istinct from the pr evious reasons. In this sense, randomized exp erimen ts are “prosp ectiv e.” When imp lemented according to a prop er proto col, there is no wa y to obtain an answe r that systematical ly fa vo rs treatmen t o v er con trol, or vice v ersa. The theme of this article is that man y of the app ealing features of ran d om- ized exp eriment s can and sh ould b e duplicated when d esigning observ ational comparativ e stu dies, that is, nonrandomized studies wh ose pur p ose is to ob- tain, as closely as p ossible, the same answer that would hav e b een obtained in a r andomized exp erimen t comparing the same analogous treatmen t and con trol conditions in the same p opulation. In this p r o cess of design, the usual mo dels relating observed fi nal outcome data to observ ed cov ariates and treatmen t indicators pla y n o part, just as they d o not in the design of a randomized exp eriment. The only mo dels that are used relate treatmen t indicators to observe d co v ariates. 1.3. Observational studies as appr oximatio ns of r andomize d exp eriments. All s tatistical stud ies for causal effects are seeking the same type of answer, and r eal w orld randomized exp eriment s and comparativ e observ ational stud- ies do not f orm a d ic hotom y , but rather are on a con tinuum, from w ell-suited for d ra win g causal inf erences to p o orly suited. F or example, a randomized exp erimen t with medical patien ts in whic h 90% of them do not comply with their assignments and there are many unintended missin g v alues d u e to patien t drop out is quite p ossibly less lik ely to lead to correct inferences for causal inferen ces than a carefully conducted observ ational study with similar patien ts, with many co v ariates recorded that are relev an t to w ell-understo o d reasons for the assignment of treatmen t v ersus con trol conditions, and with no unint ended missing v alues. The u nderlying theoretical p ersp ectiv e for the approac h tak en here wa s called the “Rubin Causal Mo d el (R CM)” by Holland ( 1986 ) f or a sequence of pap ers written in the 1970s [Rubin ( 1974 , 1975 , 197 6a , 1977 , 1978 , 1979a , 1980 )]. The RCM can b e seen as ha ving t wo essen tial parts, toget her called the “p oten tial outcomes with assignmen t mec hanism” p ersp ectiv e [ Rubin ( 1990 a ), page 476], and a third optional part, wh ic h inv olv es extensions to include Bay esian inference, only briefly m en tioned h ere b ecause our fo cus is on design, not analysis. The first part of the RCM is conceptual, and it defines causal effects as comparisons of “p oten tial outcomes” (defined in Section 2 ) u nder d ifferen t treatmen t conditions on a common set of un its. It is critical that this first part b e carefully articulated if causal inferences are to pr ovide meaningful guidance for p r actice . Th e second part concerns the explicit consideration of an “assignmen t mec h anism.” T h e assignmen t mec hanism describ es the 4 D. B. RUBIN pro cess that led to some un its b eing exp osed to the treatmen t condition and other units b eing exp osed to the control condition. The careful descrip- tion and implementa tion of these t w o “design” s teps is absolutely essen tial for dr a wing ob j ectiv e inferences for causal effects in practice, whether in randomized exp erimen ts or observ ational studies, y et the steps are often ef- fectiv ely ignored in obs erv ational stud ies relativ e to details of the metho ds of analysis for causal effects. One of the reasons for this misp laced empha- sis may b e that the imp ortance of design in p ractice is often difficult to con vey in the con text of tec hnical statistical articles, and, as is common in man y academic fields, tec hn ical dexterit y can b e more v alued than practical wisdom. This article is an attempt to r efo cus wo rk ers in observ ational studies on the imp ortance of design, w h ere b y “design” I mean all con templating, col- lecting, organizing, and analyzing of data that tak es place p rior to seeing any outcome data. Thus, for example, design includes conceptualizatio n of the study and analyses of co v ariate d ata used to create matc h ed treated-con trol samples or to create sub classes, eac h with similar co v ariate distributions for the treated and con trol subsamples, as we ll as the sp ecifica tion of the primary analysis plan for the outcome d ata. Ho w ev er, an y analysis that re- quires fin al outcome data to implemen t is not part of design. Th e same p oint has b een emphasized in Rubin ( 2002 , 2007 ) and the subsequent editorial by D’Agosti no and D’Agostino ( 200 7 ). A br ief review of the tw o essen tial parts of the R CM w ill b e giv en in Sec- tion 2 , w h ic h int ro duces terminology and notation; an encyclop edia ent ry review is give n by Im b ens and Rub in ( 2008 a ), a chapter length review is in Rubin ( 2008 ), and a full-length te xt from this p ersp ectiv e is Im b ens and Rubin ( 2008 b ). Section 3 fo cus es on the assignment mec hanism, the real or h yp o- thetical rule used to assign treatmen ts to the u nits, and on the imp ortance of trying to reconstruct the hyp othetical randomized exp erimen t that led to the observ ed data, this reconstruction b eing conducted w ithout examining an y fin al outcome data in that observ ational data set. Then Section 4 illustrates the design of an observ atio nal study using prop ensity scores and sub classificat ion, first in the con text of a cla ssic single- co v ariate example from Co c h ran ( 196 8 ) with one backg round co v ariate. Sec- tion 4 go es on to explain ho w prop ensit y s core metho ds allo w the design of observ ational studies to b e extended to cases with many co v ariates, first with an example comparing treatmen ts for breast cancer to illustrate how this extension can b e applied, and second, w ith a marketi ng example to il- lustrate the kind of balance on observ ed co v ariates that can b e ac hiev ed in practice. S ection 5 u ses a K arolinsk a Institute example to illustrate a differ- en t p oin t: that the same observ ational data set may b e used to sup p ort tw o (or more) different templates for un derlying rand omized exp erimen ts, and one that may b e far more plausib le than the other. The concluding Section 6 briefly su mmarizes ma jor p oin ts. F OR OBJECTIVE CA U SAL IN FERENCE, DESIGN TRUMPS A NAL YSIS 5 2. Brief review of the parts of the RCM relev an t to d esign. 2.1. Part one: units, tr e atments, p otential outc omes. Thr ee basic con- cepts are used to defi n e causal effects in the R CM. A unit is a physical ob- ject, for example, a p atien t, at a p articular p lace and p oin t in time, s ay , time t . A tr eatment is an action or in terv entio n that can b e initiated or withheld from that unit at t (e.g ., an an ti-h yp ertensiv e drug, a job-training program); if the activ e treatment is withheld, w e will sa y that th e unit has b een ex- p osed to the contro l treatmen t. Asso ciated with that unit are t w o p oten tial outcomes at a future p oin t in time, sa y , t ∗ > t : the v alue of some outcome measuremen ts Y (e.g., chole sterol level , income, p ossibly v ector v alued w ith more than one comp onen t) if the activ e treatmen t is giv en at t, Y (1), and the v alue of Y at the same futu re p oint in time if the cont rol treatmen t is giv en at t, Y (0). T h e causal effect of the treatmen t on that u nit is defin ed to b e the comparison of the treatment and con trol p oten tial outcomes at t ∗ (e.g., their difference, their ratio, the r atio of their squ ares). The times t can v ary from unit to unit in a p opulation of N units, bu t typic ally the in terv als, t ∗ − t , are essentia lly constan t across the N u nits. The f ull set of p oten tial outcomes comprises all v alues of the outcome Y that could b e observe d in some real or hyp othetical exp erimen t comparing the activ e treatmen t to the cont rol treatmen t in a p opulation of N units. Under the “Stable Unit-T reatmen t V alue Assumption (SUTV A)” [Ru bin ( 1980 , 1990a )], the fu ll set of p otent ial outcomes for tw o treatmen ts and the p opulation of N units can b e represent ed by an arra y with N ro ws, one for eac h u nit, and tw o “sup er” columns, one for Y (0) and one for Y (1), “sup er” in the sense that Y can b e multi-co mp onent. The fundamenta l problem fac- ing causal inference [ Holland ( 1986 ); Ru bin ( 1978 ), S ection 2.4] is that for the i th unit, only one of the p otent ial outcomes for eac h un it, either Y (0) or Y (1), can ev er b e observed. In con trast to outcome v ariables, co v ariates are v ariables, X , that for eac h unit take the same v alue no matter whic h treat- men t is applied to the unit, suc h as qu an tities d etermined (e.g., measured) b efore treatmen ts are assigned (e.g., age, pre-treatmen t blo o d pressure or pre-treatmen t education). The v alues of all these v ariables und er SUT V A is the N ro w arra y , [ X , Y (0) , Y (1)], wh ic h is the ob ject of causal inference called “the science.” A causal effect is, b y d efinition, a comparison of tr eatment and con trol p oten tial outcomes on a common set of units; f or example, the av erage Y (1) min us the a verage Y (0) across all un its, or the median log Y (1) ve rses th e median log Y (0) for those units who are female b et w een 31 and 35 yea rs old, as ind icated b y their X v alues, or the median [ log Y (1) − log Y (0)] for those u n its whose Y (0) and Y (1) v alues are b oth p ositiv e. It is critical ly imp ortan t in pr actice to k eep this definition fi rmly in mind. 6 D. B. RUBIN This first p art of the RCM is conceptual and can, and t yp ically should, b e conducted b efore seeing any data, esp ecially b efore seeing an y outcome data. It forces the conceptualization of causal questions in terms of real or h yp othetical manipulations: “No causation without manip ulation” [ Rub in ( 1975 )]. Th e formal use of p oten tial outcomes to define un it-lev el causal ef- fects is due to Neyman in 1923 [ Rubin ( 19 90a )] in the con text of randomized exp erimen ts, and w as a marvelo usly clarifying cont ribution. But eviden tly this notation was not formally extended to nonr andomized settings until Rubin ( 1974 ), as d iscussed in Rubin ( 1990a , 2005 ) and Imbens and Ru bin ( 2008 a , 2008b ). The in tuitiv e id ea b ehin d the use of p otent ial outcomes to d efine causal effects must b e ve ry old. Nev ertheless, in the con text of n onrandomized ob- serv ational studies, prior to 1974 ev eryone app eared to use the “observ ed outcome” notation when discussing “formal” causal inference. More explic- itly , letting W b e the column v ector ind icating the treatmen t assignmen ts for the un its ( W i = 1 if treated, W i = 0 if con trol), the observed outcome notation r eplaces the arra y of p oten tial outcomes [ Y (0) , Y (1)] with Y obs , where th e i th comp onen t of Y obs is Y obs ,i = W i Y i (1) + (1 − W i ) Y i (0) . (2.1) The observ ed outcome notation is inadequate in general, and can lead to se- rious err ors—see, f or example, the discussions in Holland and Rubin ( 1983 ) on Lord ’s parado x, and in Ru bin ( 2005 ), w here errors are explicated that Fisher made b ecause (I b eliev e) he esc hew ed the p otent ial outcome notation. The essen tial pr oblem with Y obs is that it mixes up the science [i.e., Y (0) and Y (1)] with what is done to learn ab out the science via the assignmen t of treatmen t conditions to the units (i.e. , W i ). 2.2. Part 2: the assignment me chanism. The second part of the R CM is the form ulation, or p ositing, of an assignmen t m ec hanism, wh ic h describ es the reasons f or the m issin g and observed v alues of Y (0) and Y (1) thr ough a probabilit y mo del for W giv en the science: Pr( W | X, Y (0) , Y (1)) . (2.2) Although this general formula tion, with the p ossible d ep endence of assign- men ts on th e y et to b e observed p oten tial outcomes, arose first in Rubin ( 1975 ), sp ecial cases we re muc h discussed prior to that. F or example, ran- domized exp eriment s [Neyman ( 1923 , 1990 ), Fisher ( 1925 )] are “un con- founded” [ Rubin ( 1990b )], Pr( W | X, Y (0) , Y (1)) = Pr( W | X ) , (2.3) and they are “pr obabilistic” in the s en s e that their u nit lev el probabilities, or prop ensit y scores − e i , are b oun ded b et w een 0 and 1: 0 < e i < 1 , (2.4) F OR OBJECTIVE CA U SAL IN FERENCE, DESIGN TRUMPS A NAL YSIS 7 where e i ≡ P r ( W i = 1 | X i ) . (2.5) When the assignmen t mec hanism is b oth probabilistic [( 2.4 ) an d ( 2.5 )] and unconfounded ( 2.3 ), then for all assignments W that hav e p ositiv e pr oba- bilit y , the assignment mec h anism generally can b e w r itten as p rop ortional to the pro du ct of the u nit lev el p rop ensity scores, whic h emph asizes the imp ortance of prop ensit y scores in design: Pr( W | X, Y (0) , Y (1)) ∝ N Y i =1 e i or = 0 . (2.6) The collec tion of p rop ensit y scores defined by ( 2.5 ) is the m ost basic in- gredien t of an u nconfounded assignment mec hanism b ecause of ( 2.6 ), and its use for ob jectiv ely d esigning obs erv ational stud ies will b e dev elop ed and illustrated here, primarily in Section 4 , b ut also in the conte xt of a more complex d esign discussed in Section 5 . The term “prop ensit y scores” wa s coined in Rosen b au m and Rubin ( 1983 ), where an assignment mec hanism satisfying ( 2.4 ) and ( 2.5 ) is called “strongly ignorable,” a stronger v ersion of “ignorable” assignmen t mechanisms, coined in Rubin ( 1976a , 1978 ), which allo ws p ossible dep end ence on observed v al- ues of the p oten tial outcomes, Y obs defined by ( 2.1 ), su c h as in a sequen tial exp erimen t: Pr( W | X, Y (0) , Y (1)) = Pr( W | X, Y obs ) . But un til Rubin ( 1975 ), r andomized exp erimen ts we re not defin ed us- ing ( 2.3 ) an d ( 2.4 ), w hic h explicitly sho w su c h exp erimen ts’ freedom f r om an y dep endence on observ ed or missing p oten tial outcomes. Instead, ran- domized exp erimen ts were describ e d i n s uc h a wa y that the assignmen ts only dep end ed on a v ailable cov ariates, and s o implicitly d id not inv olv e the p oten tial outcomes themselv es. But explicit mathematica l n otation, like Neyman’s, can b e a m a jor ad v ance o v er implicit descriptions. Other sp ecial ve rsions of assignmen t mechanisms were also discussed prior to Ru bin ( 1975 , 1978 ), b ut without the b enefit of explicit equ ations for the assignmen t mechanism showing p ossible dep endence on the p oten tial out- comes. F or example, in economics, Ro y ( 1951 ) describ ed, without equations or notation, “self-optimizi ng” b eha vior where eac h unit chooses the treat- men t with the optimal outcome. And another we ll-kno wn example from economics is Haa v elmo’s ( 1944 ) formulatio n of supply and demand b ehav- ior. But these and other formula tions in economics and elsewhere did not use the notatio n of an assignmen t mec hanism, nor did they ha ve method s of statistic al in ference for causal effects based on the assignmen t mec hanism. Instead, “regression” mo dels were used to pred ict Y obs ,i from X i and W i , 8 D. B. RUBIN with p ossible restrictions on some r egression co efficien ts and/or on “error” terms. In these mo dels certain regression co efficients (e.g., for W i or for in- teractio ns with W i ) w ere interpreted as causal effects; analogous approac hes w ere used in other so cial sciences, as we ll as in epidemiology and m ed ical researc h, and are still common. Suc h r egression m o dels were and are b ased on combined assumptions ab out th e assignmen t mec hanism and ab out the science, whic h were t ypically only v aguely explicated b ecause they often w ere stated through r estrictions on error terms, and therefore could, and sometimes did, lead to mistak es. Inferent ial metho ds based only on the assumption of a randomized assign- men t mec hanism were prop osed b y Fisher ( 1925 ) and d escrib ed by Neyman ( 1923 ) and further deve lop ed by others [see Ru bin ( 1990 a ) for some ref- erences]. The existence of these assignmen t-based m etho ds, and their su c- cess in p ractice, do cumen ts that the mo del for the assignmen t mec hanism is m ore fu ndament al for inference f or causal effects than a mo del for the science. T hese metho ds lead to concepts such as unbiase d estimation and asymptotic confid ence in terv als (due to Neyman), and p -v alues or signifi- cance lev els for sharp null h yp otheses (du e to Fisher), all defined by the distribution of statistics (e.g., the difference of treatmen t and control sam- ple means) ind uced by the assignment mechanism. In some con texts, suc h as the U.S. F o o d and Drug Administration’s approv al of a new drug, suc h assignmen t mec hanism-b ased analyses are considered the gold s tand ard f or confirmatory inferences. The third and final part of the RCM is optional; it in v olv es sp ecifying a full probabilit y mo d el for the science, the qu antit y b eing cond itioned on in the assignmen t mec hanism ( 2.2 ), and therefore treated as fixed in assignment- based approac hes. Th is app roac h is Ba y esian, and w as dev elop ed by Ru- bin ( 1975 , 1978 ) and further d ev elop ed, for example, in Imbens and R u bin ( 1997 ) and in many other places. This can, in sp ecial simple cases, lead to the use of stand ard mo dels, such as ordinary least squares regression mo d- els, but su ch mo dels are generally not relev ant to the d esign of observ ational studies. Of course, there are other frameworks for causal inf erence b esides mine, including ones wh ere mo dels ha ve some relev ance, bu t that is not the topic or fo cus of this article. The r eader inte rested in v arious u ses of mo dels on the science ( X , Y (0) , Y (1)) can examine the text by Morgan and Winship ( 2007 ), wh ich provides a fairly comprehensiv e discussion of d ifferent ap- proac hes. Also informativ e, bu t with an applied an d p rescriptiv e attitude, including some advice on design issues, is the text by Sh adish , Co ok and Campb ell ( 2002 ). F OR OBJECTIVE CA U SAL IN FERENCE, DESIGN TRUMPS A NAL YSIS 9 3. Design observ ational studies to app ro ximate ran domized trials—gener- al advice. 3.1. Overview. A crucial idea when trying to estimate causal effects from an observ ational dataset is to conceptualize the observ ational d ataset as h a v- ing arisen from a complex rand omized exp erimen t, wh ere the rules used to assign the treatmen t conditions h a ve b een lost and m ust b e reconstructed. There are v arious steps that I consider essen tial for designing an ob jectiv e observ ational study . T hese will b e describ ed in this section and then illus- trated in the remaining parts of this article. In pr actice , the steps are n ot alw ays conducted in the order giv en b elo w, b ut often they are, esp eciall y when facing a particular candid ate data set. 3.2. What was the hyp oth etic al r andom ize d e xp eriment that le d to the observe d dataset ? As a consequence of our conceptualiz ation of an observ a- tional stud y’s data as ha ving arisen from a hypothetical randomized exp eri- men t, the first activit y is to think hard ab ou t that hyp othetic al exp eriment. T o start, what exac tly were the treatmen t conditions and what exactl y were the outcome (or resp ons e) v ariables? Be aw are that a particular observ a- tional dataset can often b e conceptualized as ha vin g arisen fr om a v ariet y of differen t h yp othetical exp erimen ts with differing treatmen t and con trol con- ditions and p ossibly differing outcome v ariables. F or example, a dataset with copious measurements of humans’ prenatal exp osures to exogenous agen ts, suc h as hormones or barbiturates [e.g. , Rosen b au m and Rubin ( 1985 ), Reinisc h et al. ( 1995 )], could b e pr op osed to ha v e arisen from a random- ized exp erimen t on prenatal h ormone exp osur e, or a rand omized exp erimen t on prenatal b arbiturate exp osure, or a rand omized factoria l exp eriment on b oth horm one and barb iturate exp osur e. But the inv estigato r m ust b e clear ab out the h yp othetical exp eriment th at is to b e appr o ximated by the ob- serv ational data at hand. Run ning regression programs is n o su bstitute for careful thinking, and providing tables summarizing computer output is n o substitute for pr ecise writing and careful in terpretation. 3.3. Ar e sample sizes in the dataset ade quate ? If the step present ed in Section 3.1 is successful in the limited sense that measuremen ts of b oth treatmen t conditions and outcomes seem to b e av ailable or obtainable from descriptions of the observ ational dataset, the n ext step is to decide whether the sample sizes in this dataset are large enough to learn an ything of inte rest. Here is where traditional p o w er calculat ions are relev an t; also extensions, for example, inv olving the ratios of samp le sizes needed to obtain well- matc hed samples [ Rub in ( 1976 b ), Section 5], are relev an t, and should b e consid ered b efore plunging ahead. Sometimes, the sample sizes will b e small, b ut the data set is the only one a v ailable to address an imp ortan t qu estion. In su c h 10 D. B. RUBIN a case, it is legitimate to pro ceed, but efforts to create b etter data s h ould b e initiate d. If the a v ailable samp les app ear adequate, then the next step is to strip an y fin al outcome measuremen ts from the dataset. When d esigning a ran- domized exp eriment , we cannot lo ok at an y outcome m easur emen ts b efore doing the design, and this crucial f eature of ran d omized exp eriments can b e, and I b eliev e must b e, implemen ted w hen designing observ ational studies— outcome-free design is absolutely critical for ob jectivit y . This p oin t w as made v ery strongly in Rubin ( 2007 ), but somewhat sur prisingly , it w as not empha- sized muc h in older wo rk, for example, in Co chran’s w ork on observ ational studies as review ed in Rubin ( 1984 ), or ev en in most of my subsequen t w ork on matc hing summarized in Rubin ( 2006 ) prior to the m id -1990 s. But I now firmly b eliev e that it is critical to hide all outcome data until the design phase is complete. A subtlet y h ere concerns “in termediate outcome data” discussed in Section 5 , su c h as compliance measurements. 3.4. Who ar e the de cision makers for tr e atment assignment and what me a- sur ements wer e available to them ? The next step is to think ve ry carefully ab out wh y s ome u nits (e.g., medical patien ts) receiv ed the activ e treatmen t condition (e.g., surgery) versus the control treatmen t condition (e.g., no surgery): Who were the d ecision mak ers and what rules d id they use? In a randomized exp erimen t, the randomized decision rules are explicitly written do w n (hop efully), and in any su b sequen t publication, the rules are lik ewise t ypically explicitly d escrib ed. But with an observ ational stud y , w e ha ve to w ork muc h harder to describ e and ju stify the h yp othetical approximat ing randomized assignment mec hanism. In common practice with observ ational data, ho w ev er, this step is ignored, and replaced b y descriptions of the r e- gression programs u sed, whic h is entirely inadequate. What is n eeded is a description of critical information in the h yp othetical randomized exp eri- men t and how it corresp onds to the observ ed data. F or example, what we re the bac kground v ariables measured on the ex- p eriment al units that w ere a v ailable to those making treatmen t decisions, whether observ ed in the current dataset or not? These v ariables will b e called the “k ey co v ariates” for this stud y . W as there more than one d ecision mak er, and if so, is it plausible that all decision mak ers u s ed the s ame rule, or nearly so, to mak e their treatmen t decisions? If not, in what w a ys d id the decision rules p ossibly v ary? It is remark able to me that so m an y published observ ational studies are totall y silen t on ho w the authors th in k that treat- men t conditions w ere assigned, y et this is the sin gle most crucial feature that m akes th eir observ ational studies inferior to r andomized exp eriments. 3.5. Ar e key c ovariates me asur e d wel l ? Next, consider the existence and qualit y of the k ey co v ariates’ measurements. If the k ey cov ariates are v ery F OR OBJECTIVE CA U SAL IN FERENCE, DESIGN TRUMPS A NAL YSIS 11 p o orly measured, or not even a v ailable in the dataset b eing examined, it is t ypically a wise c hoice to lo ok elsewhere for data to use to study the causal qu estion at hand. S ometimes sur rogate v ariables can b e found that are kno wn to b e highly correlate d with un measured ke y co v ariates and can pro xy for them. But n o amount of fancy analysis can salv age an inadequate data b ase unless there is substant ial scienti fic knowle dge to supp ort h eroic assumptions. This is a lesson that man y researc hers seem to ha v e difficulty learning. O ften the d ataset b eing used is so ob viously deficien t w ith resp ect to k ey co v ariates that it seems as if the researc her was committed to us in g that d ataset n o matter ho w d eficien t. And interact ions and n onlinear terms should not b e forgotten wh en considering cov ariates th at ma y b e key; for example, the assignmen t rules for medical treatmen ts could differ for those with and without medical insurance. 3.6. Can b alanc e b e achieve d on key c ovariates ? The n ext step is to try to find sub groups (sub classes, or matc hed pairs) of treated and cont rol units suc h that within a su bgroup, the treated and con trol un its app ear to b e bal- anced with resp ect to their distribu tions of k ey co v ariates. Th at is, within suc h a subgroup, the treated and con trol un its should lo ok as if they could ha ve b een randomly divided (usu ally not with equal probabilit y) in to treat- men t and con trol conditions. Often, it will not b e p ossible to ac hieve suc h balance in an entirel y satisfactory wa y . I n that situation, w e ma y h av e to restrict inferences to a subp opu lation of un its w here su c h balance can b e ac hiev ed, or we may ev en d ecide that with this dataset we cannot ac hieve balance with enough un its to m ak e the stud y wo rth while. If so, we should usually forgo using this dataset to address the causal question b eing con- sidered. A related issue is that if th ere app ear to b e many decision mak ers using differing rules (e.g., different hospitals with differen t rules for w hen to giv e a more exp ens iv e drug rather than a generic v ersion), then achie ving this balance will b e more difficult b ecause differen t efforts to create balance will b e requ ir ed for the differing decision make rs. This p oin t will b e clearer in the con text of particular examples. 3.7. The r esult. Th ese six steps com bine to mak e f or ob jectiv e observ a- tional study design in the sense that th e resultan t designed study can b e con- ceptualized as a hyp othetical, approxi mating r andomized blo c k (or paired comparison) exp eriment, whose blocks (or matc hed pairs) are our balancing groups, and where the probabilities of treatmen t v ersus con trol assignmen t ma y v ary relativ ely dr amatica lly across the blo c ks. T h is statemen t do es not mean the researc h er who follo ws these steps w ill ac h iev e an an s w er similar to the one that would ha ve b een found in the an alogous rand omized exp eri- men t, but at least the observ ational study has a c hance of d oing s o, whereas 12 D. B. RUBIN if these steps are n ot follo w ed, I b eliev e that it is only b lind lu ck that could lead to a similar answ er as in the analogous randomized exp eriment. Sometimes th e design effort can b e so extensive that a description of it, with n o analyses of any outcome d ata, can b e itself pub lish able. F or a sp ecific example on p eer infl uence on s m oking b eha viors, see Langensk old and Rubin ( 2008 ). 4. Examples u sing pr op ensit y scores and su b classification. 4.1. Classic example with one observe d c ovariate. The follo wing v ery simple example is take n from Co chran ( 1968 ) classic article on su b classi- fication in observ ational stud ies, whic h uses s ome smoking data to illustrate ideas. Let us sup p ose that w e w an t to compare death rates (the outcome v ariable of p rimary interest) among smoking males in the U.S., where the treatmen t condition is considered cigarette smoking and the con trol condi- tion is cigar and pip e smoking. Th ere exists a ve ry large dataset w ith the death rates of smoking males in the U.S., and it distinguishes b et w een these t wo t yp es of smoke rs. So far, so go o d , in that we ha ve a dataset with Y and treatmen t indicators, and it is very large. No w we strip this d ataset of all outcome data; n o s urviv al (i.e., Y ) d ata are left and are held out of sigh t unt il the design phase is complete. Next we ask (in a simple min ded wa y , b ecause this is only an illustrativ e example), who is the decision make r f or treatmen t versus con trol, and w hat are th e ke y co v ariates used to mak e this decision? I t is r elativ ely obvio us that the main decision mak er is the in dividual male smoker. It is also relativ ely ob vious that the dominant co v ariate used to m ak e this decision is age— most smok ers start in their teens, and most start by smoking cigarettes, not pip es or cigars. Some pip e and cigar smok ers start in college, but many start later in life. Cigarette smok ers tend to ha v e a more uniform distribution of ages. Other p ossible candidate ke y co v ariates are education, so cio-economic status, o ccupational status, in come, and so f orth, all of which tend to b e correlated with age, so to illustrate, w e fo cu s on age as our only X v ariable. Then our h yp othetical randomized exp eriment starts with male smok ers and randomly assigns them to cigarette or cigar/pip e smoking, where the prop en- sit y to b e a cigarette smok er rather than a ciga r/pip e smok er is view ed as a function of age. In this dataset, age is very wel l-measured. When w e compare the age distribution of cigaret te s m ok ers and age distribution of cigar/pip e smok ers in the U.S. in this d ataset, we see that the former are y ounger, but that there is sub stan tial o v erlap in the d istributions. Before moving on to the next step, we should w orry ab out ho w p eople in the h yp othetical ex- p eriment wh o died prior to the assem bling of the observ ational dataset are represen ted, but, for s implicit y in this illustrativ e example, w e will mov e on to the next step. F OR OBJECTIVE CA U SAL IN FERENCE, DESIGN TRUMPS A NAL YSIS 13 Ho w d o w e create s ubgroups of treatmen t and control males with more similar distribu tions of age than is seen o v erall, in fact, so similar that we could b eliev e th at the data arose from a rand omized blo c k exp eriment ? Co c h ran’s example u sed s u b classification. First, the smok ers are divided at the o ve rall median in to young smokers and old sm okers—t w o sub classes, and then divided in to yo ung, middle aged, and old smok ers, eac h of these three sub classes b eing equal size, and so forth. Finally , nine sub classes are used. The age distributions within eac h of the nine s u b classes are v ery similar for the treatmen t condition and the con trol condition, j ust as if th e men had b een rand omly assigned within the age sub classes to treatmen t and con trol, b ecause there is such a narro w range of ages w ithin eac h of the nine su b classes. And of great imp ortance, there do exist b oth treatment and con trol males in eac h of nine su b classes. The design phase can b e considered complete for our simple illustrativ e example. Our u nderlying hyp othetical r an d omized exp eriment that led to the observ ed dataset is a rand omized blo c k exp eriment with n ine blo cks defined by age, where the p robabilit y of b eing assigned to the treatmen t condition (cigarette smoking) rather than the con trol condition (ciga r/pip e smoking) d ecreases with age. W e are n o w allo w ed to lo ok at the outcome data w ithin eac h sub class and compare treatmen t and con trol death rates. W e find that, av eraging ov er th e nine blo c ks (sub classes), the death rates are ab out 50% greater for the cigarette smok ers than the cigar and p ip e smoke rs. Inciden tally , the full data set with n o sub classification leads to n early the opp osite conclusion; see Co c h ran ( 196 8 ) or Rubin ( 1997 ) for d etails. But what w ould h a ve hap p ened if we decided that we wa n ted to sub clas- sify also on education, so cio-ec onomic status, and income, eac h co v ariate using, let’s sa y , five lev els [a m in im u m num b er implicitly recommended in Co c h ran ( 1968 )]? T h ere wo uld b e four k ey co v ariates, eac h with fiv e lev- els, yielding a total of 625 sub classes. And many observ ational studies h a ve man y more than four k ey co v ariates that are kno wn to b e u s ed for making treatmen t decisions. F or example, with 20 su c h co v ariates, ev en if eac h is dic h otomous, there are 2 20 sub classes—greater than a million, and as a re- sult, man y su b classes would probably ha ve only one un it, either a treated or cont rol, with n o treatmen t-con tr ol comparison p ossible. Ho w should we design this step of observ atio nal studies in su ch more realist ic situations? 4.2. Pr op e nsity sc or e metho dolo gy. Rosen baum and Rubin ( 1983 ) pro- p osed a class of metho ds to try to ac h iev e balance in observ ational studies when there are m an y key co v ariates present. In r ecen t yea rs th ere h as b een an explosion of w ork on and interest in these metho ds; the In tro duction in Rubin ( 200 6 ) offers some references. Sadly , man y of the articles that u se prop ensity score m etho d s d o not u se them correctly to h elp design ob s erv a- tional studies according to the guidelines in Section 3 , whic h are motiv ate d 14 D. B. RUBIN b y the theoretical p ersp ectiv e of S ection 2 and illustrated in the trivial one- co v ariate example of Section 4.1 . Rather, these inappropriate applications, for example, use the outcome data to help c ho ose prop ensit y score mo dels, and use the prop ensit y score only as a p r edictor in a r egression mo del with the outcome, Y obs , as the d ep endent v ariable. The pr op ensit y score is the observ ational study analogue of complete r an- domization in a rand omized exp eriment in the sens e that its use is n ot in tend ed to increase p recision b ut only to eliminate systematic biases in treatmen t-con trol comparisons. In some cases, h o wev er, its use can in crease precision; for the reason, see Rubin and Thomas ( 1992 ). As we ha ve seen in earlier sections, it is formally defin ed as the p r obabilit y of a unit receiving the treatmen t condition, rather than the cont rol condition, as a fun ction of observ ed co v ariates, including indicator v ariables for the ind ividual decision mak ers and associated in teractio ns, if needed. Th e prop ensit y score is rarely kno w n in an observ ational study , and therefore m us t b e estimated, t ypically using a mo del suc h as logistic regression, bu t this c hoice, although common, is b y n o means mandatory or ev en ideal in man y circum s tances. The critical asp ect of the prop ensity score is that it mo dels the reasons for treatmen t v ersu s con trol assignment at the lev el of the decision maker. F or instance, in the cont ext of the expanded tobacco example of Section 4.1 , it could mo d el the c hoice of a male s mok er to smok e cigarett es versus cigars or p ip es as a function of age, income, education, S ES, etc. Once estimated, the linear v ersion of it (e.g., the b eta times X in the logisti c regression) can b e treate d as the only cov ariate, just like age in the example of S ection 4.1 , and it is used to matc h or sub classify the treatmen t an d con trol u n its. But w e are not d one ye t. W e h a ve to c hec k that balance on all co v ari- ates has b een ac hiev ed. If the prop ens ity s core is correctly estimated and there is b alance on it, then Rosen b au m and Rubin ( 1983 ) s h o wed that bal- ance is ac hieved on all observed co v ariates. The ac hieved balance within matc hed pairs or su b classes must b e assessed and do cumented b efore the design p h ase is fin ished. With only one co v ariate, balance on that co v ariate is easily ac h iev ed (if it can b e ac hiev ed) by u sing n arr o w enough s u b classes (or bins) of th e cov ariate. With many cov ariates, the assessmen t and r e- estimatio n of prop ensit y score to ac hieve balance can b e tric ky , and go o d guidance f or doing this is still b eing d ev elop ed. When selecting matc hed pairs, using b oth the prop ensit y score and some prognostically imp ortant functions of key co v ariates can often result in increased precision of estima- tion [see Rubin ( 1979 b ), Rosen b aum and Rub in ( 1985 ), Rubin and Thomas ( 2000 )]. Here we illustrate these v arious ideas in the con text of some real examples. The next example concerns th e relativ e s u ccess of tw o treatmen ts f or breast cancer, and illustrates not only th e pro cess of selecting the ke y b ackg round v ariables for use in the prop ensit y score estimation, but also illustrates that F OR OBJECTIVE CA U SAL IN FERENCE, DESIGN TRUMPS A NAL YSIS 15 careful observ ational studies can (not necessarily will) reac h the same general conclusions as exp ensiv e r an d omized exp eriments. Th e second example is from a large market ing study and displa ys the kind of balance that can b e ac hieve d follo wing prop en s ity score sub classification, as w ell as th e fact that some units can b e un matc hable. The last example, in S ection 5 , u ses a data s et on large v olume v ers u s small volume hospitals to emphasize that one observ ational data set can b e used to supp ort t wo (or more) differing templates for the u nderlying rand omized study of a particular question, and one template may b e considered f ar b etter than th e other. 4.3. GAO study of tr e atments for br e ast c anc er. The follo wing example app eared in a Go v ern men t Accoun ting Office (GA O) p ublication that was summarized in Rubin ( 1997 ). In the 1960s mastectom y w as the standard treatmen t for m an y forms of b reast cancer, bu t there wa s gro wing in terest in the p ossibilit y th at for a cla ss of less sev ere situations (e.g., small tumors, no de n egativ e) a more limited su rgery , wh ic h just r emo ve d the tum or, migh t b e just as successful as the more r adical and disfiguring op eration. Sev eral large and exp ensiv e r and omized trials w ere done for this category of w omen with less sev ere cancer, and th e results of these trials are su mma- rized in T able 1 . As can b e seen there, these stud ies suggest that for this class of w omen who are w illing to participate in a ran d omized exp erimen t, and for th ese cancer treating cen ters and their do ctors, wh o are also willing T able 1 Estimate d 5-ye ar survival r ates for no dene gative p atients i n six r andomize d clini c al trials Estimated Estimated surviv al surviv al rate for rate for Es timated Study W omen W omen wo men wo men causal effect Breast conserv ation Mastectom y Study (BC) (Mas) BC Mas BC–Mas Study n n % % % U.S.–NCI † 74 67 93.9 94.7 − 0 . 8 Milanese † 257 263 93.5 93.0 0 . 5 F rench † 59 62 94.9 96.2 − 1 . 3 Danish ‡ 289 288 87.4 85.9 1 . 5 EOR TC ‡ 238 237 89.0 90.0 − 1 . 0 U.S.–NSABP ‡ 330 309 89.0 88.0 1 . 0 † Single-cen ter trial; ‡ Multicenter trial. Reference: R ubin, D. B. Estimated causal effects from large datasets using prop ensit y scores. Annals of I nternal Medicine (1997); 127, 8(I I):757–763. 16 D. B. RUBIN to participate, the fi v e-ye ar surviv al rate app ears to b e ve ry s imilar in the t wo randomized treatmen t conditions. There is, h ow ev er, an in dication from T able 1 that the surviv al is b etter ov erall in the trials conducted in single cen ters (the top three ro ws) than in the multi- cen ter trials (the b ottom thr ee ro w s ), p ossibly b ecause of more sp ecialized care, including after care. The r eason this last commen t is r elev ant is that based on these r esults, the U.S. National Cancer I n stitute f elt that for this catego ry of w omen, the recommendation for general p ractice sh ould b e to ha ve b reast conserving op erations rather than the r adical ve rsion. The GAO w as concerned th at this advice based on these r and omized trials ma y not b e wise for general practice, w here the sur geons in volv ed ma y not b e as skilled, after care ma y b e lo wer qualit y , the women themselv es ma y b e less researc h-orien ted and therefore less medically astute ab out their o wn care, and so forth, than in the randomized trials. It wa s not p ossible to in itiate a new rand omized trial in the general p opulation of w omen and do ctors who ma y not wan t to b e rand omized; ev en if it were, the fundin g, planning, implement ing, etc., w ould tak e to o long an d results concerning fiv e-y ear surviv al would b e first a v ailable a decade in the future. Consequen tly , th e GAO imp lemen ted an observ ational study using the SEER (Survei llance, Epidemiology , End Results) data base, whic h has r ela- tiv ely complete information on all cancer cases in certain catc hment areas. Imp ortant ly , it had d etaile d information on the kind and diagnosed sev erit y of the cancer, so that they could us e the same exclusion criteria as the r an- domized exp eriment s, and it had the kind of treatmen t used by the sur gical team; also, it had surviv al inform ation, whic h of course was the key outcome v ariable. Moreo v er, it h ad many co v ariates. And it h ad ab out five thousand breast cancer cases of th e t yp e studied in the six randomized exp erimen ts during the relev an t p eriod , whic h wa s considered a large enough sample to pro ceed. So far so go o d. Th e outcome data were stripp ed from the files, and the design ph ase pro ceeded. The f ollo wing description is fr om an ov er 15 y ear old memory , and no doub t is somewh at distorted b y my cur ren t attitudes, b ut is largely accurate, I b eliev e. The GA O c hec k ed with a v ariet y of physicia ns ab out w ho the decision mak ers were for choic e of surgery for this category of wo men. Th e replies were that they w ere usually joint c hoices made by the sur geon and wo man, sometimes with inpu t from the husband or other family members or friend s. Some of the k ey co v ariates were ob vious, such as the size of the tumor and the wo man’s age and marital status. Others w ere less obvio us, suc h as urban ization, region of the count ry , ye ar, r ace, and v arious int eractions (e.g., age by marital status). In an y case, a list of app ro ximately t wen t y k ey co v ariates was assem bled, and it turned out that all had b een colle cted in SEER. More go o d news. Then the consistency of th e decision mak ers’ r ules across the dataset was consid er ed , although F OR OBJECTIVE CA U SAL IN FERENCE, DESIGN TRUMPS A NAL YSIS 17 at the time, not as seriously as I w ould do it no w. It was decided that the w ay w omen and do ctors used the key co v ariates wa s p rett y muc h the same aroun d the country , and any differences were probably captured by the observ ed co v ariates. Prop ensit y scores were estimated by logistic regression, and th ey we re used to create fiv e s ub classes of treatment /con trol women. The w omen were rank ed b y their estimate d pr op ensit y scores, and the lo w est 20% formed sub- class 1, the next 20% formed sub class 2, etc. Within eac h sub class, balance w as chec k ed, n ot only on the co v ariates included in the prop ensit y score, but also on all other imp ortan t co v ariates in the d atabase. F or example, the a v- erage age of a treated wo men within eac h sub class sh ould b e appro ximately the same as the a ve rage age of a control women in that sub class, and the pro- p ortion of eac h that are married should also b e as similar as if the treatment and con trol wo men in that sub class had b een randomly divided (ob viously , not w ith equal probabilit y across the sub classes). When less b alance wa s found on a key co v ariate within a sub class th an would ha v e o ccurred in a randomized exp eriment, terms w ere added to the prop ensit y score mo d el and balance wa s reassessed. Un f ortunately , those tables and the p ro cesses nev er surviv ed in to the final rep ort, bu t su c h balance was ac hiev ed—not p erfectly , but close enough to b eliev e in th e h yp othetical u nderlying randomized block exp erimen t that led to the observed data. The results of the s ub classification on the p rop ensit y score are sum m a- rized in T able 2 . I n general, this observ ational study’s results are consisten t with those f r om the r andomized trials. There is essen tially no evidence for an y adv an tage to the radical op eration, except p ossibly in those prop ensit y score sub classes wh ere the w omen and do ctors w ere more lik ely to select T able 2 Estimate d 5-ye ar survival r ates for no de-ne gative p atients in SEER data b ase within e ach of five pr op ensity sc or e sub classes: fr om tables i n U.S. GA O R ep ort [Gener al A c c ounting Offic e (1994)] Prop e nsity score sub class T r e atmen t cond ition n Estimate 1 Brest conserv ation 56 85.6% Mastectom y 1008 86.7% 2 Brest conserv ation 106 82.8% Mastectom y 964 83.4% 3 Brest conserv ation 193 85.2% Mastectom y 866 88.8% 4 Brest conserv ation 289 88.7% Mastectom y 978 87.3% 5 Brest conserv ation 462 89.0% Mastectom y 604 88.5% 18 D. B. RUBIN mastectom y (sub classes 1, 2, 3), b ut the d ata are certainly not definitiv e. Similarly , for the w omen and do ctors relativ ely more lik ely to select breast conserving op erations, there is some sligh t evidence of a surviv al b enefit to that choic e. If w e b eliev ed that th e treatmen t effect should b e the same for all w omen in the study , these changing r esults across prop ensit y sub classes could b e view ed as evidence of a confounded and nonignorable treatmen t as- signmen t (i.e., an omitt ed k ey co v ariate). Overall , ho w ev er, there app ears to b e no adv antag e to recommending one treatmen t o v er the other. I t is inter- esting to note that, consisten t with exp ectations, the o verall su rviv al rates in the observ atio nal d ataset are not as goo d as those in the more sp ecial ized cen ters r epresen ted in T able 1 . 4.4. Marketing example. Prop ensity score metho ds, lik e rand omizatio n, w ork b est in large samples. F or a trivial example, if we ha v e one m an and one w oman, one to b e treated and one to b e con trol, randomized treatmen t assignmen t in exp ectati on would create a half-man treated and half-wo man con trol, b ut in realit y the man w ould b e either treated or con trol and the w oman would b e in the other condition. With a h u n dred men and a h undr ed w omen, we would exp ect roughly half of eac h to b e in eac h treatmen t arm. Analogously , w ith prop ensit y scores, the creatio n of n arro w sub classes or matc hed pairs should create balanced distributions in exp ectatio n, wh ic h should b e easier to ac hieve and to assess in large samples than in small ones. The next example, fr om Rubin and W aterman ( 2006 ), illustrates this fea- ture well b ecause the sample sizes are large: 100,000 treated do ctors and 150,00 0 con trol do ctors. “T reated” h ere means visited b y a sales represen ta- tiv e (rep) at least once dur ing a certain six m on th p erio d; the sales rep tells the do ctor the details of a new weig h t-loss drug b eing promoted by a phar- maceutical compan y . Th e con trol do ctors are not visited by a sales rep from that compan y during that p erio d. Th e treatmen t/con trol in dicator v ariables come from th e companies’ records as pro vided b y the sales reps. The key outcome v ariable is the num b er of p r escriptions (scripts) of th is drug w ritten b y the do ctor durin g the follo wing six months; this information on scripts is obtained sev eral mon ths later from a third part y vendor, wh ic h is up dated at regular inte rv als. The pr evious v ersion of this data source and other sources ha ve all sorts of b ackg round information on the do ctors, suc h as sex, race, age, y ears since degree, s ize of practice, m edical sp ecialt y , num b er of scripts written in prior yea rs for the same class of drugs as b eing d escrib ed by the sales r ep, etc. In fact, there are well o v er 100 b asic co v ariates a v ailable. T he ob jectiv e of the observ ational study is to estimate the causal effects of the reps visiting these do ctors. It costs money to pa y the sales reps’ salaries to visit the do ctors, and moreo ve r, many reps get commissions based, in part, on the num b er of scripts written by the do ctors they visited for the detailed F OR OBJECTIVE CA U SAL IN FERENCE, DESIGN TRUMPS A NAL YSIS 19 Fig. 1. Histo gr ams f or b ackgr ound variable: prior Rx sc or e (0–100) at b aseline. drug. Do the visits cause more scripts to b e w r itten, and if so, whic h do c- tors should b e visited with higher pr iorit y? Both of these, and other similar questions, are causal ones. The decision-mak er for visiting or not the do ctors is essen tially the sales rep, and these folks, rather ob viously , like to visit do ctors who prescrib e a lot, who hav e large practices, are in a sp ecial t y that pr escrib es a lot of the type of dr ug b eing detailed, etc. Essent ially all of these b ac kground v ariables, X , and more, are a v ailable on the pu rc h ased data set, which has huge sample sizes; the company has the indicator W for visited v ersus not, and next Fig. 2. Histo gr ams f or b ackgr ound variable: sp e cialty. 20 D. B. RUBIN y ear’s pur chased d ata set will hav e the outcome v ariables Y on the actual n um b er of scrip ts written b y these do ctors in the next time p erio d. So things lo ok in go o d shap e to estimate and re-estimate th e prop ensit y scores until w e ac h iev e balanced distributions within sub classes, or w e decide that there are some t yp es of do ctors who h a ve essen tially no c hance of b eing visited or not b eing visited, and then n o estimat ion of causal effects will b e attempted for them. Figures 1 and 2 d isp la y the initial balance for tw o imp ortan t co v ariates, n um b er of pr ior scripts written in the previous y ear (for drugs in the s ame class as the detailed drug) on a scale from 0 (minim um) to 100 (the arbitrar- ily scaled m axim um), and th e sp ecialt y . These figures revea l quite d r amatic differences b et ween the do ctors who w ere v isited and those who were not visited. It is not sur prising that the visited do ctors we re the ones who wr ote man y more p rescriptions (p er do ctor) than the not visited do ctors. But the visited do ctors also ha v e a different distribution of sp ecialties than the not visited do ctors. F or example, ob-gyn d o ctors are visited relativ ely less often than d o ctors with other sp ecialties; presumably , ob-gyn doctors do n ot pre- scrib e weig h t-loss drugs for their pregnan t patien ts, and the sales reps use this information. Prop ensit y s cores were estimated by logistic regression b ased on v arious functions of all of the cov ariates. Figure 3 displays the histograms for the estimated linear prop ensit y scores (the ˆ β X in the logistic regression) among the not visited and visited d o ctors. Th ese histograms are sho wn with 15 sub classes (or b ins) of pr op ensit y scores. In some bin s , there are only visited do ctors, that is, in the bins with linear prop ensit y scores larger than 1.0; in those t w o bins , there are no do ctors wh o w ere not visited. Pr esu m ably , they are high p rescribing d o ctors with large pr actice s, etc. No causal inferences are p ossible for them without making mo d el-based assumptions relating outcomes to co v ariates for which there are no data to assess the underlying assumptions. Similarly , for the four lo west bins of prop ensit y , with linear scores less than 0.1, all do ctors are n ot visited, and so, similarly , n o causal inferences ab out the effect of visiting this t yp e of do ctor are p ossible unless based on u n assessable assumptions. But in the other nine bins, there are b oth visited and not visited d o ctors, and the claim is that within eac h of those bins, the distributions of all co v ariates that en tered th e p rop ensit y score estimatio n will b e nearly the same for th e visited and not visited do ctors. T o b e sp ecific, let us examine the bin b et w een 0.5 and < 0.6. Figures 4 an d 5 show the distributions of prior n um b er of p rescriptions and sp ecialti es in this bin for the not visited and visited do ctors. Th ese distributions are strikingly more similar than their coun terparts sh o wn in Figures 1 and 2 . In fact, they are so similar that one could b eliev e that, within that bin, the visited d o ctors are a random sample from all do ctors in that bin . And the claim is that this will hold (in F OR OBJECTIVE CA U SAL IN FERENCE, DESIGN TRUMPS A NAL YSIS 21 exp ectation) for all co v ariates used to estimate the prop ensity score and in all bins where there are b oth visited and n ot visited d o ctors. The pro cess of assessing balance was conducted for all v ariables and all bins and considered adequate in the sense that it was considered plausible Fig. 3. Histo gr ams for summarize d b ackgr ound variables: li ne ar pr op ensity sc or e. Fig. 4. Histo gr ams for a variable in a sub class of pr op ensity sc or es: prior Rx sc or e. 22 D. B. RUBIN that a randomized blo ck exp eriment had b ecome reconstructed, except for the b ins with only visited or not visited do ctors. Admittedly , there is an asp ect of “art” op erating here, in that random im b alance of prognostically imp ortan t co v ariates (i.e., ones thought to b e strongly related to outcome v ariables) w as considered more imp ortant to correct than more extreme im- balance in prognostically unimp ortan t ones, but the field of statistics will al- w a ys b en efi t from scien tifically informed though t. Nev ertheless, b etter guid- ance on ho w to condu ct this pr o cess more sys tematically is needed, and is in dev elopment; see, for example, Imbens and Rubin [( 2008b ), Chapters 13 and 14]. In any case the design p hase w as complete, except for the sp ecification of mo del-based adjustmen ts to b e made within the bins, and the more detailed analyses u sed to rank do ctors b y priorit y to visit. R eaders in terested in the conclusions, which are a bit sur prising, should c hec k Rubin and W aterman ( 2006 ). 5. A p rincipal stratification example. 5.1. The c ausal effe ct of b eing tr e ate d in lar g e volume v ersus smal l volume hospita ls. The thir d example illustrates the p oin t that the design phase in some ob s erv ational stu d ies may inv olv e conceptualizing the h yp othetical underlying randomized exp eriment that lead to the observ ed data as b eing more complex than a randomized blo c k or rand omized p aired comparison. In particular, in some situations, w e ma y ha ve to view th e hypothetical ex- p eriment as b eing a rand omized blo c k with noncompliance to the assigned treatmen t, a so-called “encouragemen t” design [Holland ( 1988 )]. In man y Fig. 5. Histo gr ams f or a variable in a sub class of pr op ensity sc or es: sp e cial ty. F OR OBJECTIVE CA U SAL IN FERENCE, DESIGN TRUMPS A NAL YSIS 23 settings with h u man sub j ects, ev en an essentia lly p erfectly designed random- ized exp eriment only r andomly assigns the encouragemen t to tak e treat men t or con trol b ecause we cannot force p eople to tak e one or the other. In the con text of a p erfectly double-blind exp erimen t, where the sub jects ha v e no idea w hether they are getting treatmen t or control , there will b e no differ- ence in compliance rates b et w een the treatment v ersus cont rol groups, but there are often side effects that create d ifferen t lev els of compliance in the conditions [ Jin and Rub in ( 2008 )]. In su c h cases, the ideas b ehind “instru- men tal v ariables” metho d s [ Angrist, Im b ens and Rubin ( 1996 )] as general- ized to “principal stratification” [ F r angakis and Ru bin ( 2002 )] can b e v ery useful. 5.2. Pr op e nsity sc or e sub classific ation for diagnosing hospital typ e. W e illustrate this d esign using a sm all observ ational data set fr om the Karolinsk a Institute in Sto c kh olm, Sweden. Int erest fo cuses on the tr eatment of cardia cancer patien ts in C en tral and Northern Sweden, and wh ether it is b etter for these patien ts to b e treate d in a large or small v olume hospital, wh ere v olume is defined by the num b er of patien ts with that t yp e of cancer treated in recen t y ears. The data set has 158 cardia cancer patien ts diagnosed b et w een 1988 and 1995, 79 d iagnosed at large vo lume hospitals, d efined as treating more than ten patien ts with cardia cancer during th at p erio d , and 79 d iagnosed at the remaining small volume hospitals. These sample sizes are small, b u t the data set is the only one currently a v ailable in Sweden to study this imp ortan t question. Generally , the commonly held view is that b eing treated in a large vo l- ume h ospital is b etter, bu t the opp osite argument could b e made when the large vo lume treating h osp ital is far from a sup p ort system of family and friends, whic h pr esumably ma y b e more a v ailable in s m all v olume hospitals. The most critical p olicy issu e concerns whether th e cardia cancer treatmen t cen ters at sm all volume hospitals can b e closed without ha ving a d eleterio us effect on patient surviv al. If so, r esources could b e sa v ed b ecause patien ts diagnosed at small volume hospitals could b e transf erred to large v olume treating hospitals, and if it is true that large v olume cardia cancer treat- men t cen ters offer b etter surviv al outcomes, then the small v olume ones should arguably b e closed in an y case. Our d ata set has hospital volume and patien t su rviv al information in it. Because of the uniform training of do ctors und er the so cialized medi- cal system in S w eden, the assignment of large ve rsus sm all “home h ospital t yp e,” wh ere the cancer w as d iagnosed, was considered by medical exp erts to b e un confounded, th at is, essent ially assigned at r andom within lev els of measured co v ariates, X : age at diagnosis, d ate of d iagnosis, sex of pa- tien t and urb an ization. The d ecision make r is th e individual patien t, so our 24 D. B. RUBIN Fig. 6. Car dia c anc er, numb er of p e ople, sub classifie d by pr op ensity sc or e. dataset seems well- suited for studying the causal effect of home hospital type on surviv al. Prop ensit y score analyses we re don e to pr ed ict diagnosing (home) hospital t yp e from X , including n onlinear terms in X . It w as decided that the age of patien t should b e limited to b et we en 35 and 84 b ecause the t wo patient s under 35 (actually b oth under 30) w ere b oth d iagnosed in large v olume hospitals, and longer term surviv al in the 8 cardia cancer patien ts 85 and o v er w as considered unlikel y n o matter where treated, and w ou ld therefore simply add noise to the surviv al data. Prop ens it y score analyses on the remaining 148 patien ts led to fi v e sub classes; these are summarized in Figures 6 – 8 are “Lo ve plots” [ Ahmed et al. ( 2006 )] summarizing b alance b efore and after this sub classification, for binary and con tin u ous co v ariates, resp ectiv ely . 5.3. T r e ating hospital typ e v ersus home hos pital typ e. If p atient s w ere al- w a ys treated in the same h ospital where they were diagnosed, estimating the causal effects of hospital t yp e w ould n ow b e easy b ecause of the assumed unconfounded assignment of diagnosing hospital type. Ho we ver, th ere are transfers b et wee n h ospital t yp es, typical ly from sm all to large—33 of the 75 diagnoised in a small hospital transferred to a large one for treatmen t, but sometimes fr om large to sm all—2 of 75 transferr ed this direction. The reasons for these transfers are considered quite complex. The decisions are made b y the individual p atien t, but clearly with input from do ctors, rela- tiv es, and friends , where the issues b eing discuss ed include sp eculatio n ab out F OR OBJECTIVE CA U SAL IN FERENCE, DESIGN TRUMPS A NAL YSIS 25 the probabilit y of success of the treatmen t at one versus the other, the pa- tien t’s willingness to tolerate inv asiv e op erations, the imp ortance of b eing close to relativ es and friends, and a h ost of other reasons. Consequen tly , there is no d oubt that giv en the observed co v ariates and the home h ospi- tal type, the assignment of treating hospital t yp e is confounded. Therefore, doing a d irect analysis of treating hospital t yp e, ev en if prop ensit y score metho ds w ere used to create sub classes of patien ts with ident ical distrib u- tions of all observed co v ariates in large and small treating hospitals, would b e considered u nsatisfactory b ecause key co v ariates w ere n ot a v ailable in the data set. W e can, ho wev er, still make progress b ased on the assumed unconfounded assignmen t of home hospital typ e b y using a differen t template for our ob- serv ational stu d y of treating hospital t yp e: a r andomized exp eriment w ith noncompliance. Th at is, think of p atien ts who transfer, or, more generally , who w ould ha v e transferred if assigned to a different hospital t yp e, as b eing noncompliers, and therefore, our template is that of a rand omized encour- agemen t d esign, w here the encouragemen t to b e treated in th e diagnosing large or small hospital is randomly assigned within prop ensit y score strata. The crucial id ea here is then to stratify also on the biv ariate “in termedi- ate outcome,” tr eating hospital when assigned to a large home hospital and treating hospital wh en assigned to a small home h ospital. Ev en though only one of these in termediate v ariables is actually observ ed, progress can still b e made. Notice that the design phase do es here lo ok at inte rmediate outcome Fig. 7. Car dia c anc er, differ enc e i n me ans for binary c ovariates and psc or e. 26 D. B. RUBIN Fig. 8. Car dia c anc er, t -statistics for c ontinuous c ovariates. T able 3 Car dia c anc er: observe d c ounts in observe d gr oups and appr oximate c ounts in princip al str ata under monotonicity assumption—sub class 1 (1) (2) (3) (4) (5) (6) “Assigned”/ randomized Underlying Approx imate prop ortion in p opulation in principal strata Approx imate N in LS principal stratum T r e ating hospital t yp e T principal home h ospital type strata: h = h # # ℓ s (1) ℓ 5 L 5 L L 4 4% L S 56% 3 (2) S 0 S S 0% (3) s 25 L 11 L L 4 4% S S 0% (4) S 14 L S 56% 14 data, treating hospital t yp e, but not the outcome d ata on surviv al, on whic h decisions will b e based. Surviv al data are not a v ailable at this stage! Denote the home hospital t yp e by h , w h ic h tak es the v alue ℓ w hen as- signed large h ospital t yp e and s when assigned sm all home h ospital t yp e. Similarly , let T denote treating hospital t yp e, wh ic h tak es the v alue L when the treating hospital is large, and tak es the v alue S when treating hospital is F OR OBJECTIVE CA U SAL IN FERENCE, DESIGN TRUMPS A NAL YSIS 27 small. The first three columns of T ables 3 – 7 s ummarize the observ ed v alues of h and T within eac h of the fi v e prop ensity score sub classes. C learly , in all sub classes, transfers in to large hosp itals are common, b ut only in sub class 5 are there an y ℓ → S transfers. But d o we estimate that there are compliers, who are treated in b oth large and small treating hospital t yp es, within eac h sub class? If not, we will n ot b e able to estimate the causal effect of treating hospital t yp e for the entire group of patien ts—a critical design issue with this template. T able 4 Car dia c anc er: observe d c ounts in observe d gr oups and appr oximate c ounts in princip al str ata under monotonicity assumption—sub class 2 (1) (2) (3) (4) (5) (6) “Assigned”/ randomized Underlying Approx imate prop ortion in p opulation in principal strata Approx imate N in LS principal stratum T r e ating hospital t yp e T principal home h ospital type strata: h = h # # ℓ s (1) ℓ 12 L 12 L L 7 1% L S 29% 3 (2) S 0 S S 0% (3) s 17 L 12 L L 7 1% S S 0% (4) S 5 L S 29% 5 T able 5 Car dia c anc er: observe d c ounts in observe d gr oups and appr oximate c ounts in princip al str ata under monotonicity assumption—sub class 3 (1) (2) (3) (4) (5) (6) “Assigned”/ randomized Underlying Approx imate prop ortion in p opulation in principal strata Approx imate N in LS principal stratum T r e ating hospital t yp e T principal home h ospital type strata: h = h # # ℓ s (1) ℓ 17 L 17 L L 3 8% L S 62% 11 (2) S 0 S S 0% (3) s 13 L 5 L L 3 8% S S 0% (4) S 8 L S 62% 8 28 D. B. RUBIN 5.4. Princip al str ata and the monoton icity assumption. F ormally in the R C M, there are t wo t yp es of outcomes: (1) the treating h ospital type, T , whic h equals T ( ℓ ) when h = ℓ and T ( s ) w h en h = s , and (2) the sur viv al time since diagnosis, Y , wh ic h equals Y ( ℓ ) wh en h = ℓ and Y ( s ) when h = s . The p ossible v alues of ( T ( ℓ ) , T ( s )) will b e denoted LL , LS , SL , or SS [where, for simplicit y , LL m eans the same as ( L, L ), etc.], and those v alues defin e four p ossible “principal strata.” LS can b e though t of as the stratum of compliers, that is, nontransfer patien ts; the LL and SS strata can b e though t of as noncompliers wh o will alw a ys b e treated at the same h ospital t yp e no T able 6 Car dia c anc er: observe d c ounts in observe d gr oups and appr oximate c ounts in princip al str ata under monotonicity assumption—sub class 4 (1) (2) (3) (4) (5) (6) “Assigned”/ randomized Underlying Approx imate prop ortion in p opulation in principal strata Approx imate N in LS principal stratum T r e ating hospital t yp e T principal home h ospital type strata: h = h # # ℓ s (1) ℓ 19 L 19 L L 5 5% L S 45% 9 (2) S 0 S S 0% (3) s 11 L 6 L L 5 5% S S 0% (4) S 5 L S 45% 5 T able 7 Car dia c anc er: observe d c ounts in observe d gr oups and appr oximate c ounts in princip al str ata under monotonicity assumption—sub class 5 (1) (2) (3) (4) (5) (6) “Assigned”/ randomized Underlying Approx imate prop ortion in p opulation in principal strata Approx imate N in LS principal stratum T r e ating hospital t yp e T principal home h ospital type strata: h = h # # ℓ s (1) ℓ 20 L 18 L L 6 7% L S 23% 5 (2) S 2 S S 10% (3) s 9 L 6 L L 6 7% S S 10% (4) S 3 L S 23% 2 F OR OBJECTIVE CA U SAL IN FERENCE, DESIGN TRUMPS A NAL YSIS 29 matter where assigned, and SL can b e thought of as defiers, wh o will transfer no m atter wh ere assigned. T he v alues of the principal strata are not affected b y assignmen t of home hospital type—which v alue [ T ( ℓ ) or T ( s ) ] is observed is affected by treatmen t assignment, b ut the biv ariate v alues are not, and therefore ( T ( ℓ ) , T ( s )) is, formerly , a partially observ ed cov ariate. No w, w e consider w h at is called the “monotonicit y” assump tion or th e “no-defier” assumption—that is, we assume th at the SL principal stratum is empty . In our setting, this assu mption is very plausible, and b ecause it excludes the SL principal stratum, we hav e only thr ee p rincipal strata: LL , LS and SS . Under this assumption, the p ossible pr incipal strata for eac h observe d com b ination of home hospital type and treating hospital type in eac h prop ensit y sub class are sho wn in the fourth col umns of T ables 3 – 7 . Th e observ ed ℓ → S group (the second ro w in T ables 3 – 7 ) must b e comp osed of SS patien ts b ecause they can b e n either LL nor SL patien ts, resp ectiv ely— b ecause they were assigned ℓ bu t treated in S and therefore are not LL patien ts, and th ere are no SL patien ts by the monotonicit y assump tion. Similarly , the observ ed s → L group (the third row of T ables 3 – 7 ) must b e LL patien ts b ecause they were assigned s but w ere treated in L . In con trast, the observe d ℓ → L sub group (the first ro w of T ables 3 – 7 ) could b e compliers, and so b e in LS , or noncompliers who are memb ers of the LL prin cipal stratum (who were assigned to h ome hospital t yp e L , and to w hic h they w ould h a ve transferred for their treating h ospital t yp e if they w ere assigned to a small home hospital t yp e). Hence, we split ro w 1 in to t w o sub-ro ws in the four th column of T ables 3 – 7 . S imilarly , th e ob s erved s → S subgroups (the fourth ro w of T ables 3 – 7 ) could b e compliers, and so b e in LS , or n oncompliers wh o are mem b ers of the SS principal stratum, and so is also split in to tw o sub -ro ws. W e can appro ximate the prop ortion of p atien ts in eac h principal stratum, as sh o wn in th e fifth col umns of T ables 3 – 7 . More explicitly , from the second ro w of T able 7 , columns (1) and (3), we see th at 2 / 20 are observe d to b e ℓ → S . Because of the assumed random assignment into ℓ and s within prop ensity score sub classes, we ha v e that appro ximately 10% of the patien ts b elong to the p rincipal stratum SS , as sho wn in the fifth column of T able 7 . Similarly , from the thir d row of T able 7 , columns (1) and (3), w e infer that appro ximately 6 / 9 ≈ 67% of patient s b elong to principal stratum LL in this sub class, as sh o wn in the fifth columns of T able 7 . Hence, we can approximat e the fraction of compliers, the LS principal stratum in this sub class, b y simple s ubtraction: 100% − 10% − 67% = 23%. The s ixth column in T able 7 indicates the app ro ximate num b er of LS p a- tien ts in eac h of the four ro ws of observ ed patien ts. Analogous calcula tions are su mmarized in T ables 3 – 6 for the other prop ensit y score sub classes. Ev en if we could p erfectly iden tify all the LS patien ts, wh ic h w e cannot, the sample sizes are sm all, and so in ference for the causal effect of treating 30 D. B. RUBIN hospital when it equals home hospital will b e imp recise. Nev ertheless, we outline the plann ed analysis in Section 5.6 b ecause these are the only data a v ailable to stud y this question. Imp ortan tly , w e an ticipate th at in eac h sub- class there are s ome compliers who are tr eated in large vo lume hospitals and some compliers wh o are treated in small volume hospitals. 5.5. ITT and CA CE = ITT LS and their estimation. The a v erage causal effect of home hospital type on surviv al is the comparison of the p oten tial surviv al outcomes of all N patien ts un der h i = ℓ and und er h i = s , ITT = 1 N N X i =1 [ Y i ( ℓ ) − Y i ( s )] , where ITT is th e In tenti on-T o-T reat (ITT) effect of the assignmen t of large v ersu s small h ome hospital t yp e. Under u n confounded assignmen t of h ome hospital typ e, we are able to estimate ITT by taking the a v erage observe d difference in Y for large v olume hospital patien ts and small volume hospital patien ts within eac h prop ensity sub class, w eight ing eac h sub class-sp ecific estimate b y the total num b er in that sub class and a v eraging the estimates. Because w e are not examining surviv al outcome data at this design stage, w e cannot calculate these estimates, but w e s aw this appr oac h in the breast can- cer example of Section 4 . In this problem using th e template of a randomized blo c k exp erimen t with noncompiliance, the estimation is more subtle. When G i = LS , the home h ospital t yp e equals the treating hospital t yp e, that is, h i = T i . Th e causal effect of home hospital t yp e in the LS pr incipal stratum is defin ed to b e CA C E ≡ ITT LS = 1 N LS X i ∈ LS ( Y i ( L ) − Y i ( S )) , where N LS is the num b er of LS patien ts, and CACE means “Compliance Av- erage Causal Effect” [ Im b ens and Rub in ( 1997 )]. ITT LS can b e interpreted as either the inten tion-to-trea t effect of home hospital t yp e f or complying pa- tien ts or the inten tion-to-trea t effect of treating hospital t yp e for complying patien ts, b ecause for the LS pr incipal stratum, h i = T i . Und er monotonicit y , the LS pr incipal stratum is the only stratum of p atien ts where we ca n learn ab out the causal effects of treating hospital t yp e b ecause the patien ts in the other principal strata, LL and SS , will alw a ys b e exp osed to the same treating hospital t yp e. CA C E is easily estimated once w e identify the individuals in the LS stra- tum, and we ha v e n ot ye t iden tified any particular mem b er of the ℓ → L or s → S ro ws (r ows one and four) in T ables 3 – 7 as b eing in the LS pr in - cipal stratum, and so w e cannot y et compare av erage outcomes in this stratum. Nev ertheless, w e can fi nd a unique metho d-of-momen ts estimate F OR OBJECTIVE CA U SAL IN FERENCE, DESIGN TRUMPS A NAL YSIS 31 of the causal effects of assigned (= treating) hospital t yp e within the LS principal stratum und er, what are considered, med ically v ery jus tifiable as- sumptions, wh ic h in general are called “exclusion restrictions.” Th e result- ing estimator of CA C E is kno wn as the “instrument al v ariable estimate” [ Angrist, Imb ens and Rubin ( 1996 )]. Better (e.g., Bay esian) metho ds of es- timation exist [e.g., see Im b ens and Rub in ( 1997 )]. 5.6. Exclusion r estrictions. There are tw o exclusions r estrictions. The first exclusion restriction is for patien ts in th e LL principal stratum. It states that, for all i ∈ LL , Y i ( ℓ ) = Y i ( s ), that is, there is no effect on p o- ten tial outcomes Y of b eing assigned to a large ( ℓ ) v ersus small ( s ) home hospital type for patien t i ∈ LL . T he medical justification for this restric- tion is that p atien t i w ould b e treated in a large hospital type ( L ) u nder either assignment, and one’s medical outcome is considered a result of where one is treated not where one is d iagnosed. The exclusion restriction for p a- tien ts in the SS principal stratum is analog ous; for all i ∈ SS , Y i ( ℓ ) = Y i ( s ), that is, for those p atient s who w ould b e treate d in a small hospital type ( S ) whether assigned to l or s , there is no effect of assignment on th e Y p oten tial outcome s. No w, ITT for all patien ts can b e written as ITT = π LS ITT LS + π SS ITT SS + π LL ITT LL , where π LS , π SS and π LL are the fractions of the sample, and ITT LS , ITT SS and ITT LL are the inte n tion-to-t reat effects in the LS , SS and LL strata, resp ectiv ely . Because th e exclusion restrictions force ITT SS and ITT LL to b e iden tically zero, this equation b ecomes ITT = π LS ITT LS , or ITT LS = I TT /π LS . Th us, the instrument al v ariables estimate of the ITT effect of treating hospital among compliers is found by dividin g the estimated ITT effect of home hospital type b y the estimated fraction of the sample in LS . The planned analysis will u se Ba yesi an versions of this estimator w ithin eac h prop ensit y score sub class, and then a verage ov er all sub classes. An initial Ba ye sian analysis that partially b enefits from the prop ensity score analysis presen ted here, bu t also inv olv es d ata on stomac h cancer patien ts, is presen ted in Rubin et al. ( 200 8 ). 32 D. B. RUBIN 6. Discussion. This article advocates the p osition that observ ational stud- ies for causal effects need to b e d esigned to approxi mate randomized ex- p eriment s. T his ent erprise requires careful thought and execution, and not simply r unning mindless regression programs and looking at co efficien ts. In most s ituations, this design effort will b e more intell ectually demand ing than a similar effort for an analogo us rand omized exp erimen t. Of critical imp or- tance, final outcome data cann ot b e used in design without compromising the ob jectivit y of the stu d y design. Prop ensit y s core metho ds are extremely helpful tools for reconstructing the un derlying hyp othetica l exp eriment that lead to the observed data. S ometimes, the hypothetical appro ximating ran- domized exp erimen t is one with complications, suc h as noncompliance, and then the principal stratification framework can b e extremely helpful. But most imp ortan t is f or the work er in observ ational studies to sta y fo cus ed on appro ximating a plausible h yp othetical u n derlying r andomized exp eriment. A fi nal commen t concerns the application of this p ersp ectiv e to actual randomized exp erimen ts, esp ecial ly those with co v ariates that h av e not b een u sed in the r andomization (e.g., n ot used to create blo c ks). In suc h cases, w e w ould exp ect random im b alances in some co v ariates, and if there is concern that these co v ariates ma y b e related to outcomes, the applica- tion of the tec hn iques d escrib ed here, with no acce ss to final outcome data, preserv es the ob jectivit y of the exp eriment , whereas mo del-based adju st- men ts, u n less fully sp ecified a priori, would compromise that ob jectivit y . This approac h has b een applied, for example, in a stud y of s chool v ouchers [ Barnard et al. ( 200 3 )] and in a study of v ertical disease transmission during deliv ery [ Zell et al. ( 2007 )]. Ac kn o wledgment s. Th anks to Cassandra W olos for the p rop ensit y score analyses of Section 5.2 , to Elizab eth Zell for very constru ctive commen ts on v arious drafts, to the editorial b oard for very helpful commen ts and a w onderfully rapid review, and finally to t wo outside review ers for generous and helpful comments. REFERENCES Ahmed, A., Husai n, A., Love, T. , Gambassi, G., Dell ’It alia, L., Francis, G., Gheorghiade, M., Allman, R., Meleth, S. and Bour ge, R. (2006). Heart fail ure, c hronic d iuretic use, and increase in mortality and hospitalization: An observ ational study using propensity score metho ds. Eur. He art J. 27 1431–1 439. Angrist, J., Imbens, G. and Rubin, D. (1996). Identification of causal effects using instrumental v ariables. J. Amer. Statist. Asso c. 91 444–4 72. Barnard, J., Frangakis, C., Hill, J. and Rubin, D. (2003). Principal stratification approac h to broken randomized experiments: A case study of school choice vouc hers in New Y ork city . J. Amer . Statist. Asso c. 98 299–323 . MR199571 2 Blalock, H. (1964). Causal I nfer enc e in Nonexp erimental R ese ar ch. U n iv. North Ca rolina Press, Chapel Hill. F OR OBJECTIVE CA U SAL IN FERENCE, DESIGN TRUMPS A NAL YSIS 33 Campbell, D. and St anley , J. (1963). Exp erimental and q uasi-exp erimen tal designs for researc h and teaching. In Handb o ok of R ese ar ch on T e aching (N. L. Gage, ed.). Rand McNally , Chicago. Cochran, W. (1965). The planning of observ ational studies of human p opulations. J. R oy. Statist. So c. A 128 234–2 65. Cochran, W. (1968). The effectiveness of adjustment by sub classification in removing bias in observ ational studies. Biometrics 2 295–313. MR022813 6 Cochran, W. (1983). Planning and A nalysis of Observational Studies . Wiley , New Y ork. MR072004 8 Cochran, W. and Co x , G. (1950 ). Exp erimental Designs . Wiley , New Y ork. Cook, T. and Campbell, D. (1979). Quasi-Exp erimentation: Design and Analysis for Field Settings . Rand McNally , Chicago. Co x, D. (19 58). The Planning of Exp eriments . Wiley , New Y ork. MR0095561 D’Agos tino, R. Jr. and D’Agostino, R. Sr. (2007). Estimating treatment effects using observ ational data. J. Amer. Me d. Asso c. 297 314–316. Dorn, H. (1953). Philosophy of inference from retrosp ective studies. Amer. J. Publ. He alth 43 677–68 3. Fisher, R. (1925). Stat istic al Metho ds for R ese ar ch Workers. Oliver and Bo y d, Edinburgh. Fisher, R. (1935). Design of Exp eriments . Oliver and Bo y d, Edin burgh. Frangakis, C. and Rubin, D. (2002). Principal stratification in causal inference. Bio- metrics 58 21–29 . MR189103 9 Haa velmo, T . (194 4). The probability approach in econometrics. Ec onometric a 15 413– 419. MR001095 3 Holland, P. (1986). Statistics and causal inference. J. A m er. Statist. Asso c. 81 945–960. MR086761 8 Holland, P. (1988 ). Causal inference, path analysis, and recursive structural equations models. So ciolo gic al Metho dolo gy 18 449–484. Holland, P. and Rubin, D. (1983). On Lord’s parado x . Principles of Mo dern Psycho- lo gic al Me asur ement: A F ests chrift for F r e derick L or d 3–25. Erlbaum, New Jersey . Imbens, G. and Rubin, D. (1997). Bay esian inference for causal eff ects in rand omized exp eriments with noncompliance. Ann. Statist. 25 305–327 . MR142992 7 Imbens, G. and Rubin, D. (2008a). Rub in causal mo del. The New Palgr ave Dictionary of Ec onomics (S. Durlauf and C. Blume, eds.), 2nd ed. Palg ra ve McMillan, New Y ork. Imbens, G. and Rubin, D. ( 2008b). Causal Infer enc e in Statistics, and in the So cial and Biome dic al Scienc es . Cambridge Un iv . Press, New Y ork. T o app ear. Jin, H. and Rubin, D. (2008 ). Principal stratificatio n for causal inference with extended partial compliance: Application to Efron–F eldman data. J. Amer. Statist . Asso c. 103 101–11 1. Kempthorne, O. (1952). The Design and Analysis of Exp eriments . Wiley , New Y ork. MR004536 8 Langensko ld, S. and Rubin, D. (2008). Outcome-free design of observ ational studies with application to in ves tigating peer effects on college freshman smoking behaviors. In L es Annales d’Ec onomie et de Statistique . T o app ear. Kenny, D. A. (1 979). Corr elation and Causation . Wiley , New Y ork. MR057675 0 Lilienfeld, A . and Lilienfeld, D. (1976). F oundations of Epi demi olo gy . Ox ford Univ. Press, New Y ork. Maddala, G. (1977). Ec onometrics . McGra w-Hill, New Y ork. Mor gan, S. L. and W inship, C. (2007). Counter factuals and Causal Infer enc e: Metho ds and Principles for So cial R ese ar ch. Cambri dge Univ. Press, Cam bridge. 34 D. B. RUBIN Neyman, J . (1923). On the application of p robabilit y theory to agricultural exp eriments: Essa y on principles, Section 9. T ranslated in Statist. Sci. 5 465–48 0. MR109298 6 Neyman, J . (1990). On the application of p robabilit y theory to agricultural exp eriments: Essa y on principles, Section 9. Ann. A gric. Sci . 1923. T ranslated in Statist. Sci. 5 465 – 472. MR109298 6 Reinisch, L., Sanders, S., Mor tensen, E . and Rubin, D. ( 1995). In utero ex p osure to phenobarbital and intel ligence deficits in adult men. J. Amer . Me d. Asso c. 274 1518– 1525. Ro senbaum, P. and R ubin, D. (1983). The centra l role of th e prop ensity score in obser- v ational studies for causal effects. Biometrika 70 41–55 . MR074297 4 Ro senbaum, P. and Rubin, D. (1985). Constructing a control group using multiv ariate matc hed sampling incorporating the prop ensity core. A m er. Statist. 39 33–38 . Ro thman, K. J. (19 86). Mo dern Epidemiolo gy . Little, Bro wn and Company , Bosto n. Ro y, A. (1951). Some though ts on the distribution of earnings. Oxfor d Ec onomic Pap ers 3 135– 146. Rubin, D. (1974). Estimating causal effects of treatments in randomized and n onrand om- ized studies. J. Educ. Psychol. 66 688– 701. Rubin, D. (1975). Bay esian inference for causalit y: The importance of randomization. In The Pr o c e e dings of the So cial Statistics Se ction of the Americ an Stat istic al Asso ciation 233–23 9. A merican Statistical Asso ciation, Alexandria, V A. Rubin, D. (1976a ). Inference and missing data. Biometrika 63 581–592 . With discussion and reply . MR0455196 Rubin, D. (1976b). Multiv ariate matching metho ds that are equal p ercent bias reduc- ing, I I: Maximums on b ias reduction for fi xed sample sizes. Bi om etrics 32 121–132. MR040055 6 Rubin, D. (1977). Assignmen t to treatmen t group on th e basis of a co v ariate. J. Educ. Statist. 2 1–26. Rubin, D. (1978). Ba yesia n inference for causal effects: The role of randomization. Ann. Statist. 6 34–58. MR047215 2 Rubin, D. (1979a). Discussion of “Conditional indep endence in statistical theory” by A.P . Daw id. J. R oy. Statist. So c. Ser. B 41 27–28. Rubin, D. (1979b). Using m u ltiv ariate matc h ed sampling and regression adjustmen t to con trol bias in observ ational studies. J. Amer. Statist . Asso c. 74 318–3 28. Rubin, D. (1980). Discussion of “Randomization analysis of exp erimental data in the Fisher randomizati on test” by Basu. J. Amer. Statist. Asso c. 75 591–593. Rubin, D. (1984). William G. Co chran’s contributions to the design, analysis, and eva l- uation of observ ational studies. In W. G. C o chr an ’s I m p act on Statistics (P . S. R. S. Rao and J. Sedransk , eds.) 37–69 . Wiley , New Y ork. MR075844 7 Rubin, D. (1990a). N eyman (1923) and causal inference in exp eriments and observ ational studies. Statist . Sci. 5 472–4 80. MR109298 7 Rubin, D. (1990b). F ormal mo des of statistical inference for causal effects. J. Statist. Plann. Infer enc e 25 279–29 2. Rubin, D. (1997). Estimating causal effects from large data sets using prop ensity scores. An n. Internal Me d. 127 757–763 . Rubin, D. (2002). U sing prop ensit y scores to help design observ ational studies: Applica- tion to the tobacco litigation. He alth Serv. and Outc omes R es. Metho dol. 2 169–1 88. Rubin, D. (2005). Causal inference using p otential outcomes: Design, modeling, decisions. 2004 Fisher lecture. J. Amer. Statist. Asso c. 100 322–33 1. MR216607 1 Rubin, D. (2006). Matche d Sampling for Causal Effe cts . Cambridge U niv. Press, N ew Y ork. MR230796 5 F OR OBJECTIVE CA U SAL IN FERENCE, DESIGN TRUMPS A NAL YSIS 35 Rubin, D. (2007). The design versus the analysis of observ ational studies for causal effects: P arallels with the design of randomized trials. Stat . Me d. 26 20–30. MR231269 7 Rubin, D. (2008). Statistical inference for causal effects, with emphasis on applications in epidemiology and med ical statistics. I I. In Handb o ok of Statisics: Epi demi olo gy and Me dic al Statistics (C. R. Rao, J. P . Miller and D. C. Rao, eds.). Elsevier, The Nether- lands. Rubin, D. and Thomas, N . (1992). Characterizing the effect of matching using linear prop ensit y score method s with normal co v ariates. Biometrika 79 797– 809. MR120947 9 Rubin, D. and Thomas, N. (2000). Com bining propensity score matc hing with additional adjustmen ts for prognostic cov ariates. J. Amer. Statist. Asso c. 95 573–58 5. Rubin, D., W ang, X., Yin, L. and Zell, E. (2008). Ba yesi an causal inference: Ap- proac hes to estimating the effect of treating hospital type on cancer surviv al in Sw eden using principal stratification. In Handb o ok of Applie d Bayesian Analysis (T. O ’H agan and M. W est, eds.). Oxford Univ . Press, Oxford. Rubin, D. and W a terman, R. (2006). Estimating causal effects of marketing in terventions using propensity score metho dology . Statist. Sci. 21 206– 222. MR232407 9 Shadish, W. R. , Cook, T . D. and C ampbell, D. T. (2002). Exp erimental and Quasi- Exp erimental Designs f or Gener alize d Causal Infer enc e. Houghton Mifflin Compan y , Boston. Zell, E., Kuw anda, M. Rubin, D. , Cutland , C., P a te l, R., Velaphi S. , Madhi, S. and Schrag, S . (2007). Condu cting and analyzing a single-blind clinical trial in a develo ping country: Prev entio n of p erinatal sepsis, so w eto, South Africa. In Pr o c e e dings of the International Statistic al Institute (CD-ROM). Dep ar tmen t of St a tistics Har v ard University Cambridge, Massachusett s 02138 USA E-mail: rubin@stat.harv ard.edu
Original Paper
Loading high-quality paper...
Comments & Academic Discussion
Loading comments...
Leave a Comment