The 2005 Neyman Lecture: Dynamic Indeterminism in Science
Jerzy Neyman's life history and some of his contributions to applied statistics are reviewed. In a 1960 article he wrote: ``Currently in the period of dynamic indeterminism in science, there is hardly a serious piece of research which, if treated rea…
Authors: ** David R. Brillinger **
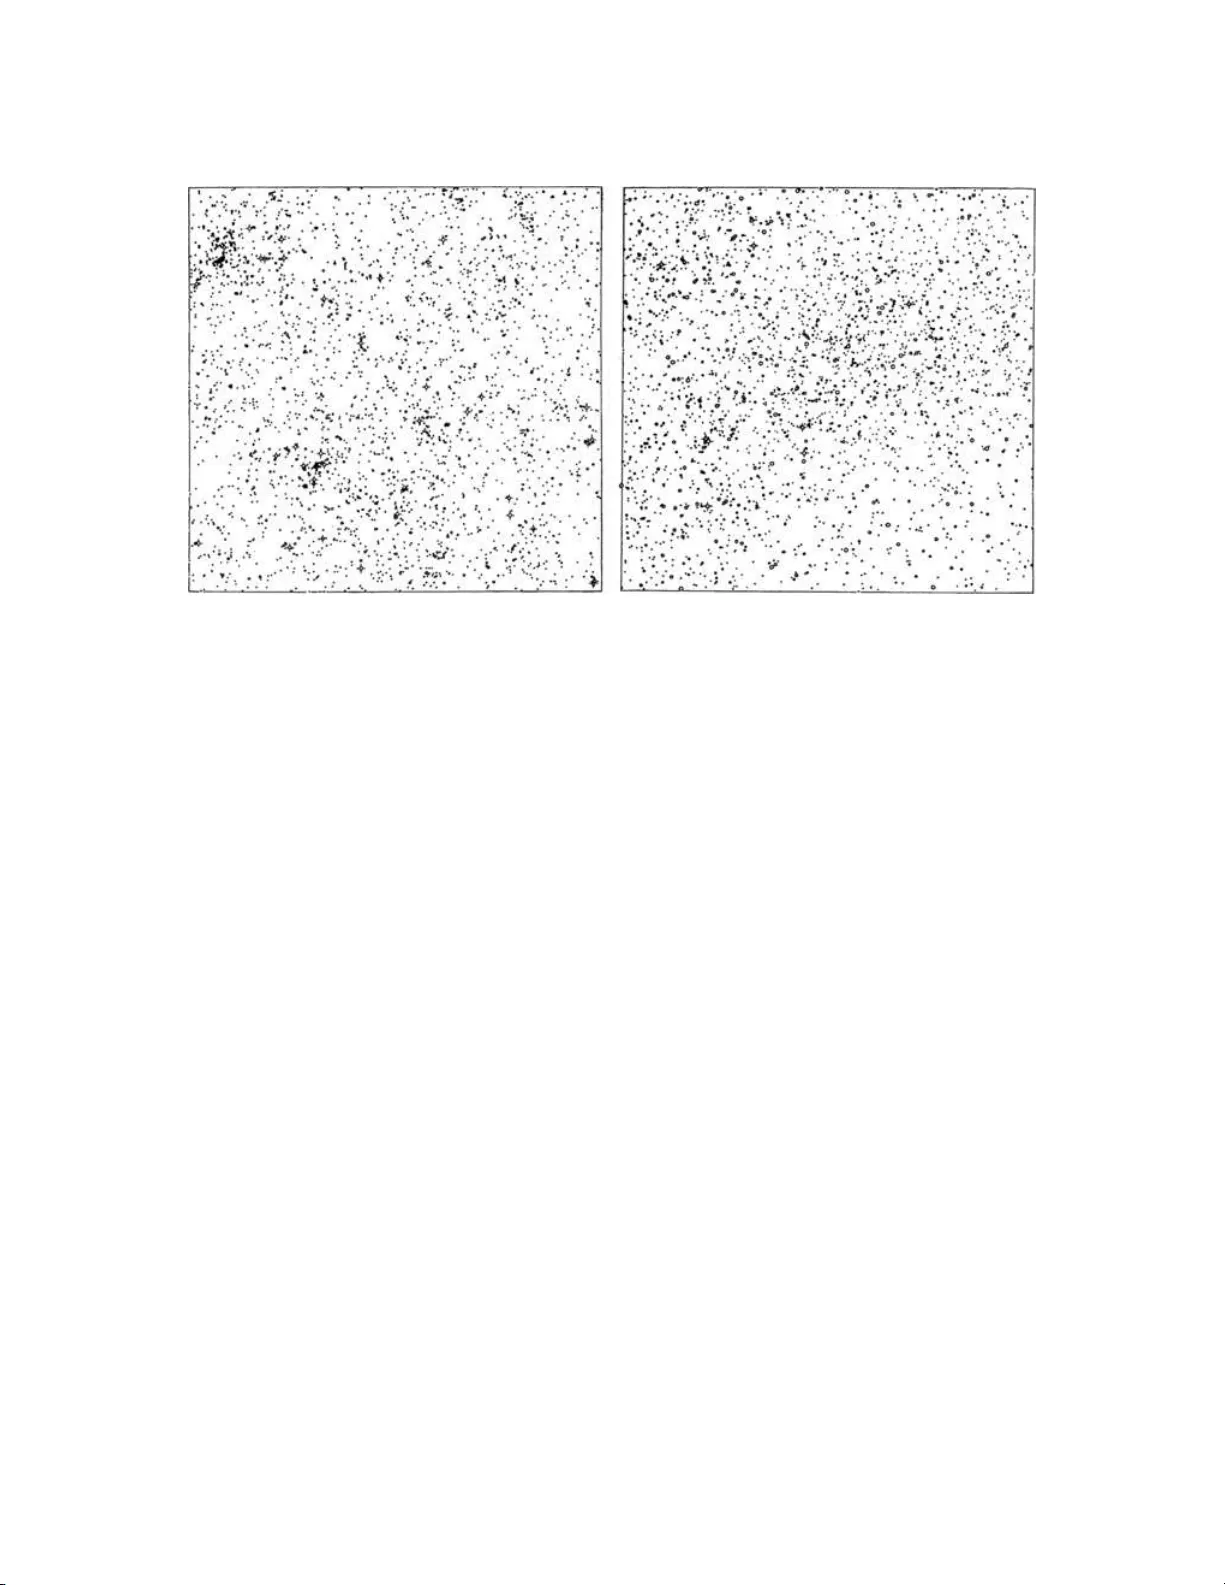
Statistic al Scienc e 2008, V ol. 23, No. 1, 48–6 4 DOI: 10.1214 /07-STS246 c Institute of Mathematical Statisti cs , 2008 The 2005 Neyman Lecture : Dynamic Indeterminism in Sci e nce 1 David R. Brillinger Abstr act. Jerzy Neyman’s life history and some of his con tributions to applied st atistics are review ed. In a 1960 article he wr ote: “ Curr ently in the p erio d of dynamic indeterminism in scienc e, ther e is har d ly a serious pie c e of r ese ar ch which, if tr e ate d r e alistic al ly, do es not involve op er ations on sto chastic pr o c esses. The time has arrive d for the the ory of sto chastic pr o c esses to b e c ome an item of usual e quipment of every applie d statistician. ” The emph asis in this article is on sto chastic pro- cesses and on sto c hastic pr o cess data analysis. A n umber of d ata sets and corresp onding substan tiv e questions are add ressed. T h e data sets concern sardine depletion, blo wfl y dynamics, w eather mo dification, elk mo v emen t and s eal journeying. Three of th e examples are from Ney- man’s w ork and four f rom the author’s j oin t w ork with collab orators. Key wor ds and phr ases: Animal motion, A TV motion, elk, Jerzy Ney- man, lifetable, monk seal, p opu lation dynamics, sardines, sto chastic differen tial equations, sheep blo wfl ies, simulation, synthetic data, time series, w eather mo dification. 1. INTRODUCTION This pap er is mean t to b e a tribute to Jerzy Ney- man’s substantiv e w ork with data sets. Th ere is an emphasis on scien tific questions, statistical mo d eling and inference f or stochastic pro cesses. The title of this work come s from Neyman ( 1960 ) where one fin ds, “The essence of d ynamic ind etermin ism in science consists in an effort to inv ent a hyp othetical c hance mec hanism , called a ‘stoc hastic mo del,’ operating on v ari- ous clearly defined hyp othetical entitie s, David Bril linger is Pr ofessor, Dep artment of S tatistics, University of California, Berkeley, Calif ornia 94720, USA ( e- mail: bril l@stat.b erkeley.e du ). 1 Discussed in 10.1214 /07-STS246B and 10.1214 /07-STS246A ; rejoinder at 10. 1214/07-STS246REJ . This is an electronic reprint of the orig inal article published by the Institute of Mathematical Statistics in Statistic al Scienc e , 20 08, V ol. 23, No. 1, 48–64 . This reprint differs from the or iginal in pagination and t yp ogr aphic detail. suc h that the resulting frequ en cies of v ari- ous p ossible outcomes corresp ond approx- imately to those actually ob s erv ed.” Here and elsewhere Neyman app eared to us e the adjectiv e “indeterministic” where others wo uld u se “stochastic, ” “statisti cal” or “nondeterministic”; see, for example, Neyman and Scott ( 1959 ). Perhaps Ney- man had some deep er or historical context in mind, but th at is not clear. In this pap er the emphasis is on the w ord “dynamic.” Jerzy Neyman (JN) led a full life. Reid ( 1998 ) con- tains many details and anecdotes, a lot of them in Neyman’s o wn w ords. Other sources includ e th e pa- p ers: Neyman ( 1970 ), Le Cam and Lehmann ( 1974 ), Kendall, Bartle tt and P age ( 1982 ), Scott ( 1985 ), Lehmann ( 199 4 ) and Le C am ( 1995 ). The article has six sections: 1. Intro d uction, 2. Jerzy Neyman, 3. Some f orm al metho ds, 4. T h ree exam- ples of JN’s applied statistics wo rk, 5. F our exam- ples of random pro cess data analysis, 6. Conclusion. The fo cus is on applied work in the environmen tal sciences and p henomena. This last is a w ord th at Neyman often emp lo yed. 1 2 D. BRILLIN GER In p articular the examples sho w ho w ran d om pro- cess mod eling can pro ve b oth h elpful and not all that difficult to implement . The thought driving this pa- p er is that by examining a num b er of examples, uni- fying metho ds and principles ma y b ecome apparen t. One connecting thr ead is “synt hetic” d ata, in the language of Neyman, Scott and Shane ( 1953 ) and Neyman and Scott ( 1956 ). Syn thetic data, based on sim ulations, are an exp loratory to ol for mo d el v al- idation that has the adv anta ge of s u ggesting ho w to create another mo del if the resemblance of the sim ulation to the actual data is not go o d . There are quotes throughout to create a fla vor of JN’s statistic al approac h es. 2. JERZY NEYMAN “His dev otion to Poland and its culture and traditions w as v ery marked, and when his influence on statistics and statisticians had b ecome w orldwide it was fashionable ... to say th at ‘w e h av e all learned to sp eak statistics w ith a P olish accen t’ . . . ” (Kendall, Bartlett and Page, 1982 ). The life of Neyman is w ell d o cumente d b y JN and others; see, for example, Reid ( 1998 ), LeCam and Lehmann ( 1974 ) and Scott ( 1985 ). O th er sources are cited later. Neyman w as of P olish ancestry and as the ab o v e quote make s clea r he was v ery Polish! T able 1 r ecords some of the basic even ts of his life. One s ees a flo w from P oland to London to Berke - ley with many sidetrip s intermingled throughout his life. These detai ls are from Scott ( 1985 ) and Reid ( 1998 ). Neyman’s education inv olv ed a lot of formal math- ematics (int egration, analysis, . . . ) and probabilit y . He often men tioned the b o ok, The Gr ammar of Sci- enc e (Pea rson, 1900 ) as h a ving b een very imp or- tan t for his scien tifi c and statistica l work. He de- scrib ed Leb esgue’s L e¸ cons sur l ’ int ´ egr ation as “the most b eautiful monograph th at I ev er read.” The Author’s Note to th e Early Statistic al Pap ers (Neyman, 1967 ) comments on the famous and in flu- en tial teac hers h e had at Kharko v. They includ ed S. Bernstein (“m y teac h er in p robabilit y”), C. K. Russya n, and A. Przeb ors k i. Others h e men tions as influentia l include E. Borel, R. vo n Mises, A. N. Kol- mogoro v, E. S. Pearson and R. A. Fisher. Neyman came to Berk eley in 1938. That app oin t- men t had b een preceded by a triumph an t U.S. tour in 193 7. The b o ok Neyman ( 1938b ) resulted from the tour. After Neyman’s arriv al, in ternationally reno wned probabilists and statisticia ns b egan to visit Berk eley regularly and contributed m uc h to its re- searc h atmosphere and work ethic. In Neyman’s time the lunc h ro om us ed to play an imp ortant role in the Berk eley Departmen t. JN, Bett y Scott (ELS ) and Lucien Le Cam enthralled student s, colle agues, visitors and th e like with their con v ersation. They in v olv ed ev ery one in th e stories and discussions. Neyman h ad a seminar W edn esda y afterno ons. It b egan with coffee and cak es. Then there wa s a talk, often by a substan tiv e scien tist, but theoretical talks did o ccur from time to time. The talk’s discussion w as follo wed by d rinks at the F acult y Club includ ing the famous Neyman toast s. “T o the sp eake r. T o the in ternational intellec tual comm unity . T o the la dies present and s ome ladies absent .” Up unt il p erhap s the m id-1970s there w as a d inner to end the even t. Neyman’s w ork ethic w as v ery strong. It t ypically included Saturda ys in the Departmen t, and for those who came to work also there were cak es at 3 p m. 3. SOME FORMAL METHODS “Ev ery attempt at a mathematical treat- men t of phenomena m ust b egin b y build- ing a simp lified m athematical mo d el of the phenomena.” (Neyman, 1947 ). This section pr o vides a few of the tec hnical ideas and metho d s that are basic to the examples pr e- T able 1 A timeline of Jerzy Neyman ’ s life Date Ev ent 1894 Born, Bendery , Monrovia 1916 Candidate in Mathematics, Universit y of Kharko v 1917–19 21 Lecturer, In stitute of T echnology , Khark ov 1921–19 23 Statistician, A gricultural Research Institu te, Bydgoszcz, Poland 1923 Ph.D. in Mathematics, Universit y of W arsa w 1923–19 34 Lecturer, U niversi ty of W arsaw Head, Biometric Laboratory , Nenc ki In stitute 1934–19 38 Lecturer, then R eader, Universit y College, London 1938–19 61 Professor , Universit y of Cali fornia, Berkeley 1955 Berke ley S tatistics D epartment formed 1961–19 81 Professor Emeritus, Univers ity of California, Berke ley 1981 Died, Oakland, Cali fornia DYNAMIC INDETERMINIS M IN SCIENCE 3 sen ted. The examples inv olv e dynamics, time, sp a- tial mo v emen t, Mark ov pro cesses, state-space mo d- els, s to c h astic differen tial equations (SDEs) and phe- nomena. 3.1 Random Pr o cess Metho ds “. . . , mo dern science and tec hnology pro- vide statistical problems with observ able random v ariables taking their v alues in functional spaces.” (Neyman, 1966 ). By a random pro cess is mea nt a random function. Their imp ortance w as already referred to in S ection 1. In particular Neyman was concerned with “phe- nomena dev eloping in time and space” (Neyman, 1960 ). The ran d om pro cesses describing these are the b ac kb one of m uc h of mo dern science. 3.2 Ma rk ov Pro cesses Neyman w as tak en with Mark o v pro cesses. Reid ( 1998 ) quotes him as saying, “So what Mark o v did—h e considered c han - ges from one p osition to a nother p osition. A simple example. Y ou consider a particle. It’s m a yb e h uman. And it can b e in an y n umb er of states. An d this set of states ma y b e finite, may b e infin ite. No w wh en it’s Marko v—Mark o v is wh en the proba- bilit y of going—let’s say—betw een to da y and tomorro w, wh ateve r, d ep end s only on where y ou are to day . That’s Mark o vian. If it dep ends on s omething that happ en ed y esterda y , or b efore yesterda y , that is a generalizat ion of Mark o vian.” Time and Mark o vs p la y k ey roles in Fix and Ney- man ( 1951 ). An adv an tage of w orking with a Mark o v pro cess is th at when there is a parameter one can set do wn a likel iho o d fu nction d irectly . 3.3 Sto chastic Differential Equations (SDEs) “It seems to m e that the pr op er w a y of ap- proac hing ec onomic p roblems mathemati- cally is b y equations of the ab o v e t yp e, in finite or infinitesimal differences, with co- efficien ts that are not constan ts, but ran- dom v ariables; or what is called random or stochastic equ ations. . . . The theory of random differen tial and other equ ations, and the theory of random curve s, are just starting.” (Neyman, 1938a ). T o giv e an example, let r ( t ) refer to the lo cation of a particle at time t in R p space. Th e path that it maps out as t in cr eases is called the tra jectory . (T ra- jectory is an old wo rd used for a stochastic pro cess.) Its v ector-v alued v elo cit y will b e denoted µ ( t ) = d r ( t ) /dt. Rewriting this equation in terms of incremen ts and adding a r andom disturbance leads to a so-called sto c hastic differentia l equation d r ( t ) = µ ( r ( t ) , t ) dt + σ ( r ( t ) , t ) d B ( t ) (1) or in integ rated form, r ( t ) = r (0) + Z t 0 µ ( r ( s ) , s ) ds + Z t 0 σ ( r , s ) d B ( s ) . (2) If, for example, the pro cess B is Bro w n ian, that is, the incremen ts B ( t i +1 ) − B ( t i ) are I N ( O , ( t i +1 − t i ) I ), then, und er co nditions on µ and σ , a solution of the equation exists and is a Mark o v pro cess. The function µ is called th e drift rate and σ the diffu sion co efficien t. A particular case of an SDE is the Ornstein–Uhlen- b ec k pro cess giv en by d r ( t ) = α ( a − r ( t )) dt + σ d B ( t ) with α > 0 and σ a scalar. T his mo d els a particle b eing attracted to the p oin t a with the motion dis- turb ed randomly . An app ro ximate s olution to ( 1 ) is giv en, recur- siv ely , by r ( t i +1 ) − r ( t i ) ≈ µ ( r ( t i ) , t i )( t i +1 − t i ) (3) + σ ( r ( t i ) , t i ) Z i p t i +1 − t i with the t i an increasing sequence of time p oints fill- ing in the time domain of th e problem; see K lo eden and Platen ( 1995 ). The Z i are indep en den t p -v ariate standard normals. This solution pro cedure to ( 1 ) is kno wn as the Euler metho d. In fact I tˆ o ( 1951 ) u sed an exp ression lik e ( 3 ) to demonstrate that, under conditions, ( 1 ) h ad a unique solution. There has b een a substantia l amount of work on statistica l inference for SDEs; references includ e Heyde ( 1994 ) and Sørensen ( 1997 ). There are parametric and n onparametric fi tting metho d s. In feren tial w ork ma y b e motiv ated by setting d o wn th e ab o ve ap- pro ximation and taking the t i to b e the times of observ ation of th e pro cess. 4 D. BRILLIN GER Assuming that µ ( r , t ) = µ ( r ) , that σ ( r ( t ) , t ) = σ I , σ scalar, and that r is p v ector-v alued, one can con- sider as an estimate of σ 2 ˆ σ 2 = 1 pI X i k r ( t i +1 ) − r ( t i ) − ˆ µ ( r ( t i )) (4) · ( t i +1 − t i ) k 2 / ( t i +1 − t i ) , i = 1 , . . . , I , h a ving determined an estimate of µ . If th e region of motion, sa y D , is b ounded with b ound ary ∂ D , one can pro ceed via the SDE d r ( t ) = µ ( r ( t ) , t ) dt + σ ( r ( t ) , t ) d B ( t ) + d A ( t ) with th e sup p ort of A on the b oundary ∂ D . This construction pushes the p article in to D . 3.4 A P otential Function App roach The c hoice of th e function µ in ( 1 ) ma y b e mo- tiv ated b y Newtonian dynamics. Supp ose there is a scalar-v alued potentia l function, H ( r ( t ) , t ); s ee T a y- lor ( 2005 ). Su c h a function H can con trol a particle’s direction and v elocity . In a particular physical situation the Newtonian equations of motion ma y take the form d r ( t ) = v ( t ) dt, d v ( t ) = − β v ( t ) dt − β ∇ H ( r ( t ) , t ) dt, (5) with r ( t ) the particle’s lo cation at time t, v ( t ) the particle’s velocit y and − β ∇ H the external force field acting on the particle. Th e p arameter β represents the co efficien t of friction. Here ∇ = ( ∂ /∂ x, ∂ /∂ y ) τ is the gradient op erator. F or example, Nelso n ( 1967 ) mak es use of the form ( 5 ). In the case that the relaxat ion time, β − 1 , is small (or in other wo rds , the friction is h igh), ( 5 ) is ap- pro ximately d r ( t ) = −∇ H ( r ( t ) , t ) dt = µ ( r , t ) d t. W riting the v elo cit y v ( t ) = µ ( r , t ) one is led to a sto c hastic gradien t system d r ( t ) = −∇ H ( r ( t ) , t ) dt + σ d B ( t ) . The function H might b e a linear com bination of elemen tary kn o wn functions, a com bination of thin plate splines placed around a regular grid or based on a k ernel function. Example 7 b elo w will indicate the metho d . The metho d is fur th er elab orated in Brillinger ( 2007a , 2007 b ). 4. THREE EXAMPLES OF JN’S APPL IED ST A TISTICS W ORK “. . . th e deligh t I exp erience in trying to fathom the c hance mec h anisms of ph enom- ena in the empirical world.” (Neyman, 1970 ). Neyman was b oth an exceptional mathematical statisticia n and an exceptional app lied statisticia n. The app lied work commenced righ t at th e b eginning of h is career and cont inued until the v ery end. This section presents examples from astronom y , fisheries and w eather mo difi cation. These examples w ere c ho- sen as they are in teresting and they blend in to the later examples in the p ap er. Neyman’s work w as special in applied s tatistics in that he set do wn sp ecific “p ostulates” or assump - tions. T o ols of his applied w ork included sampling, b est asymp otically n ormal (BAN) estimators, C( α ) tests, chi-squared, r an d omization and synthet ic data. His w ork was furth er charac terized b y the v ery care- ful p reparation of the data by his Statistical Lab o- ratory w ork ers. JN’s applied pap ers t ypically includ e sub stan tial in tro du ctions to the scien tific field of concern. T opics include farfield effec ts of cloud seeding, estimation of the disp ers ion of the r edshift of galaxies, higher- order clustering of galaxies, and sard ine depletion. Giv en Neyman’s concern with the scien tific metho d, one can w ond er ho w he v alidated or app raised h is mo dels. On reading his pap ers, hyp othesis testing seems to in clude assessment. There w ere lots of data, and fit comp onents (observ ed –exp ected) and chi- squared (residuals). Th ere was smo oth c h i-squared to get alternativ e h yp otheses. Th ere was often the remark, “app ears reasonable.” 4.1 Example 1. A S TRONOMY “By far the str on gest and most sustained effort exp ended for u s in studying natu- ral phenomena through appropriately se- lected asp ects of th e pro cess of cluster- ing referred to astronom y , sp ecifically to galaxies. . . . , the stim u lus came f rom the substanti ve scien tists, that is from astronomers.” (Neyman and Scott, 1972 ). The work of Neyman, and his collaborators in this case, is a mo del for applied statistics. The question is made clear. Substantiv e science is inv olve d. Statis- tical theory is emp lo y ed a nd dev elop ed as necessary . Empirical analyses are carried out. DYNAMIC INDETERMINIS M IN SCIENCE 5 Fig. 1. L eft-hand p anel is an image of an actual photo gr aphic plate. T he right-hand p anel is a synthetic plate. Se e Sc ott, Shane and Wirtanen ( 1954 ). In a series of pap ers Neyman, Scott, S hane and Sw anson add ressed the issu e of galaxy clustering. They applied mathematical mo dels to the Lic k galaxy coun ts of Sh ane and Wirtanen. T hey were the first to compare the observed g alaxy distribution to syn- thetic image s of th e Univ erse. They assumed that clusters o ccur around cen ters distributed as a spatial P oisson p ro cess. Eac h cen ter w as assigned a random n umb er of ga laxies and the latte r placed indep en- den tly at random distances from the cente r. This mo del, the so-called Neyman–Scott mo del, seemed to fit reasonably . Ho w ev er, wh en Neyman and Scott pro du ced a s imulated realizati on, or syn thetic p late, of the sky from their mo del they we re surp rised. The actual p ictures of the sky were a lot more lumpy than those their simulatio n had pr o duced. “When the calculate d scheme of d istr ibu- tion was compared w ith the actual distri- bution of galaxies . . . , it b ecame app ar- en t that the simple mec hanism p ostulated could not p ro duce a distribu tion resem- bling the one w e see” (Ne yman and Scott, 1956 ). More clustering w as needed in the mo del. Neyman and S cott pro ceeded to int ro d uce it. With a tw o- stage clus tering pro cess th e simulate d app earance of the s k y lo oke d muc h more realistic. Figure 1, tak en from Scott, Shane and Wirtanen ( 1954 ), presents an example. In summary , “. . . it was sh o wn that the visual app ear- ance of a ‘synthetic ’ p hotographic plate, obtained by m eans of a large-scale sam- pling exp erimen t, conforming exactly with the assump tions of the theory , is v ery sim- ilar to that of an actual plate” (Neyman, Scott and S hane 1954 ). 4.2 Example 2. S ARDINE DEPLETION “Biometry is an inte rd isciplin ary domain aimed at the u n derstanding of biological phenomena in terms of c hance mec hanisms.” (Neyman, 1976 ). In 1947– 1948 Ne yman w as called up on by the Cal- ifornia Coun cil of the Congress of Industrial Orga- nizations to stu d y the decrease in sardine catc hes. The d ecrease was of great concern and strongly af- fected the canneries and commerce of the w ork ers along th e w est coast of th e Un ited S tates. In particular JN was consulted regarding th e nat- ural a nd fish ing mortalit y of the sardines. A sp ecific purp ose of his work wa s “. . . to study the metho ds of estima ting the death r ates of the sardines.” JN wrote three rep orts on sard ine fishery . T hey are col- lected in Neyman ( 1948 ) and titled, 1. Evaluations and Observations of Material and Data Available on the Sar dine Fishery , 2. Natur al and Fishing Mortal- ity of the Sar dines, and 3. Contribution to the Pr ob- lem of Estimating Populations of Fish with Partic- ular R efer enc e to Fish Caught in Scho ols , Such as 6 D. BRILLIN GER Sar dines . A revision of the third rep ort app eared as Neyman ( 1949 ). A t th e outset of Neyman ( 1949 ), he pro vides T a- ble 2 . F rom it he infer s a “rapid decline . . . observ ed in spite of a rep orted increase in fishing effort. . . ” A second table, T able 3 , giv es the amount (in arbi- trary u nits) of sardines landed on the W est Coast in the seasons 1941–194 6, classified by age and sea- son. Figure 2 graphs the amoun ts with lines joining the v alues for the s ame sardine age. One sees the high num b ers in the early 19 40s follo we d by decline. The in terpretation is tric ky b ecause the n u m b ers re- flect b oth th e fish a v ailable and the effort pu t in to catc hing them. Neyman ( 1948 ) discuss ed the effect of migration and co ncluded th at it w as unimp ortan t for his cu r rent purp oses. T urn ing to analysis Neyman remarks, “Certain publications d ealing with the su r- viv al rates of the sard ines b egin with the assumption th at b oth the natural death rate and th e fish ing mortalit y are ind ep en- den t of the age of the sardines, at least b e- ginning with a certain initial age.” (Ney- man, 1948 ). and goes on to sa y , “In the present note a method is suggested whereby it is p ossible to a (sic) test the T able 2 Se asonal c atch of California sar dines 1943–1948 in 1000 tons Y e ar Seasonal catch 1943–19 44 579 1944–19 45 614 1945–19 46 440 1946–19 47 248 1947–19 48 110 T able 3 Numb ers, m t,a , of sar dines c aught by age and ye ar Season 41–2 42–3 43–4 44–5 45–6 age = 1 926 . 0 718 . 0 1030 . 0 951 . 0 493 . 0 2 6206 . 0 2512 . 0 1308 . 0 2481 . 0 1634 . 0 3 3207 . 0 4496 . 0 2245 . 0 1457 . 0 1529 . 0 4 868 . 0 1792 . 0 2688 . 0 1298 . 0 799 . 0 5 361 . 0 478 . 0 929 . 0 1368 . 0 407 . 0 6 95 . 1 169 . 4 327 . 0 498 . 5 299 . 2 7 47 . 2 36 . 0 98 . 4 148 . 0 111 . 2 h yp othesis that the natural death r ate is indep en d en t of the age of th e sardines” (Neyman, 1949 ). T o add ress the in d ep end en ce issu e, and p ossibly motiv ated by T able 3 , Neyman sets up a formal structure as follo ws. Let N t,a b e “the num b er of fish a v ailable aged a at th e b eginnin g of season t and ex- p osed to the risk of b eing caugh t.” Here these num- b ers are collected in to a v ector, N ( t ) = [ N t,a ]. Next n t,a is set to b e the exp ected num b er of sardines aged a caugh t du ring season t , and P t = 1 − Q t set to b e the “fi s hing su rviv al rate in the t th y ear.” Con tin- uing, p a = 1 − q a denotes the “natural s u rviv al rate at age a ” and q a the “rate of disapp earance.” The rate of mass emigration during season t is denoted b y M t . The follo win g null h yp othesis m ay b e set d own concerning the m ortalit y rates, H 0 : q a 0 = q a 0 +1 = · · · = q a , a > a 0 . Sp ecific assumptions Neyman considered w ere: (i) Q t = n t,a / N t,a , season t fishing mortalit y , (ii) N t +1 ,a +1 = N t,a (1 − Q t )(1 − q a ), (iii) N t +1 ,a +1 = N t,a (1 − Q t )(1 − M t )(1 − q a ). Assumptions (ii) and (iii) in v olv e sep aration of the age and season v ariables. F or ident ifiabilit y of the mo del Neyman writes n t +1 ,a +1 = n t,a R t p a = n t,a r t p ∗ a with R t = P t (1 − M t ) Q t Q t +1 , r t = R t /R 1 , p ∗ a = R 1 p a . Fig. 2. The data of T able 3 plotte d versus ye ar. The curve lab els 1–7 index the age gr oups. DYNAMIC INDETERMINIS M IN SCIENCE 7 Fig. 3. Estimates of the natur al survival r ate, p ∗ as a func- tion of age. One notes from these expressions that n t +1 ,a +1 /n t,a separates into a function of t and a fun ction of a . This last led Neyman to work with logs of ratios in his analyses. (There w ill b e more on this choice later.) He estimates p ∗ a = R 1 p a , wh ic h is prop ortional to p a under his definitions, from th e data. The p ∗ a estimates are pro vided in T able 4 and graphed in Figure 3 . One sees a steady decrease w ith age. T able 5 pro vides ˆ n t,a based on assump tions (i) and (ii) [or (i) and (iii)]. Neyman’s conclusions in cluded, “While in certain instances the differences b et wee n T ables IV (here T able 3 ) and VI I (here T able 5 ) are consid erable, it will b e recognized that the general charac ter of v ariation in the figu r es of b oth tables is essen tially similar” (Neyman, 1948 , pages 14–15 ). No formal test of H 0 w as set do wn , but Neyman concludes that, “Since the estimates of the p ∗ a decrease rather regularly , it seems that the true natural surviv al rates must decrease with the increase in age. . . ” (Neyman, 1948 ). T able 4 Par ameter estimates (these ar e the values obtaine d in c alculations f or this article) Season 41–2 42–3 43–4 44–5 p ∗ a 0.5944 0.4854 0.4629 0.4056 r t 1.0 1.2252 1.0695 0.6259 Basic elemen ts of this example includ e working with emp irical d ata, noting the age and s eason struc- ture exp licitly , and w orking with a Mark o v-lik e s etup. In terestingly Neyman talks of an exp ected v alue, b ut no full p robabilit y mo del is set do wn. In part this example is mean t to get the reader in the m o o d for an age-structured p opu lation analysis to app ear later in the pap er. The final example tak en fr om Neyman’s w ork fol- lo w s . 4.3 Example 3. WEA T HER MODIFICA TION “The m eteorolog ical asp ects of p lanning an exp erimen t with cloud seeding dep end up on the past exp erience, up on what the exp erimente r is prepared to adopt as a w orking hypothesis and up on the qu es- tions that one w ish es to ha v e answ ered b y the exp erimen t” (Ne yman and Scott, 1965– 1966 ). Cloud seeding b ecame an in terest of Jerzy Ney- man starting in the early 1950s. He and his co llab o- rators stud ied data fr om the Santa Barbara and Ari- zona r ainf all exp erimen ts. Neyman and Scott mo v ed on to study data from a Swiss w eather mo dification exp eriment that had b een designed to see if cloud seeding could r educe hailfall. T he exp erimen t was carried out in the Canto n of Ticino d uring the p e- rio d 1957 –1963 and w as called Grossversuc h I I I. The exp eriment al design in v olv ed eac h day d ecid- ing whether conditions were suitable to defi n e an “exp eriment al da y .” If a d a y was suitable seeding w as or w as not carried out the follo wing da y , r an- domly . Seeding, if any , lasted from 0730 to 2130 hours local time. Rainfall m easuremen ts that had b een made in Zur ic h, ab out 120 km a wa y from Ti- cino, w ere studied. In the course of their wo rk Neyman and Scott d is- co vered so-called “far-a w a y effects,” that is, an ap- paren t increase in amoun t of rainfall at a distance. See Neyman, S cott and W ells ( 196 9 ). T able 5 Estimates of the n t,a , the exp e cte d numb ers of sar dines Season 1 2 3 4 5 age, 3 2810 . 0 3556 . 3 2117 . 9 1761 . 6 — 4 1059 . 3 1684 . 3 2611 . 7 1355 . 7 661 . 0 5 383 . 7 514 . 2 1001 . 7 1355 . 7 412 . 5 6 91 . 9 77 . 6 29 1 . 6 495 . 9 391 . 7 7 — 37 . 3 88 . 2 12 6 . 5 125 . 9 8 D. BRILLIN GER Fig. 4. Com p arison of se e de d and not se e de d hourly pr e- cipitation amounts on days with souther ly upp er wi nds. The solid line is r ainfal l for se e de d days and the dashe d line for unse e de d. The horizontal li ne with arr owhe ads r epr esents the se e di ng p erio d at Ticino. A thr e e-hour moving aver age had b e en employe d to smo oth hourly totals. Figure 4 pr o vides a reco nstru ction of a graph that Neyman and Scott ( 1974 ) emp lo yed to highligh t the result. It presents a v erage hourly rainfall totals smo othed b y a r u nning mean of 3, for th e exp erimen tal da ys when a “w arm” stabilit y la y er and south er ly winds w ere present. T o obtain the d ata of Figur e 4 the v alues w ere read off a graph in Neyman and Scott ( 1974 ). The solid curve refers to exp eriment al days with seeding, the dashed to those without. There w ere 53 exp eri- men tal da ys with seeding and 38 without. What Neyman and Scott fo cused on in the figure w as an app aren t effect of seeding in Zuric h starting ab out 1400 hours in the afterno on. They wrote as follo ws, “. . . th e curves. . . represent a v erages of a n umb er of ind ep endent r ealizat ions of cer- tain stochastic pro cesses. The ‘seeded’ cu r- v es are a sample from a p opulation of one kind of pro cesses and th e ‘not seeded’ curv e a samp le fr om another. F or an initial p e- rio d of a num b er of hours. . . the t wo kinds of pro cesses coincide. Th er eafter, at some unknown time T, th e t w o p ro cesses ma y b ecome differen t. Presumab ly , all the ex- p erimental da ys d iffer from eac h other, p ossibly dep en ding on the direction and v elo cit y of p rev ailing winds. Ther efore, the time T m ust b e considered as a random v ariable with some unkno wn distribution. The the or etic al pr oblem is to de duc e the c onfidenc e interval for the e xp e ctation of T , . . . ” (Neyman and S cott, 1974 ). This problem will b e retur ned to later in the pap er. 4.4 Neyman and Explorato ry Data Analysis (ED A) Giv en my statistical bac kground it would b e r e- miss not to pro vide some d iscussion of EDA in Ney- man’s work. Quotes are one wa y to brin g out p erti- nen t asp ects of Neyman’s att itude to ED A. O ne can conclude that exploratory data analysis w as one of his talen ts. “. . . w hile h u n ting for a big problem I cer- tainly established the habit, . . . , to n e- glect rigour” (Neyman, 1967 ). “P A GE aske d whether the elimination of outliers–supp osed pro jected foreground or bac kground ob jects recognized by discor- dan t v elo cities–w ould not in itself intro- duce u n wa nted selection effects. NEYMAN advised that the inv estigator try calcula- tions with and without outliers, then mak e up his mind ‘wh ic h he lik es b est’, w hile re- taining b oth.” “Compared w ith the old st yle exp eriments, c h aracterized by the attitude ‘to prov e,’ the prop osed exp eriment w ould b e sub - stan tially richer. . . . Th is, then, will imple- men t the attitude ‘to explore’ cont rasted with that ‘to pro v e’ ” (Neyman and Scott, 1965– 1966 ). “W e e mph asize that suc h an inv estigation is only exploratory; whatev er may b e found are only clues which must b e studied fur- ther and hop efully v erified in other ex- p eriments” (Da wkin s , Neyman and Scott, 1977 ). JN did not seem to u s e r esid uals m u c h. Ho w ev er, in Neyman ( 1980 ) one do es find, “. . . one can observ e a s ubstant ial num- b er of consecutiv e differences that are all negativ e while all the others are p ositiv e. . . . the ‘go o dness of fi t’ is sub ject to a rather strong doub t, irresp ectiv e of the actual computed v alue of χ 2 , ev en if it h app en s to b e small” (Neyman, 1980 ). DYNAMIC INDETERMINIS M IN SCIENCE 9 Neyman et al. ( 1953 ) pr op osed an inno v ativ e ED A metho d to examine v ariabilit y: sp ecifically , giv en v al- ues X and Y w ith the same units, p lot X − Y and | X − Y | versus ( X + Y ) / 2. Fig ure 5 compares T a- bles 3 and 5 of th e sard ine analysis this wa y . In the t w o panels one sees w edging, that is, an increase of v ariabilit y with size. This suggests that a transfor- mation of the data m ight simp lify the matter. Ney- man did emplo y the log trans form in h is analysis of the s ardine data consisten t with the multi plicativ e c h aracter of the mo del. 5. F OUR EXAMPLES OF RANDOM PROCESS D A T A ANAL YS IS The follo wing examples r ep ort some of my w ork, t ypically with collab orators. They were suggested in part b y m y exp osu r e to JN and to the preceding examples. 5.1 Example 4. S HEEP BLO WFLIES In Example 2 ab o v e Neyman studied data on sar- dines that included the actual age information. How- ev er, it can b e the case th at, ev en though a p op- ulation is age-structured, only aggregate data are Fig. 5. C om p arisons of T able 3, x-values and T able 5 , y– values. The l eft p anel plots ( x − y ) versus ( x + y ) / 2 and the right | x − y | versus ( x + y ) / 2 . T able 6 Life stages and their lengths for she ep blowflies Life stage Length egg 12–24 hours larv a 5–10 days pupa 6–8 d a ys adult 1–35 days a v ailable, and ac tual age information is un a v ailable. This is the ca se in the example that f ollo ws. T o deal with it a state-space mo del is set do wn. The (un- observ ed) state vecto r is tak en to b e the counts of individuals in th e v arious age groups. The story and details follo w. The tale b egins with the mathematician John Guck- enheimer and the then en tomologist George Oster coming to meet with DRB. Th ey had in hand d ata on a p opulation of lucilia cuprina (Australian sheep blo wflies). T he data co ncerned an exp er im ent main- tained from 1954 to 1956 under constan t, bu t limited conditions by A. J. Nic holson, th en Chief Division of Entomolog y , CSIRO, Australia. A t the b eginning of the exp erimen t 1000 eggs were placed in a cage. Ev ery other da y coun ts w ere made of the num b er of eggs, of nonemerging flies’ eggs, of the num b er of adult fl ies emerging, and of the n umb er of adult fl y deat hs. The life stag es, and cor- resp ond ing time p erio d s, of these insects are given in T able 6 . F ur ther details of the exp eriment ma y b e found in Nic holson ( 1957 ). T o get digital v alues Oster and a student to ok a photo of one of the fig- ures in that p ap er. The photo w as then pro jected on a wall and numerical v alues read off. Unfortunately some of the p opulations’ sizes w en t off the top of the fi gure. The v alues for these cases were obtained when DRB later visited C SIRO. Guc k enheimer and Oster’s question w as whether these data displa y ed the presence of a strange at- tractor, a concept from nonlinear dynamic systems analysis; see Brillinger et al. ( 1980 ) and Guck en- heimer and Holmes ( 1983 ). The b eh a v ior evidenced in the second half of the series graphed in Figure 6 is w hat att racted Guck enheimer and Oster’s at- ten tion. The initial oscillatio ns come from the usual lifespan of the adults. In the particular exp er im ent s tudied h ere the amoun t of fo o d pu t in the fly cag e was d elib erately restricted. This m eant that the fecundit y of the fe- males w as r educed. When m u c h fo o d wa s a v ailable man y eggs w ere laid. With insufficient fo o d the n um- b er of eggs w as reduced. Th is led to b o om p erio ds and bust p erio ds in the p opulation size. Figure 6 graphs the square ro ots of total adult p opulation coun t, as well as of the n umb er of flies emerging. The time p oin ts are ev ery other day ov er a p erio d of appro ximately t wo yea rs. In th e graphs one sees an in itial p erio dic b eha vior in b oth series fol- lo wed by r ather irr egular b eha vior. The squ are ro ots 10 D. BRILLIN GER Fig. 6. Squar e r o ots of c ounts for the Nicholson blowfly data. The top p anel pr ovides the numb er of adults and the b ottom the numb er of emer ging pup ae. w ere plotted to make the v ariabilit y of the display more n early constan t. Brillinger et al. ( 1981 ) pro ceeded b y setting do wn a formal state-space mo d el for th e situation as fol- lo w s : t = 0 , 1 , 2 , . . . , represen ts time, observ ations b eing made every other d a y , E t , the num b er of emerging fl ies in time p erio d ( t, t + 1] , E t , the en tran t column vec tor; it has E t in ro w 1 and 0 elsewhere, N t , the adu lt p opu lation at time t. Constructs include: N t = [ N it ], the state ve ctor; in it r o w i give s the n umb er of p opulation mem b ers a ged i − 1 at time t , P t = P ( H t ) = [ p i,t ], the su r viv al matrix. The en try in ro w i + 1 , column i giv es th e prop ortion surviving age i to age i + 1. P t is tak en as dep ending on the history H t , that is, the collecti on of the data v alues up to and includ ing time t . The a v ailable data are E t and N t . The measuremen t equation, corresp ondin g to the observ ed p opu lation size is, N t = 1 ′ N t . The dyn amic equation is N t +1 = P t N t + E t +1 + fluctuations . This expression up d ates the coun ts of adult flies in eac h age group, starting from N 0 = 0. The fl uctua- tions represent v ariabilities in those n umbers. In one analysis (B rillinger et al., 1980 ), the follo w- ing n onlinear age and density mo del w as emplo y ed: p i,t = 1 − P r ob { individual age d i, dies age d i at time t | H t } = (1 − α i )(1 − β N t )(1 − γ N t − 1 ) . (6) Fig. 7. De ath series and synthetic de ath series using the mo del ( 6 ) . This mod el allo ws surv iv al dep endence on age, i , on the current p opulation size, N t and on the p reced- ing p opulation size, N t − 1 . The final term allo w s the p ossibilit y that it takes some time for the limit ed or excess fo o d situation to tak e effect. W eigh ted least squares wa s emplo yed in the fi tting of mo del ( 6 ). On the basis of r esidual plots weig hts w ere tak en to b e N 2 t . Hence w riting D t = N t − 1 − N t + E t one seeks min θ X t D t +1 − X i q i m i,t ! 2 . N 2 t , where θ = { α i , β , γ } and m i,t is the conditional ex- p ected v alue, E { N i,t | H t } . Graphs of the estimates of the ind ividual entries of N t are pr ovided in Brillinger et al. ( 1980 ). Synt hetic series were compu ted to assess the rea- sonableness of the mo del ( 6 ). In th e sim u lations counts of d eaths in the time p erio d ( t − 1 , t ], are computed. The deaths, D t , are plotted in the top panel of Fig- ure 7 . The v alue D t is th ough t of as fluctuating ab out the v alue X i q i,t N i,t where N i,t is th e p opulation aged i at time t . The results of t w o sim ulations are provided in Fig- ure 7 . In the first, the middle series, the v ariabilit y is tak en as binomial. In the second, the b ottom se- ries, the v ariabilit y is tak en as indep enden t normal, mean 0, standard deviation ˆ σ N t with ˆ σ estimated from the weig hte d least squ ares results. Th at the app earances of the syn thetic series are so close to the actual series relates to the use of the common stim ulus series, E t . DYNAMIC INDETERMINIS M IN SCIENCE 11 A b ypr o duct of this analysis is th at b ecause the measuremen t equation, N t = 1 ′ N t , is of simple ad- dition form b y this analysis one has dev elop ed a de- comp osition of the p opulation total series into indi- vidual age series. These are graph ed in Br illinger et al. ( 1980 ). The fitted death rates w ere nonlin ear in the p op- ulation size, so mathematically a strange attractor migh t b e present (Brillinger, 1981 ). In this situation one is actually dealing with a non- linear clo sed lo op feedbac k sys tem with time lags. Guttorp ( 1980 ), in his do ctoral thesis, completed the analysis of the feedb ac k loop mo deling th e b irths. 5.2 Example 5. WEA T HER MODIFICA TION REVISITED Neyman and Scott’s p roblem referr ed to in Ex- ample 3 w as addr essed in Brillinge r ( 1995 ). A t issu e w as making inferences concerning the trav el time of seeding effects from Ticino to Zuric h . The approac h of th e pap er was to envisage a succession of trav el time effects that started at times th roughout th e seeding p erio d . This wa y one had replica tes to allo w emplo ymen t of statistical c haracteristics. A concep- tual model in v olving a gamma densit y for the tra v el v elo cit y of the seeding effect wa s emplo y ed. Th e data themselv es w ere graphed in Figure 4 ab o v e. The m o del emp lo yed is the follo wing. Su pp ose that “rain particles” create d at Ticino mo ve off to wa rd Zuric h with a p ossibilit y of leading to a cluster of rain drops there. Su pp ose that the particles are b orn at Ticino at the times σ j of a p oin t pro cess M , at rate p M ( t ). Sup p ose that the trav el times from the particles’ times of cr eation, U j , to Zurich are in d e- p end ent of eac h other with d ensit y f U ( · ). Let N de- note th e p oin t p ro cess of times, τ j , at wh ic h the particles arrive at Z u ric h an d p N ( t ) denote the rate of th at pr o cess. If the j th particle mov es with v elo city v j and the distance to b e tra ve led is ∆, then its trav el time is u j = ∆ /v j and since X j δ ( t − τ j ) = X j δ ( t − σ j − u j ) with δ ( · ) the Dirac d elta, one has p N ( t ) = Z p M ( t − u ) f U ( u ) du. Let the amoun ts, R j , of rain falling at Zuric h asso- ciated w ith the individu al particles, b e statistically indep en d en t of the p articles. Let µ R denote E { R j } . Then the rate of rainfall at Zurich at time t is p X ( t ) = µ R Z p M ( t − u ) f U ( u ) du. Next let X ( t ) denote the cum ulativ e amoun t of rain falling at Zuric h from time 0 to time t . Its ex- p ected v alue is E { X ( t ) } = Z t 0 p X ( v ) dv . T urn ing to Figure 4 , Ne yman and S cott emp lo yed a runn ing mean of order 3 of the h ourly totals to get the v alues graphed. These are the data a v ailable for analysis. (The h ourly v alues app ear to b e lost.) The runn in g mean ma y b e written Y ( t ) = 1 3 ( X ( t + 1) − X ( t − 2)) for t = 2 , 3 , . . . . Its exp ected v alue is 1 3 Z t +1 t − 2 p X ( v ) dv (7) = 1 3 µ R Z t +1 t − 2 Z p M ( v − u ) f U ( u ) du dv . One can n ow view the Neyman–Scott p roblem as related to estimating f U ( · ) of ( 7 ), that is, estima ting the tr av el time densit y given the av ailable data. T o pro ceed, the seeding rate p M ( t ) will b e tak en to b e constan t on the time in terv al fr om 0730 to 2130 hours and to b e 0 otherwise. It will b e fur- ther a ssum ed that the tra v el time of U has the form θ /W with θ a parameter, and with W W eibull, ha v- ing scale 1, and shap e s . Br illinger ( 1995 ) to ok the gamma as the densit y , but a r eview of the literature of wind sp eeds suggests that the W eibull would b e more app ropriate. W riting p M ( t ) = C for A < t < B (here A = 7.5 and B = 21.5 hr) one has the regression fun ction E { Y ( t ) } = α + C 3 µ R Z t +1 − A t − 2 − A F U ( u ) du (8) − Z t +1 − B t − 2 − B F U ( u ) du , where F U ( · ) denotes the distribution function of U , in the case of s eedin g and α is the natural lev el of rainfall. With the assumed W eibu ll vel o cit y distri- bution, ( 8 ) ma y b e ev aluated in terms of G the dis- tribution function of the W eibu ll. Sp ecifically , Z x 0 F U ( u ) du = x 1 − G 1 x , s − s s − 1 1 − G 1 x , s − 1 . 12 D. BRILLIN GER (T o deriv e this one replaces Prob { 1 /W ≤ u } by Prob { W ≥ 1 /u } and inte grates b y p arts.) The estimates of the unkn o w ns µ = θ Γ(( s − 1) /s ) (the a v erage tra vel time), s , α , β = C µ R / 3 were de- termined b y ordinary least squ ares, weigh ting the seeded terms by 53 and the un seeded by 38 to han- dle the unequal n umb ers of seeded and unseeded cases. Figure 8 , left-hand panel, pr esen ts the data (solid curv e) and the fitted (dotted) curv e. The p arameter estimates obtained are: ˆ µ = 4 . 78(0 . 4 7) hr, ˆ s = 6 . 68(5 . 12) , ˆ α = 0 . 24 (0 . 02) , ˆ β = 1 . 69 (0 . 19) . [The standard errors, assumed the errors to b e i.i.d.] One sees in the left-hand panel that the actual data hav e a p eak near 1800 d uring 0730 and 2130 hr, whereas th e fi tted has a flat top. Perhaps the birthrate, p M ( t ), of particles is not appr oximate ly constan t as assumed ab ov e. Perhaps the d istribu- tion, f U ( u ), dep ends on time. P erhaps the result is due to natural v ariability . A s y nthetic p lot is generated to examine the fit. Sp ecifically the flu ctuations of the unseeded da ys ha v e b een added to the fitted curve and graphed in the righ t-hand panel of Figure 8 . Still the fit- ted curve is qu ite flat on the top, in contrast to the Neyman–Scott data curv e whic h is noticeably p eak ed. T h e added fl uctuations do n ot br ing the curv e up to the data level . Fig. 8. L eft p anel—actual and fitte d (dott e d line) r ainfal l when se e ding. R ight p anel—actual and synthetic in the c ase of se e ding (dotte d line). Returning to the Neyman–Scott p roblem of Sec- tion 3 , the second qu otation there refers to T , a ran- dom time at whic h seeding first sho ws up in Zuric h. The U ’s r epresen t the lengths of time it tak es for an effect just initiated to arrive. One can tak e the exp ected v alue, E U , to b e E T . Using the parame- ter estimates ab o v e, an approximat e 95% confidence in terv al for the exp ectation of T is 4 . 78 ± 2 ∗ 0 . 47 hours . More w ork needs to b e done with this example. A indication of ho w to p ro ceed is provided by Figure 8 . The data graph is p oin ted, w hereas the fitted is flat-topp ed. 5.3 Example 6. ELK MOTION The d ata n o w studied w er e collected at the Starke y Exp erimental F orest and Range (S tark ey), in Northeastern Oregon. Qu oting from the w ebsite, fs.fed.us/pnw/stark ey/pub lications/b y keyw ord/ Mo delling Pubs.shtml . Stark ey w as set up b y the US F orest Service for “Long-term stu d ies of elk, deer, and cattle— examining the effects of un gulates on ecosys- tems.” A sp ecific managemen t question of concern is whether recreational uses by h umans would affect the an i- mals there subs tantial ly . F u rther details ab ou t Stark ey and the recreation exp eriment m ay b e found in Brillinger et al. ( 2001a , 2001b , 2004 ), Preisler et al. ( 2004 ) and Wisdom ( 2005 ). In the first analysis presen ted th e elk were not de- lib erately distu rb ed and their paths were s ampled at discrete times. This ga ve con trol data for an exp er- imen t. An all-terrain ve hicle (A TV) w as in tro du ced and driv en around on the roads in the NE Meadow of S tark ey . The analysis to b e presente d quantifies the effect of the d isturbance. T he lo cations of b oth the A TV a nd the elk were monitored by GPS meth- o ds. There were 8 elk in the study . The A TV was intro- duced in to the meado w o v er 5-day p erio d s. This was follo wed by 9-da y “con trol” p erio ds with n o A TV. In the control p erio ds the animals w ere lo cated ev- ery 2 hours. I n the A TV case elk locations w ere esti- mated ab out ev ery 5 m in. The A TV’s lo cations w ere determined ev ery second. Figure 9 , left-hand panel, sho ws obser ved elk tra- jectories sup erp osed. O ne sees the animals constrained b y the fence, b ut mo ving ab ou t most o f the Reserve. DYNAMIC INDETERMINIS M IN SCIENCE 13 Fig. 9. Northe ast p astur e of the Starkey R eserve and the elk motion on c ontr ol days. The lef t p anel shows the p aths of 8 elk, sup erp ose d. The right p anel displays the estimate d velo city field ˆ µ ( r ) as a ve ctor field. They often visit the SE corner. The straigh t line seg- men ts result from the lo cations b eing obtained only ev ery 2 hours in th is con trol case. The animal motion w ill b e mo deled b y the SDE d r ( t ) = µ ( r ( t )) dt + σ d B ( t ) (9) with r ( t ) the lo cation at time t , B a biv ariate stan- dard Bro wnian m otion and σ a scalar. Th e fu nction µ is assumed to b e sm o oth. Th e discrete app r o xima- tion ( 3 ) b ecomes a generalize d additiv e mo del with Gaussian errors; see Hastie and Tibsh irani ( 1990 ). The resulting estimate is displa y ed as a velocit y v ector field ( ˆ µ 1 ( r ) , ˆ µ 2 ( r )) in the right-hand panel of Figure 9 emplo ying arro ws. One sees the animals mo ving along the b oundary and to wa rd the cen ter of the pasture. Th e fence can b e ignored in th is d ata analysis. The fence is imp ortan t in prep aring a synt hetic tra jectory . What wa s done in that connectio n w as to emplo y the r elation ( 3 ) with the pro viso that if it generated a p oin t outside the b ou n dary , then an- other p oint w as generated un til one sta yed within the b ound ary . This is a naiv e but effectiv e metho d if the t i of ( 3 ) are close enough together. Better w a ys for dealing with b oundaries are review ed in Brillinger ( 2003 ). Figure 10 shows the tra jectories of three of the animals. The lo wer right panel present s a synt hetic path generated in cluding 188 location p oin ts. The syn thetic tra jectory do es not app ear unr easonable. Consideration no w turns an analog of regression analysis for tra jectories, that is, there is an explana- tory v ariable. The explanatory v ariable is th e c hang- ing lo cation, x ( t ), of the A TV. The left-hand panel Fig. 10. The first thr e e p anels display the tr acks of the i n- dic ate d animal s. The final p anel, lower right, i s a synthet ic p ath. of Figure 11 sho ws the routes of the A TV cruising around the roads of the Meado w. T he righ t-hand panel pro vides the sup erp osed tra jectories of the 8 elk. One sees, for example, the elk heading to the NE corner, p ossibly seeking refuge. Th e noise of th e A TV is surely a rep ellor when it is close to an elk, but one wo nder s at what d istance d o es the repu lsion b egin? The follo wing mo d el wa s emplo yed to study that question. Let r ( t ) denote the location of an elk, and x ( t ) the lo cation of the A TV, b oth at time t . Let τ Fig. 11. The left p anel shows the A TV ’ s r oute, while the right shows the elk p aths i n the pr esenc e of the A TV. The A TV p asses in and out some gat es on the lefthand side. 14 D. BRILLIN GER b e a time lag to b e stud ied. Consider d r ( t ) = µ ( r ( t )) dt + ν ( | r ( t ) − x ( t − τ ) | ) dt (10) + σ d B ( t ) . The times of observ ation differ for the el k and the A TV. They are every 5 minutes f or the elk w hen the A TV is present and eve ry 1 sec for the A TV itself. In the approac h adopted lo cation v alues, x ( t ), of the A TV are estimated for the elk observ ation times via in terp olation. Th e A T V observ ed times are close in time, namely 1 second, so the in terp olation should b e reasonably accurate. Expression ( 10 ) allo ws the c hange in sp eed of an elk to b e affe cted by the location of the A TV τ time units earlier. Assumin g that µ and ν in ( 10 ) are smo oth functions, then the mo del m a y b e fit as a generalized add itiv e mo del. Figure 12 graphs | ˆ ν ( d ) | , d b eing the distance of the elk fr om the A TV. (The norm | ν | = q ν 2 1 + ν 2 2 here.) One sees an apparent in - crease in the sp eed of th e elk, particularly when an elk and the A TV are close to eac h another. The in- creased sp eed is apparent at distances out to ab out 1.5 km. An upp er 95% n ull leve l is indicated in Fig- ure 12 b y a dashed line. One sees less precise mea- surement at increasing large v alues of τ . The estimation of | ν ( d ) | w as also carried out in the absence of the µ term in th e mo d el. The results w ere v ery similar. This giv es some v alidity to in terpreting the estimat e ˆ ν ( d ) on its o w n despite the p r esence of µ in the mo del. In conclusion, the A T V is ha vin g an apparent ef- fect and it h as b een quan tified to an exten t by the graphs of Figure 12 . These resu lts were present ed in Brillinger et al. ( 2004 ). Also Wisdom ( 200 5 ) and Preisler et al. ( 2004 ) mo deled the p robabilit y of elk resp onse to A TVs in a differen t wa y . They us ed data for the ye ar 2002, and measured the pr esence of an effect in another manner. 5.4 Example 7. MONK SEAL S : A POTENTIAL FUNCTION APPRO A CH Ha waiia n monk seals are en d emic to th e Ha wa i- ian Islands. The species is endangered and has been declining for s ev eral decades. It no w num b ers ab out 1300. One h yp othesis accoun ting f or the decline in n umb er s is the p o or gro wth and su rviv al of yo un g seals o wing to p o or foraging success. In consequence of the d ecline data hav e b een collected recen tly on the foraging habitats, mo v emen ts, and b eha viors of these seals throughout the Ha wai ian Island s Arc hip elago. Sp ecific questions that hav e b een p osed regarding the s p ecies include: What are th e geographic and v ertical m arine habi- tats that Haw aiian monk s eals use? Ho w long is a foraging trip? F or more biologica l detai l see Stew art et al. ( 2006 ) and Brillinger, Stew art and Litnn an ( 2006 , 2008 ). The data set stud ied is for the we st sid e of the main Ha waiian Island of Molok ai. The w ork pro- ceeds b y fitting an SDE that mimics some asp ects of the b eha vior of seals. It emplo ys GPS lo cation data collec ted f or on e seal. An SDE is f ound b y de- v eloping a p oten tial fun ction. The data are from a three-mon th journey of a ju- v enile male w hile he f oraged and o ccasionally hauled out onshore. The trac k started 13 Apr il 2004 and ended 27 July 2004. The animal was tagged and re- leased at the south we st corn er of Molok ai; see Fig- ure 13 , top left pan el. The trac k is ind icated for six con tiguous 15-da y p erio ds. The seal had a satellite- link ed radio transmitter glued to his dorsal p elage. It w as used to do cum ent geog raphic and v ertical mov e- men ts as pro xies of foraging b eha vior. There were 754 lo cation estimates pro vided by the Argos satellite service, b ut many were su s picious. Asso ciated with a lo cation estimate is a p rediction of the location’s error (LC or location class). The LC index takes on the v alues 3, 2, 1, 0, A, B, Z. When LC = 3, 2 or 1 the error in th e lo cation is predicted to b e 1 km or less, and th ese are the cases emplo y ed in the analysis here. The estimated times of lo cations are irregularly spaced and not as close together as one might like. This can lead to difficulties of analysis and interpre- tation. The motiv ating SDE of the analysis is d r ( t ) = µ ( r ( t )) dt + σ d B ( t ) , r ( t ) ∈ F , (11) with µ = −∇ H , H a p oten tial fun ction, σ scalar, B biv ariate Bro wnian and F the region ins ide the 200- fathom line u p to Molok ai. There was discuss ion of the p otenti al app roac h in S ection 3 . The p oten tial function emplo yed here is H ( x, y ) = β 10 x + β 01 y + β 20 x 2 (12) + β 11 xy + β 02 y 2 + C /d M ( x, y ) where d M is the shortest distance to Molok ai f r om the lo cation ( x, y ) . The fin al term in ( 12 ) is meant to k eep th e animal off Molok ai. DYNAMIC INDETERMINIS M IN SCIENCE 15 Fig. 12. The function | ˆ ν | of (10) for the tim e lags 0, 5, 10, 15 minutes. The mo del was fit b y ord in ary least squares taking C = 7 . 5. In the an alysis the n umb er of data p oin ts w as 142 and the paramete r estimates obtained were ˆ β = (93 . 53 , 8 . 00 , − 0 . 47 , 0 . 47 , − 0 . 41) , and ˆ σ = 4 . 64 km. Figure 14 shows the estimated p oten tial fun ction, ˆ H . This s eal is pulled into the mid dle of the concen tric con tours, with the Bro wnian term pushing it ab out. Synt hetic p lots w ere generated to assess the rea- sonableness o f the mo d el and to suggest d epartures. Figure 15 sho ws the results of a sim u lation of the pro cess (only one path wa s generated) ha ving tak en the parameter v alues to b e those estimated and ha v- ing brok en the o ve rall tra jectory down into six seg- men ts as in Figure 13 , to whic h it may b e compared. Fig. 13. Pl ots of the se al ’ s wel l-determine d lo c ations for suc c essive 15-day p erio ds. The dashe d line is the 200-fathom line. It c orr esp onds to Penguin Bank. The sampling in terv al, dt , employ ed in the numeri- cal in tegration of the fitted SDE is 1 hour. The paths w ere constrained to not go outside the 200-fathom line and not to go on the island. (See Brillinger, 2003 , for metho ds of doing this.) The lo cations of the time p oint s of the synt hetic track are th e times of the observe d lo cations. This allo ws d irect compar- Fig. 14. The fitte d p otential function obtaine d using the p o- tential function ( 12 ). The darker the values ar e, the de ep er the p otential function is. The slante d line r e gion is Molokai. 16 D. BRILLIN GER Fig. 15. Synthet ic plots of the mo del ( 11 ) having fit the p o- tential function ( 12 ) . The times ar e those of the data of Fig- ur e 13 . ison with the data plot of Figure 13 . The v ariabilit y of Figure 15 is not unlik e that of Figure 13 . In this w ork the scat tered, sometimes unreason- able, satellite lo cations hav e b een cleaned u p and summarized by a p oten tial fun ction. Th e general motion of the animal on a foraging trip has b een inferred and sim u lated. It h as b een learned that the animal sta ys mostly within Penguin Bank a nd tend s to remain in an area off the w est coast of Molok ai. There are other examples of p oten tial f unction es- timation in Brillinger, Stewart and L ittnnan ( 2006 , 2008 ) and Brillinger ( 2007a , 2007b ). 6. CONCLUSION “Sa y what y ou are going to say , sa y it, then say what y ou said” (Neyman, Pe r- sonal comm u nication). It was a great honor to b e in vited to presen t the Neyman Lecture. I attended man y Neyman S emi- nars and made quite a few present ations as w ell. A side effect of th e wo rk w as the very pleasan t exp e- rience of reading thr ough m an y of Neyman’s p ap ers in the course of preparing the lecture and the article. So man y p ersonal memories retur ned. The emphasis has b een p laced on dynamic and spatial situations. There are thr ee examples of J N and ELS; t w o concern temporal f unctions and one spatial. F our examples are pro vided of the w ork of DRB with collab orators. Two are temp oral and tw o are spatial-temp oral. The data are from astronom y , fisheries, meteorolo gy , insect biology , animal biology and marine biology . The mo dels and analyses w ere not all that d ifficult. The statistical pac k age R was emplo y ed. The field of sampling w as another one to w hic h Neyman made ma jor con tr ib utions; see Neyman ( 1934 , 1938a ). It can b e argued that w ork in samplin g h ad a more p rofound impact on the United S tates than an y of his other app lied wo rk. I looked hard b u t did not find reference to rep eated sample su rv eys in JN’s w ork. Ha d I, there w ould ha ve b een some discussion of d ynamic sample surv ey . The reader cannot ha v e missed the many refer- ences to Elizab eth Scott. In fact in man y places in m y lecture the title could ha v e b een th e Neyman– Scott Lecture. F rom the y ear 1948 on, 55 out of 140 of J N’s pap ers were with her. Some 118 of Bett y’s publications are listed in Billard and F erb er ( 1991 ). One in the spirit of this lecture, Scott ( 1957 ), con- cerns the Scott effect, a biasing effect that o ccurs in g alaxy observ ations b ecause at greatest distances only the br ightest would b e observed. She dev elop ed a correction metho d (Scott, 1957 ). I end w ith a w onderful and enligh tening story con- cerning Jerzy Neyman. It was told by Alan Izenman at the lecture in Minn eap olis. In the early 197 0s the Berk eley Statistics Department voted to do aw a y with language requirements. (There had b een exams in t w o non-English languages.) In resp onse in the graduate class that JN was teac hing he announced that he w as going to ask v arious p eople to giv e their present ation in their nativ e, n on-English, language. This con tinued for a n umber of w eeks and languages. A CKNO WLEDGMENTS I hav e to thank my collab orators and friends re- garding the matters describ ed in the pap er. These include A. Ager, J. Guc k enheimer, P . Guttorp, A. Izenman, J. Kie, C. Littnan, H. Preisler, G. Oster and B. S tew art. I also th ank the Ed itor and refer- ees for their commen ts. Th ey imp ro v ed the article. Brillinger ( 1983 ) w as an earlier attempt at the topic. The r esearc h was supp orted by v arious NSF gran ts, the most recen t b eing DMS-05 -04162, “Random pro- cesses: data analysis and theory .” REFERENCES Billard, L. and Ferber, M. A. (1991). Elizab eth S cott: Schola r, teacher, administrator. Statist. Sci. 6 206–216. MR1127863 DYNAMIC INDETERMINIS M IN SCIENCE 17 Brillinger, D. R. (1981). Some asp ects of mo dern p opulation mathematics. C anad. J. Statist . 9 173–194. MR0640015 Brillinger, D. R. (1983). Statistical inference for random processes. In Pr o c e e dings of the International Congr ess of Mathe maticians 1 , 2 1049–106 1. PWN, W arsa w. MR0804757 Brillinger, D. R. ( 1995). On a weather mo dification prob- lem of Professor Neym an . Pr ob ab. M ath. Statist. 15 115– 125. Brillinger, D. R. ( 2003). S imulating constrained ani- mal motion using stochastic differential equations. Pr ob- ability , Statistics and Their Applic ations. IMS L e ctur e Notes M ono gr aph Series 41 35–48. IMS, Beach w o od , OH. MR1999413 Brillinger, D. R. (2007a). A p otential funct ion approac h t o the flow of pla y in so ccer. J. Q uant. Anal. Sp orts 3 1–21. MR2304568 Brillinger, D. R. (2007b). Learning a p otential fun ction from a tra jectory . Si gnal Pr o c essing L etters 14 867–8 70. Brillinger, D. R., Guckenhei mer, J., G uttorp, P. and Oster, G. (1980). Empirical mo deling of popu lation time series d ata: the case of age and density dep endent vital rates. L e ctur es Mathematics Life Scienc es 13 65–90. Brillinger, D. R., Prei sler, H. K., Ager, A. A. and Kie, J. (2001a). The use of p otential funct ions in mo delling an- imal mo vemen t. In Data A nalysis fr om Statistic al F ounda- tions 369–386. No v a Science, Hutington. MR2034526 Brillinger, D. R., Preisler, H . K., A g e r, A. A., Ki e, J. and Stew ar t, B . S. (2001b). Mo delling mov ements of free- ranging animals. T echnical Rep ort 610 , UCB Statistics. Brillinger, D. R., Preisler, H . K., Ager, A. A. and Wisdom, M. J. (2004). Sto chastic differentia l equations in the analysis of wildlife motion. In 2004 Pr o c e e dings of the Amer ic an Statistic al Asso ciation , Statistics and the Envi- r onment Se ction . Brillinger, D. R., Stew ar t, B. S. and Littnan, C. L. (2006). A meandering hylj e . In F ests chrift for T armo Pukkila 79–92. Univ. T amp ere, Finland. Brillinger, D. R., Stew ar t, B. S. and Littnan, C. L. (2008). Three months journeying of a H a waii an monk seal. IMS C ol l e ctions. Pr ob abili ty and Statistics : Essays i n Honor of David A. F r e e dman 2 246–264 . IMS, Beac hwood, OH. Da wkins, S ., Neym a n, J. and S cott, E. L. (1977). The Grossv ersuch Pro ject. T r ansactions of Workshop on T otal- Ar e a Effe cts of We ather Mo dific ation. F ort Collins, Col- orado. Fix, E. and Neym an, J. (1951). A simple sto chastic mo del of recov ery , relapse, death and loss of patients . Human Bi- olo gy 23 205–241. Guckenheime r, J. and Holmes, P. (1983). Nonline ar Os- cil lations , Dynamic al Systems , and Bi f ur c ations of V e ctor Fields . S p ringer, New Y ork. MR0709768 Guttorp, P. M. (1980). Statistical modelling of p opu lation processes. Ph.D. thesis, Univ. California, Berk eley . Hastie, T. J. and Tibshirani, R. J. (1990). Gener alize d A dditive Mo dels . Chapm an and H all, London. MR1082147 Heyde, C. (1994). A q uasi-likel iho o d app roac h to estimating parameters in diffusion t yp e processes. J. Appli e d Pr ob ab. 31A 283–290. MR1274731 Ito, K. (1951). On sto chastic differenti al equations. Mem. Amer . Math. So c. 1951 1–51. MR0040618 Kendall, D. G., Bar tlett, M. S. and P age, T. L. (1982). Jerzy Neyman, 1894–1981. Bio g. M emoirs F el lows R oyal So ciety 28 379–412. Kloeden, P. E. and Pla ten, E. (1995). Numeric al Solution of Differ ential Equations . Springer, Berlin. Le Cam, L. (1995). Neyman an d sto chastic models. Pr ob ab. Math. Stat ist. 15 37–45. MR1369790 Le Cam, L. and Lehmann, E. ( 1974). J. Neyman—on the occasion of h is 80th birthday . Ann. Statist. 2 vii-xiii. MR0342345 Lehmann, E. (1994). Jerzy Ney man. Bio gr aphic al Memoirs 63 395–420. National Acad. Sci. Nelson, E. (1967). Dynamic al The ories of Br ownian Motion , 2nd ed. Princeton Univ. Press . MR0214150 Neyman, J. (1934). On tw o d ifferent asp ects of the repre- senta tive metho d: The method of stratified sampling and the metho d of purp osive selection. J. R oy. Statist. So c. 97 558–606 . Neyman, J. (1938a). Con tributions t o the theory of sampling human p opulations. J. Amer. Stat ist. A sso c. 33 101–11 6. Neyman, J. (1938b). L e ctur es and Confer enc es on Mathemat- ic al Stat istics and Pr ob abili ty The ory . USDA, W ashington. Neyman, J. (1947). Outline of the statistica l treatment of the problem of diagnosis. Public He alth R ep orts 62 1449–1456. Neyman, J. (1948). R ep orts on the Sar di ne Fi shery. Research Department, Ca lifornia Council of the Congress of Indu s- trial Organizations. Neyman, J. (1949). O n the problem of estimating the num b er of sc ho ols of fish . Uni v. California Publ . Statist. 1 21–36. MR0038046 Neyman, J. (1960). In determinism in science and new de- mands on statisticians. J. Amer. Statist. Asso c. 55 625– 639. MR0116393 Neyman, J. (1966). Behavioristic p oints of v iew on mathe- matical statistics. In On Pol itic al Ec onomy and Ec onomet- rics 445–462. P olish Scientific Pub lishers, W arsa w. Neyman, J. (1967). A Sele ction of Early Statistic al Pap ers of J. Neyman . Un iv. California Pres s. MR0222983 Neyman, J. (1970). A glance at some of my p ersonal exp e- riences in the p rocess of researc h. In Scientists at Work (T. Dalenius et al., eds.) 148–164. Almqvist and Wiksells, Uppsala. MR0396141 Neyman, J. (1976). Descriptive statis tics v s. chance mec ha- nisms and so cietal problems. I n Pr o c. 9th Int. Biometrics Conf. I I 59–68 . Boston. Neyman, J. (1980). Some memorable incidents in probabilis- tic/statistical stu dies. In Asymptotic The ory of Statistic al T ests and Estimation (I. M. Chakrav arti, ed.) 1–32. Aca- demic, New Y ork. MR0571333 Neyman, J. and Scott, E. L. (1956). The d istribution of galaxies. Sci entific A meric an September 187–200. Neyman, J. and Scott, E. L. (1959). St ochastic mod els of p opulation d ynamics. Scienc e 130 303– 308. MR0107571 Neyman, J. and Scott, E. L. (1965–1966 ). Planning an ex- p eriment with cloud seeding. Pr o c. Fifth Berkeley Symp o- 18 D. BRILLIN GER sium on Math. Stat istics and Pr ob ab. 32 7–350. U niv. Cali- fornia Press, Berk eley . Neyman, J. and Scott, E. L. (1972). Pro cesses of clustering and applications. In Sto chastic Point Pr o c esses (P . A. W. Lewis, ed.) 646–6 81. Wiley , New Y ork. Neyman, J. and Scott, E. L. (1974). R ain stimulatio n ex- p eriments: design and ev aluation. In Pr o c. WMO/I AMAP Sci. Conf. We ather Mo dific ation 449–45 7. WMO, Geneva . Neyman, J., Scott, E. L. and Sha ne, C. D. (1953). On the spatial distribution of galaxies a sp ecific mod el. Astr ophys. J. 117 92–1 33. Neyman, J., Scott, E. L. and Shane, C. D. (1954). The in- dex of clumpiness of the distribution of images of galaxies. Astr ophys. J. Supp. 8 269–29 4. Neyman, J., Scott, E. L. and Wells, M. A. ( 1969). Statis- tics in meteorolog y . R ev. Inter. Stat. Inst. 37 11 9–148. Nicholson, A. J. (1957). The self-adjustmen t of populations to change. Cold Spring Harb or Symp. Quant. Biol. 22 153– 173. Pearson, K. (1900). The Gr am mar of Scienc e . D ent, Lon- don. Preisler, H. K., Ager, A. A., Johnson, B. K. and Kie, J. G. (2004). Mod elling animal mov ements u sing sto chastic differential equations. Envir onmetrics 15 643–657. Reid, C. (1998). Neyman . S p ringer, New Y ork. MR1480666 Scott, E. L. (1957). The brightes t galaxy in a cluster as a distance ind icator. Astr on. J. 62 248–26 5. Scott, E. L. (1985). Neyman, Jerzy . Ency cl. Stat. Sci. 6 214–223 . Scott, E. L., Shane , C. D. and Wir t anen, C. A. (1954). Comparison of the synthetic an d actual distribution of galaxies on a ph otographic p late. Astr ophys. J. 119 91–112. Sørensen, M. (1997). Estimating functions for d iscretely ob- serve d diffusions: A review. IMS L e ctur e Notes Mono gr aph Series 32 305 –325. IMS, Hayw ard, CA. MR1837812 Stew ar t, B. S., Antonelis, G. A., Y ochem, P. K. and Baker, J. D. (2006). F oraging biogeo graphy of Haw aiian monk seals in th e northw estern Ha wai ian Islands. A tol l R e- se ar ch Bul l etin 543 131–145. T a ylor, J. R. (2005). Classic al Me chanics . Univ. Science, Sausalito. Wisdom, M. J. ed. (2005). The Starkey Pr oje ct. Alliance Comm unications Group, Lawrence Kansas.
Original Paper
Loading high-quality paper...
Comments & Academic Discussion
Loading comments...
Leave a Comment