A note on the ABC-PRC algorithm of Sissons et al. (2007)
This note describes the results of some tests of the ABC-PRC algorithm of Sissons et al. (PNAS, 2007), and demonstrates with a toy example that the method does not converge on the true posterior distribution.
Authors: Mark A. Beaumont
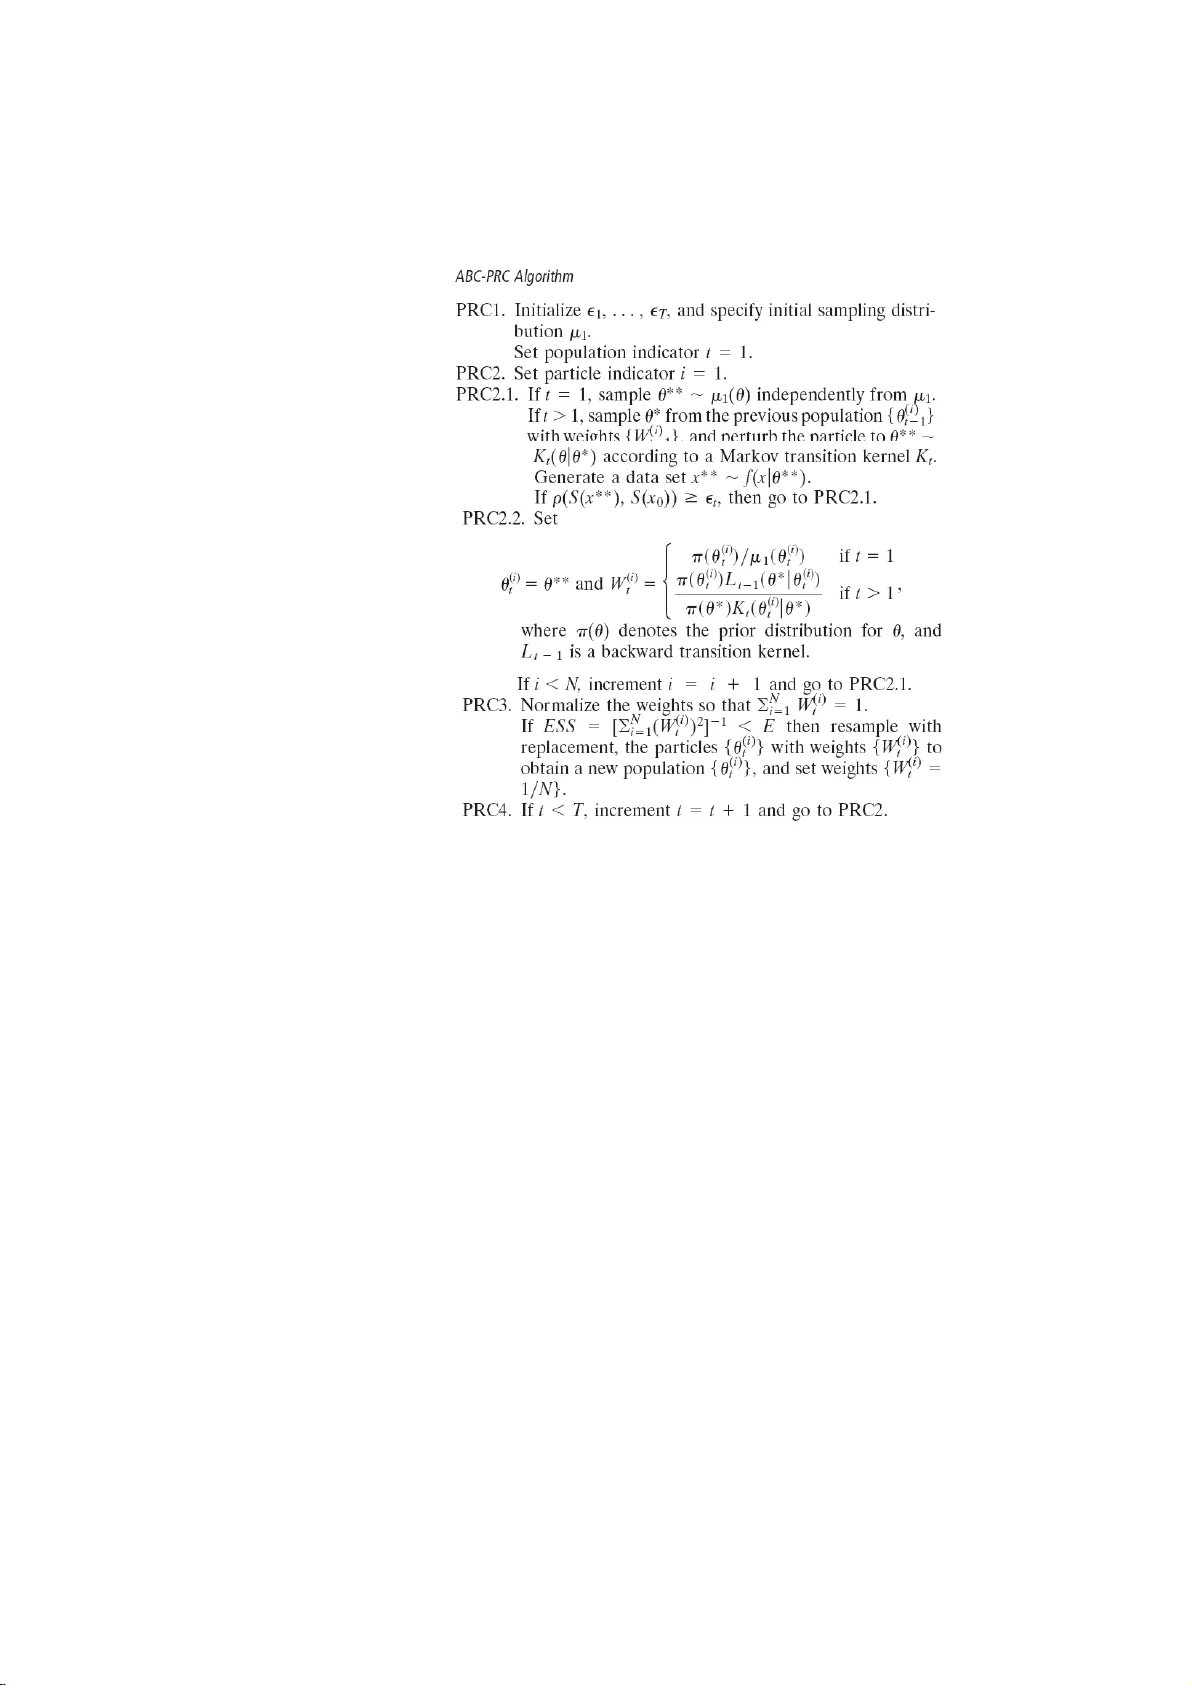
A note on the AB C-PR C algorithm of S issons et al. (2007) Mark A. Beaumont Octob er 23 , 2018 1 The AB C-PR C Algorith m A sequen tial Monte Carlo method for p erforming approximate Ba y esian Computation (“Mon te C ar lo without likelihoo ds”) has b een propo sed by Sissons, F an and T anak a (PNAS, 2007). The main algorithm that is used in their pap er is give n here in Fig- ure 1. In this algo rithm N is the n um b er of par t icles θ is a ve ctor o f parameters, the ǫ t are tolerances suc h t ha t if ρ ( S ( x ) , S ( x 0 )) ≤ ǫ the sim ulated summary statistics, S ( x ) are considered ‘near enough’ to the target summary statistics S ( x 0 ), where ρ () is some distance function. The authors state Samples { θ ( i ) T } are w eigh ted samples from the p osterior distribu tion f ( θ | ρ ( S ( x ) , X ( x 0 )) ≤ ǫ ). They also state Finally w e note that if K t ( θ t | θ t − 1 ) = L t − 1 ( θ t − 1 | θ t ), µ 1 ( θ ) = π ( θ ) and the pr ior π ( θ ) ∝ 1 o ver Θ, then all wei ghts are equal throu gh ou t the sampling pro cess and ma yb e sa fely ignored... 2 Problematic Asp ects In tuitiv ely the simplified algorithm, whic h a rises from making the assumptions in the latter statemen t ab o v e, is rather puzzling b ecause it is unclear what corrects for the fact that one is sampling fr o m a distribution that , if the transition k ernel v ariance, K t ( θ t | θ t − 1 ), is small, is pro g ressiv ely mo ving aw a y from the prior. In the algorithm giv en in Figure 1 there is the statemen t: if ρ ( S ( x ∗ ∗ ) , S ( x 0 )) ≥ ǫ i , then go to PRC 2.1 . In tuitiv ely this mak es the algo rithm sup erficially app ear a s N par a llel MCMC-ABC c hains, with the exce ption that there is resampling among the c hains at eac h iteration. Certainly if one tak es the sp ecial case of N = 1 then it lo o ks similar to the ABC-MCMC algorithm of Marjoram et al. (2003). Ho we ve r a crucial difference is that 1 Figure 1: The ABC-PR C algorithm of Sissons et al. , PNAS, 2007 in the ABC-MCMC the curren t v alue is the old v alue if the up date is not accepted, otherwise it is the new v alue, whereas in this SMC a lg orithm y ou k eep going un til you get an acceptance. So in the ABC-MCMC alg o rithm, y ou are guarantee d that if the p o in t y ou up date is alr eady from the p osterior distribution, the next p oin t will also b e from the p osterior (as giv en by the pro of, based on satisfying detailed balance, in Marjor a m et al, 2003, pa g e 15325), whereas in the SMC this is not the case. T o see this, imagine that t he k ernel chose n has a v ery small v ariance (close to 0, in fact). In the ABC-MCMC, follo wing the pro of of detailed bala nce in Marjoram et al (2003 ) , w e are guaran teed that if θ i is dra wn from the p osterior, then θ i +1 is also dra wn from the p osterior (whateve r v a r iance of the k ernel is c hosen). In the SMC, for example, imagine that one has only t wo resampling steps, and imagine that a sample is tak en with ǫ close to 0, and k ernel v ariance close to 0. The first step g iv es you (almost) the p osterior distribution , θ i ˜ p ( θ | x = x c ). The next step, since the prior is now actually the p osterior, is exactly like p erfor ming standard rejection with suc h a prio r, and giv es y ou (almost) [ p ( θ | x = x 0 )] 2 ), the square of the p osterior distribution, and so on, pro g ressiv ely . Th us, initially at least, the p osterior distribution g enerated at the i th step is an increasingly p o or estimate of [ p ( θ | x )] i ). 2 3 Examples As a toy example conside r the case of computing the p osterior distribution of t he para- metric mean, µ of a Gaussian distribution with a kno wn v ariance σ 2 , g iv en a v ector of n observ atio ns y . The prior for µ is tak en to b e Ga ussian with mean µ 0 and v ariance τ 2 . The p o sterior p ( µ | y ) is then giv en as N µ 0 τ 2 + n ∗ ¯ y σ 2 1 τ 2 + n σ 2 , 1 1 τ 2 + n σ 2 , where ¯ y is the arithmetic mean of the elemen ts of y , is a sufficien t statistic for this problem, and is used a s the only statistic for the ABC analyses describ ed here. In order to test the simplified v ersion of the ABC-PR C algorithm ab o v e ( although the argument applies also to the mo r e complicated v ersion), I let τ 2 → ∞ so that a flat improp er prior is assumed, in whic h case one obtains N ¯ y , σ 2 n . Figure 2 indicates the application of the ABC-PR C algorithm of Sissons et al. ( 2 007) to data with ¯ y = 4 . 786624 a nd n = 10 . The kno wn v aria nce, σ 2 is set at 9, and so the p osterior v ariance should b e 0.9, with p osterior mean of 4 .786624. T o appro ximate a flat uniform prio r, a uniform with b ounds (-1 5 ,15) is used for the initial sample. The ABC-PR C algorithm w as run for 100 iterations. The sc hedule of tolerances is giv en b elow: t ǫ t 1–10 10.0 11–20 5.0 21–30 2.0 31–40 1.0 41–50 0.5 51–60 0.2 61–70 0.1 71–80 0.05 81–90 0.02 91–100 0.01. The metho d conv erges smoot hly , as indicated in Figure 3, but to a v ariance tha t is to o small. The t r ue p osterior v ariance is 0.9. The p osterior v ariance to whic h the ABC-PR C metho d app ears to con verge is around 0.26. Using an ev en narro we r k ernel of 0.01 , w e can see ev en greater discrepancies, a s il- lustrated in Figures 4 and 5. In this case the p osterior v ariance to whic h the metho d con v erges is around 0 .0 94, almo st one-tenth of the correct v alue. Increasing the v ariance o f the k ernel to 1, w e see that the estimated p osterior v ariance, no w around 0.59 , b ecomes closer to the tr ue v alue of 0.9 (Figure 7 ) , and, superficially , the p osterior distribution lo oks similar to the theoretical distribution (Figure 6. 3 t=1 µ Density −15 −10 −5 0 5 10 15 0.00 t=22 µ Density −15 −10 −5 0 5 10 15 0.0 t=48 µ Density −15 −10 −5 0 5 10 15 0.0 t=74 µ Density −15 −10 −5 0 5 10 15 0.0 t=100 µ Density −15 −10 −5 0 5 10 15 0.0 Figure 2: Application of the ABC-PR C algorithm with ke rnel v ariance o f 0.1 Finally with the v ariance of the k ernel at 10, the es timated p osterior v ariance is around 0.8 4 (F igure 9), still lo w er than the theoretical v alue, and the p osterior distribution app ears v ery similar to the theoretical distribution (Figure 8). 4 Solutio n These results suggest that a go o d wa y to lo o k at t he ABC-PRC algorithm of Sisson et al. (20 07) is as a successiv e series of applications of the rejection a lg orithm to rando m v a r iables draw n from a prior distribution tha t is a con v olution of the smo othing k erneal and the realized v ariables fr om the previous rejection round. If this k ernel is lar g e relative to the p osterior distribution the metho d will app e ar to work b ecause it is similar to 4 0 20 40 60 80 100 0 5 10 15 20 25 30 iteration number estimated posterior variance Convergence of posterior variance when kernel variance is 0.1 Figure 3: Application of the ABC-PRC algorithm with k ernel v ariance of 0.1. The hori- zon tal line shows the theoretical v alue. dra wing the v ariables from a uniform prior. How ev er it can b e seen that with a low er k ernel v ariance, the p osterior distribution is badly estimated. View ed in this w ay , it is clear that the weights do matter , and the appropriate correction, at least fo r the Ga ussian k ernel used here, is t o compute the w eigh ts, W ( t ) ,i for the i th particle, from the reciprocal of the (unnormalised) k ernel densit y estimate as W ( t ) ,i = 1 P N j =0 p ( θ ( t ) ,i | θ ( t − 1) ,j , ξ 2 ) where p ( θ ( t ) ,i | θ ( t − 1) ,j , ξ 2 ) is a Gaussian with mean θ ( t − 1) ,j and v ariance o f the k ernel that is used, ξ 2 . Figures 10 and 11 sho w the results of applying this corrected ve rsion of the ABC-PR C algorithm to the example with a k ernel o f v a riance 0.01, illustrated in F ig ures 4 and 5. In t his case the estimate v a riance conv erges to around 0.88, whic h compares fa vourably with the uncorrected ABC-PR C algorithm even when a large k ernel is used. In conclusion, it w ould app ear that the ABC-PR C algorithm of Sissons et al. is wrong and should not be used. It can, ho w ev er, b e corrected by the addition of a computationally trivial w eigh ting sc heme. 5 t=1 µ Density −15 −10 −5 0 5 10 15 0.00 t=22 µ Density −15 −10 −5 0 5 10 15 0.0 t=48 µ Density −15 −10 −5 0 5 10 15 0.0 t=74 µ Density −15 −10 −5 0 5 10 15 0.0 t=100 µ Density −15 −10 −5 0 5 10 15 0.0 Figure 4: Application of the ABC-PRC algorithm with ke rnel v ariance o f 0.01 6 0 20 40 60 80 100 0 5 10 15 20 25 30 iteration number estimated posterior variance Convergence of posterior variance when kernel variance is 0.01 Figure 5: Application of the ABC-PRC algorithm with k ernel v ariance of 0.01. The horizon tal line sho ws the theoretical v a lue. 7 t=1 µ Density −15 −10 −5 0 5 10 15 0.00 t=22 µ Density −15 −10 −5 0 5 10 15 0.00 t=48 µ Density −15 −10 −5 0 5 10 15 0.0 t=74 µ Density −15 −10 −5 0 5 10 15 0.0 t=100 µ Density −15 −10 −5 0 5 10 15 0.0 Figure 6: Application of the ABC-PR C algorithm with ke rnel v ariance o f 1 8 0 20 40 60 80 100 0 5 10 15 20 25 30 iteration number estimated posterior variance Convergence of posterior variance when kernel variance is 1 Figure 7: Application of the ABC-PRC algorithm with ke rnel v aria nce of 1. The ho ri- zon tal line shows the theoretical v alue. 9 t=1 µ Density −15 −10 −5 0 5 10 15 0.00 t=22 µ Density −15 −10 −5 0 5 10 15 0.00 t=48 µ Density −15 −10 −5 0 5 10 15 0.0 t=74 µ Density −15 −10 −5 0 5 10 15 0.0 t=100 µ Density −15 −10 −5 0 5 10 15 0.0 Figure 8: Application of the ABC-PR C algor it hm with k ernel v ar iance of 10 10 0 20 40 60 80 100 0 5 10 15 20 25 30 iteration number estimated posterior variance Convergence of posterior variance when kernel variance is 10 Figure 9: Application of the ABC-PRC algorithm with kerne l v ariance of 10. The hori- zon tal line shows the theoretical v alue. 11 t=1 µ Density −15 −10 −5 0 5 10 15 0.00 t=22 µ Density −15 −10 −5 0 5 10 15 0.00 t=48 µ Density −15 −10 −5 0 5 10 15 0.0 t=74 µ Density −15 −10 −5 0 5 10 15 0.0 t=100 µ Density −15 −10 −5 0 5 10 15 0.0 Figure 1 0 : Application of the corrected ABC-PRC algor ithm with k ernel v ariance o f 0 .01. Compare with the uncorrected ve rsion in Figure 4 12 0 20 40 60 80 100 0 5 10 15 20 25 30 35 iteration number estimated posterior variance Convergence of posterior variance when kernel variance is 0.01 Figure 1 1 : Application of the corrected ABC-PRC algor ithm with k ernel v ariance o f 0 .01. The horizontal line sho ws the theoretical v alue. Compare with the uncorrected vers ion in Figure 5 13 5 App endix The R F unction for p erforming the original AB C-PR C abc.s mc1a <- function (npart,niter,unif.lo,unif.hi,y,sigma2,eps,kern.mean,kern.var) { # npart is the number of parti cles # niter is the number of smc itera tions # unif. lo is the lower limit of the uniform distribu tion # unif. hi is the upper limit of the uniform distribu tion # y is the real data - we comput e the onl y sum mary stat - the sample mean - from this # sigma 2 is the kno wn variance. # eps is the vecto r of tol erances - the euclidean distanc e must be less than this if(le ngth(eps) != niter)s top("eps is wrong lengt h") if(ni ter < 20)n score <- niter else nscor e <- 20 p.his tory <- matrix(n row=nscore,ncol=npart) pt <- roun d(seq(1, niter,le ngth=nscore)) nsamp <- lengt h(y) ymean <- mean( y) v1 <- runi f(npart, unif.lo, unif.hi) k <- 1 for(j in 1:nit er){ vx <- numeri c(0) while (T){ vv <- sample (v1,100* n part,replace=T) ssvec <- lappl y(lapply(vv,rnorm,n=nsamp,sd=sqrt(sigma2)),mean) ind <- sqrt( (as.nume r ic(ssvec) - ymea n)^2) <= eps[j] if(su m(ind) == 0)ne xt; vx <- c(vx,v v[ind]) if(le ngth(vx) >= npar t){ vx <- vx[1:n part] break ; } } if(pt [k] == j){ p.his tory[k,] <- vx; k <- k+1 } v1 <- vx + rnorm (npart,kern.mean,sqrt(kern.var)) } p.his tory } The R function for p erforming the correct ed A BC-PRC abc.s mc1a.corr ect <- funct ion(npart,niter,unif.lo,unif.hi,y,sigma2,eps,kern.mean,kern.var) { # npart is the number of parti cles # niter is the number of smc itera tions # unif. lo is the lower limit of the uniform distribu tion # unif. hi is the upper limit of the uniform distribu tion # y is the real data - we comput e the onl y sum mary stat - the sample mean - from this # sigma 2 is the kno wn variance. # eps is the vecto r of tol erance - the euclide an dist ance must be less than this if(le ngth(eps) != niter)s top("eps is wrong lengt h") if(ni ter < 20)n score <- niter else nscor e <- 20 p.his tory <- matrix(n row=nscore,ncol=npart) pt <- roun d(seq(1, niter,le ngth=nscore)) nsamp <- lengt h(y) ymean <- mean( y) v1 <- runi f(npart, unif.lo, unif.hi) wtvec <- rep(1 ,npart) k <- 1 for(j in 1:nit er){ vx <- numeri c(0) while (T){ vv <- sample (v1,100* n part,replace=T,prob=wtvec) ssvec <- lappl y(lapply(vv,rnorm,n=nsamp,sd=sqrt(sigma2)),mean) ind <- sqrt( (as.nume r ic(ssvec) - ymea n)^2) <= eps[j] if(su m(ind) == 0)ne xt; vx <- c(vx,v v[ind]) if(le ngth(vx) >= npar t){ vx <- vx[1:n part] break ; } } if(pt [k] == j){ p.his tory[k,] <- vx; k <- k+1 } v1 <- vx + rnorm (npart,kern.mean,sqrt(kern.var)) for(j j in 1: npar t)wtvec[j j] <- 1.0/su m(dnorm(v1[jj], v x,sqrt(kern.var))) } p.his tory } 14
Original Paper
Loading high-quality paper...
Comments & Academic Discussion
Loading comments...
Leave a Comment