Kernels and Ensembles: Perspectives on Statistical Learning
Since their emergence in the 1990's, the support vector machine and the AdaBoost algorithm have spawned a wave of research in statistical machine learning. Much of this new research falls into one of two broad categories: kernel methods and ensemble …
Authors: ** - **Zhu, H.** (주 저자) – 논문 본문에서 “Zhu et al. 2006” 등으로 표기. - **Chipman, H.** – Parallel‑Universe Evolution 공동 개발자. **
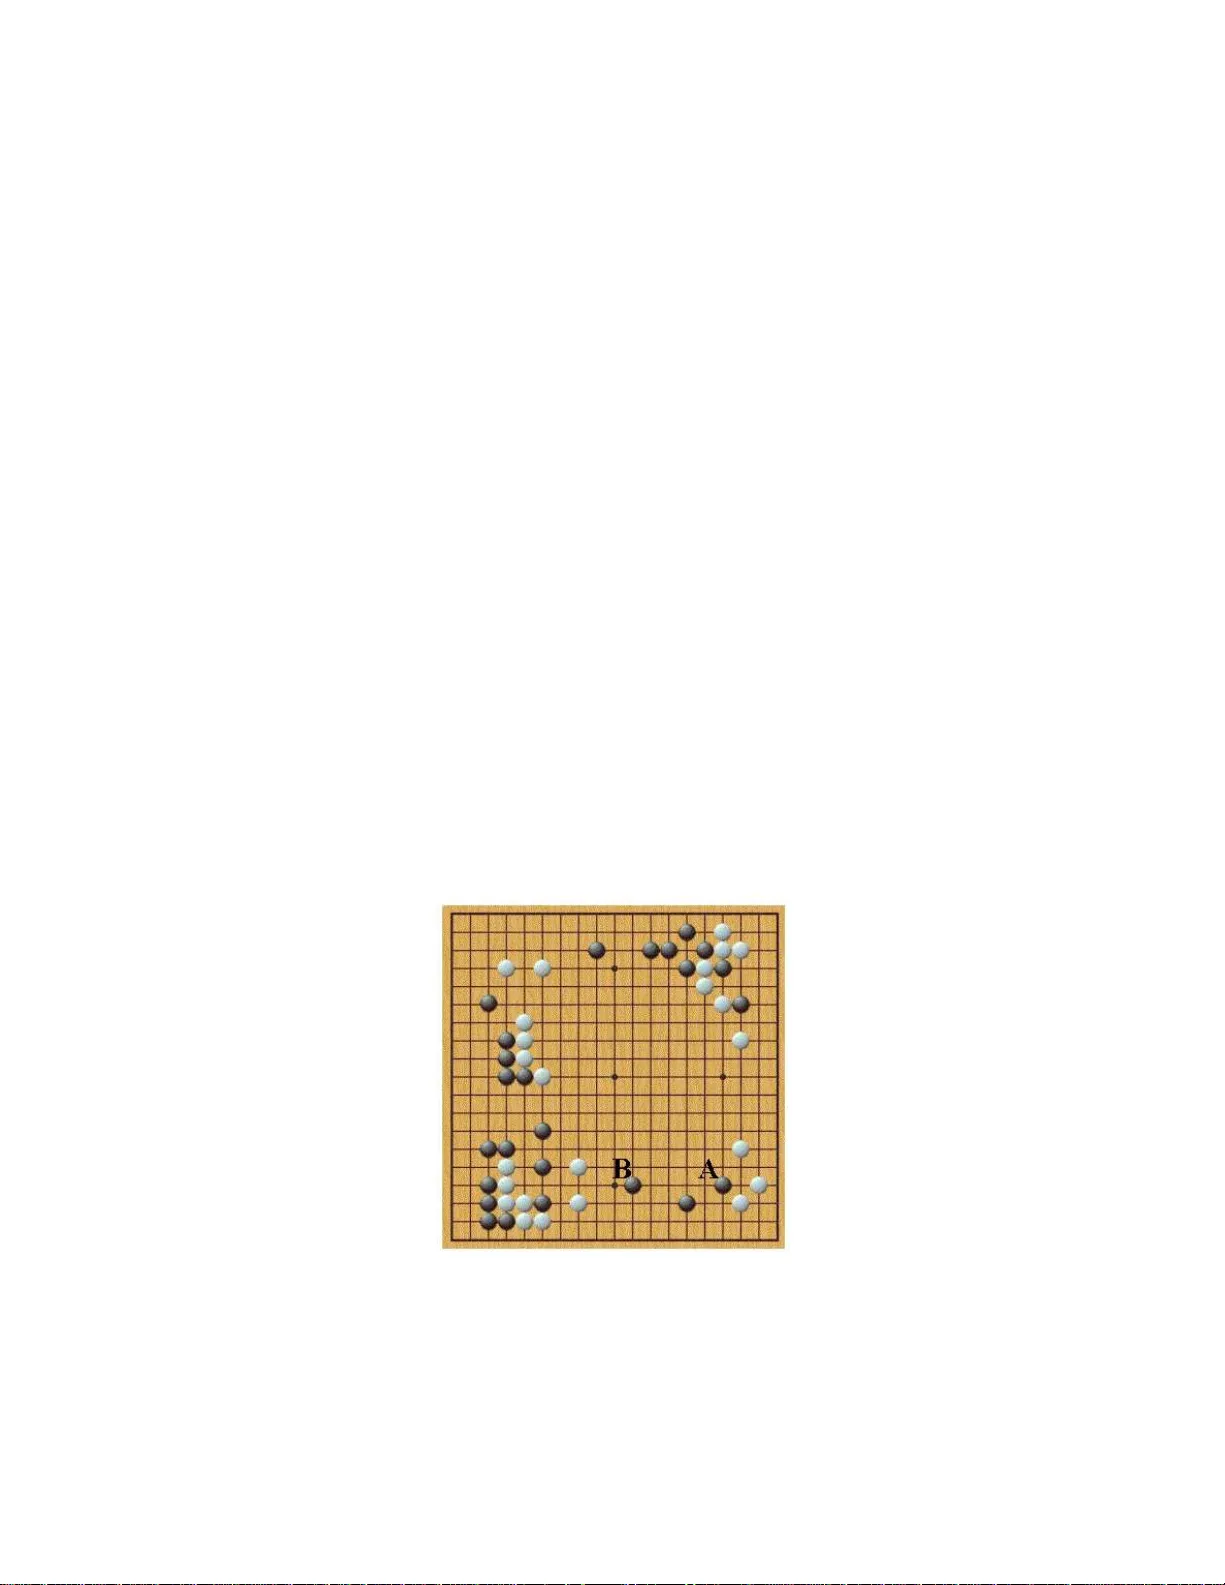
Kernels and Ensem bles: P ersp ectiv es on Statistical Learning Mu Zh u, PhD Univ ersit y of W aterlo o W aterlo o, On tario, Canada N2L 3 G1 Octob er 25, 2018 Abstract Since their emergence in the 1990’s, the supp ort vector mac hine and the AdaBoost algorithm ha ve spa wned a w av e of r esearc h in stati stical machine l earning. Muc h of this new researc h falls into one of tw o broad catego ries: kernel metho d s and ensemble metho ds. In this exp ository article, I discuss the main ideas b ehind these t w o t yp es of methods, namely how to transform linear algorithms in t o nonlinear ones by using kernel functions, and how to make p redictions with an ensemble or a collection of mod els rather than a single mo del. I also share my personal persp ectives on how these ideas have influenced and shaped my ow n researc h . In particular, I present tw o recent algori thms that I h av e inven ted with my collab orators: LAGO, a fast kernel algo rithm for unbalanced class ification and rare target detection; and Darwinian evolution in parallel un iverses, an ensem b le metho d for v ariable selection. Key W ords : AdaBoost; kernel PCA; LAGO; parallel evolution; random forest; SVM. 1 In tro duction The 1990 ’s sa w t wo ma jor adv ances in machine learning: the supp ort vector machine (SVM) and the AdaBo ost algo r ithm. Two fundamental ideas behind these alg orithms a re esp ecially far -reaching. The first o ne is that we c an transfo rm many class ical linear algorithms into highly flexible nonlinea r algorithms b y using kernel functions. The se c o nd one is that we ca n make accurate predictions by building a n ensemble of mo dels without muc h fine-tuning for each, ra ther than ca refully fine-tuning a single mo del. In this ex po sitory article, I first present the main ideas b ehind kernel metho ds (Section 2) and ensemble metho ds (Section 3 ) by review ing fo ur pro totypical algo r ithms: the supp or t vector ma- chine (SVM, e.g., Cristianini and Shaw e-T aylor 2000), kernel princ ipa l compo nent a na lysis (kPCA, Sch¨ olkopf et al. 1 998), AdaBo ost (F r eund and Sch apire 1996 ), and ra ndom forest (Breiman 2001 ). I then illustrate the influence of these idea s on my own research (Section 4) by highlighting t wo recent alg o rithms that I have in ven ted with my colla b o rators : LAGO (Zh u et al. 2 0 06), a fast kernel machine for ra re tar get detection; and Dar winian ev olution in parallel universes (Zhu and Chipman 2006), an ensemble metho d for v ariable selection. T o b etter focus o n the main ideas and not be distracted by the tec hnica lities, I sha ll limit myself mostly to the tw o-c la ss classification proble m, although the SVM, AdaBo ost a nd rando m forest can 1 all deal with mult i-class cla ssification and regression problems a s well. T echnical details that do not affect the understanding of the main ideas ar e a lso omitted. 2 Kernels I b egin with kernel metho ds. E ven though the idea of kernels is fair ly old, it is the supp or t vector machine (SVM) that ig nited a new w av e of resea rch in this area ov er the past 10 to 15 years. 2.1 SVM In a t wo-class classification problem, we have predictor vectors x i ∈ R d and class lab els y i ∈ {− 1 , +1 } , i = 1 , 2 , ..., n . SVM see ks an optimal h yp e r plane to separ a te the tw o classes. A h y p er plane in R d consists of all x ∈ R d that satisfy the linear equation: f ( x ) = β T x + β 0 = 0 . Given x i ∈ R d and y i ∈ {− 1 , +1 } , a hyperpla ne is called a separating hyper plane if ther e exists c > 0 such that y i ( β T x i + β 0 ) ≥ c ∀ i = 1 , 2 , ..., n. (1) Clearly , a hyper plane can be reparameter ized by scaling, e.g., β T x + β 0 = 0 is equiv a lent to s ( β T x + β 0 ) = 0 for any sca lar s . In particular , w e can scale the h yp erplane so that (1) b ecomes y i ( β T x i + β 0 ) ≥ 1 ∀ i = 1 , 2 , ..., n, (2) that is, sca led so that c = 1. A separ ating hyperplane s atisfying condition (2) is ca lled a c anonic al separating hyperplane (CSHP). If tw o class e s are p erfectly separable, then there exist an infinite num b er of s e pa rating h yp er- planes. Figure 1 shows tw o c omp eting hyperpla nes in such a situation. The SVM is based on the notion that the “best” ca nonical separ a ting hype rplane to sepa rate tw o cla sses is the one that is the farthest aw ay from the tra ining p o ints. This no tio n is formalized mathematically by the mar gin of a hyperplane — h yp erplanes with larger margins are better. In pa rticular, the margin of a hyper plane is equal to margin = 2 × min { y i d i , i = 1 , 2 , ..., n } , where d i is the sig ned distance b etw een observ a tion x i and the hyperplane; se e Figure 1 fo r an illustration. Figure 1 a ls o shows to a certain extent wh y la rge marg ins are go o d o n an in tuitive level; there is also an elab ora te s e t of theories to justify this (see, e.g., V apnik 1995). It can be shown (e.g., Hastie et al. 200 1 , Sec tio n 4.5) that d i is equal to d i = 1 k β k ( β T x i + β 0 ) . (3) Then, equations (2) and (3) toge ther imply that the mar gin of a CSHP is equal to margin = 2 × min { y i d i } = 2 k β k . 2 Margin (Worse) Margin (Better) Figure 1: Tw o separating h ype rplanes, one with a lar ger ma rgin than the other. T o find the “ b est” CSHP with the la rgest mar g in, we a re interested in solving the following opti- mization problem: min 1 2 k β k 2 + γ n X i =1 ξ i (4) sub ject to y i ( β T x i + β 0 ) ≥ 1 − ξ i and ξ i ≥ 0 ∀ i. (5) The extra v ariables ξ i are in tro duced to relax the separa bilit y condition (2) becaus e , in g eneral, w e can’t ass ume the t wo clas ses are always pe rfectly separ able. The term γ P ξ i acts as a pena lty to control the degr ee of suc h relaxa tio n, a nd γ is a tuning par ameter. The main message from the brief intro duction ab ov e is this: SVM tries to find the bes t CSHP; it is therefore a linea r c la ssifier. The usual immediate resp onse to this mes sage is: So what? Ho w do es this make the SVM muc h differen t from and sup erior to clas s ical logistic regressio n? Equiv alently , the c onstrained optimizatio n problem ab ov e can be written as (e.g., Has tie et al. 2001, Exercis e 12.1) min n X i =1 h 1 − y i ( β T x i + β 0 ) i + + λ k β k 2 , (6) where [ z ] + = ( z if z > 0 , 0 if z ≤ 0 . F or statisticians, the ob jectiv e function in (6) has the familiar for m of a loss function plus a p enalty term. F or the SVM, the loss function is [1 − y ( β T x + β 0 )] + , and it is indeed very similar to the binomial log-likelihoo d used by log istic regr ession (e.g., Has tie et al. 200 1 , Fig ur e 12.4 ). But the usual logis tic regres sion mo del do es not include the pena lt y term λ k β k 2 . This is the familiar ridge 3 pena lty and often stabilize s the so lution, esp ecially in high-dimensio nal problems. Indeed, this g ives the SVM an adv antage. How ever, one can’t p ossibly exp ect a linear classifier to succeed in general situations, no matter how optimal the hyperpla ne is. So, why is the SVM suc h a sensationa l success? 2.2 The “k ernel trick” Cristianini and Shaw e-T aylor (20 00, Chapters 5 and 6 ) provided detailed deriv ations to show that the optimal β lo oks like this: β = X i ∈ S V α i y i x i , where “SV” denotes the set o f “suppo rt vectors” with α i > 0 strictly p o sitive; the co efficients α i , i = 1 , 2 , ..., n , are solutions to the (dual) problem: max n X i =1 α i − 1 2 n X i =1 n X j =1 α i α j y i y j x T i x j (7) s.t. n X i =1 α i y i = 0 and α i ≥ 0 ∀ i. (8) This means the resulting hyperpla ne can be wr itten a s f ( x ) = β T x + β 0 = X i ∈ S V α i y i x T i x + β 0 = 0 . (9) The key p o int here is the following: In order to obtain α i , one s olves (7)-(8), a problem tha t depe nds o n the pr edictors x i only thro ug h their inner -pro ducts x T i x j ; once the α i ’s a re o btained, the ultimate decision function (9) is a ls o just a function of inner-pro ducts in the predicto r space. Therefore, o ne ca n make SVM a lot mor e general s imply by defining a “different kind of inner- pro duct,” say , K h ( u ; v ), in place of u T v . The function K h ( u ; v ) is a ca lled a kernel function, where h is a hyper -parameter , which is often deter mined empirically b y cross- v alidation. Then, (7) becomes max n X i =1 α i − 1 2 n X i =1 n X j =1 α i α j y i y j K h ( x i ; x j ) (10) and the decision function (9) b ecomes f ( x ) = X i ∈ S V α i y i K h ( x ; x i ) + β 0 = 0 . (11) The b oundary is linear in the space of φ ( x ) where φ ( · ) is such that K h ( u ; v ) = φ ( u ) T φ ( v ) , but gener ally it is nonlinear in the original predic to r space (unless one pic ks a linear kernel function). Mercer’s theore m (Mercer 1909) guara ntees the e x istence of such φ ( · ) as long as K h is a non-nega tive definite kernel function. The b ea ut y here is that we don’t even need to define the mapping φ ( · ) explicitly; all we hav e to do is to pic k a k e r nel function K h ( u ; v ). This makes the SVM very genera l. 4 2.3 Kernelization of linear algorithms That w e can apply a linear metho d in a different space is, of course, not a new idea to statisticians at all. F or example, we all know how to fit a high-order poly nomial using linear regressio n — s imply add the terms x 2 , x 3 , ..., x d to the regress io n equation! The idea that we don’t need to explicitly cr eate these high- o rder ter ms is p erhaps somewhat less familiar. Actually , it is not r eally a new idea, either; it is les s familiar only in the sense that students usually don’t learn ab out it in “Regr ession Ana ly sis 101.” How ever, the SVM do es deserve some credit in this rega rd. Even though the basic idea of kernels is fair ly old, it is the SVM that has revived it and brought it back into the s p o tlight for applied statisticians. The basic idea is as follows. A t ypic a l data matrix w e encounter in statistics, X , is n × d , stacking n obse r v ations x 1 , x 2 , ..., x n ∈ R d as d -dimensional row v ectors. That is, X = x T 1 x T 2 . . . x T n . It is easy to see that XX T = x T 1 x T 2 . . . x T n ( x 1 x 2 . . . x n ) = x T 1 x 1 x T 1 x 2 . . . x T 1 x n x T 2 x 1 x T 2 x 2 . . . x T 2 x n . . . . . . . . . . . . x T n x 1 x T n x 2 . . . x T n x n is an n × n matr ix of pair wise inner-pr o ducts. Therefore, if a linear a lgorithm can b e shown to depe nd on the data matrix X only through K ≡ XX T , (12) then it can b e ea sily “kernelized” — we simply replace ea ch inner-pro duct entry of K with K ij = K h ( x i , x j ), where K h ( · , · ) is a des ired kernel function. 2.4 Kernel PCA Kernel principal comp onent analysis (kPCA; Sch¨ olkopf et al. 199 8) is a successful example of “ker- nelizing” a well-known classic linear a lgorithm. T o fo cus on the main idea, let us assume that the data matrix X is already centered so that ea ch column has mean zero . Let S = X T X . (13) Then, the (order ed) eigenv ectors of S , say u 1 , u 2 , ..., u d , a r e the principal co mpo nents. Being eigen- vectors, they sa tisfy the equations Su j = λ j u j , j = 1 , 2 , ..., d. (14) Equations (13) and (14) together lead to X T Xu j = λ j u j , j = 1 , 2 , ..., d. (15) 5 This shows that u j can b e represented in the form of X T α j — by letting α j = Xu j /λ j , to b e sp ecific. W e will plug u j = X T α j int o (15) a nd repa rameterize the eige nv alue problem in ter ms of α j . F or j = 1 , 2 , ..., d , this leads to X T XX T α j = λ j X T α j . (16) If we left-multiply bo th sides b y X , we get XX T XX T α j = λ j XX T α j , or simply K 2 α j = λ j K α j , (17) which shows that α j can b e obtained b y solving a pr oblem that dep ends o n the data matrix only through the inner-pro duct matr ix K . Sch¨ olkopf et al. (1998 ) explained why , in the co ntext of k P CA, it is sufficient to reduce (17) to K α j = λ j α j ; I do not go in to this detail here. Once w e o btain the α j ’s, suppo se w e’d like to pro ject new data X new onto a few leading principa l compo nents, e.g., X new u j . W e immediately find that X new u j = X new X T α j , and it is easily se e n that X new X T is just a matrix of pairwise inner pro ducts betw een each new and old observ ations . Hence, it b ecomes cle a r that b oth finding and pro jecting onto principa l comp onents depend on just the inner- pro ducts and, according to Section 2.3 , P CA can b e “kernelized” ea sily . Figure 2 shows a toy exa mple. There ar e some spherical data in R 2 . The data b eing spherica l, all directions hav e equa l v aria nce and ther e a re no meaningful principal co mpo nents in the tr aditional s e nse. But by using a Gaussian kernel — equation (18) b elow w ith h = 1 — in place of all the inner-pro ducts, the first kernel principa l direction obtained g ives a meaningful order of how far each obse r v ation is aw ay fr om the origin. In this case, kernel PCA has success fully discov ered the (only) under lying pattern in the data, one that is imp ossible to detect with cla ssical PCA. 2.5 Discussion: Kernel metho ds are lik e professional cameras An y acute reader must hav e no tice d that, so far , I hav e never really discuss e d the kernel function K h ( u ; v ) explicitly . This is not an accident. It is o ften claimed that one impo rtant adv a ntage of these kernel metho ds lie s in their mo dular ity: to so lve a differ e nt problem, just use a differ e n t kernel function. An y discussion ab out kernel functions, therefore, is b est car ried out in the co nt ext of a sp ecific problem. Of cours e, to b e effective in practice, we must use the r ight kernel function. What’s more , we m ust cho ose the right h yp er -parameter h as well, and the p erfor mance of the metho d can b e quite sensitive to thes e choices in practice. Thes e are no tr ivial tasks and often require a considera ble amount of data ana lytic expe r ience as well as knowledge o f the sp ecific applicatio n area. In this rega r d, thes e kernel-based algorithms are very muc h like pro fessional camera s. They a re capable of pro ducing great pictures even under very difficult conditions, but y ou need to give them to a profess ional photogr apher. If you give them to an ama teur or novice, you ca n’t ex pec t gr eat pictures. The photogra pher must know how to select the righ t lens, set the right shutter sp eed, and 6 −3 −2 −1 0 1 2 3 −2 −1 0 1 2 3 (a) Original Data x 1 x 2 −0.4 −0.2 0.0 0.2 0.4 −0.6 −0.4 −0.2 0.0 0.2 0.4 0.6 (b) kPCA Projection kPC1 kPC2 Figure 2: Kernel P CA, toy exa mple. (a) Or iginal data . (b) Pro jection onto the first tw o kernel principal comp onents. use the right ap erture for any given condition. If any o f these pa rameters is not set appropriately , the result could be a disa ster. But that does not mean the camera itself is a po o r piece of equipment; it simply means one must b e adequa tely tr ained to op erate it. Much o f the p ower of these profess ional cameras lies pr ecisely in the fact that they a llow a k nowledgeable and exp erienced user to control exactly how each single picture should be taken. 2.5.1 Example: Spam data As a very s imple illustratio n, let us try to see how well the SVM can pre dic t o n the spam da ta set, av ailable a t ht tp://w ww- stat. stanford.edu/ ~ tibs/E lemSt atLea rn/index.html . There are a total o f n = 4 , 601 obser v ations, ea ch with a binary res p o nse and d = 5 7 predictors. F o r more details about this data set, refer to the afo rementioned web site. I use an R pack a ge ca lled e107 1 to fit SVMs and use the kernel function K h ( u ; v ) = exp − h k u − v k 2 . (18) A ra ndom sample of 1 , 5 3 6 obs erv ations ar e used as training data and the remaining 3 , 065 observ a tio ns a re used a s test data. Using different v alues of γ and h , a ser ies of SVMs a re fitted on the training da ta a nd then a pplied to the test data. The total n um b er of mis c la ssification errors on the test data are r ecorded and plo tted for each pair of ( γ , h ); see Figur e 3(a). Here , γ is the penalty parameter in equation (4). Figure 3(a) shows that the p erfor ma nce of SVM using this particula r k ernel function is very sensitive to the parameter h but not as sensitive to the par ameter γ . Given h , the prediction per formance of SVM is often quite sta ble fo r a wide range o f γ ’s, but bad choices of h can lead to serious deterioratio ns in the prediction p erforma nce. Therefore, if o ne uses the SVM without carefully tuning the para meter h , the r esult can b e disastro us. 7 (a) Mistakes on Test Set: SVM γ h 1e−07 1e−06 1e−05 1e−04 0.001 0.01 0.1 1 100 1000 5000 50000 1e+06 1e+07 (b) Mistakes on Test Set: Random Forest m B 10 25 50 100 300 1000 5000 50000 2 5 10 15 20 30 Figure 3 : Spam data exa mple. (a) SVM: Number of misclassification err ors on test data as a function o f tw o tuning parameters, γ and h (see Section 2 .5.1). (b) Random forest: Number of misclassificatio n erro rs on test data as a function of tw o tuning parameters , m and B (see Sectio n 3.5.1). 3 Ensem bles I now turn to ensem ble metho ds. Ag a in, I shall mainly fo cus on the tw o-class c la ssification pro blem with predictor vectors x i ∈ R d and class lab els y i ∈ {− 1 , +1 } , i = 1 , 2 , ..., n . 3.1 AdaBo ost AdaBo ost co nstructs a collection o f cla ssifiers ra ther than one sing le class ifier . The e n tire collection makes up a n ensemble, and it is the ensemble — no t any single classifier a lone — that makes the final classification. T able 1 contains an exac t descr iption of the AdaBo ost algo rithm. Here is a description of the algorithm in pla in English: Sta r t by assigning equal weigh ts to all obs erv ations in the tra ining data. Sequentially build a series of cla ssifiers. At each step, fit a classifier , say f b , to the training data using the current weigh ts. Calculate the (prop erly weigh ted) rig ht -to-wro ng ratio of this classifier; call it R b . F o r those obs e r v ations incorrectly classified by f b , inflate their weigh ts by a factor of R b . With the new weigh ts, build the next classifier . In the end, ea ch classifie r f b in the ensemble will cast a vote; its vote is to be weighted by the lo garithm of its right-to-wrong ra tio , log( R b ). F or p eo ple hearing a b out this algor ithm fo r the very first time, AdaBo o st certainly ha s a very strong m ys tica l flav or to it. Int uitively , w e can per haps appr eciate to some extent that the r ight-to- wrong ratio must b e imp or tant for a ny classifier, but it is not at a ll clear why we sho uld reweigh t incorrectly classified observ ations b y this r atio e ach time, no r is it immediately clear why the final vote fr om ea ch individual member of the ensemble should be weight ed by the logar ithm of this ratio. This is no eas y mystery to untangle. F riedman et al. (2000) gave a very nice argument and revealed that the AdaB o ost alg o rithm a ctually minimizes a n expo nential loss function using a for- 8 T able 1: The AdaBo os t Algorithm. 1. Initial w eights: w i = 1 /n, ∀ i . 2. F or b = 1 t o B : (a) Using weigh ts w i , i = 1 , 2 , ..., n , fit a classi fier f b ( x ) ∈ {− 1 , +1 } . (b) Set ǫ b = P n i =1 w i I ( y i 6 = f b ( x i )) P n i =1 w i , R b = 1 − ǫ b ǫ b , a b = log( R b ) . (c) Up date weigh ts: w i ← w i × R b if y i 6 = f b ( x i ). End F or. 3. Outp ut an ensemble classifier F ( x ) = sign B X b =1 a b f b ( x ) ! . ward stagewis e a pproach. In particular, AdaBo ost c ho oses the bes t a b and f b one step at a time to minimize n X i =1 exp − y i B X b =1 a b f b ( x i ) ! , which they showed to b e very similar to maximizing the bino mia l lo g -likelihoo d. This par ticular int erpretatio n has not only un tangled the AdaBo ost m y stery (at le a st to some extent), but a lso led to man y new (and sometimes b etter) versions of bo o sting algorithms. 3.2 Random forest Professo r Leo B r eiman came up with the same ba sic idea of using a collection or an ensem ble of mo dels to make predictions, except he co nstructed his ensemble in a slightly different manner. Breiman called his ensembles r andom for ests ; details are given in T able 2. The histo ry b ehind Br eiman’s r andom forest is very interesting. In 19 9 6, he first prop o sed an ensemble algorithm ca lled Ba gging (Breima n 19 96), which is essentially the r andom forest algo rithm with just the b o otstra p step (T able 2, step 1 a). In 2 001, he added the random subset step (T a ble 2, step 1b) and created rando m for est (Breiman 2001). Wh y did he add the extra random subset step? 3.3 Breiman’s theorem Breiman (20 01) proved a r e ma rk able theore tica l result. Firs t, he ga ve a formal definition of random forests: The set { f ( x ; θ b ) : θ b iid ∼ P θ , b = 1 , 2 , ...B } is called a random forest. This definition requires some explanation. Here, f ( x ; θ b ) is a classifier co mpletely parameter ized by θ b . F o r exa mple, if f ( · ; θ b ) is a classificatio n tree, then the par ameter θ b sp ecifies all the splits 9 T able 2: Breiman’s Random F o rest Algorithm. 1. F or eac h b = 1 to B , fit a maximal-depth tree, f b ( x ), as follo ws: (a) (Bootstrap Step) Draw a b ootstrap sample of the training data; call it D ∗ b . Use D ∗ b to fit f b . (b) (Random Subset Step) When bu ilding f b , randomly select a subset of m < d predictors b efore making each split — call it S , and make th e best split ov er the set S rather than ov er all possible predictors. End F or. 2. Outp ut an ensem ble classifier, i.e., to classif y x new , simply take ma jority vote o ver { f b ( x new ) , b = 1 , 2 , ..., B } . and the estimates in the terminal no des. Next, the statement “ θ b iid ∼ P θ ” means that each f ( · ; θ b ) is generated independently and identically fr om some underlying rando m mechanism, P θ . T o b e spec ific , in Breima n’s implemen tation, iid s ampling from the rando m mechanism P θ con- sists of: (i) iid sampling from the empirical distribution F n (the bo otstrap s tep), and (ii) iid sampling from the set { 1 , 2 , ..., d } (the random subset step). Breiman then prov ed that the prediction er ror of a random forest, ǫ RF , satisfies the inequality ǫ RF ≤ ¯ ρ 1 − s 2 s 2 , (19) where ¯ ρ is the mean corr elation b etw een a ny tw o members of the forest (ens e mble) and s , the mean strength of a typical member of the forest (ensemble). This res ult — including the exact definitions of ¯ ρ and s — is fairly technical; details can b e found in Breima n (2001 ). Mor eov e r, the actual bo und itself is often useless. F or exa mple, if s = 0 . 4 and ¯ ρ = 0 . 5, then one gets ǫ RF ≤ ¯ ρ 1 − s 2 s 2 = 0 . 5 1 − 0 . 4 2 0 . 4 2 = 2 . 625 , but of course the error rate is less than 100 %. So, wh y is this result significant? 3.4 The secret of ensem bles The fundamental idea of using an ensemble classifier rather than a sing le classifier is nothing shor t of being r evolutionary . It also is remark able that building these ensemb les is often r elatively mindless. T ake Breiman’s random forest, for example. Ther e is no need to prune the individual trees . Clearly , ther e are many different wa ys to build an ensemble, AdaBo o st and Breiman’s ra ndom forest b e ing tw o primar y examples. What’s the mos t effective w ay? Recall the formal definition of ra ndo m forests. The random mechanism P θ that genera tes the individual mem b er s of the forest is unspecified. Y ou are free to pick any mechanism you w a nt. Surely so me mechanisms ar e b ound to be more effective than others. What’s the mo st effective mechanism? 10 Breiman’s result is significant b ecause it tells us what makes a go o d random for est. Breiman’s theorem (19 ) tells us that a go o d r a ndom forest s ho uld hav e a small ¯ ρ and a large s . That is, we should try to reduce the corr elation b etw e e n individual classifiers within the ensemble and make each individual c la ssifier as accurate as po ssible. This explains why Bre ima n added the random subset step int o his or iginal Bagging algorithm: extra rando mness is needed to reduce the corr elation betw een individual trees; the bo o tstrap step alone is not enough! Int erestingly , we can see that AdaBo ost actually op era tes in a s imilar w ay . Going back to step (2b) in T a ble 1, w e hav e ǫ b = P n i =1 w i I ( y i 6 = f b ( x i )) P n i =1 w i . F ro m this, we can write ǫ b X all w i = X wr o ng w i and (1 − ǫ b ) X all w i = X r ight w i , where “all” means i = 1 , 2 , ..., n ; “ wrong” denotes the set { i : y i 6 = f b ( x i ) } and “r ight,” the set { i : y i = f b ( x i ) } . Step (2c) in T able 1 gives the explicit upda te rule; the new weigh ts a re: w new i = ( w i × 1 − ǫ b ǫ b , f or i ∈ wr ong; w i , for i ∈ rig ht . Therefore, we ca n see that X wr o ng w new i = 1 − ǫ b ǫ b X wr o ng w i = (1 − ǫ b ) X all w i = X r ight w i = X r ight w new i , which means the misclass ific a tion e r ror of f b under the new weigh ts w new i is exactly 50% — the worst p ossible er ror. The next classifier, f b +1 , is built using these new weigh ts, s o it is set up to work with a (weight ed) dataset that the curr ent cla s sifier, f b , ca nnot classify . This is sometimes r eferred to as “ decoupling” in the b o osting literature — the cla ssifier f b +1 is decoupled from f b . In Br eiman’s lang uage, we can say tha t the a da ptive and hitherto m ysterious reweigh ting mec h- anism in AdaB o ost is actually aiming to reduce the correla tion b etw een consecutive members of the ensemble. 3.5 Discussion: Ensem ble methods are lik e fo olpro of cameras Compared with kernel metho ds, ensemble methods a re very muc h lik e fo olpro of camer as. The y are r elatively easy for the less exp erie nced use rs to op erate. This do es not mean they don’t hav e any tuning para meters; they do . Even when using a fo olpro of camer a, one m ust still make a few decisions, e.g., whether or not to turn on the flash, and so o n. B ut r elatively s pe aking, the num b er of decis io ns one has to make is muc h more limited and these decisio ns a re als o relatively easy to make. F or e xample, in Breiman’s random for est, the size of the s ubset, m (T able 2, step 1b), is a n impo rtant tuning par a meter. If m is to o large, it will cause ¯ ρ to b e to o lar ge. In the extreme case of m = d , a ll the trees in the for est will b e sea rching ov er the en tire set of v ariables in order to make 11 splits, and they will be identical — since the tree- growing algorithm is deterministic conditional on the data. On the other hand, if m is too s ma ll, it will ca use s to b e to o small. In the extreme ca se of m = 1, all the trees will essentially b e making random splits, and they will not b e very go o d classifiers . There is plent y of empirical evidence to sugg est, howev er , that the parameter m is still relatively ea sy to choose in pra ctice. Mo reov er, the parameter m is not as sensitive as the complexity parameter h o f a kernel function (also see Section 3.5.1 be low). T ranslation: Even if you are a bit off, the consequences will not b e quite so disastr ous. I hav e had many o ccas ions working with g raduate students trying to make predictions using the SVM and Br eiman’s rando m forest. They almost always pro duce muc h b etter pr edictions with the random for est, even on problems that are well-suited for the SVM! Sometimes, their SVMs a c tually per form w orse than linear lo gistic regression. Certainly , there ar e ma ny cases in practice wher e o ne would not e x pe c t the SVM to b e muc h sup erior to linea r logistic regr ession, e.g., when the true decision b ounda r y is in fact linear . But if us e d co r rectly , the SVM should a t lea st b e comparable with line a r logistic r egressio n; there is no rea son why it ever would b e muc h w orse. These expe riences remind me ov er and over a gain just how difficult it ca n b e for a novice to use the SVM. But, as I stated in Section 2 .5, you ca n’t blame the profess ional camera if you don’t know how to use it pro p erly . Ther e is always a tradeo ff. With limited flexibilit y , even a fully-ex p er ienced pro- fessional pho tographer won’t be able to pro duce imag es of the highest pro fessional quality w ith just a fo o lpro of camera, esp ecia lly under nonstanda rd and difficult conditions. Tha t’s why profess ional cameras ar e still o n the market . But we hav e to a dmit: most co ns umers are amateur photographer s and, more o ften than not, they are taking pictures under fairly s tandard co nditions. That’s why the demand for foolpr o of camer as far exceeds tha t for professio nal cameras. I think the demand for statistical to ols follows a s imila r pattern. 3.5.1 Example: Spam data (con tin ued) As a simple illustration, let us take a lo ok at how w ell the random forest can predict on the spam data set. I use exa ctly the same set-up as in Section 2 .5.1 and the ran domFo rest pack age in R . Using different v alues o f m a nd B , a ser ies of random forests are fitted on the tr aining data and then a pplied to the test data. The total num b er of mis c la ssification er rors on the test data are recorded and plotted; see Figure 3(b). Here, we can se e that the p erfor mance o f ra ndo m fore s ts is more sensitive to the parameter m than to the parameter B . Given m , the prediction p erforma nce of random forests is fairly stable as long as B is sufficiently large, e.g., B > 10 0 in this case. But it is impor tant to use a n m that is neither to o small nor to o big, e.g., 3 < m < 1 0 in this cas e . How ever, if we compare panels (a) and (b) in Figure 3, w e can see that choosing the r ight h for SVM is m uch more critical than choosing the right m for ra ndom forest; perfor mance deterioratio n is m uch mor e serious for bad c hoices of h than for bad choices o f m . It is also clear from Figur e 3 that, for this particular data set, an SVM with k ernel function (18) is no t comp etitive aga inst a rando m forest, ev en if well tuned. In o rder to b e comp etitive, it is necessary to use a differen t kernel function. I do no t pursue this poss ibility here b ecause ge tting the SVM to work for this data set is far from the main p oint of our discuss ion, but this example do es demonstrate tha t choo sing the r ight kernel function K h and picking the r ight hyper parameter h are very imp or tant, and that an ensemble metho d such a s the ra ndo m forest can be somewhat easie r to use in this regar d. 12 4 P ersp ectiv es I now share a few p ersona l pers pec tives on sta tistical learning resea rch. Here, I a m working with a particular definition of the word “p ersp ective” from the American Heritage Dictionary: a subje ctive ev aluation of rela tive significance [emphasis added]. 4.1 Statistical learning researc h My discussio ns in Sections 2 .5 and 3.5 have led me to ask the follo wing question: If I were the presi- dent of a big camer a manufacturing co mpany , how would I r un such a business? Other than standard business divisions such as acc ounting and human resources, I see three main lines of oper ation: 1. (Consulting and Co ns umer Outreach) Advise and teach photographer s how to use v a r ious pro ducts and how to use the righ t equipment to produce great pictures under v arious difficult conditions. This is m y consulting and consumer outrea ch division. 2. (High-end R&D) Understand the nee d o f pro fessional pho tographer s and manufacture new , sp ecialized equipment still la cking on the market. This is m y R&D division for my high-end consumers. 3. (Mass R&D) Build the next-generatio n fo olpro o f camera. This is my R&D divis ion fo r my mass consumers. I see a grea t deal of parallelis m in statistical learning resear ch. F or statistical lea rning resear ch, the consulting a nd co nsumer outreach divisio n a pplies differe nt learning metho ds to solve v arious difficult rea l-world problems; the high-end R&D divis ion develops new, sp ecialized algorithms for analyzing new types of data or data with s pe c ia l ch arac teristics; and the mass R& D divisio n develops better off-the-shelf learning algo rithms. With this particular po int of view in mind, I end this article b y briefly describing tw o p er sonal learning pro ducts: a new kernel metho d from my high-end R&D division, and a new ensem ble metho d from m y mass R&D division. 4.2 A high-en d R&D pro duct: LAGO Consider a tw o-class pr oblem in which the class o f interest ( C 1 ) is very r are; most observ ations belo ng to a ma jority , background class ( C 0 ). Giv en a s et of unlab elled obser v ations, the goal is to rank those b elonging to C 1 ahead of the rest. Of co urse, one can use any classifier to do this as lo ng as the cla ssifier is capable of pr o ducing not only a class lab el but also a n estimated p os ter ior probability P ( y ∈ C 1 | x ) o r a class ification scor e. F or ex ample, the SVM do es not estimate p o sterior proba bilities , but the final de c ision function (11 ) is a class ific a tion sco re which can be used (at least op erationa lly ) to rank unlab elled o bserv atio ns — whether this is effective o r not is a separate issue. 4.2.1 RBFnets The final decision function pro duced by SVM (11) is of the form f ( x ) = β 0 + X µ i ∈ S β i φ ( x ; µ i , R i ) , (20) 13 where φ ( x ; µ , R ) is a kernel function. F or ex a mple, we can take R to b e diagona l and let φ b e the Gaussian kernel φ ( x ; µ , R ) = 1 p (2 π ) d | R | exp − ( x − µ ) T R − 2 ( x − µ ) 2 , (21) where | R | is the determinant o f R . The function (20) is sometimes called a (sing le-lay er) radial basis function netw ork (RBFnet). Generally sp eaking, to construct an RBFnet one must compute and sp ecify three ingredients: µ i , the lo cation parameter of each k e rnel function — together, they make up the s e t S ; R i , the shap e para meter of each kernel function; and β i , the co efficient in fr ont of each kernel function. Typically , o ne first sp ecifies µ i and R i and then e stimates the β i ’s by least-squa res o r maximum likelihoo d. Often, one se ts R i = r I a nd trea ts the par ameter r as a g lo bal tuning par a meter — this is what SVM do es. Determining the µ i ’s or the b est set S from training data, how ever, is an NP-hard combinatorial optimiza tion problem in general. The SVM can b e viewed as an algorithm for determining the s et S a nd the β i ’s simultaneously (Sc h¨ olkopf et al. 1 997); the set S = S V is s imply the s e t o f all supp or t vectors. In order to do so , SVM solves a qua dratic programming instead of a combinatorial optimization problem. 4.2.2 LA GO The pro duct from my R& D divisio n is an algo rithm ca lle d LA GO (Zhu et al. 200 6). The decision function constructed by LA GO for ra nking unlabelled o bserv ations is as follows: f ( x ) = X x i ∈ C 1 | R i | φ ( x ; x i , α R i ) . (22) The parameter α is a glo ba l tuning parameter. In the simples t case, we take R i = r i I , (23) where r i is the average distance b etw een the kernel center, x i ∈ C 1 , and its K -nearest neighbor s from C 0 , i.e., r i = 1 K X w ∈ N 0 ( x i ,K ) d ( x i , w ) . (24) The notation “ N 0 ( x i , K )” denotes the K -nearest neigh b ors of x i from C 0 ; and d ( u , v ) is a distance function, e.g., d ( u , v ) = k u − v k . By comparing (22)-(23) with (20), we ca n easily see that LAGO ca n als o be view ed as an algorithm for constructing an RBFnet, just lik e the SVM. In pa rticular, the three ingr edients o f the RBFnet are sp ecified as follows: µ i : Every µ i is a training observ atio n x i from the rare class, C 1 . 14 R i : Each kernel function φ is spheric al with radius prop or tional to the average distance betw een its cen ter µ i ∈ C 1 and its the K -nearest neighbors fro m C 0 . β i : Simply set β 0 = 0 a nd β i = | R i | ∀ i > 0. Here we s e e that the o nly computation needed is the calcula tion of r i ; a ll o ther ingredients ar e com- pletely determined a pr iori. The calculation of r i , of cours e , is co nsiderably simpler than qua dratic progra mming, making LAGO many times faster and s impler than the SVM. Instead o f solving an optimization problem to find support vectors, LAGO fully explo its the sp ecia l na tur e of these r are- class detection pro blems a nd simply uses all training observ ations from the ra re class as its “supp ort vectors,” a significant shortcut. Our empirica l exp erie nces show that the shortcut is highly worth- while. W e find that LA GO a lmost a lwa y s pe r forms as well as and so metimes even b etter than the SVM for these rare - class c lassification and detection problems. Zhu et al. ( 2006 ) give a few theo retical arguments for wh y all these shortcuts are justified. Suppo se p 1 ( x ) and p 0 ( x ) a re density functions of C 1 and C 0 . The main ar gument is that (22) can b e viewed as a kernel dens it y estimate of p 1 adjusted lo cally by a factor that is appr oximately inv ersely prop ortiona l to p 0 , i.e., | R i | . The re s ulting r anking function f ( x ) is thus approximately a mono tonic transformatio n o f the poster ior probability that item x b elong s to the rare class. The only nont rivial calculation p erfor med by the algo rithm, equation (2 4 ), is somewhat sp ecia l and nonstandard. The or iginal idea came from a Chinese bo ard g ame called GO. C o nsider the t wo black sto nes lab elled A and B in Figure 4 . A GO play er will tell you that B co ntrols more territories on the b oard than A. Why? Beca use, when co mpared with B, A is c lo ser to mor e enemy (white) sto nes. Therefore, imagine tw o class es fighting for co ntrol ov er a common spa ce. Giv en an observ a tio n fro m C 1 , if we want to use a kernel function to describ e its effective control ov er the ent ire space, we should use a large k ernel radius if its nearby neighbors from C 0 are a long distance aw ay and a sma ll kernel radius if its nearby neighbors from C 0 are a short distance a wa y . Equation (24) captures this basic principle. Figure 4: The bo a rd game o f GO. In this illustration, the black stone B controls mor e terr itory tha n the black sto ne A. 15 4.2.3 eLA GO v ersu s s LA GO Instead of (23)-(24), the origina l LAGO paper (Zhu et al. 20 0 6) used R i = diag { r i 1 , r i 2 , ..., r id } , r ij = 1 K X w ∈ N 0 ( x i ,K ) | x ij − w j | . (25) That is, the k ernel function φ was chosen to b e elliptical ra ther than spherica l. T o distinguis h the t wo, we call (2 5) e LA GO a nd (23 ), sLA GO. F or many re a l-world rar e-class problems, the data set often contains a limited amount of information b eca use C 1 is very ra re. As suc h, the extra flexibility afforded by eLAGO is seldom needed in practice. 4.2.4 Discussion: LA GO i s a sp eciali zed k ernel metho d LA GO is a kernel metho d, m uch like the SVM. There are tw o tuning para meters, K and α . E xp er- imen ts similar to those descr ibed in Section 2.5.1 and Fig ure 3 have shown that the perfor mance of LA GO is not very sensitive to K and muc h more sensitive to α . In practice, it o ften suffices to fix K = 5. LA GO is not a genera l-purp ose metho d; it is a spe c ialized algor ithm for a sp ecial lea rning problem, namely rare- c la ss classifica tion a nd detection. Its main adv antages are its sp eed and simplicity . Discussions in Sectio n 2 .5 hav e made it cle a r that these kernel metho ds mu st b e carefully tuned, e.g., using empirical pro cedures such as c r oss-v a lidation. This means tha t, in pr actice, one almost alwa ys has to run these algorithms r ep eatedly for many times. One may be tempted to think that, if one algorithm takes 1 0 min utes to run and another takes 1 minute, the difference is still “negligible” for a ll pra ctical purp o s es, but such ten-fold differences a re o ften significa ntly magnified if one has to run these tw o alg o rithms repea tedly for man y times. Apart from these pr a ctical matter s such as time savings, the more impo rtant lesson from this resear ch lies in the bas ic principles b ehind the construction of LAGO (22). Here, we see that it alwa y s pays to exploit the spec ial nature of an underlying problem. F or these rare - class problems, there is o nly limited amount of useful information in the tra ining data. LAGO fully explo its this fact by immediately zo oming int o the useful information (i.e., x i ∈ C 1 ) and making a few quick lo cal adjustment s based on r i — equation (24). 4.3 A mass R &D pro duct: Darwinian ev olution in parallel univ erses Let us now co nsider a differen t problem, the v ariable selection problem. Giv en d potential predictors, which combination is the b es t for pr edicting y ? Let Ω b e the spa ce of all poss ible s ubsets of C = { x 1 , x 2 , ..., x d } . The typical approach is as follows: First, define a pro p er ev aluation criterion, F ( ω ) : Ω 7→ R . Preferably F should b e a fair measur e of ω ∈ Ω. Common exa mples of F include the Ak aike information cr iter ion (AIC, Ak a ike 1973), the Bay esian information cr iterion (BIC, Sch warz 1978), and g eneralized cross- v alidation (GCV), to na me a few. Then, use a sear ch algor ithm to find the bes t ω which o ptimizes F ( ω ). 4.3.1 Tw o c hall enges: computation and criterion There ar e t wo ma in challenges. The first one is computation. With d p otential predictors, the size o f Ω is | Ω | = 2 d . This gets large v ery quickly . F or example, tak e d = 100 a nd suppose we can ev aluate 16 a billio n (10 9 ) subsets p er second. How long will it take us to ev aluate all of them? The answer is ab out 40,0 0 0 billion y ears: 2 100 ÷ 10 9 ÷ 3600 ÷ 24 ÷ 365 ≈ 4 0 , 000 × 10 9 . This may seem serious, but it a c tually is not the pro blem we shall b e concer ned ab out here. Every one m ust fac e this problem; there is no wa y out — just yet. F or mo der a tely la rge d , exhaustive search is impos s ible; stepwise o r heuristic search algo rithms m ust b e used. The seco nd challenge is more substantial, esp ecia lly for statisticians , and that’s the ques tion of what makes a go o d ev alua tio n cr iterion, F . It is well-known that b oth the AIC and the BIC are problematic in pra ctice. Roughly sp eaking , with finite data, the AIC tends to fav or subsets that are to o larg e, while the BIC tends to fav or ones that a re to o small. F or cla ssic linear mo dels, both the AIC and the BIC hav e the form: F ( ω ) = go o dness -of-fit( ω ) + γ | ω | , where | ω | is the size of ω , or the nu mber of v ar iables included. The AIC uses γ = 2 whereas the BIC uses γ = log( n ), n being the sample size. Therefor e, it app ear s that γ = 2 is to o small and γ = log ( n ) is too big. But if this is the case, sure ly ther e must be a magic γ somewhe r e in b etw een? So why not find out what it is? While this log ic is certainly quite natura l, it by no mea ns implies that the task is easy . 4.3.2 Dar winian ev olution in parallel uni v ers es The pro duct from my R& D division is a very simple yet surprising ly effective method for v aria ble selection by using Dar winian evolution in para llel univ erses (Zhu and Chipman 20 06). Here is how the algo rithm works in a nutshell. Crea te a num b e r of para llel univ erses. In each universe, run an evolutionary algorithm using the (appa rently incor rect) AIC as the ob jectiv e function for just a few gener ations — the evolutionary algorithm is a heuristic s to chastic search algorithm that mimics Darwin’s “ natural selectio n” to o ptimize a n y given ob jective function (see, e.g., Goldberg 1989 ). Whatever it is , there will b e a current best solution in each universe when we stop. F or example, the current best subset in univ er se 1 may b e { x 3 , x 8 , x 10 } ; in universe 2, it may be { x 1 , x 3 , x 8 , x 15 } ; in universe 3, per haps { x 3 , x 5 , x 8 , x 11 } ; and so on. These for m an e ns emble. Now take a ma j ority vote and s elect those v ariable s that show up in significa nt ly more universes than the rest. In the example here, this w ould be { x 3 , x 8 } — and that’s the answer. 4.3.3 Explanation with a toy example Wh y do es this simple strategy work? A small toy example is enough to illustr ate the gist of the idea. Generate y i = x i, 2 + x i, 5 + x i, 8 + ǫ i , x i, 1 , ..., x i, 10 , ǫ i iid ∼ N (0 , 1) , i = 1 , 2 , ..., 50 . In other words, there ar e 10 p otential predicto r s but the tr ue mo de l con tains only 3 o f them: x 2 , x 5 , and x 8 . With just 1 0 v ariables, there are a ltogether 2 10 = 1 , 024 subsets, a nd we c an still a fford to exhaustively compute the AIC for each one of them. Figure 5 plots the AIC versus the size for a ll 2 10 po ssible subsets. A num be r of c harac ter istic observ ations can be ma de: 1. The subset that has the sma llest AIC is wrong; it includes a few v ariables to o many . 17 2. On the AIC scale, many subs ets a re v ery clo se to each other and it is ha rd to tell them apa rt. 3. Let’s separa te the 2 10 subsets into t wo groups. Group I consists of those that include all the true v ariables — they are labelled with circles ( ◦ ) in the plot. Group II co nsists of those that miss out o n at least o ne of the true v ariables — they are lab elled with cross es ( × ), pluses (+), and tr iangles ( △ ). Then, o n the AIC scale, a significant gap exists betw een these t w o groups. Having made these observ ations, we ar e now ready to explain w hy pa rallel evolution works. The large gap b etw een group I and gr oup I I (observ ation 3) means that mem b er s from gr oup I are significantly sup erior and hence easily fav o red by e volution. Therefore, after evolving for just a few generations , the current b est subset in ea ch universe is likely a member from gr oup I. They are the ones that make up our ensemb le. What do they hav e in co mmon? They all include the 3 true v ariables . AIC of All 2 10 Models Model Size AIC 0 1 2 3 4 5 6 7 8 9 10 160 180 200 220 240 Number of true variables contained in the model: 0 1 2 3 True Model Figure 5: Wh y do es parallel evolution work? F or wha t this figure tells us, see Section 4.3 .3. But in order for ma jority vote to b e effective in selecting the r ight v ariables, it is necess a ry that the true v ariables ar e the only thing that these ens emble members have in common. That’s why we ca n’t run the evolution for to o long in each universe. With a short evolution, since members of g r oup I a r e hard to dis tinguish fr o m each o ther on the AIC s cale (obser v ation 2), the random nature of evolution will cause ea ch univ erse to s ettle on different member s from this gr oup. If, on the other hand, we run the evolution for to o long, the cur r ent b est s ubsets from different univ e r ses will start to develop something else in c o mmon — they will all star t to co nverge to the minim um AIC solution, which includes spur ious v ariables (observ a tion 1). 18 Figure 6 illustra tes how par allel evolution works on this toy example. After r unning the evolu- tionary algor ithm for just 6 gene r ations in each universe, we measur e the impo rtance of a v a riable by how often it shows up acros s the parallel universes. The cor rect solution for this e x ample is { 2 , 5 , 8 } . When a single universe is used ( B = 1), we get the wrong solution — a spurious v ar iable, namely v ariable 6, also shows up. But a s more and more parallel univ erses ar e used, only the truly impo rtant v ariables, i.e., v aria bles 2, 5 and 8 in this case, can “surv ive” the ma jority v ote. W e can see from Figure 6 that when as few as B = 10 universes a r e used, the co rrect s olution is a lready easily disce r nible: out o f the 10 universes, v ar iables 2, 5, and 8 each s how ed up at least 9 times; v ariable 6 show ed up 4 times; and all other v ariables show ed up at most twice. 2 4 6 8 10 0.0 0.2 0.4 0.6 0.8 1.0 Variable Importance 1 2 3 4 5 6 7 8 9 10 B=1 2 4 6 8 10 0.0 0.2 0.4 0.6 0.8 1.0 Variable Importance 1 2 3 4 5 6 7 8 9 10 B=5 2 4 6 8 10 0.0 0.2 0.4 0.6 0.8 1.0 Variable Importance 1 2 3 4 5 6 7 8 9 10 B=10 Figure 6: Parallel evolution on the to y example (Section 4.3.3). The correct solution for this example is { 2 , 5 , 8 } . When B = 10 parallel universes are used, the correct solution is already ea sily discernible. 4.3.4 Discussion: P arallel evolution is an easy-to-us e ensemble metho d Parallel evolution for v aria ble selection is a successful example of using e ns embles in a very different context. By using a n ensemble, we can sig nificantly “b o ost up” the pe r formance of an apparently wrong v ariable s election criterion such a s the AIC. The pr o cedure is very ea sy to use. Mo s t im- po rtantly , it is trivial to adapt this pr inciple to general v a riable selection problems rega rdless of whether the under ly ing mo del is a clas s ic linear mo del, a ge neralized linea r model, a ge neralized additive mo del, a Cox prop ortiona l haz a rd mo del, or any other model for which the question of v ariable selec tio n is meaningful. As such, it is not unfair to call para llel evolution a first-ge neration, fo olpro of, off-the-shelf v aria ble selector. A n umber of smart statisticians hav e questioned whether it is nece ssary to use the ev olutionar y algorithm. F or example, one can a pply Breiman’s Bagging principle and create an ensemble as follows: Draw a bo otstrap sample of the data. Using the b o otstrap sample, run a stepwise algor ithm to optimize the AIC and cho ose a subset. Do this ma ny times, and we get an ensemble of subsets. T ake ma jor ity vote. Clea rly , this would als o work. I hav e exp erimented with this idea a nd found that it is not as effectiv e; the pr obability o f selecting the r ight subset of v aria bles dec r eases significa nt ly in simulation exp eriments. Why? Breiman’s theor e m (Section 3.3) p oints us to an a ns wer. Beca use bo otstrapping alone does not crea te eno ugh div ersity within the ensemble. These subsets share too many things in common with the minimal AIC solution. 19 4.4 Section Summary In this section, I hav e discussed a new kernel-base d algor ithm fo r rare target detection, LA GO, and a new ens e mble metho d for v ar iable selectio n based o n pa rallel evolution. In doing so, a more gener al formulation o f LA GO is pres ent ed (Section 4.2 ) using muc h better mathematical nota tion, e .g ., equation (22). A simpler version, sLAGO, is g iven for the first time. Better explanatio ns ar e also given for why parallel evolution (Section 4.3 ) works, e.g., Figure 5 . Ma ny pe o ple hav e the incorrect understanding that parallel evolution is merely a better sea rch algorithm for v a riable se le ction. This is simply not true. In Section 4.3, it is emphasized that, instea d of a b etter s earch algorithm , para llel evolution is actually an ensemble metho d that b o o sts up the p er formance of an apparently incorrect search criterion such as the AIC. 5 Conclusion So, w ha t have we lea rned? First of a ll, we lea rned that, by using kernel functions, we can use many linear algorithms such as separa ting hyper planes and principal comp onent analy sis to find nonlinea r patterns (Section 2 ). This easily can be done as long as the underlying linear algorithm c a n b e shown to dep end on the data o nly thr o ugh pair w is e inner-pro ducts, i.e., x T i x j . Then, we simply can replace the inner - pro duct x T i x j with a kernel function K h ( x i ; x j ). Howev er, even thoug h such a framework is straightforward, we also learned tha t it is imp ortant in practice to use the r ight kernel function K h and to car e fully select the hyp e r parameter h (Section 2.5). W e saw that this is not necessarily an easy task (Section 2.5 .1 ). W e then lear ned ab out ens emble metho ds (Section 3 ). The fundamental idea there is to us e a collection of p erhaps not-so -well-tuned models rather than a s ingle mo del that often re q uires careful fine-tuning. This usually makes ensemble methods eas ier to use for non-exp er ts. I then empha sized that, even for ensembles, it is necess a ry to p er form some fine-tuning (Section 3.5) — this typically inv olves creating the right amount of div ersity in the ensemble (Section 3.4 and 3.5 ). How ever, we saw that fine-tuning a n ensemble algor ithm is often easier than fine-tuning a k ernel-based algorithm (Section 3.5.1). I then argued (Section 4.1) that kernel methods and ensem ble methods need to co-exist in practice. In par ticular, no n-exp erts may tend to prefer ensemble metho ds b ecause they a re easier to use, where as expe r ts may tend to pr efer kernel methods because they provide mor e flex ibilit y for solving nonstandard and difficult pr oblems (Sections 2 .5 and 3 .5 ). Hence, it is imp o rtant for resear chers in statistical ma chine learning to a dv ance both types of metho dolog y . I then presented some of my own r e search on b oth fro n ts: LAGO, a fast kernel machine for ra re target detection; and Darwinian evolution in pa rallel univ erses, an ensemble metho d for v ariable selection. Ac kn o wledgmen t This exp ositor y article is based on tw o workshops (Septem b er 200 6, Sydney , Australia; Octob er 2006, Adelaide, Austr alia) and a gra dua te cour se (January-April 2 007, University of W aterlo o, Ca nada) that b ear the same title. The workshops were made p ossible by an AusCan scholarship fro m the Statistical So cieties of Australia and Canada. I a m indebted to Dr. Peter Ricci of the Austra lia n T axa tion O ffice for initia ting thes e workshops . I hav e received many v a luable comments and feed- backs fro m the participa nt s of the workshops as well as from the s tudents and faculty members who painstakingly sat throug h my gr aduate co urse. I thank Dr. Stanley S. Y oung for providing me with 20 tempo rary office spa ce at the Na tio nal Ins titute o f Statistical Sciences (NISS), wher e this ar ticle was first written. I also thank Dr. Dia nna Xu a nd Dr. Dylan Small for providing me with temp ora ry office space s at Br yn Mawr College a nd the Univ ersity o f Pennsylv ania, respectively , so that I could work on the revision of this article with little distraction. My research is par tially supp or ted by the Natural Science a nd Engineering Research Council (NSERC) of Canada, Ca nada’s National Pro - gram on Co mplex Data Structures (NPCDS) and the Mathematics of Information T echnology And Complex Systems (MIT A CS) net work. I’d like to a ckno wle dge the work by Alexandra Laflamme- Sanders and Dandi Q iao to ma ke L A GO and parallel evolution into R librar ies; these libraries will be publically av ailable from htt p://cr a n.r-pro ject.o r g/. Finally , I’d lik e to thank the anonymous referees for helping me impr ov e this ma n uscript, and es pe c ially referee num b er one for giving me the strongest supp ort and encoura gement po ssible. References Ak aike, H. (1973 ). Information theory a nd an extension of the max imum likelihoo d principle. Se c ond International Symp osium on Information The ory , pages 267–2 81. Breiman, L. (1996). Bagging predictors. Machine L e arning , 24 (2), 123– 140. Breiman, L. (2001). Random forests. Machine L e arning , 45 (1), 5–32 . Cristianini, N. and Shaw e-T aylor, J. (2000). An Intr o duction to Supp ort V e ctor Machines and Other Kernel-b ase d L e arning Metho ds . Cam bridge Universit y P ress. F reund, Y. a nd Sc hapire, R. (1996 ). Experiments with a new bo o sting algor ithm. In Mach ine L e arning: Pr o c e e dings of the Thirte enth International Confer enc e , pages 14 8 –156 , San F ra ncisco. Morgan Kauffman. F riedman, J. H., Hastie, T. J., and Tibshirani, R. J . (2000). Additive lo gistic regre s sion: A sta tistical view of b o osting (with discussion). The Annals of Statistics , 28 (2), 337 –407. Goldb erg, D. E . (1 9 89). Genetic A lgorithms in Se ar ch, Optimization and Machine L e arning . Addison-W esle y . Hastie, T. J., Tibshirani, R. J ., and F riedman, J. H. (2001). The Elements of Statistic al L e arning: Data-mining, In fer enc e and Pr e diction . Spring er-V e rlag. Mercer, J. (19 09). F unctions o f p ositive and neg a tive t yp e and their connection with the theory of integral equatio ns . Philosophic al T r ansactions of the Roy al So ciety of Lo ndon, Series A , 209 , 415–4 46. Sch¨ olkopf, B., Sung, K. K., Burges, C. J . C., Giros i, F., Niyogi, P ., Poggio, T., and V apnik, V. (1997 ). Comparing supp o rt vector ma chines with Gaussian kernels to ra dial ba sis function classifier s . IEEE T ra nsactions on S ignal Pr o c essing , 45 (11), 2758 –2765 . Sch¨ olkopf, B., Smola , A., and M ¨ uller, K. B. (1998). Nonlinear compo nent analys is a s a kernel eigenv alue problem. Neur al Computation , 10 , 129 9–13 19. Sch warz, G. (1 978). Estima ting the dimension of a model. The Annals of Statistics , 6 , 461– 464. V apnik, V. N. (1 995). The Natur e of Statistic al L e arning The ory . Springer-V erlag. 21 Zhu, M. and Chipman, H. A. (20 06). Dar winian e volution in pa rallel universes: A pa r allel genetic algorithm for v aria ble s election. T e chnometrics , 48 , 491–50 2. Zhu, M., Su, W., and C hipma n, H. A. (2006). LA GO: A computationa lly efficient appro ach for statistical detection. T e chnometrics , 48 , 193–2 05. 22
Original Paper
Loading high-quality paper...
Comments & Academic Discussion
Loading comments...
Leave a Comment