A Novel Approach to Formulae Production and Overconfidence Measurement to Reduce Risk in Spreadsheet Modelling
Research on formulae production in spreadsheets has established the practice as high risk yet unrecognised as such by industry. There are numerous software applications that are designed to audit formulae and find errors. However these are all post c…
Authors: Simon Thorne, David Ball, Zoe Lawson
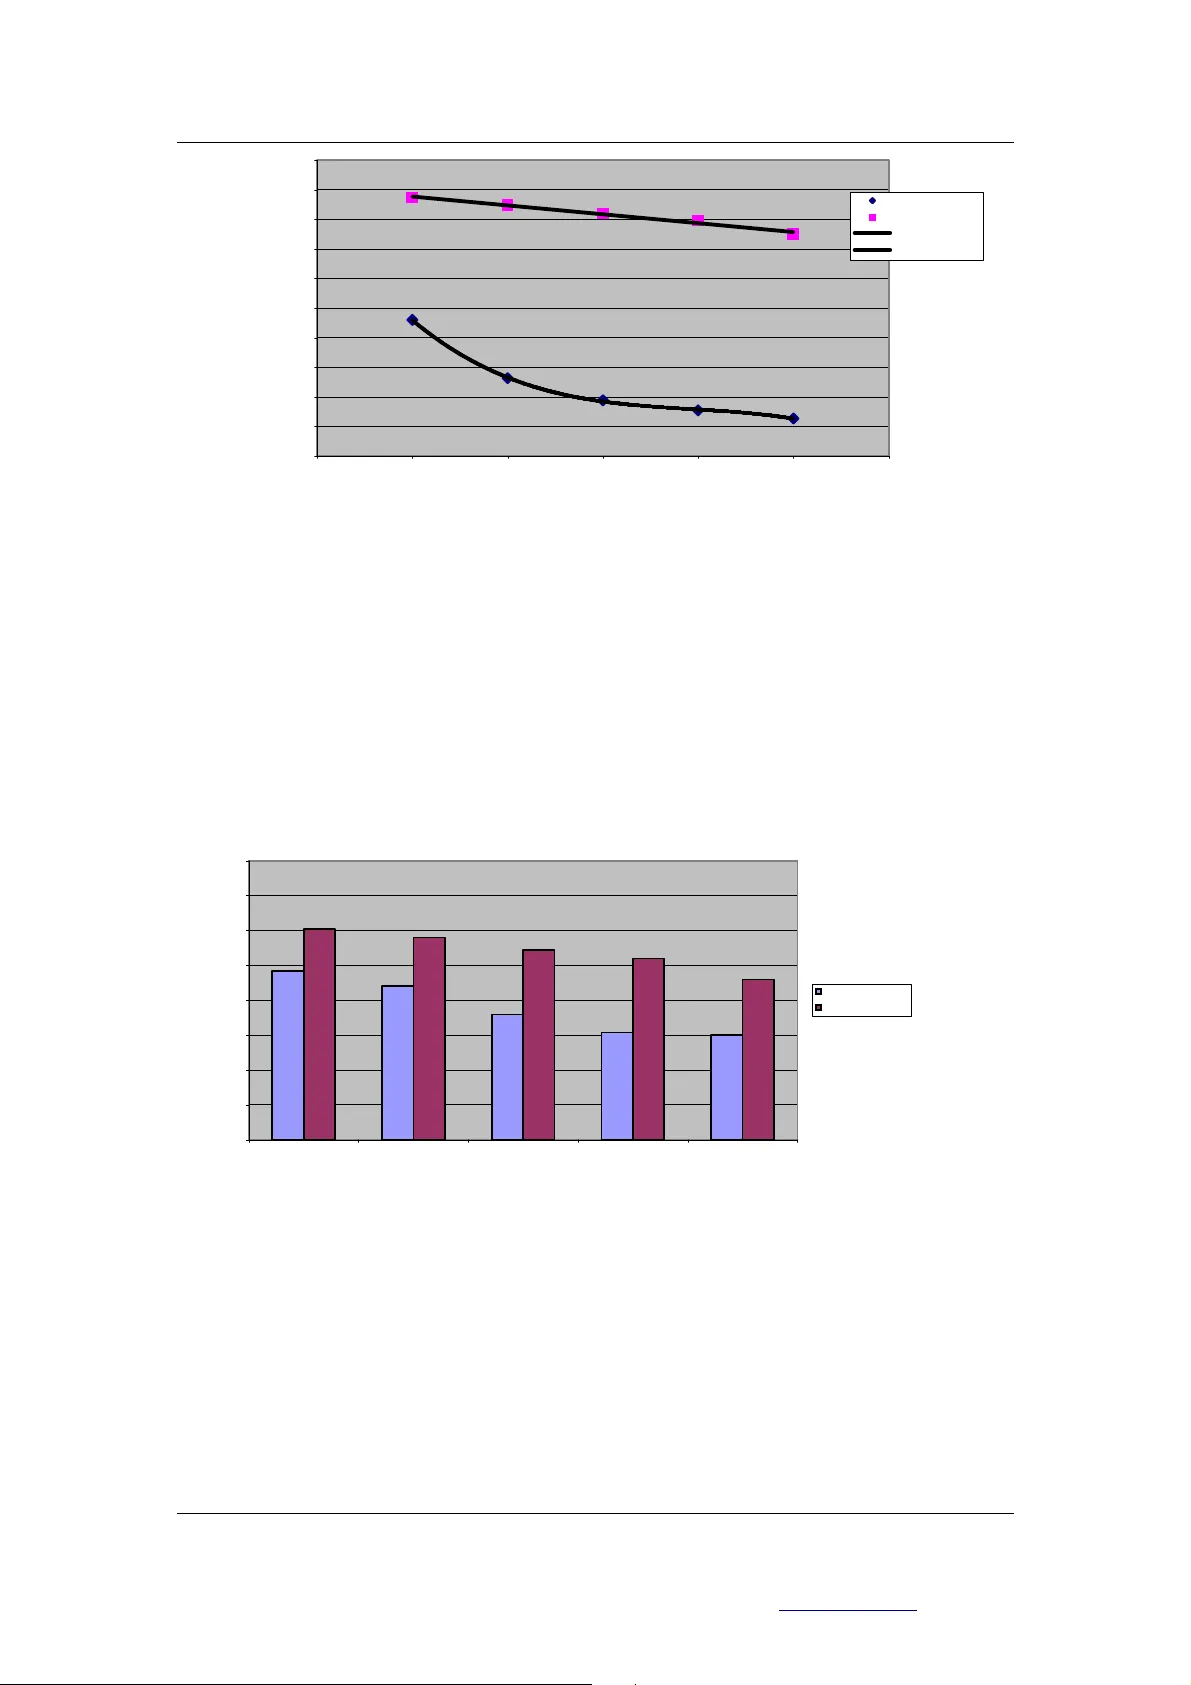
Page 1 of 12 Extra cted f rom Procee ding s of EuSpR IG 2004 Con fe rence Risk Reduct ion in E nd User Computi ng: Best pr actic e for s preads heet use rs i n the new E urope ISB N: 1 902724 94 1 Copyri ght © European Spreads heet Risks Int erest Group 2004 w ww. eusprig .org A novel approach to formulae production and overconfidence measurement to reduce risk in spread sheet mod elling S. Thorne, D. Ball, Z. Lawson University of Wales In stitute Cardif f sthorne@u wic.a c.uk , dball@u wic.ac.uk , law sonzf @c ardi ff. ac. uk ABSTRACT Research on formulae p roduction in spreadshee ts has established the pract ice as high risk y et unrecognised as su ch by industry. Ther e are num erous software appl ications that are desig ned to audit form ulae and find errors. Howev er these are all post creat ion, designed to catch errors before the spreadsheet is deploy ed. As a general conclusion from EuSpRIG 2003 conference it was decided that the tim e has come to attempt nov el solutions based on an unde rstanding of human factors. Hence in this paper w e exam ine one such possibi lity nam ely a novel example driven modelling approach. We discuss a control experim ent that compares ex am ple driven modelling against tradition al approaches over several progressively m ore difficult tests. The results are very interesting and certainly point to the value of further investig ation of the example driven potential. Lastly we propose a metho d for statistically analysing the problem of overcon fidenc e in sp readshee t modelle rs. 1. INTRO DUCTION In this paper we discuss one possible novel approach to formulae production and an overconfidence measurement to reduce risks in spreadsheet modelling. Our novel approach was the result of an inter-university collaborative project between UWIC and Card iff Universitie s. 1.1 Spreadsheet error s Since th e widesp read av ailabili ty of the o ffice PC th ere has been a rapid rise in E nd Use r Computing (EU C). EUC i s a fairly broad term which cov ers database, presentation, w ord processing, spread sheet an d any other ap plication that end user s have acces s to. The activity of EUC was identified as p resenting par ticular risk s to organi sations (Dav is, 1987) (A lavi and Weiss, 1985) (Brown and Bostrom , 1989) (Munro et al, 1987) (Benson, 1983) (Brown and Bostrom, 1994) and (Alav i et al, 1987). Consequently , managem ent strategies were formulated, designed to co ntrol EUC according to an organisations needs and cul ture (Brown and Bostrom, 1989) (Munro et al, 1987) and (Alavi et al, 1987). A novel approach to form ulae production and ov ercon fidence m easurem ent to reduc e risk in spreads heet m odelling S. Thorne, D. Ball, Z. L awson Page 2 of 12 Extra cted f rom Procee ding s of EuSpR IG 2004 Con fe rence Risk Reduct ion in E nd User Computi ng: Best pr actic e for s preads heet use rs i n the new E urope ISB N: 1 902724 94 1 Copyri ght © European Spreads heet Risks Int erest Group 2004 w ww. eusprig .org Although spreadshee t modelling is incorporated into EU C managem ent strategies, it requires special consider ation due t o the high f lexibility, usa bility and av ailability t hat spreadsheet s offer. F or these reasons spr eadsheet s hav e becom e an indispen sable tool to o rgan isatio ns for p ersonal, strategic decis ion-m aking and even mission critical modelling . However, spreadsh eet ease of use beco mes prob lem atic when org anisation s rely ing on sp readsh eets in decision-m aking processes m iss simple errors, wh ich can then hav e serious r epercussions. The EuSpRI G web site (www.eusprig.org ) has some such examples: ‘Cut and Paste er ror’ cost Trans A tlanta Corp. $ 24 million ( June, 2003), S eattle sel f storage com pany shares fel l 7.1% after it was rev ealed they had unint entionally ov erpaid two chief exe cutives $700,00 0 each (October, 2003) and Florida education ex ecutives duplicated the cost of an Elem entary school by $12 m illion, seriously ef fecting the pro jects budg et (September, 2003). 1.2 Human factors Research has sugg ested that human factors inf luence the quality of spreadshe et models. Pank o (1998 ) sug gested tha t error rates in sp read sheets are sim ilar to o the r area s of c omplex hum an cognition. Kruck (1998) proved that spreadshe et m odel quality could be im proved by equipping m odellers with the cognitive sk ills tha t they require to produc e complex spreadsh eets. All of this rese arch es tablishes sp readshe et use coup led w ith human factors as a high- risk activity for strategic decisi on-m aking in organisations. In order to lower the risk, spreadsheets and modeller in teractions need to be exam ined in great deta il and new a lternative m ethods of interaction dev eloped. In this r egard, Pank o at the 2003 E uSpRI G conference s trongly encouraged the nee d for new approache s based on hu man factors researc h. 1.3 Example driven modelling (EDM) Considering the existing research into spreadshe et error produc tion, it seem s that m ost of the problems arise from hum an cognitive e rrors. Panko ( 1998) discusses a b asic er ror rate even for simple tasks and an increased rate for m ore challenging tasks. This begs further researc h into the precise natu re of the relationshi ps involved. A s discussed below ou r research resu lted in a negative exponen tial function us ing Halstead’s ‘co mplexity’ m easure (Halstead, 1977) One interesting w ay to possibly im prove the quality of spreadsheet m odels, taking account o f the need for new approaches based upon hum an factor research, m ay be to eliminate the need for humans to produce for mulae. Producing formulas is not wha t we are naturally best at (Michie, 1979). Hum an neural processes are m ainly exam ple driven and patte rn matching. I n contrast, compute rs are naturally g ood at arithmetic and log ic (the Arithm etic Logic Unit is at the heart of a computer), but computers are not naturally good at generating exam ples or pattern matching . So perha ps at present w e have th ings the wrong way round wh en producing spreadsh eets, o r at leas t not optim al. For exam ple, c hildren learn arithm etic by exam ple (Jo n has fo ur app les, M ary t akes two. How many does Jon have left?), rather than solving : 4 - 2 = 2. Wh en shopping at the supermark et, we know from previous ex am ples when we are in dang er of overspending. W e rarely g enerate some form ulae, wh ich inc ludes the effec t of t omorro ws inter est rate rise o n our cred it car d account, etc., and then u se that form ula to decide w hether or not to buy tho se Garibaldi biscuits. Or again, we lea rn to catch a ball by exam ple (i.e. practice) ra ther than dream ing up and solving the tra jectory form ulae. In this vein, we were interested in investig ating whether i t A novel approach to form ulae production and ov ercon fidence m easurem ent to reduc e risk in spreads heet m odelling S. Thorne, D. Ball, Z. L awson Page 3 of 12 Extra cted f rom Procee ding s of EuSpR IG 2004 Con fe rence Risk Reduct ion in E nd User Computi ng: Best pr actic e for s preads heet use rs i n the new E urope ISB N: 1 902724 94 1 Copyri ght © European Spreads heet Risks Int erest Group 2004 w ww. eusprig .org may be easier to prov ide sim ple examples, which satisfy th e problem rather than deriv e the requisi te fo rmu lae. 1.4 Overconfidence Panko (2003) ex tended his hum an factors research to m easure overconfidence in m odellers and the subsequent effect it has on the spreadsh eet data integrity. Pank o found that overconfidence in m odellers ranged from 80% to 100%. These results show that overconf idence is a sig nifi cant issue in spr eadshee t model ling. Ov erconfiden t model lers m ay fail to apply any m ethodology or testing strategy and will not question the validity of their model. This practice is clearly counter- productive and cont ributes to the current p oor integrity of spre adshe et m odels , he nce ou r inte rest in e stabl ishin g a sa tisfa cto ry m etric. Our re sult s extend r esearch o n overco nfide nce measu rem ent. 2. EXPLORI NG FORMULAE PRODUCTIO N 2.1 Introduction To examine how pervasive sp readsheet errors a re in form ulae product ion, in the face of increasing formula com plexity, experim ents were designed to establ ish error rates in both traditional form ula product ion and exam ple driv en modelling (EDM). Tradition al modelling was used as a con trol for th e EDM exper iments. The resu lts of the se differen t paradig ms are then compared and ana lysed acco rdingly. 2.2 Aim The aim of the exp erim ent was to establish expe rimentally within an academ ic environment , using undergradua te and postgraduate students: 1. The relationship between spr eadsheet error rate a nd formula com plexity using a) Traditional m odelling, b) EDM 2. The (hypothesised) su periority of ED M over traditiona l modelling . 3. A m ore satisfacto ry stati stical m easure o f overco nfide nce. 2.3 Experiment d esign 2.3.1 Introduction This experiment was de signed in accord with Ca mpbell and Stanley (1963), which is considered a sem inal text in Quasi and Experim ental research des ign. Our expe riment randomly selected a large target g roup (57 stude nts) from a univ erse (of 2000 univers ity students). The necessary ex perimental deta ils were established using a pi lot experiment using a smaller sample (12 students). 2.3.2 Sampling Participant selection is criti cal to the credibility of the experim ent. In order to minimise bias of inexpe rience, certain c ourses w ere targ eted. Co nsidering sim ilar studies : (Pank o and Sprague, 1998); (Pank o and Halveson, 1996 ); (Galletta et al, 1997) ; (Galletta et al, 1993); (Teo and Tan, 1997) ; (Panko and H alverson, 1997) and (I rons, 2003) these al l used eithe r undergraduate studen ts or Masters level students as participa nts. For comparable resul ts several dif feren t courses w ere targete d, which also maxim ised the num ber of resu lts. Th e courses targ eted we re: Final y ear Underg raduate B usiness I nform ation System s and MSc Information System s. These groups have been selected for their academ ic and industria l A novel approach to form ulae production and ov ercon fidence m easurem ent to reduc e risk in spreads heet m odelling S. Thorne, D. Ball, Z. L awson Page 4 of 12 Extra cted f rom Procee ding s of EuSpR IG 2004 Con fe rence Risk Reduct ion in E nd User Computi ng: Best pr actic e for s preads heet use rs i n the new E urope ISB N: 1 902724 94 1 Copyri ght © European Spreads heet Risks Int erest Group 2004 w ww. eusprig .org experience, other c ourses were deem ed to be uns uitable for te sting. Participant s were the n selected random ly from these groups. The participant’s previous experience in spreadshee t development varies. All participants h ave, at some point, und ertaken a m odule that focuses on EUC dev elopment packag es (Including spreadsh eets with a specific assig nment). Students are expose d to spreadsheets al l through their univ ersity life, they a re used in busine ss type modules but also in statisti cs mod ules. It is a fair assum ption that t he part icipants also use spread sheet s outside o f university life in som e capacity. All participants would have at least a basic working knowledge of sprea dsheets and woul d have been e xposed to crea ting spreadsheet formulae. It is likely that the particip ants would hav e tackled sim ilar problems. To further g round the experien ce level, a ll pa rticipan ts were g iven a b rie f lecture and do cumen t detail ing the construc t of vario us spre adshee t form ulas. Equal importance sh ould be g iven to sample size, co nsidering the s tudies menti oned above, the average num ber of participants w as 52. In our case the number of pa rticipants was 57. 2.3.3 The Experi ment Students f rom the re levan t groups wer e giv en a series o f 5 tasks to com plete u sing two different approaches. The tasks involved a ‘tradi tional’ approach o f manually constructing spreadsh eet form ulae (serv ing as a co ntrol) and an ED M approach (wher e the pa rticipan ts were requ ired to g ive exam ple data for v arious a ttribut e classif ications ) The exper imen t was cond ucted in three stages. The firs t was to deliv er a bri ef rem inder lecture on how to use form ulae in excel and some pra ctical demonstrat ions. The second stage was a serie s of five tes ts inv olving formulae prod uction. This was fo llowe d by a self- evaluation of perce ived accu racy that w as com pared to t he actua l accur acy to m easure over/under confidenc e. The third stage teste d EDM by repeat ing the first five tests, but instead of creating form ulae, the p artic ipants we re requ ired t o giv e correct exam ple d ata in ac cord with the model. This was ag ain followed by their self- evaluation of perceived accuracy that was com pared to t he actu al accuracy to m easure ov er/unde r confid ence. The tests in bot h cases were progress ively more challenging , each buildi ng on the difficul ty of the last. 2.3.4 Confidence ques tionnaire As stated, on ce the que stio ns were com pleted the part icipan ts were req uired to f ill in a sho rt self- evaluation o f perce ived accu racy ques tionnai re on ‘task com pletion’ and ‘confid ence measure’. This m easured h ow conf ident the par ticipants we re and w as la ter com pared w ith the a ctual res ult. 2.3.5 Measuring the dependent va riable and error production metrics For a spreadshe et form ulae the dependa nt variable ’s success o r otherwise is determ ined when the formula that is produced has the correct syntax an d has the correct cell referencing. To put it simply, where mistakes were not obvious, the f ormulae were inserted into a k nown populated spreadshee t to check their v alidity by inspection. EDM success was d etermined by inserting the answ er values into k nown work ing formulae to see if the dat a was v alid. The resulting formulae we re examined and the ‘percentag e of m odels with errors’ (Pank o, 1998), ‘percentage accuracy ’ and ‘task com plexity’ dedu ced. The questions were m easured in term s of Halstead’s complexity (Ha lstead, 1977). Halst ead was used b ecause it is a g enerally acc epted m etric an d uniqu ely not only cons iders s oftwar e complexity but also w ithin formulae produc tion. Using Halstead’s complexity test (Ha lstead, A novel approach to form ulae production and ov ercon fidence m easurem ent to reduc e risk in spreads heet m odelling S. Thorne, D. Ball, Z. L awson Page 5 of 12 Extra cted f rom Procee ding s of EuSpR IG 2004 Con fe rence Risk Reduct ion in E nd User Computi ng: Best pr actic e for s preads heet use rs i n the new E urope ISB N: 1 902724 94 1 Copyri ght © European Spreads heet Risks Int erest Group 2004 w ww. eusprig .org 1977), the questions wer e giv en a value allowing relative com parison. Halstead’s tes t was originally developed as a m eans of determ ining the relativ e com plexity of software an d algorithms within so ftware and form ed part of a larg er set of tests to determine v olume, difficulty, effor t and complexity . Halstead’s com plexity formula, which is comm only refer red t o as Halstead’s comp lexity, is shown below. I n spreadsheet fo rmulae, the operands and operators are determined across the whole form ulae. Operators include: I F; AND; NOT; AVERAG E; SUM; >; = etc. O perand s are the ce ll referen ces and num bers used in the formulae. The r esulting complex ity ranges from 0, being the m ost complex, to 2 being the least complex. where n1 = the number o f distinct operator s n2 = the number o f distinct operands N1 = the total num ber of operator s N2 = the total num ber of operands 2 * 2 1 * 2 N n n Comple xity = The percen tage ac curacy for the sample g roup was then p lotted agains t the Ha lstead complexity. 2.3.6 Overcon fidence measures As there are no existing sat isfactory statis tical m easur es of ov erconfiden ce, m ainly attribut ed to its relativ e newness in the field, a method h as been created to achiev e this go al. The ‘overc onfid ence rati o’ is a coef ficie nt valu e ra ngin g fr om 1 (worst) to 5 (perf ect). This v alu e matches the partic ipants ‘combined ov erconfidence’ v alue to the actual result F(x) by questions 1 to 5. The combined overc onfidence is created by using the quest ionnaire results fo r confidence (1 to 5) and perceived d ifficulty (1 to 5). Hence: Combined ov erconfidence = (A*Confide nce) + (B*Di fficulty) where A = B = 0.5 Define X as the num ber of errors, F (X) = m ark /actual resul t F(x) = 5 if x = 0 4 if x = 1 3 if x = 2 2 if x = 3 1 if x >= 4 (F(x) = 0 if the ques tion was not attem pted) rate e rror A ctual rate e rror p erci eve d R atio r atio = C onfi den ce In real terms thi s measur es the expecte d outcom e of the partic ipants to the act ual outcom e and ranks it according to how accur ate their predict ion was, resulting in a value o f 1, indicating a perfect match be tween expected and actual, to 5 indic ating the worst m atch between expec ted A novel approach to form ulae production and ov ercon fidence m easurem ent to reduc e risk in spreads heet m odelling S. Thorne, D. Ball, Z. L awson Page 6 of 12 Extra cted f rom Procee ding s of EuSpR IG 2004 Con fe rence Risk Reduct ion in E nd User Computi ng: Best pr actic e for s preads heet use rs i n the new E urope ISB N: 1 902724 94 1 Copyri ght © European Spreads heet Risks Int erest Group 2004 w ww. eusprig .org and actual. It m ay also range below 1 to 1 fifth where greater than 1 im plies over confidence and less than 1 im plies under confidence 2.3.7 Participant tasks The participants wer e given 5 descriptive prob lems based around c reating form ulae to produce grades for a hy pothetical set of m arks (no actual data was includ ed) for a university. It was then up to the participants to produce a formula that would solv e the problem. The questions got prog ressively more complicated, req uiring the p articipants to account for different factors in the formulae. Fo r example, the first question requ ired a formula that would output “pass” or “fail”. Later questi ons required the form ula to output “Fail”, “Com pensate”, “Pass”, “Me rit” and “Distinct ion”. The pa rticipan ts were also r equire d to use ind irect referencing and v ariable grade boundar ies as the ques tions progressed. For example one possible solution to “Ensure both exam and coursework are above 40 and can hav e the c lassifi cation: Fa il (<4 0); Pass (>=40, <55 ); Mer it (>=55, <70 ) or D istinc tion (>=70 ) ” form ulae is: - =IF(MIN (C5:D5)<40,"Fail",I F(AVERAGE(C5:D5)>= 70,"Dist",I F(AVERAGE(C5:D5)>=55, "Meri t",I F(A VERAG E(C5: D5)> =40, "Pass ")))) The traditional formulae succes s or otherwise was determ ined on whether the formula that was produced had the correct syntax and the correct cell referencing. To put it simply, where mistakes were not obvious, the formulae were inserted into a know n populated spreadsheet to check their validity by inspection. EDM su ccess was de termined by insertin g the answer values into known working formulae to see if the data was valid. The confidence questionnaire then fo llowed this. As the second part of t he experim ent, the par ticipants were g iven the same descr iptive problems, as questions 1 to 5, but instead of producing formulae, they were required to giv e example data for each classification. The second confi dence questionna ire then followed. 2.3.8 Experimental de tails Described below are the co nditions and details for th e experim ent conducted in an academi c arena. Conditions There was no conferring allowed betwee n by participants; each test was unique to a participant. There wa s no tim e limit imposed on the test, the t est did have to be com pleted in the presen ce of an exam iner. The p articip ants wer e not to ld the n ature o f the expe rim ent . Details The participants we re give n two docum ents for the te st. The first docum ent was designed to accompany the brief rem inder lecture given to the participan ts. The second docum ent was the question, answer and confid ence papers. The participan ts were talked through the documentation they had been giv en and were told where to write the answers and w hat to do with the papers when finished. They were then allowed to start the test. 3. ANALYSIS A novel approach to form ulae production and ov ercon fidence m easurem ent to reduc e risk in spreads heet m odelling S. Thorne, D. Ball, Z. L awson Page 7 of 12 Extra cted f rom Procee ding s of EuSpR IG 2004 Con fe rence Risk Reduct ion in E nd User Computi ng: Best pr actic e for s preads heet use rs i n the new E urope ISB N: 1 902724 94 1 Copyri ght © European Spreads heet Risks Int erest Group 2004 w ww. eusprig .org The results that this experim ent provided are broken down into two sections. The first deals with the accuracy of manually m odelling form ulae against the e xample driven a pproach and the second deals w ith overconfidenc e in modellers. 3.1 Traditional app roach The results from the trad itional model ling show a high error rat e. The averag e percentage of incorrect answers for quest ions 1 to 5 was 80 %. The percentag e of m odels with e rrors, Panko (1998 ) is the refo re 80 %. Th is h igh erro r r ate is typica l of sim ilar s tudies su ch as: 1 00% (Hicks, 1995); 91 % (Coopers and Ly brand, 1 997); 91% ( KPMG, 1997) ; 86% (B utler, 2000); 84 and 95% ( Janvrin and Morrison, 1996 a nd 2000) an d 80% (Panko and H alverson, 1997 ). Figure 1 shows t he per centag e accur acy dro ps w ith incre asing Halstead comp lexity, a s th e questions prog ress. The tradit ional method a lso yielded an average o f 4 mistak es per question . EDM, in contrast g ave an av erage of 0.3 mistakes per question. Tr adi tional approach 0.00% 20.00% 40.00% 60.00% 80.00% 100.00% Q1 (0.66) Q2 (0.33) Q3 (0.11) Q4 (0.10) Q5 (0.04) Que s tions (H a ls t e a d c om pl e x i ty ) % accuracy T r ad itio n al mod ellin g Tr endli ne Figure 1 The curve in figure 1 appears to be ex ponentially decreas ing; it does however demonstrate some strange behaviour at either extrem i ty. We believe that the equat ion is trying to cater for the boundary condi tions at either ext remity, see figure 2. Figure 2 1 2 3 A novel approach to form ulae production and ov ercon fidence m easurem e nt to reduc e risk in spreads heet m odelling S. Thorne, D. Ball, Z. L a wson Page 8 of 12 Extra cted f rom Procee ding s of EuSpR IG 2004 Con ference Ris k Reducti on in End U ser C omputing: Best pr actic e for s preads heet use rs i n the new E urope ISB N: 1 902724 94 1 Copyri ght © European Spreads heet Risks Int erest Group 2004 w ww. eusprig .org In the case of very low com ple xity, there a re good re asons for believ ing that th e percen tage accuracy will never reach 100%. This upper boundary is due to the base error rate (Panko, 1998) and therefore a limitation occu rs and the curv e plateaus. See fig ure 3. I n the case of very high com plexity, we believe that a sim ilar limitation occurs a nd the curve becomes a ver tical line. The reason for this kink i s due to the well- known const raints of human work ing memory (Miller, 1956) whi ch states that h uman m e mory (of the order of a few minutes) is rest ricted to handling ‘s even plus or m inus two concepts s imultaneously ’. For examp le nested I F statements that in clude A ND, av eraged cells wit h indire ct referenc ing i s starting to g et quite com pl ex. When th e number of concepts being hand led simultaneously exceeds 9 (the Miller thre shold), then unless ther e is som e kind of spreads heet eng ineering technique used, e rrors are almost certain. This point is c rucially im portant when as far a s mission critical spr eadsheets are conc erned. I t would be very interes ting to k now what percentage of m iss ion cri tical spreadsheets have form ula beyond the Miller t hreshold, w here also such org anisations hav e no technique for coping beyond the M iller threshold, i.e. a spreadsheet model ling methodology or equivalent. Figure 3 3.2 EDM Figure 4 d isplay s the resul ts fo r EDM. As can be se en from the graph, the lev el of accuracy is very high and is easi ly able to cop e with the m ost complex question . On average, 9 8% of all answers g iven w ere correc t. EDM 0.00% 10.00% 20.00% 30.00% 40.00% 50.00% 60.00% 70.00% 80.00% 90.00% 100.00% 12345 Quest ion s % Correct EDM Linear ( EDM) 1 2 3 A novel approach to form ulae production and ov ercon fidence m easurem e nt to reduc e risk in spreads heet m odelling S. Thorne, D. Ball, Z. L a wson Page 9 of 12 Extra cted f rom Procee ding s of EuSpR IG 2004 Con ference Ris k Reducti on in End U ser C omputing: Best pr actic e for s preads heet use rs i n the new E urope ISB N: 1 902724 94 1 Copyri ght © European Spreads heet Risks Int erest Group 2004 w ww. eusprig .org 1.1. Figure 4 3.3 EDM and Trad itional comparis on Figure 5 compares the difference between EDM and traditional m e thods. These re sults show a very significant im pr ovement in accur acy when usin g an EDM approach. How ever, further research on EDM m ay well reveal new sources of error (Fra ser and Smith, 1992) EDM versus Tr aditi onal 0.00% 10.00% 20.00% 30.00% 40.00% 50.00% 60.00% 70.00% 80.00% 90.00% 100.00% Q1 (0.66) Q2 (0.33) Q3 (0.11) Q4 (0.10) Q5(0.04) Question (Hal stead Complexi ty ) % accuracy Traditional EDM Traditional trend EDM trend Figure 5 3.4 Overcon fidence Figure 6 show s the resu l ts for the conf idence m etric. Clearly the trad ition al approach leads t o overconfidence. Our m ethod for measuring confidence is based on how well the participants match the ir ac tual and p erceived accur acy in assess ing the d ifficu lty of th e task . A confiden ce ratio of 1 m eans a perfec t m atch. It would appea r that, within e xperimental e rror, this is true for EDM responses b ecause the l ine starts just be low and ends just above the co nfidence ra tio of 1. A novel approach to form ulae production and ov ercon fidence m easurem e nt to reduc e risk in spreads heet m odelling S. Thorne, D. Ball, Z. L a wson Page 10 of 12 Extra cted f rom Procee ding s of EuSpR IG 2004 Con ference Ris k Reducti on in End U ser C omputing: Best pr actic e for s preads heet use rs i n the new E urope ISB N: 1 902724 94 1 Copyri ght © European Spreads heet Risks Int erest Group 2004 w ww. eusprig .org Confidence indicator 0.00 0 .50 1.00 1.50 2 .00 2.50 3 .00 3.50 4.00 4 .50 5 .00 0123456 Questio n Confidence ratio EDM approach Traditi onal Approach EDM trendline Traditi onal trendline Figure 6 The questio nnaire u sed in the exper iment also a llo ws relativ e comparison of per ceived difficulty in the traditional and EDM approaches see figure 7. Note that, 1 corresponds to impossibly hard, 5 corresponds to trivially easy . The interest ing point here i s not the slo w increase in p er ceiv ed diff iculty as th e questi ons in crease in c omplexi ty, sin ce this wa s expected. Rather, the in teresting point is the g ap between the traditiona l and the ED M approaches. The gap c orresponds to a significant usab ility advantag e for EDM. Percieved Difficult y 1.00 1.50 2.00 2.50 3.00 3.50 4.00 4.50 5.00 12345 Question Difficult y EDM a pproac h Tra dit ional appro ach Figure 7 4 CONCLUSI ONS 4.1 Validation of ai ms The first aim was to establish the relationship betw een spreadsheet errors and form ul a complexity using traditional m odelling and EDM. The relationship is a neg ative exponentia l but the model breaks down at both v ery high (Miller threshold ) and very low (Base error rate ) complexities. A novel approach to form ulae production and ov ercon fidence m easurem e nt to reduc e risk in spreads heet m odelling S. Thorne, D. Ball, Z. L a wson Page 11 of 12 Extra cted f rom Procee ding s of EuSpR IG 2004 Con ference Ris k Reducti on in End U ser C omputing: Best pr actic e for s preads heet use rs i n the new E urope ISB N: 1 902724 94 1 Copyri ght © European Spreads heet Risks Int erest Group 2004 w ww. eusprig .org The second aim was to consid er whether EDM was superior to traditional m odelling. As discusse d above, t he evid ence ce rtainly suggests this. The third aim was to estab li sh a m ore satisfactory measu r e of overcon fidence. We feel ou r o verconf idence m easure has mo re transpa rency t han ex isting m ethods. Furth er, re lative comparisons between the traditional and ED M were m ore easily highlight ed. 4.3 Limitations to th e experiment The experiment has been conducted in an academ ic environment; other env i ronm ents also need to be considered. The EDM experim ent suggests that there m a y be considera bl e merit in EDM being m uch more thoroug hly investigated. 4.4 Furth er resea rch It would be very useful to v erify the above find ings within a r eal-life business-m odel ling environm ent. As discussed above it wou l d be v ery inter esting to a ssess the percen tage o f mission critical spreadshee ts which contain formulae bey ond the Miller threshold which do not make use of a rigorous spreads heet engineerin g methodology or equivalent. Further research o n EDM might includ e a m achine to read in th e exam ples and con vert them to formulae. Many ques tions m ight be asked concerning the validi ty and applicatio n of such a machine, but this research points to pos sible advantag es of such a novel advance. References Alavi. M, Ne lson.R, Weis s, 1987, ‘ Strate gies for En d Use r Com puting: An int egr ative fram ewor k’ , Journa l of Manag em ent Inf or m ation s y stems, 4 , (3) Alavi.M a nd Weis s.I, 1985, ‘ M anag ing t he risks assoc iate d w ith End U ser Comp utin g’ , Journal of M anagement Infor mat ion Sy stem s, 2 Bens on.D, 1983, ‘A f ield s tudy of End Us er Com puting: F indi ngs and Is sue’ , MIS Quart erly, Decemb er 1983. Brow n and B ostr om, 1989, ‘ Effec tive management of End User Comp uting: A total organisatio n perspective ’ , Journa l of Mana gem ent I nform ation sy stem s, 6 , (2) Brow n and B ostrom, 19 94, ‘ Org aniza tion designs for the man agem ent of End U ser Comp uting: re -ex aminin g the contin gencies’ , Journal of Manag eme nt Inf orma tion Sy stems, 10 , (4), pp 18 3-112. Butler. R, 2000, ‘Is this Spreadshe et a tax evade r? How Cus tom s and Exc ise tax te st spr eadshe et appli cati ons’ , Proce eding s of 33 rd Hawaii Inter national Conference on systems scien ce, P ages 4 – 7. Coopers an d Ly brand, 1997 , Inte rne t www.planningobjects.com /jungle1.htm , status: not ava ilable. D. Cam pbell and J. St anley , 1963, ‘E xper iment al and Q uasi expe rime ntal des igns for re sear ch’ , Houg hton Mifflin Com pany , 0-395- 30787- 2 Davis .B, 1987, ‘Commentary on Informa tion systems’, Acc ounti ng horiz ons , 43 Fras er.J and Sm ith.P, 1992, ‘A c atal ogue of er rors ’ , Intern ational Jou rnal of man-mach ine stu dies, 37 , (3) , pp 2 65- 307 Gal letta, D . F., Abra ham, D., El L o uadi, M., L ekse, W., Pollailis , Y. A., & Sam pler, J. L . 1993. ‘An Empir ical Study of Spr eads heet Error Per form ance ’ . Journa l of Accounti ng, Ma nag eme nt, and I nform ation T echnology , B (3-4), pp7 9-95. A novel approach to form ulae production and ov ercon fidence m easurem e nt to reduc e risk in spreads heet m odelling S. Thorne, D. Ball, Z. L a wson Page 12 of 12 Extra cted f rom Procee ding s of EuSpR IG 2004 Con ference Ris k Reducti on in End U ser C omputing: Best pr actic e for s preads heet use rs i n the new E urope ISB N: 1 902724 94 1 Copyri ght © European Spreads heet Risks Int erest Group 2004 w ww. eusprig .org Galle tta, D. F., Ha rtzel, K. S., Jo hnson, S ., and J oseph, J. L , 1997, ‘Spr eads hee t Pres entat ion and Er ror Dete ction: An Experimental Study ’ Jo urnal of Manageme nt Inf orma tion Sy stems 13 ( 2), pp. 45- 63. Hick s, 1995, cite d in Pank o. R, 1 998, ‘W hat w e know abo ut s prea dshee t er rors ’ , Journa l of End Us er Com puting, Special issue: S caling up End User Development Halstead. M, 1977 , ‘ Elements o f Software Sci ence’, Op erating, and P rogramming S ystems Series, 7 , (2) Irons. R , 200 3, ‘T he w all and the B all: A study o f D oma in Ref erent s prea dshee t err ors’, E USPRI G Buildi ng better sprea dshe ets f ro m the a d-hoc to t he qua lit y e ngine ere d’, 1-86 166- 199- 1 Janv rin. D and Morr ison. J, 19 96, c ited in : cited in Panko . R, 1998 , ‘What we k now ab out spreads heet err ors’ , Journa l of End U ser Com puting, Spec ial issue: Scal ing up En d Use r De vel opme nt Janv rin. D and Morris on. J, 20 00, ‘Using a struct ured design approach to reduce risks in End User Sp readsheet develo pment’ , Inform ation & m anagem ent, 37, pp 1-12 KPMG, 19 97, c ited in: Panko . R, 199 8, ‘W hat we k now ab out spreads heet er rors’ , Journal of End Use r Com puting, Spe cial issue : Sca ling up End User Dev elopm ent Kruck. S, 1998 , ‘Co gnitiv e Logi cal reas onin g skil l and t he relat ions hip to s prea dshee t data qual ity’ , Comm unications of the Ass ocia tion of Informa tion Sy stems, www.aisn et.org . Michie. D, 1979, ‘ Machine mo dels of perc eptual and i ntellectual sk ills’ , Scientific mod els and man, Herb ert Spence r L ect ures, Oxfo rd Scie nc e Publ ica tions, 0-19 857168-2 Miller.G. A , 1956, ‘The mag ical number sev en, plus or min us two’ , Psycho logical revi ew, 63 , pp 81-9 7. Munro.M , Huff .S, Moore .G, 1987, Exp ansi on and c ontr ol of E nd User Com puting’ , Journa l of mana geme nt inform ation sys tems , Volum e 4, I ssue 3 Panko . R and H alv erson. R, 1997, ‘ Are Two Heads Better than One? (At Re ducing Errors in Spreadsheet Modelling?’ Office Systems Rese arch Jou rnal, 15 ( 1), pp. 21-3 2. Panko . R and H alv erson. R, 1 996, ‘Spre adshe ets on Tri al: A Surv ey of Rese arc h on Spre adshe et Ri sks ’ , Hawaii Intern ational Con ference on System Science s, Maui , Hawaii, Jan. 2-5, 1996 . 326-335 Panko . R an d Spra gue . R, 1998 , ‘H itting the w all: error s i n dev elopi ng and codi ng a simp le spr ea dshee t mode l’ , Decision Sup port Systems, 22 (4) , pp337- 353 Panko . R, 19 98, ‘What we k now about s preadshe et e rror s’ , Journal of End User Com p uting, Special issue: Scaling up End Us er Develo pment Pan ko. R, 2003 , ‘Reducin g overconf idence in spread sheet developmen t’ , EUSPRIG Buildin g bet ter spre adshe ets from t he ad- hoc to the quali ty engine ere d’ , 1-86 166-1 99-1 Teo. T. and Tan. M, 1997, Qu antitative and Qualitative Er rors in Spr eadsheet Develop ment. Proce edings of the Thirt ieth Hawaii Internation al Conferen ce on System S ciences , Maui, Hawa ii.
Original Paper
Loading high-quality paper...
Comments & Academic Discussion
Loading comments...
Leave a Comment